Article

The Role of Tourism Planning in Land-Use/Land-Cover Changes in the Kızkalesi Tourism Destination

1
Department of City and Regional Planning, Mersin University, Mersin 33110, Türkiye
2
Institute of Science, Mersin University, Mersin 33110, Türkiye
*
Author to whom correspondence should be addressed.
Land 2024, 13(2), 151; https://doi.org/10.3390/land13020151
Submission received: 23 November 2023 / Revised: 22 January 2024 / Accepted: 24 January 2024 / Published: 28 January 2024

Abstract

:
Tourism is widely recognised as a significant economic source, especially for small-scale settlements. Nevertheless, tourism may potentially result in adverse effects on the environment. In order to mitigate adverse effects and enhance the advantages, tourism development necessitates a comprehensive planning process. In order to direct and control tourism’s development effectively, it is imperative to ensure that local spatial plans are integrated with national policies and regional strategies. The aim of this article is to investigate the role of tourism planning processes in the spatial development of tourism destinations, specifically by analysing the land-use/land-cover changes along the western coastline of Mersin, with a particular emphasis on the Kızkalesi tourism destination.

1. Tourism, Planning, and Land-Use/Land-Cover Changes

Tourism is commonly defined as a set of activities involving the act of travelling to a specific destination that is separate from one’s permanent place of residence, with the intention of engaging in the consumption of specialised services [1]. In the pursuit of this objective, tourism makes use of various resources available within the destination itself [2]. This consumption process has a direct influence on the economic welfare of the tourism destination. Hence, the tourism sector has drawn significant attention from numerous countries [1], being acknowledged as the foremost contributor to global exports and a crucial source of foreign currency and employment opportunities [3]. Tourism also plays a pivotal role in stimulating the growth of various economic sectors, including agriculture, manufacturing, and commerce. Although tourism can have favourable economic effects, it can also give rise to a range of spatial problems if not adequately planned [1].
Tourism is typically carried out in locales that possess specific attributes, referred to as tourism destinations. The transformation of land use/land cover (LULC) in and around tourism destinations is an inevitable consequence of tourism development [4,5,6,7]. To effectively address these spatial changes, “tourism requires a systematic planning… responsive to market demands, and integrated into the total development pattern of an area” [8] (p. 361). Acknowledging that tourism is a multisectoral activity, it is imperative to implement a comprehensive and integrated planning approach [9] that encompasses various dimensions and operates at different levels to meet development objectives without generating serious socioeconomic and environmental problems. This approach should include the formulation of policies, strategies, and spatial plans in order to maximise the advantages and minimise the adverse effects on the spatial environment associated with tourism development.
Tourism planning occurs at various levels within the planning hierarchy, at the national, regional, and local levels [8]. At the national level, tourism planning is concerned with the formulation of tourism development policies and means of implementation on a financial and legal basis. Being more specific than the national level, the regional level focuses on strategies specific to the region, identifying major tourism destinations and routes, transportation networks, and types of spatial development and infrastructure required for tourism. Tourism policies and strategies are mainly institutional elements of the planning process [8]; however, tourism policies and strategies are realised in specific localities, so they have a spatial character [10]. Therefore, policies and strategies, once determined at the national or regional level, should be accompanied by coherent spatial plans at the local level [11]. Spatial planning in tourism destinations converts policies and strategies into spatial decisions with a top–down planning approach [10], by serving as an operational tool for fostering the harmonious integration of tourism with other sectors and establishing spatial connections between different tourism facilities within a certain locality [12]. In other words, spatial planning produces the structure of tourism’s development in a locality, through which the important planning issues are covered, such as the location of tourism accommodation facilities, the accessibility and locations of major transport interchanges, the definition of design standards and building rights for the quality of the built environment, and the determination of tourism attractions, while considering the impacts of tourism development on traffic flow, local architectural styles, and important natural and cultural sites [10]. Considering that spatial planning plays an important role in tourism development, the lack or inefficiency of spatial planning for tourism destinations may result in two main negative outcomes: First, it becomes difficult to spatially organise tourism facilities and services such as accommodation, restaurants, transportation, and infrastructure, which are included and defined in local spatial plans [8,11]. The second issue is the dubiousness of achieving interventions for the public interest and environmental benefit, due to the dominance of private sector entrepreneurship in the tourism sector.
Overall, tourism ought to be incorporated into the overarching development policy, strategy, and planning of a specific locality, constituting a component of its comprehensive and integrated planning. This article argues that the lack of a comprehensive and integrated approach at different levels of tourism planning, especially the lack or inefficiency of local spatial plans to support and direct national policies and regional strategies during the process of tourism development in a particular locality, may lead to permanent issues pertaining to spatial organisation, preservation of natural and cultural resources, and the provision of social and technical infrastructure. This argument will be evaluated through an actual case study.
Türkiye possesses a multitude of natural and cultural assets that present several opportunities for the development of the tourism sector. Since the 1980s, the government has implemented regulations and incentives to support tourism’s development as a significant economic sector, in accordance with national policies. The initiation of tourism development in the Kızkalesi settlement, located in Mersin, Türkiye, can be traced back to the 1970s, yet it was accelerated in the 1980s by the construction of tourism accommodation facilities, including hotels, pensions, and summer houses, in alignment with the national policies, and it received further assistance from regional strategies. In 1994, there were 67 tourism accommodation establishments, as well as 856 summer houses [13], which has rapidly increased to 104 tourism accommodation establishments and 1814 summer houses, as recorded by the Kızkalesi Culture and Tourism Association in the year 2021. This increase in tourism accommodation facilities within three decades demonstrates that the destination has the capacity to accommodate hundreds of thousands of tourists and temporary residents during the summer months. Obviously, it is inevitable that this increase in tourism accommodation facilities will result in changes in the built-up environment of the settlement.
Kızkalesi has long been an important tourist attraction, owing to its distinctive natural and cultural resources. Various policies, strategies, and spatial plans at different scales have been effective in directing and controlling the development of tourism along the western coastline and in Kızkalesi. Under the influence of initial national policies and regional strategies during the 1980s, Kızkalesi has turned into one of the most important tourism destinations on the western coastline of Mersin. Local spatial plans have been introduced and implemented to direct and control the spatial dimension of tourism development in the settlement since the beginning of the 2000s. However, the settlement has encountered specific problems as a result of the rapid growth of tourism, “…such as the pressure for development while the settlement is surrounded by natural and cultural conservation areas, huge population increase during tourism season that creates carrying capacity and management problems, difficulties in accessibility from distant locations…” [14] (p. 30). This article asserts that the aforementioned problems mostly arose as a result of the inadequacy of the tourism planning process to direct and control the spatial dimension of tourism development.
In order to explore this assertion, the primary concern of this article is to evaluate the role of the tourism planning process in directing and controlling the spatiotemporal development of Kızkalesi as a tourism destination on the western coastline of Mersin between the years 1984 and 2022. In response to this primary concern, this article first analyses the LULC changes both along the western coastline and in Kızkalesi, and then it examines the tourism planning process regarding the case study area, including national policies, regional strategies, and local spatial plans, before finally discussing whether the tourism planning process has been effective in directing and controlling the LULC changes.
The LULC changes were analysed through the use of visual materials, including satellite images and aerial photographs. This research employed remote sensing technologies and geographic information systems to monitor and assess the LULC changes in Kızkalesi. The process of image classification was conducted using open-source platform and software, namely, Google Earth Engine and QGIS 3.28 Firenze. The utilisation of image classification techniques served the objective of accurately analysing and comprehending the spatiotemporal changes in LULC patterns. The statistical outcomes of the image classification were subsequently subjected to critical evaluation by taking the tourism planning process into account.

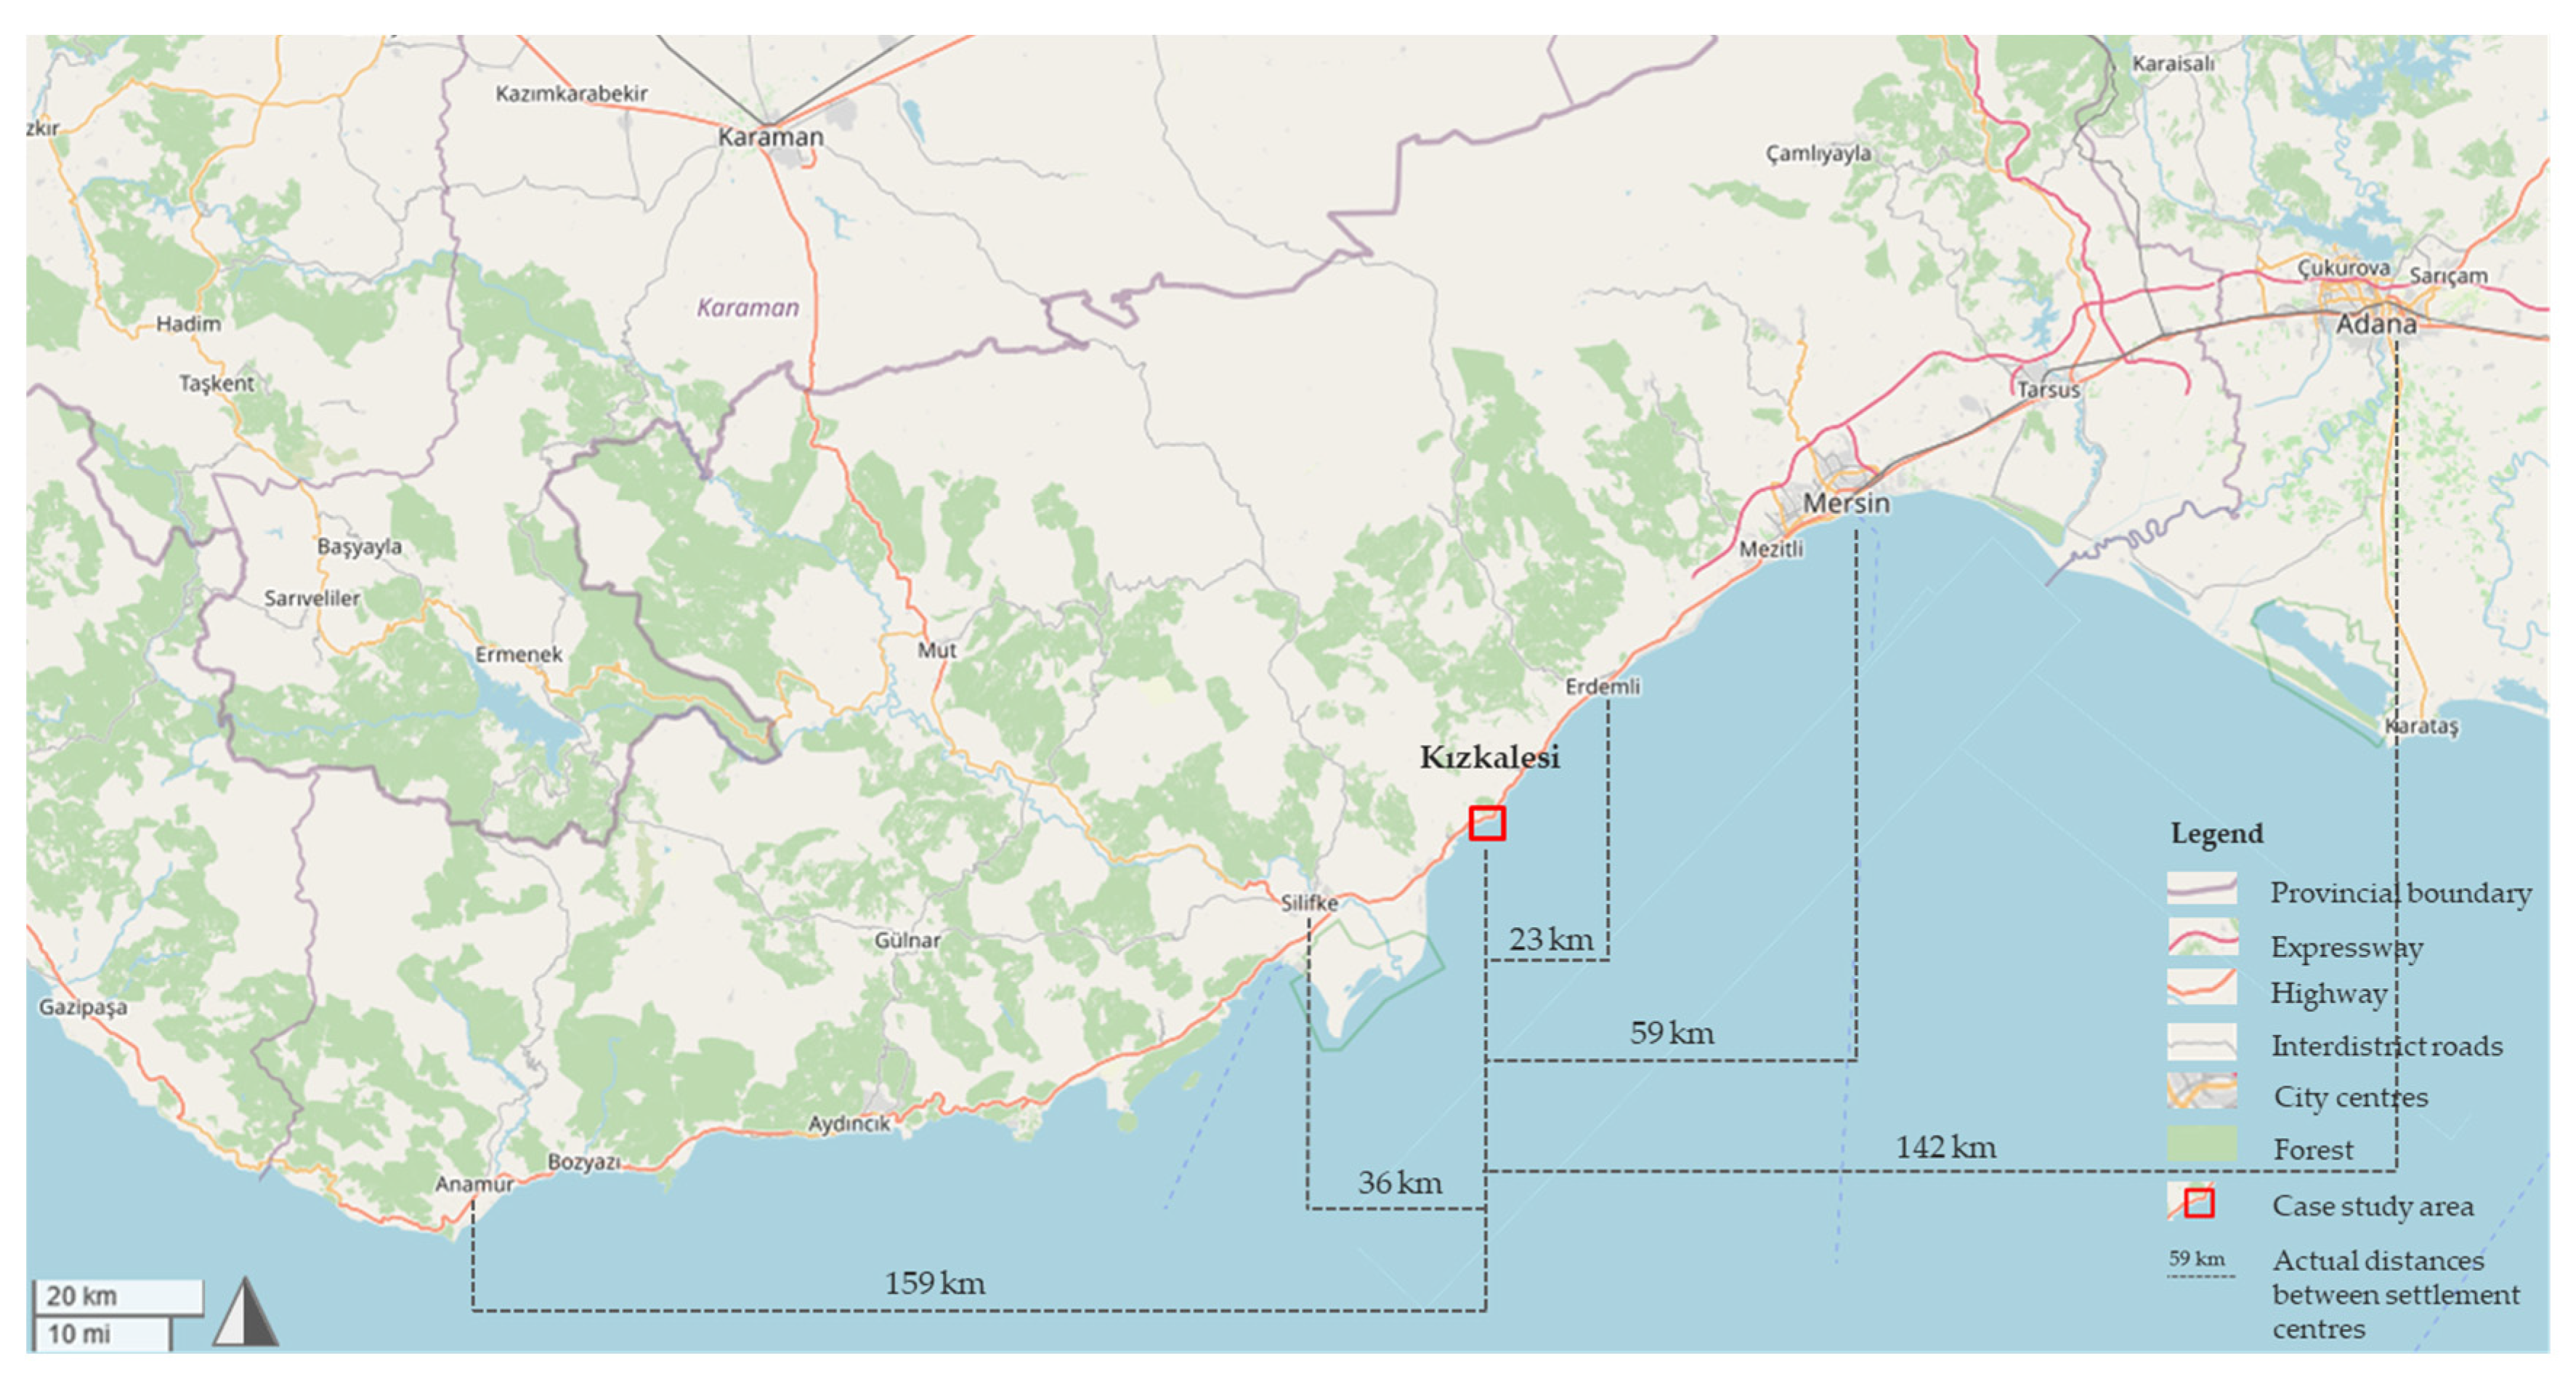
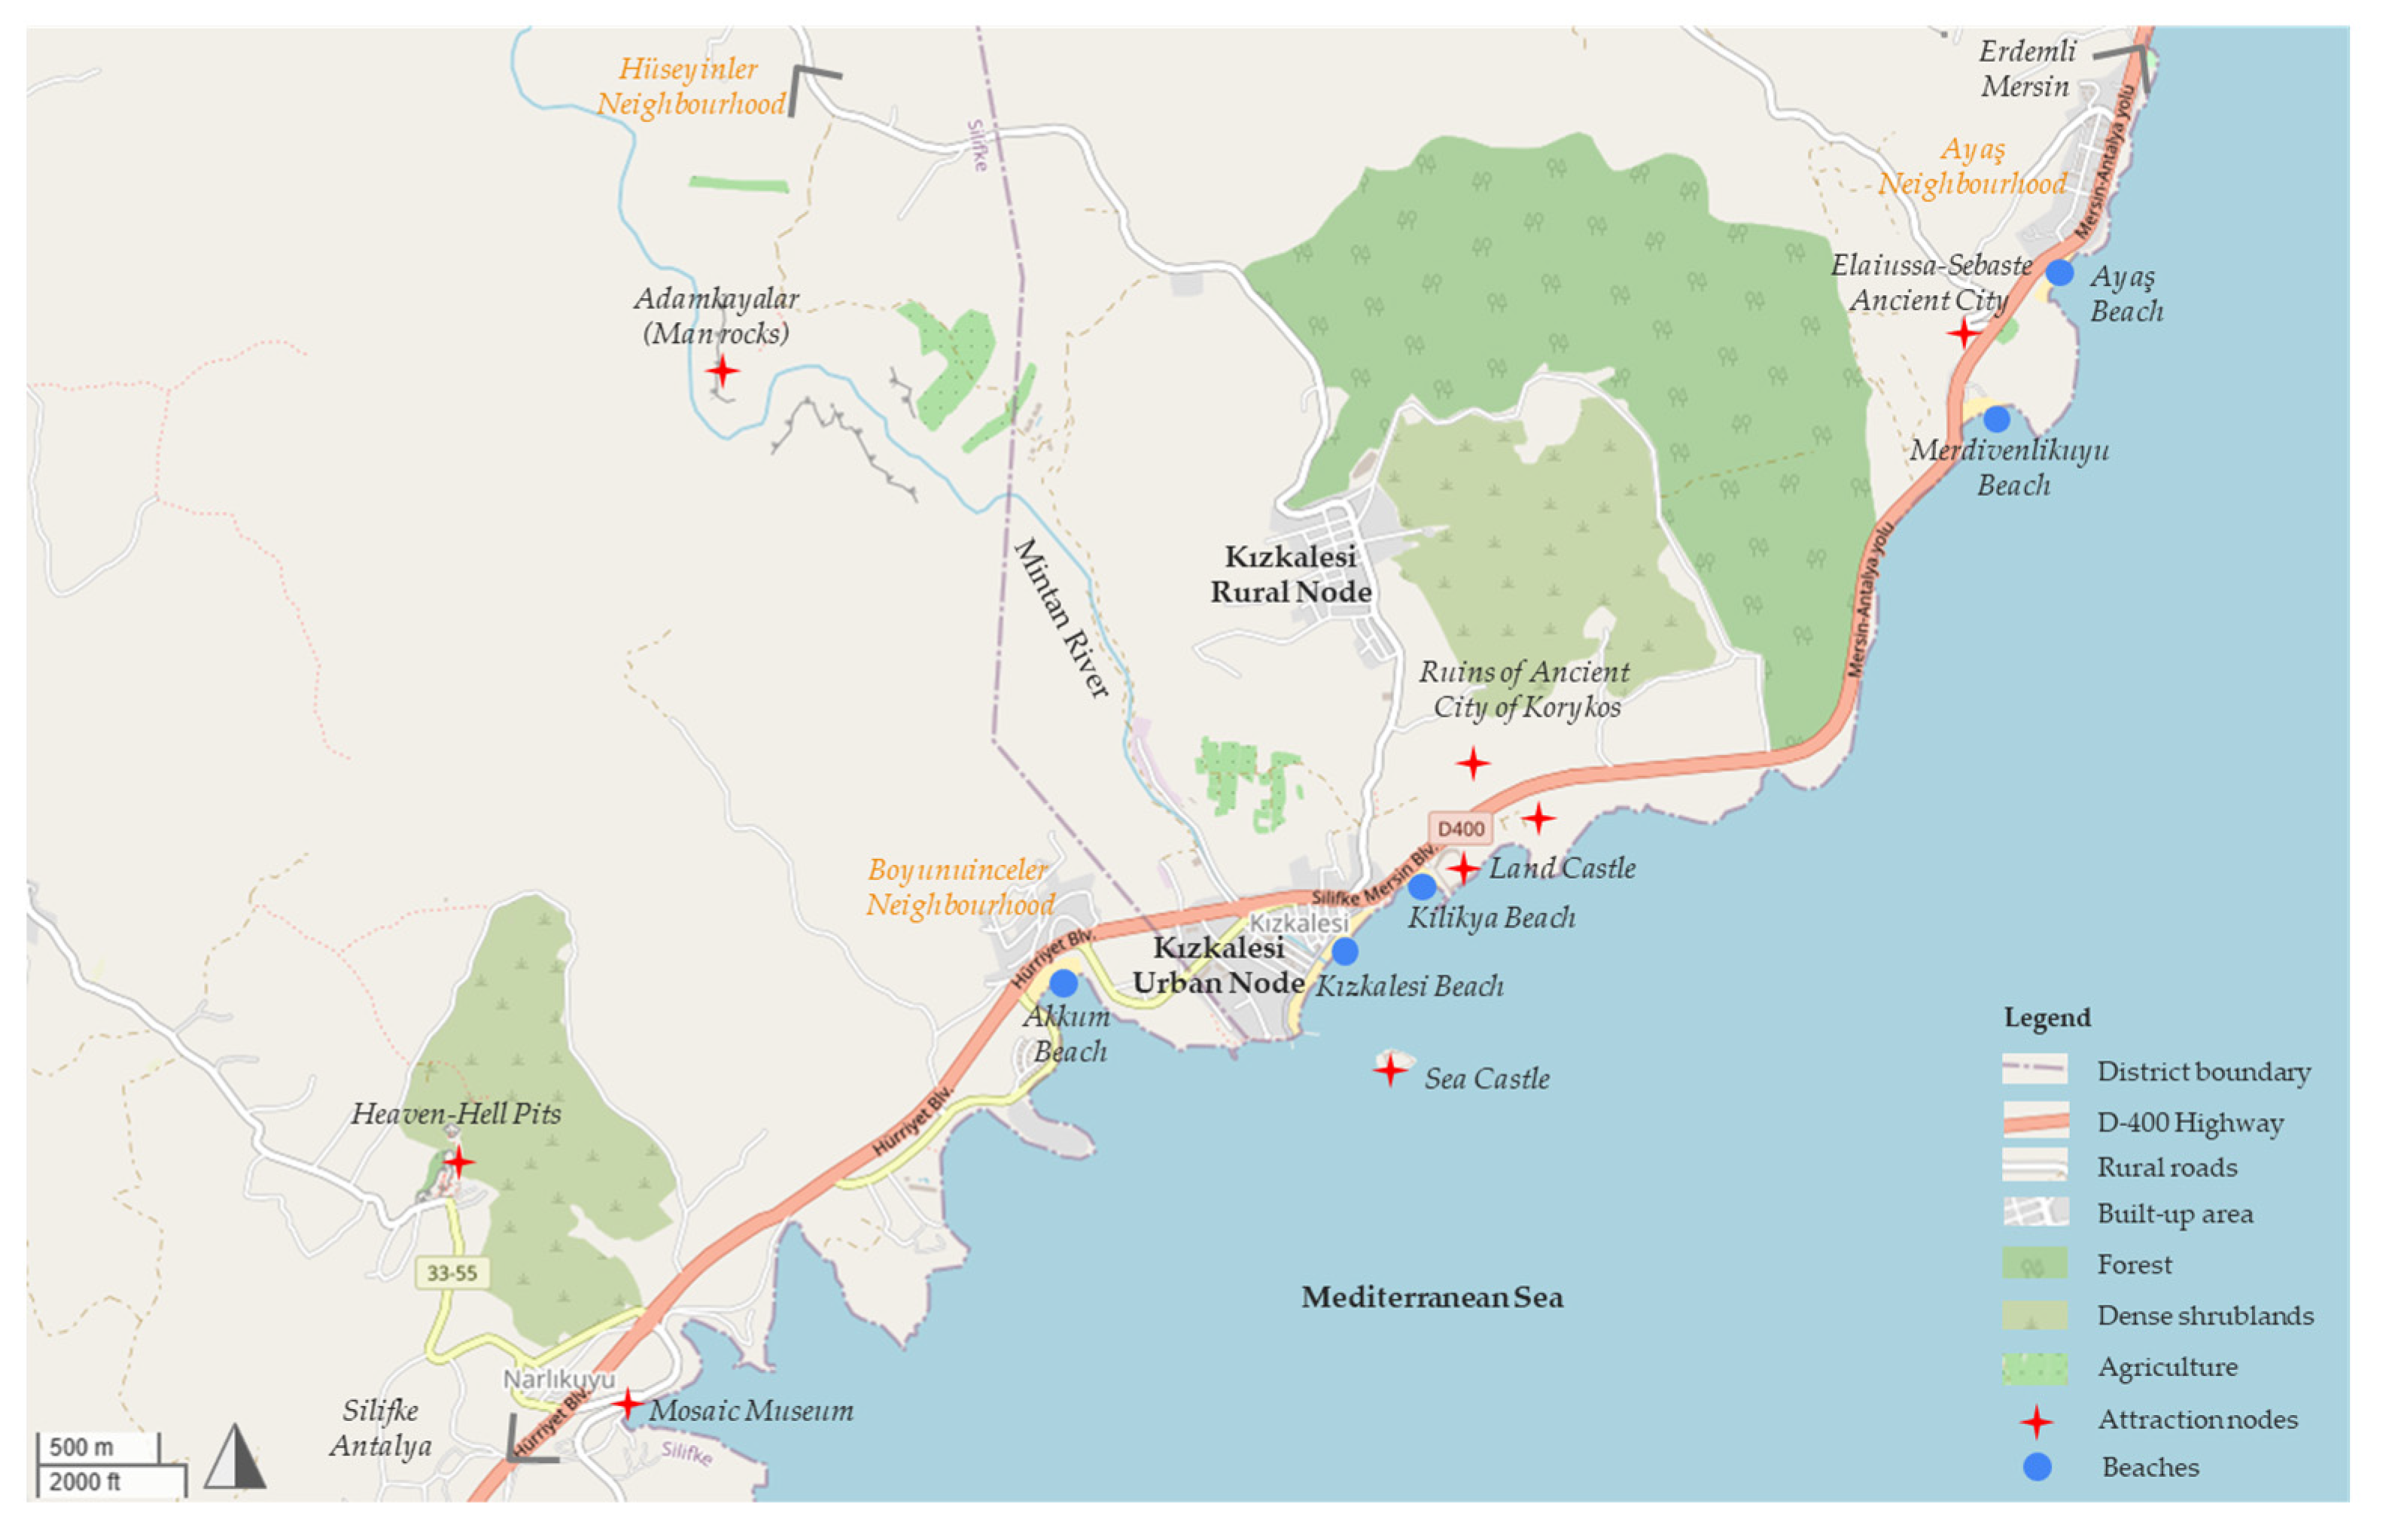
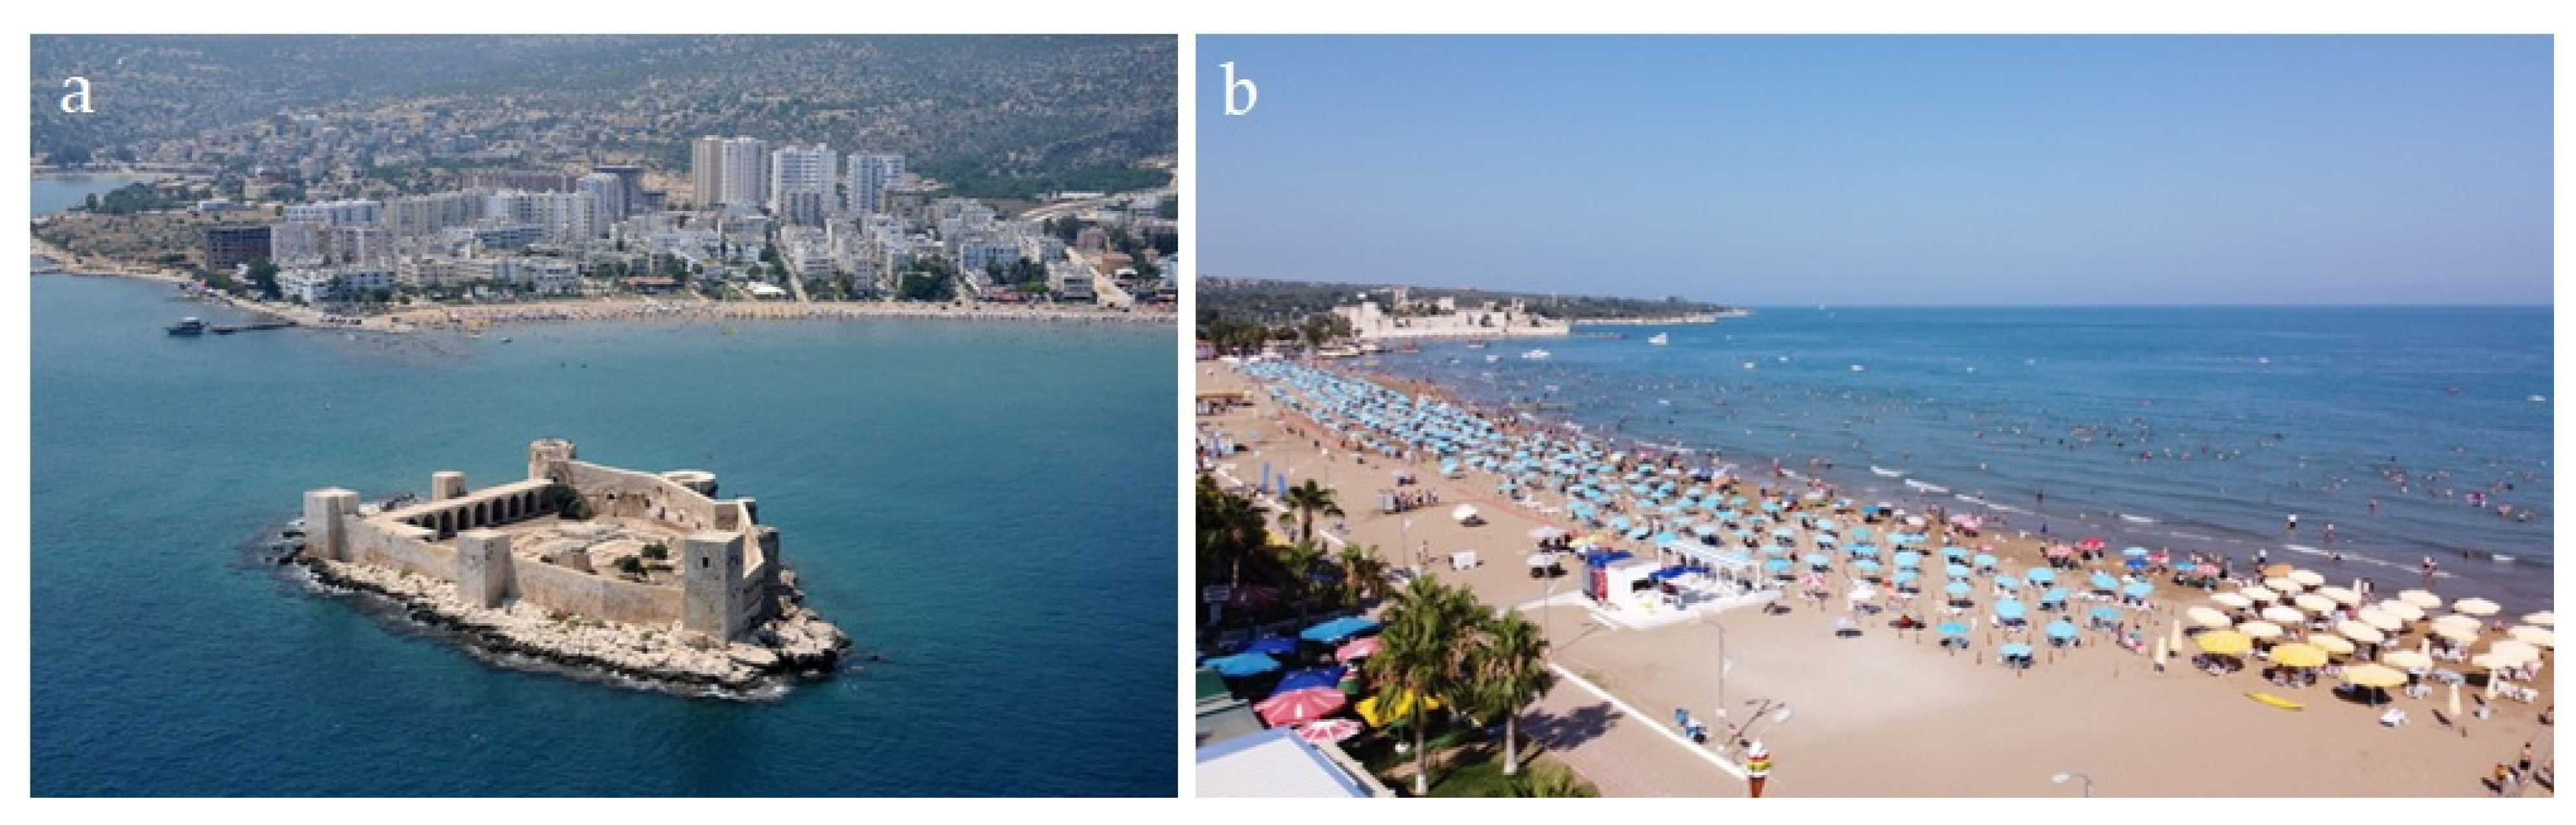
2. Kızkalesi as a Tourism Destination

Kızkalesi is situated along the Mediterranean coastline of Türkiye (36°27′35.43″ K, 34°8′38.96″ D). Kızkalesi is a neighbourhood of the Erdemli district, which is linked to various city centres through the Mersin–Antalya interregional highway, officially known as the D-400 Highway (Figure 1). Encompassing a significant archaeological site known as the ancient city of Korykos, which has been included in the World Heritage Tentative List of Türkiye since 2014 [15], and having a long sandy beach with a Blue Flag designation, Kızkalesi is one of the most important tourism destinations on the western coastline of Mersin. Kızkalesi is populated by 1781 residents as of the year 2022. The summer population of the neighbourhood experiences a significant rise, reaching roughly 40,000 people, consisting of domestic tourists for short- and medium-term visits, as well as an additional influx of up to 100,000 daily visitors during weekends [16].
The administrative boundary of the Kızkalesi neighbourhood is delineated by the Boynuinceli neighbourhood to the west, the Ayaş neighbourhood to the east, the Hüseyinler neighbourhood to the north, and the Mediterranean Sea to the south (Figure 2). Kızkalesi exhibits a close interconnection with its adjoining neighbourhood, Boynuinceli, in terms of the influx of tourists and the continuity of the settlement system. The overall area of the neighbourhood measures 2015 hectares, yet not all of this area is inhabited. Within the confines of the Kızkalesi neighbourhood, two distinct settlement nodes can be identified: Including mostly tourism accommodation facilities and commercial activities, the first is the urban node, situated in the southern part and divided by the D-400 Highway, which covers approximately 35 hectares. The second is the village as the rural node, located in the northern part of the settlement, which covers approximately 26 hectares. In addition, there are dispersed rural residential units, farms, and agricultural fields along the village roads that extend in the northern direction.
The settlement’s proximity to nearby centres, favourable climatic conditions, the presence of a lengthy sandy beach with a Blue Flag designation, and the existence of ancient ruins in and around the neighbourhood have contributed to attracting tourism activities (Figure 2 and Figure 3). Thus, the primary economic activity within the neighbourhood is centred around tourism, which spans a duration of around six months annually, commencing in May and concluding in October. The tourism activities reach their peak in the off-school period between mid-June and the end of August. The majority of the tourism accommodation establishments, including hotels, motels, and pensions, are run by employers from other settlements. Most of the tourism employees can be considered to be seasonal workers coming from nearby settlements to Kızkalesi for job opportunities. Apart from tourism accommodation establishments, the settlement includes summer houses, mostly in the form of apartment blocks 3–14 storeys in height, used by temporary residents during the summer months. The local community mainly engages in agricultural activities all year round, primarily focusing on vegetable cultivation. While the residents of the neighbourhood are mostly employed in agricultural and husbandry activities throughout the year, they also make significant contributions to tourism activities during the peak season by working as employees in the tourism sector or hiring their residential units to tourists for short- or medium-term stays.
The tourism activities in Kızkalesi had become daily visits by the 1970s. During the 1980s, the settlement experienced the construction of initial summer houses owned by residents of nearby settlements, along with tourism investments such as hotels and pensions. As stated by Koca and Şahin, in the year 1994, the tourism accommodation facilities in Kızkalesi consisted of 9 hotels, with a total capacity of 615 beds, 18 motels, with a capacity of 430 beds, 38 pensions, with a capacity of 1740 beds, and 2 camping areas, with a capacity of 200 beds [13]. Additionally, there were 856 summer houses available for temporary residents such as tourists. The combined bed capacity, including summer houses, in 1994 amounted approximately to 6400. These establishments collectively hosted an estimated 29,800 foreign tourists and 146,000 domestic tourists, resulting in a total of 175,800 tourists for the year 1994 [13]. According to Koca and Şahin’s prediction, the total number of visitors during the summer season in 1994, including daily visitors, amounted to 800,000 individuals [13].
The tourism accommodation capacity of the settlement has undergone development since then (Table 1). According to the Kızkalesi Culture and Tourism Association, as of the year 2021, the neighbourhood had a total of 104 tourism accommodation establishments, offering a combined capacity of 4750 beds. In addition, during the past three decades, a significant number of private residences have been constructed in Kızkalesi, with the purpose of serving as summer houses. Consequently, this tourism destination possesses the capability to host a substantial number of tourists and temporary residents, reaching into the hundreds of thousands, specifically during the peak seasons.

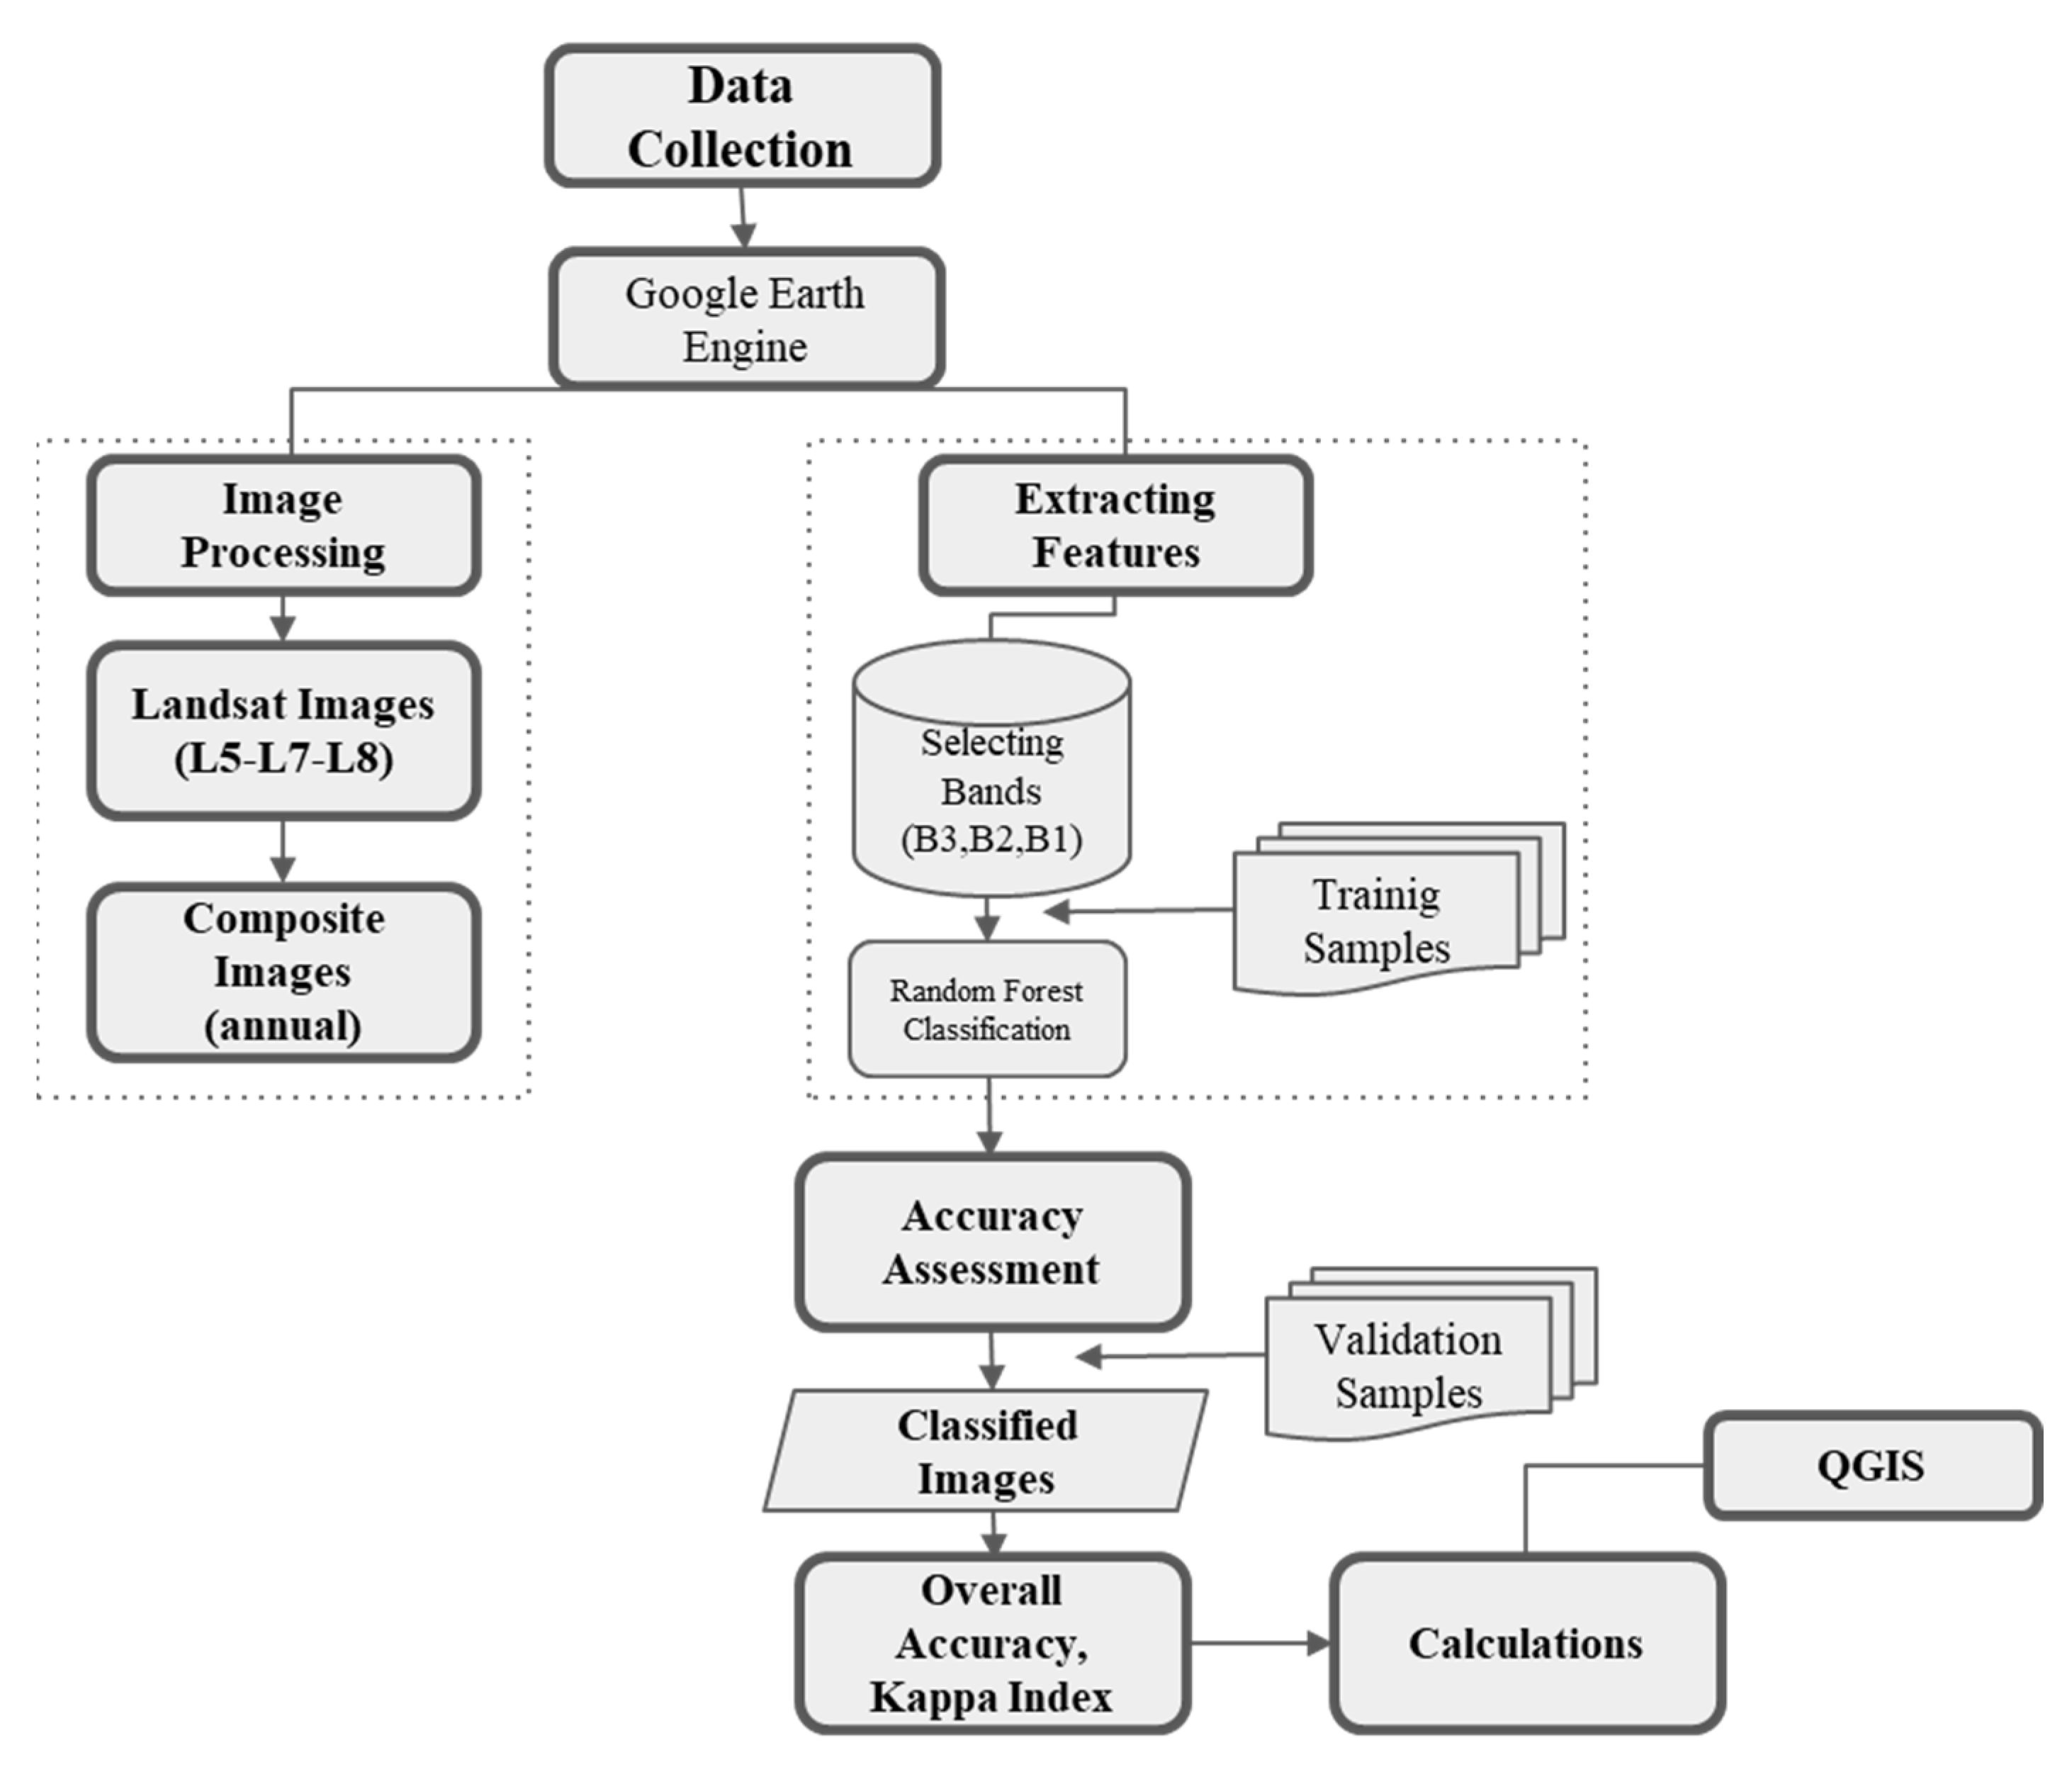
3. Research Methodology

All human activities, particularly those related to development, have both direct and indirect impacts on the environment. Several studies have been conducted to assess the overall environmental impacts of LULC changes [17,18,19]. Additionally, there is a wide range of research that specifically examines the impacts of LULC changes on specific topics, such as water resources [20,21,22], natural hazards [23,24], and forest areas [25,26,27].
Tourism is a significant catalyst that alters the environment [28]. The study of tourism development, as a significant human activity that also has direct and indirect impacts on LULC changes, has been the subject of investigation by several researchers. Saha and Paul conducted an evaluation of the LULC changes resulting from tourism activities in West Bengal, India during the period from 2009 to 2019 [7]. This evaluation was carried out through the use of satellite images. The study conducted by Boori and colleagues investigated the impact of tourism development on land-cover changes in the Jeseníky region [6]. This analysis was based on the use of Landsat satellite images captured in 1991, 2001, and 2013. Aji and Faniza’s study looked at how the southern ring road has affected the land-cover changes in the Pacitan Regency region’s tourist areas [4]. The authors utilised Landsat satellite images from 2008 and 2020 to conduct their analysis.
The aforementioned studies, which specifically investigated the impacts of tourism development on LULC changes, have reached the consensus that notable alterations have been detected in the areas surrounding the examined tourism destinations. In addition to this general consensus about the relationship between tourism and LULC changes, the study undertaken by Atik and colleagues reached the conclusion that “tourism is one of the major driving forces behind land use and landscape changes in the coastal Mediterranean” [5] (p. 21) by examining the effects of coastal tourism development on land-use changes in the Turkish Mediterranean region. The research conducted by Oral in 2002, evaluating the LULC changes on the coastline of Erdemli and Kızkalesi between the years 1982 and 2001, also affirmed that tourism is one of the catalysts behind land-use changes [29]. Utilising remote sensing and geographical information systems, this initial research focusing on Kızkalesi concluded that there has been an increase in agricultural activities and the built-up area, in line with the expansion of summer houses, while there has been a recognisable decrease in the natural vegetation.
The research methodology in this study is designed to evaluate the LULC changes in Kızkalesi by employing remote sensing techniques. Additionally, this study attempts to analyse the influence of the tourism planning process on the detected LULC changes. The utilisation of remote sensing (RS) and geographic information systems (GISs) is a common practice for the purpose of monitoring LULC changes and establishing a significant study domain in this context. By employing this analytical methodology, which serves as the fundamental framework for numerous research endeavours, historical datasets can be proficiently utilised, thereby facilitating the generation of future forecasts. Various platforms and programmes were utilised for conducting the LULC change analysis. There exist both commercial and open-source software applications for this methodology, which are specifically designed to be compatible with GISs. This research utilised cloud-based Google Earth Engine platform and the open-source QGIS 3.28 Firenze software to investigate the LULC changes along the western coastline of Mersin and in Kızkalesi (Figure 4).
This study utilised annual composite images by employing a temporal aggregation method, specifically using the metrics as medians, derived from time-series images [30]. Composite images were derived from cloud-free Landsat satellite images with a spatial resolution of 30 m and RGB bands, covering the years 1984, 1994, 2004, 2011, and 2022 (Table 2). The selection of these specific years was based on a comprehensive analysis of tourism-related national policies, regional strategies, and local spatial plans that are relevant to the case study area, aligning with the overall objective of this research. In the context of image classification, four distinct land classes were identified: artificial surface, representing built-up areas like buildings and roads; vegetation, encompassing rough terrain, sparsely vegetated shrubland, agricultural fields (including both seasonal and permanent crops), meadows, and greenhouses; forest, consisting of dense thickets of shrubs, broadleaved trees, and coniferous trees; and water surface, pertaining to river basins and the sea.
Aiming to find the most accurate measures, training and testing points used for image classification analysis in the literature were examined. There have been studies using 70% training/30% testing [31,32,33] or 60% training/40% testing [34,35], and unlike these predetermined rates, there have also been studies determining training–testing rates without specifying actual ratios [36,37,38,39]. A set of 25 training and 10 test data points were selected for each class value in every image, resulting in a total of 175 data points used for the purpose of image classification, which gave the highest classification accuracy after testing frequently used predetermined ratios in the abovementioned studies.
The random forest (RF) classification algorithm, which has been widely employed in the academic literature [30,40,41,42], was utilised to determine accuracy values over the course of several years, yielding favourable outcomes. The obtained validation results exhibited a satisfactory level of accuracy, making them suitable for subsequent studies (Table 2).
The spatiotemporal analysis of LULC changes was performed on two spatial scales, considering four consecutive study periods between the years 1984 and 2022. The first scale encompassed the western coastline of Mersin, with a particular emphasis on the Kızkalesi settlement located in the middle. The second scale specifically focused on the Kızkalesi, with a circular radius of 1 kilometre. Based on the LULC classification data, maps reflecting the spatial distribution of the LULC categories in the corresponding years were produced, and the statistical tables of the categories were prepared to analyse the quantitative characteristics of the LULC changes.
This study adopted the LULC transfer matrix, annual rate of change, single dynamics index, weighted centre-of-gravity movement analysis, and annual expansion intensity index to measure the spatial and temporal characteristics of LULC changes, both along the western coastline of Mersin and in Kızkalesi.

3.1. LULC Transfer Matrix

The transfer matrix is a quantitative tool that “…provides essential information about the nature and spatial distribution of land use changes” [43] (p.6). By describing the dynamic process of mutual transformation between different land classes at the beginning and end of the study period, the matrix shows the transferred-in (gain) and transferred-out (loss) information for each land class [44,45].
To analyse the amount and structural attributes of LULC changes in the study area, a transfer matrices were generated by using LULC image classification data for four study periods, spanning from 1984 to 2022. This analysis specifically examined the quantity and structural characteristics of LULC changes over a 38-year period from 1984 to 2022. The transfer matrices facilitated the identification of the primary types of changes and their respective directions within the study area, as well as the representation of the gains and losses for each land class.

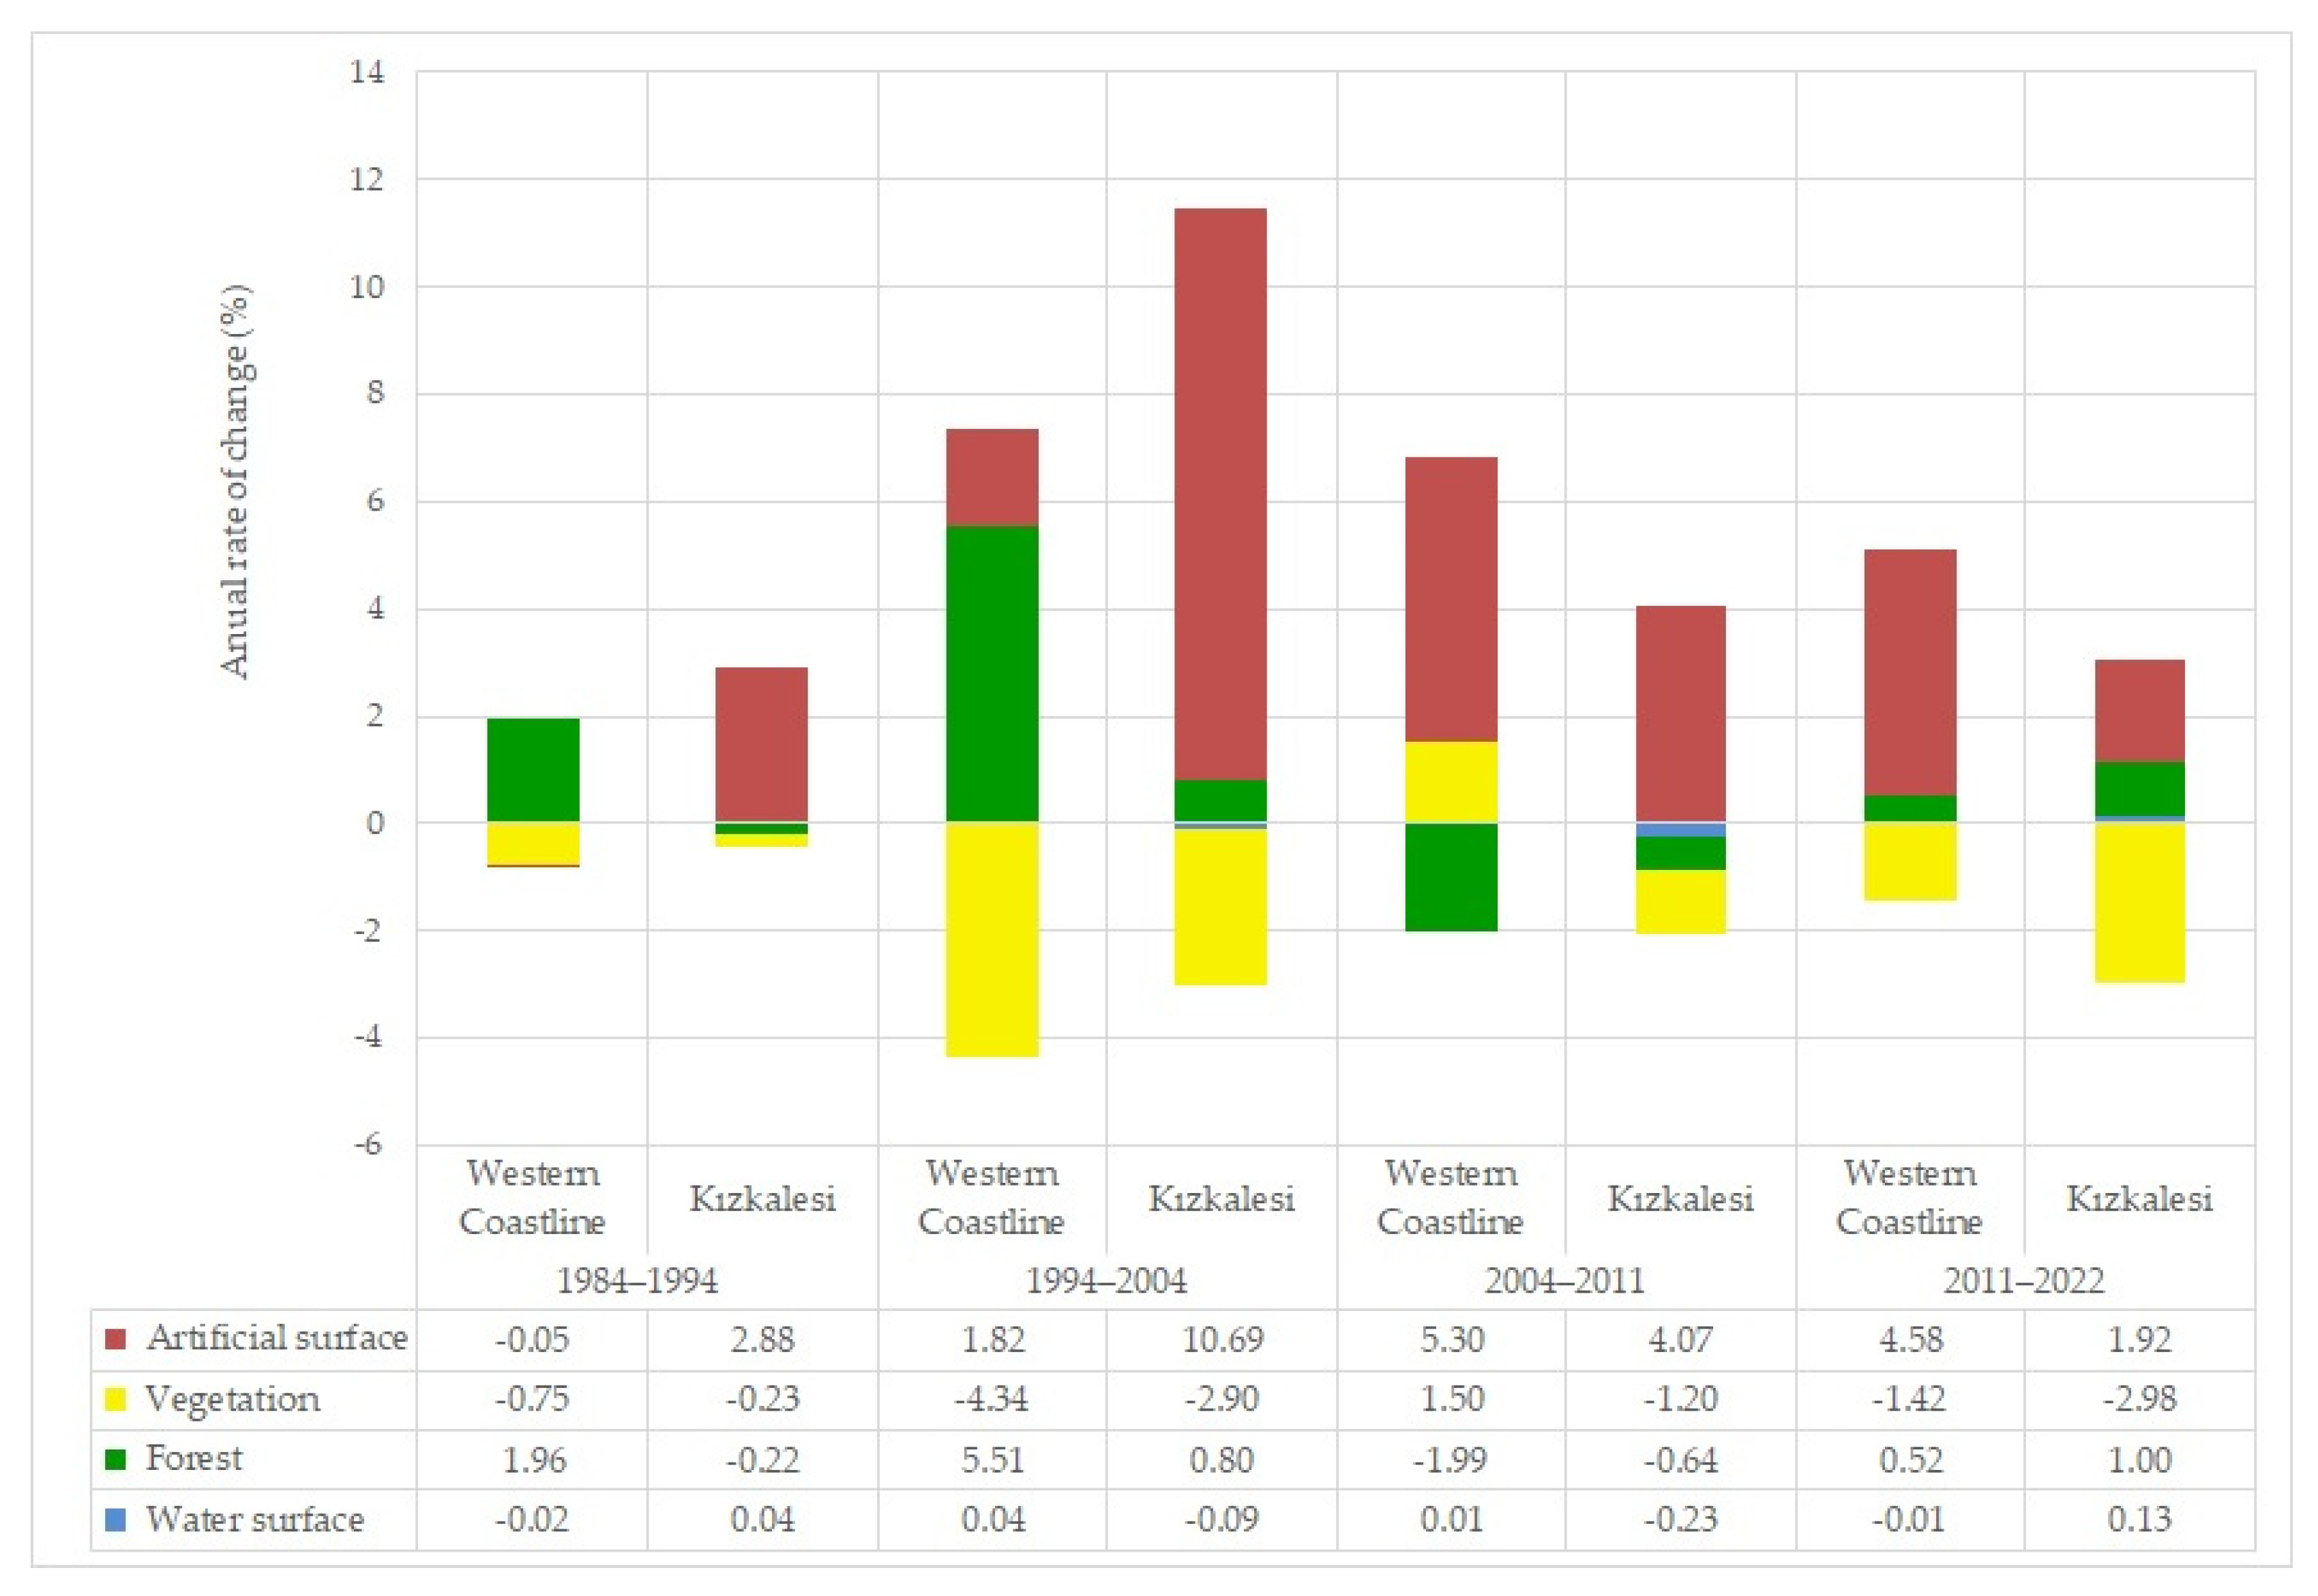
3.2. Annual Rate of Change

The annual rate of change is a statistical term that measures the rate at which each land class expands or declines over a specific number of years. The annual rate of change serves as a reference point for comparing LULC, regardless of variations in the time periods [46]. The formula for calculating the annual rate of change, as demonstrated by Batar and colleagues [43], is as follows;
r = 1 t 2 t 1 × l n A 2 A 1
where r represents the change for each class per year, A 1 and A 2 are the area of land class A at the beginning and the end of the period being evaluated, respectively, and t is the number of years over which the evaluation takes place.

3.3. Single Dynamics Index

The annual rate of change measures the LULC changes based solely on the absolute volume. On the other hand, the dynamic degree of change incorporates the initial area in the calculation of the annual rate of change, allowing the results to reflect the relative rate of dynamic change [47]. This index quantitatively describes the speed and intensity of change [47] or, in simpler terms, the dynamism of each class [44,48,49]. This study utilised the single dynamics index to assess different LULC categories and identify the most dynamic category [50]. The single dynamics index is determined using the following formula:
K = A 2 A 1 A 1 × 1 t 2 t 1 × 100 %
where K represents the rate of LULC change, A 1 and A 2 are the area of land class A at the beginning and the end of the period being evaluated, respectively, and t is the number of years over which the evaluation takes place.

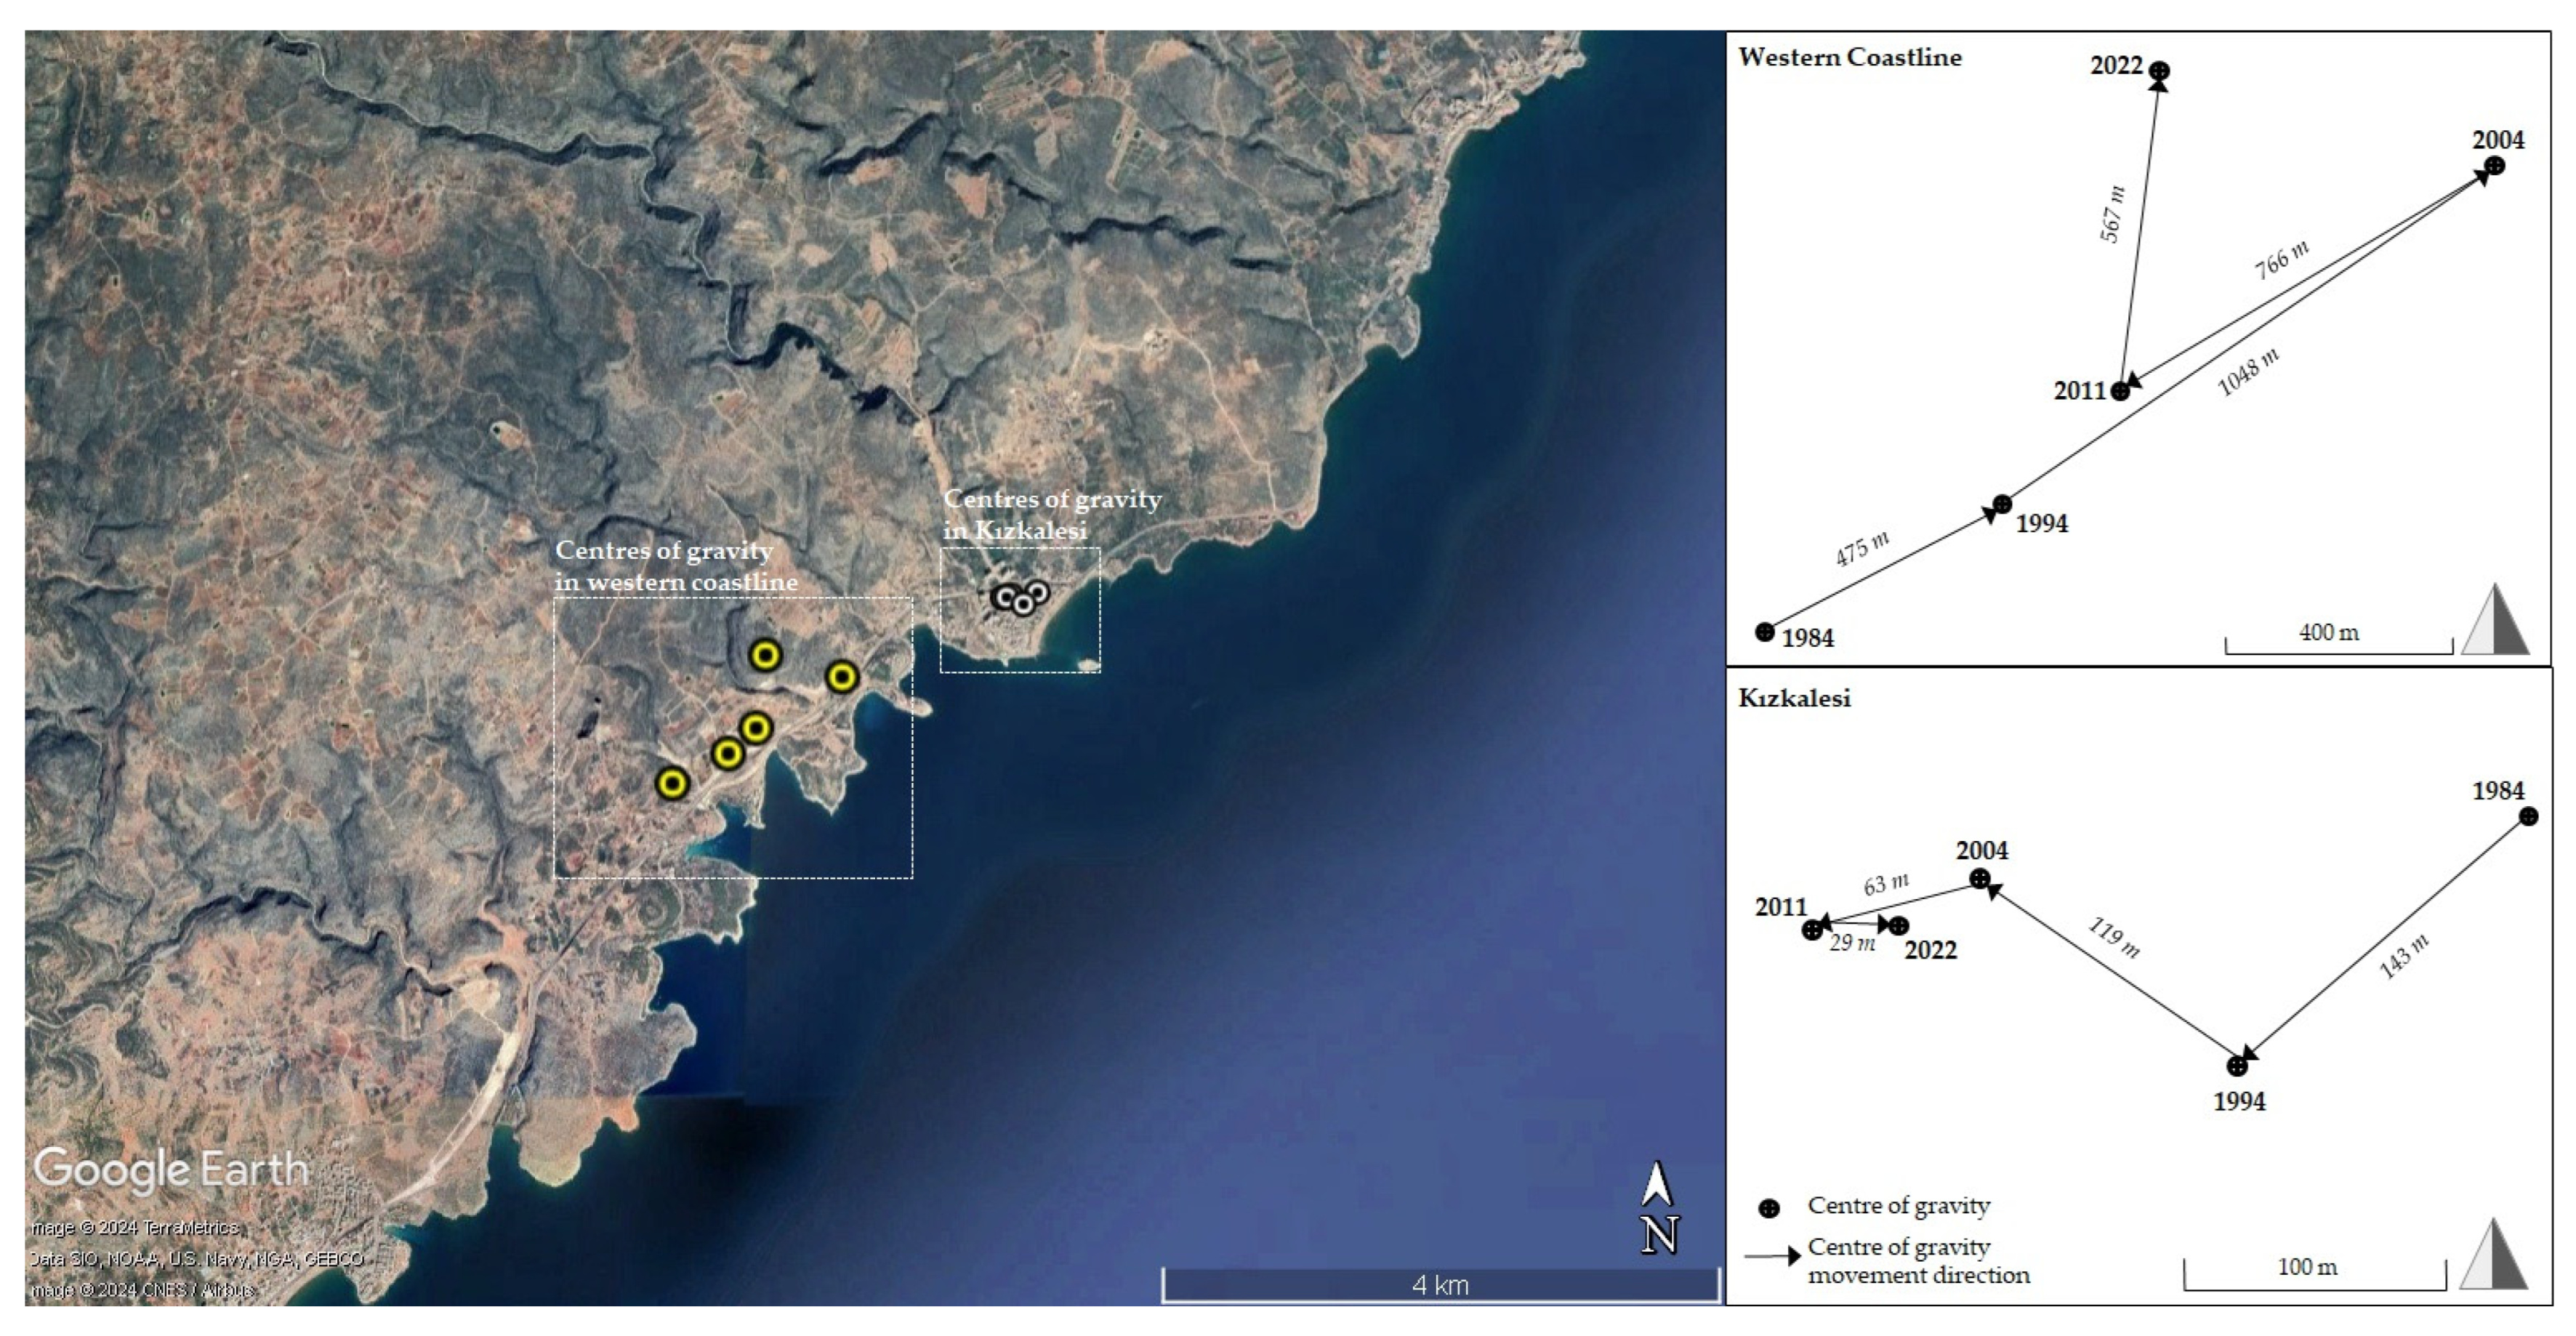
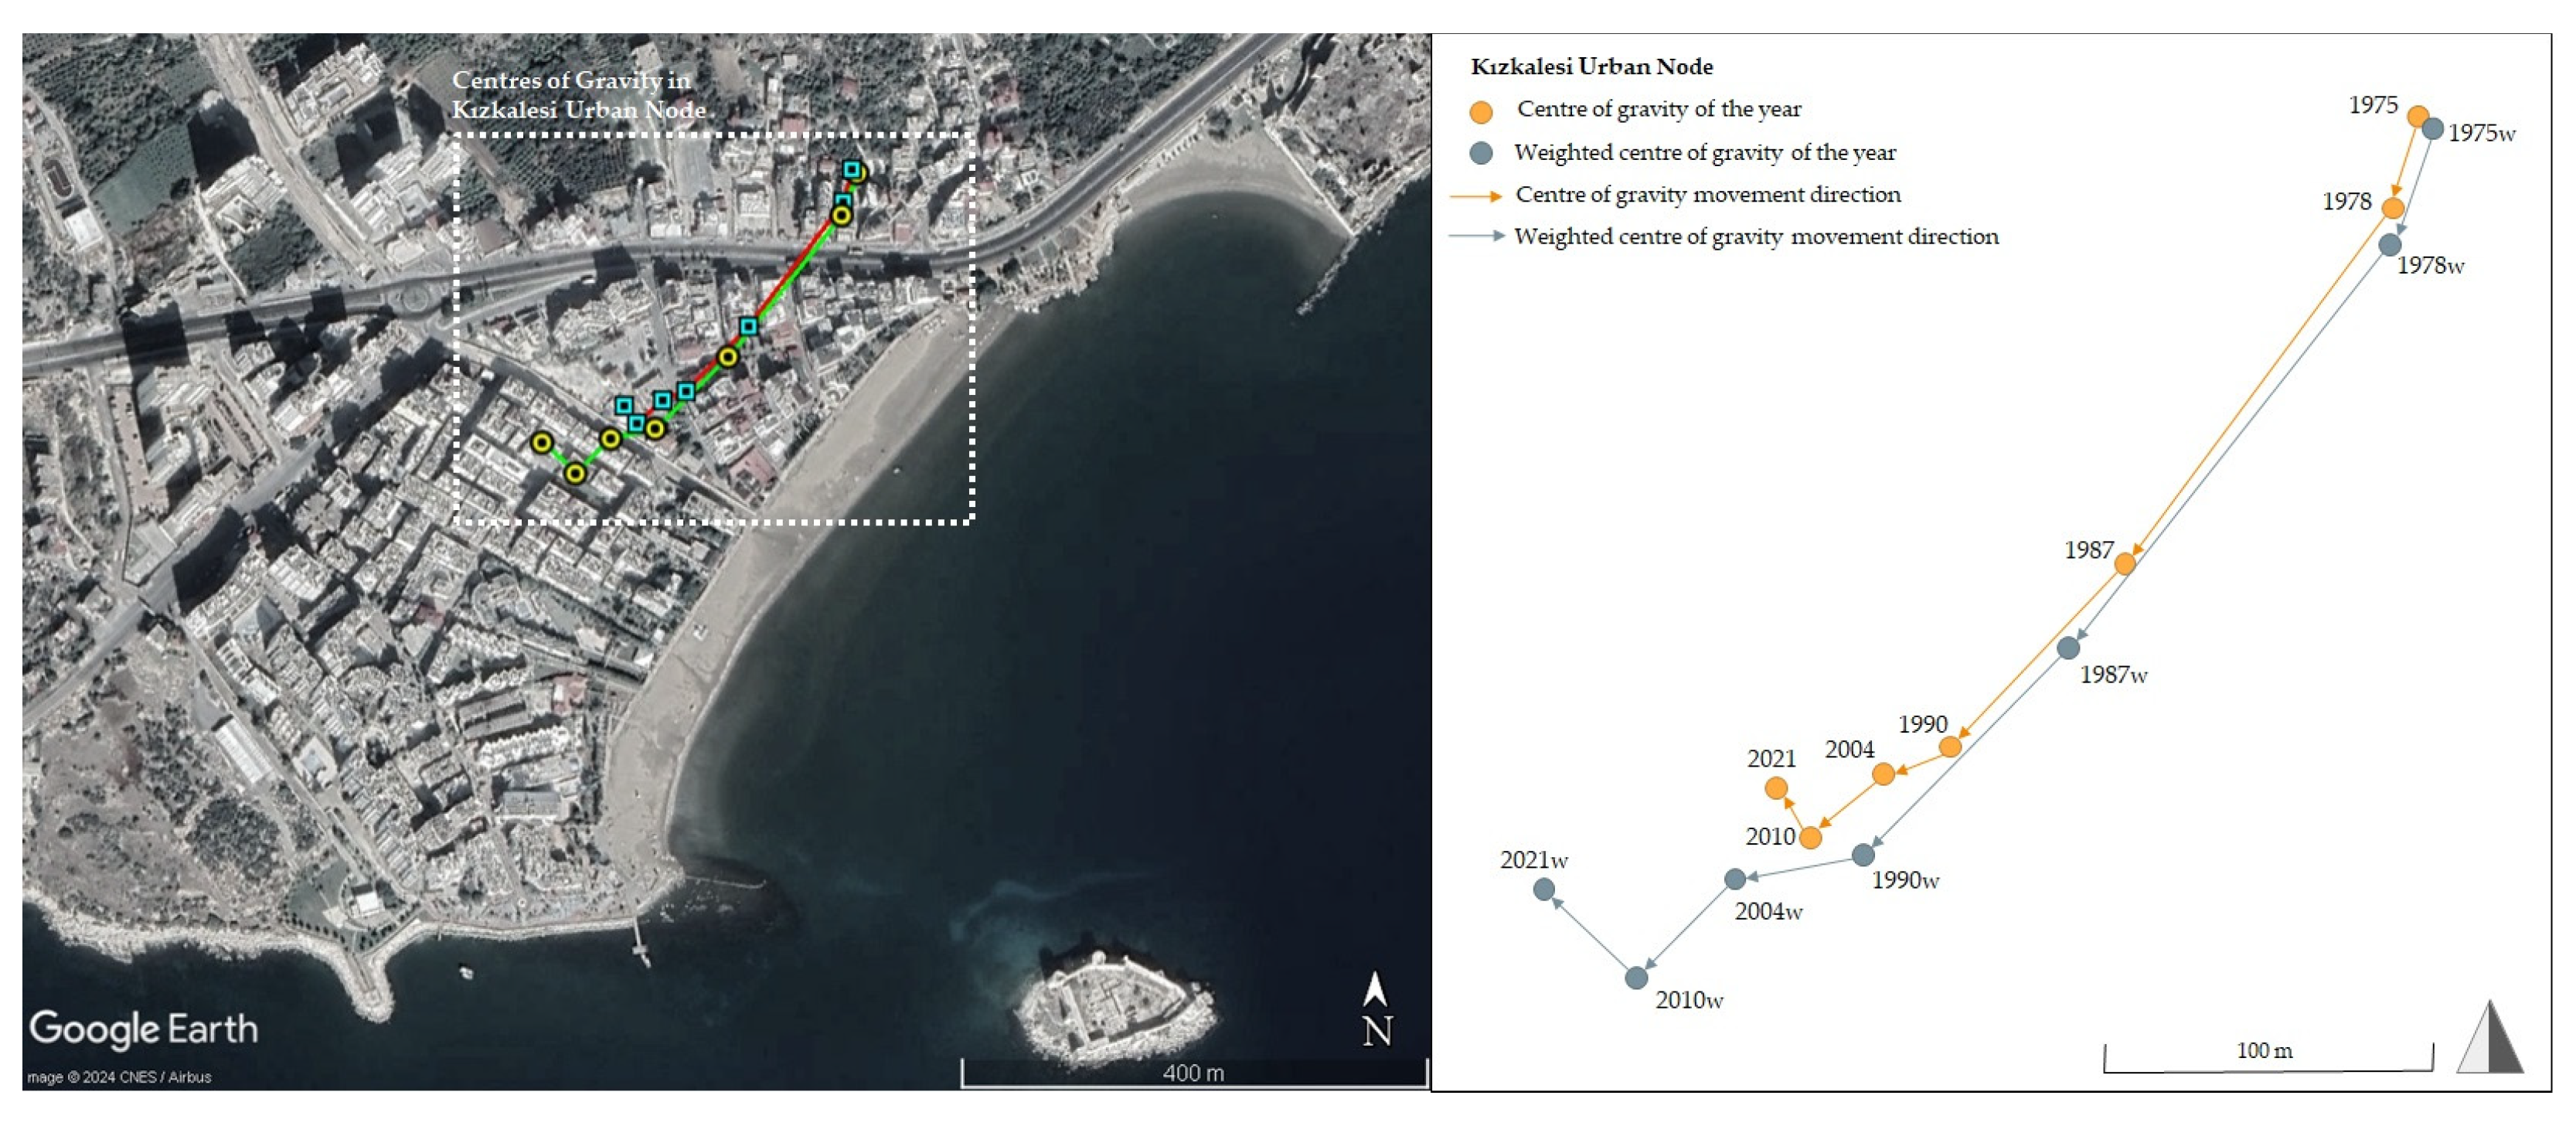
3.4. Weighted Centre-of-Gravity Movement

Derived from the geographic concepts of the population centre of gravity and the economic centre of gravity [51], the weighted centre-of-gravity movement analysis of land classes can be used to identify spatial patterns or movements in LULC changes within the study area [51,52], or to compare the distributions of different land categories over a specific time period [44]. According to the formula provided by Chen and colleagues [51], if a certain land class in the study area consists of i patches, the coordinates of the centre of gravity ( X t for the longitude and Y t for the latitude) of this land class in year t are as follows:
X t = i = 1 n ( A t i × X i ) i = 1 n A t i Y t = i = 1 n ( A t i × Y ) i = 1 n A t i
where X i and Y i are the longitude and latitude coordinates of the geometric centre of the i th patch, respectively, and A t i is the total area of the i th patch. Because each i th patch is identical in size in the image classification database, the centre of gravity for each land class is simply calculated as the average of X i and Y i .
The movement of the centre of gravity is calculated by using the following formula:
d t = X t + 1 X t 2 + Y t + 1 Y t 2
where ( X t , Y t ) and ( X t + 1 , Y t + 1 ) are the coordinates of the centre of gravity at the beginning and end of the study period, respectively, and d t is the distance that the centre of gravity moves.
Centre-of-gravity movement analysis was conducted by using LULC image classification data in order to identify mainly the centre of gravity’s movement in artificial surface along the western coastline and in Kızkalesi. An additional method was employed to determine the weighted centre of gravity with respect to the heights of buildings in the urban node of Kızkalesi. This was carried out to assess the effect of density on the centre of gravity’s movement. The location of each building in the urban node of Kızkalesi was determined by analysing aerial photographs obtained from the General Directorate of Mapping for the years 1975, 1978, 1987, and 1990, as well as Google Earth Pro images for the years 2004, 2010, and 2021. This analysis allowed us to identify the period in which each building was constructed. All raster images were converted into vector data considering buildings as a land class composed of i patches. Then, the coordinates of the centre of gravity ( X t for the longitude and Y t for the latitude) of each building were listed. Actual base maps from Erdemli District Municipality were examined to identify the buildings’ heights. These heights were then used to determine the weighted centre of gravity, with the independent variable A t i representing the height of the i th patch, i.e., the building.

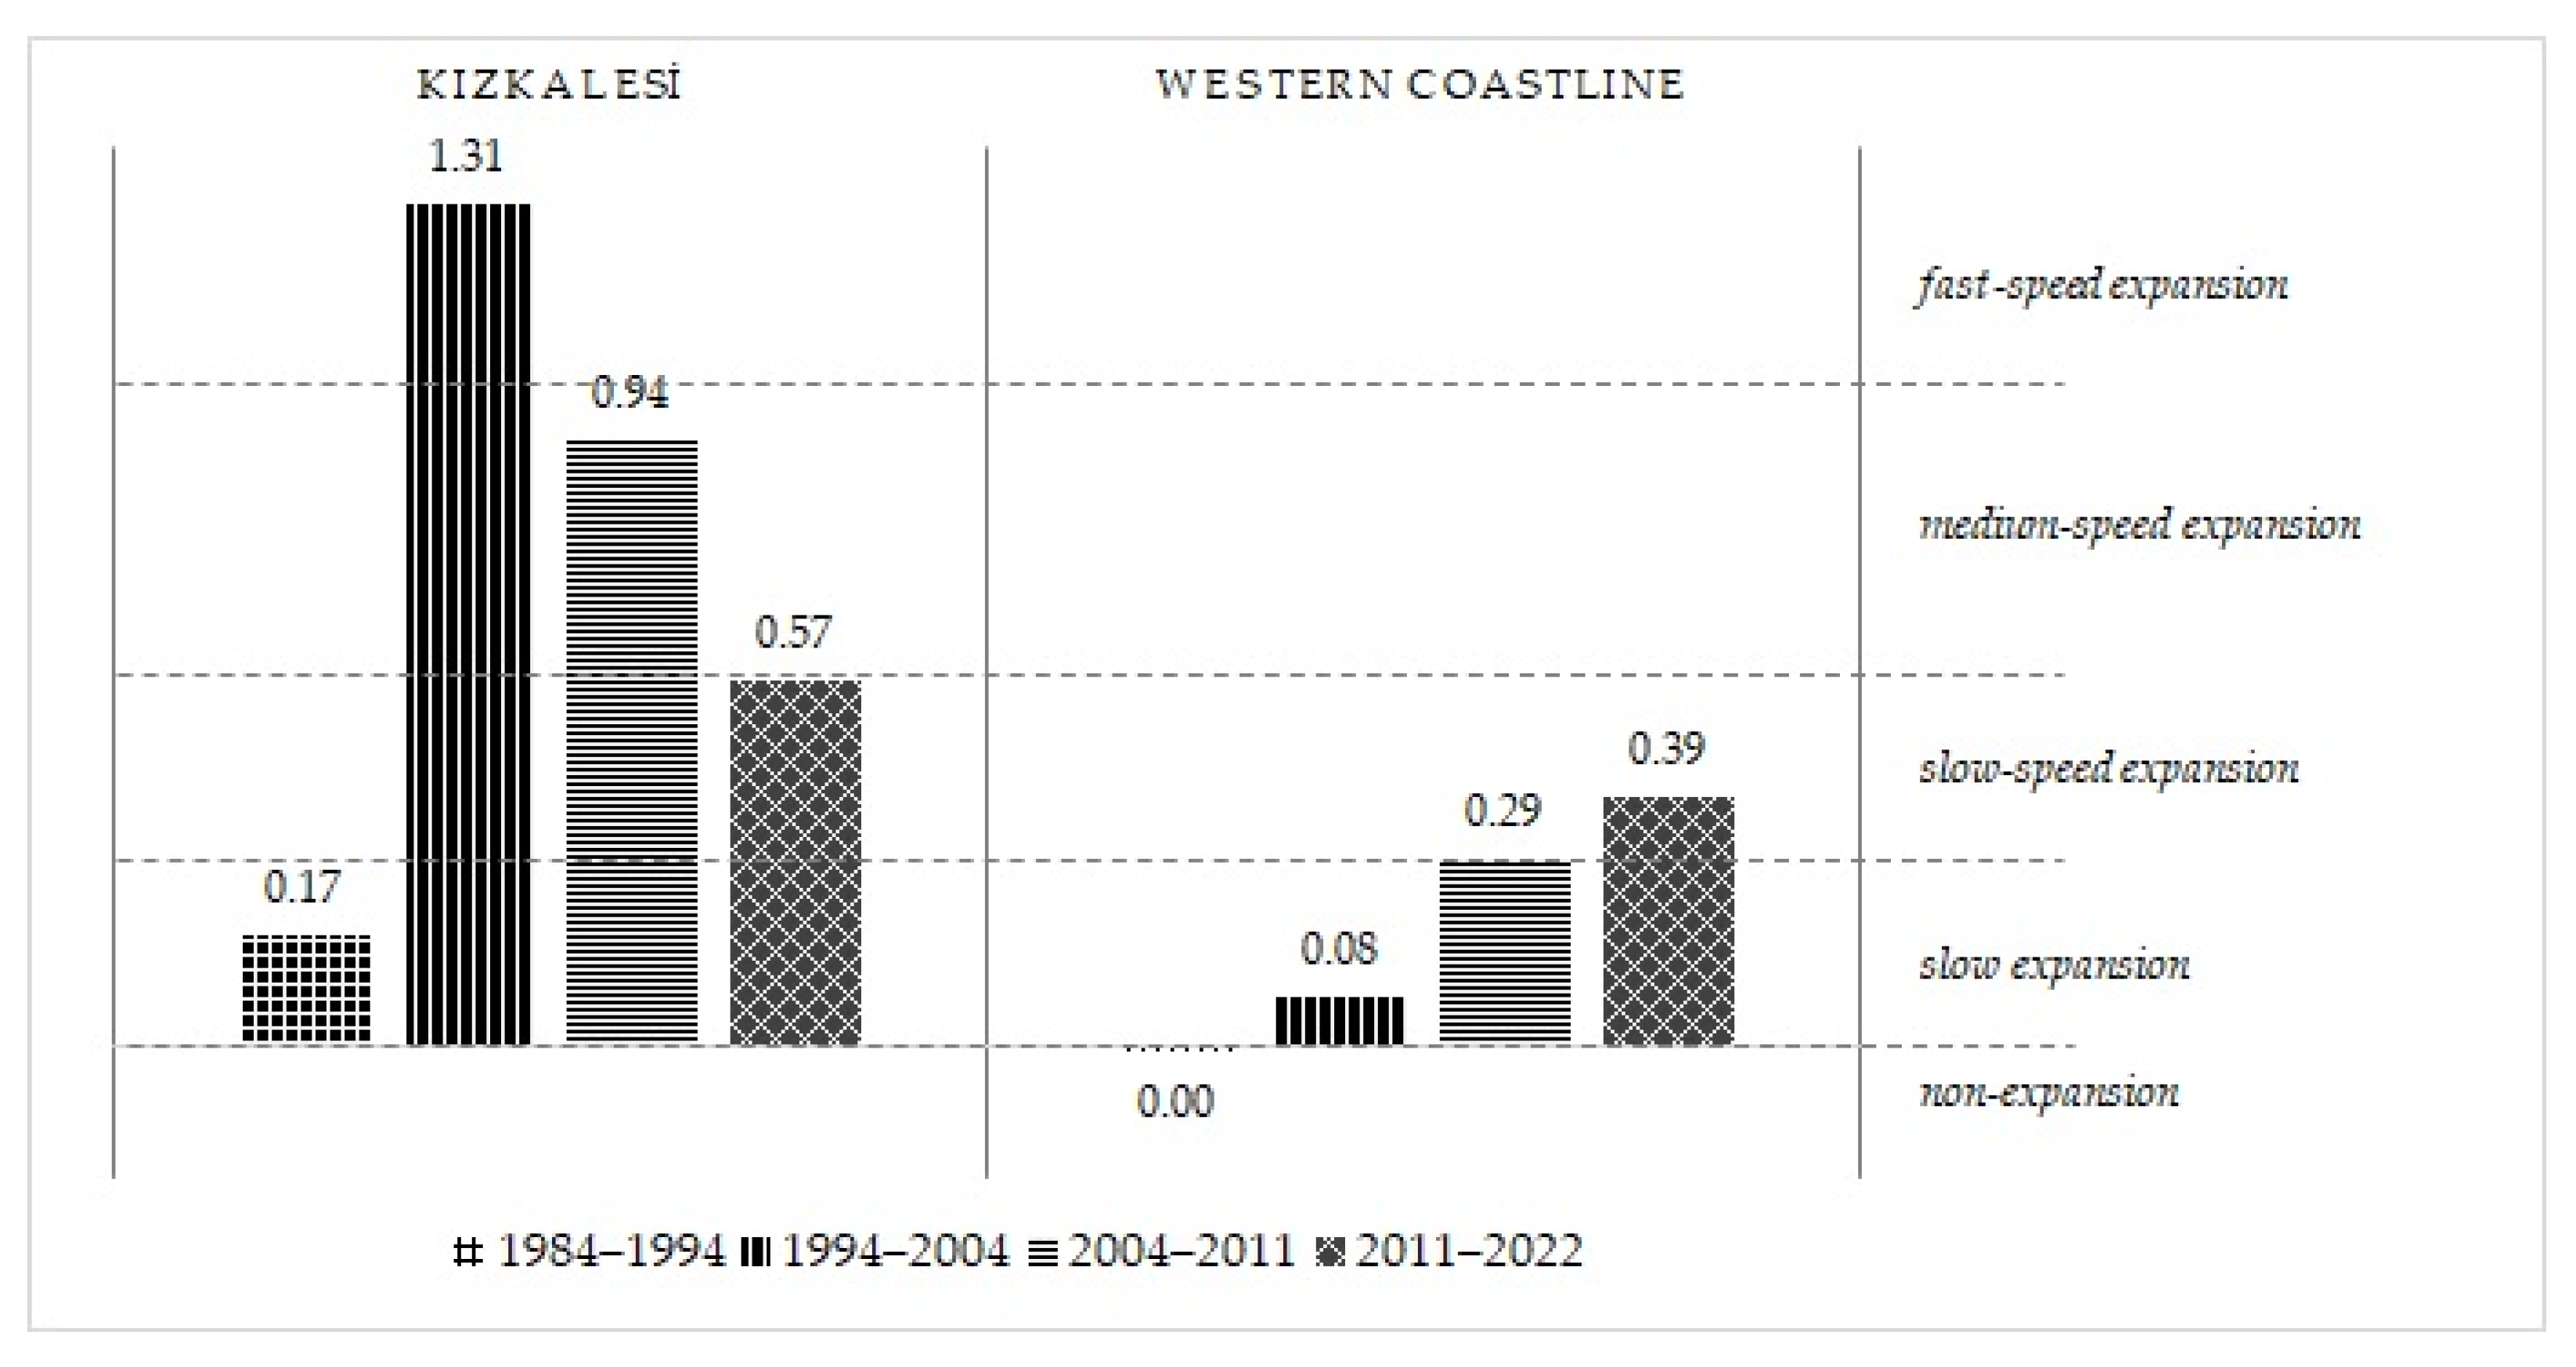
3.5. Annual Expansion Intensity Index

The expansion intensity index measures the increase in a certain land class as a percentage of the total area of the land unit in the study period. It indicates the level of differentiation and of expansion in different directions [53]. This study employed the annual expansion intensity index of artificial surface to compare the levels of built-up area expansion over the study periods. The formula is as follows:
B A i , t 2 = A 2 i A 1 i t 2 t 1 i = 1 n w a t e r A t i   ×   100 %
where B A t 2 represents the annual expansion intensity index of spatial unit A i , A 2 i and A 1 i are the area of land class A i at the beginning and end of the study period, respectively, t is the number of years over which the evaluation takes place, A t i is the total area of the i th patch, and n is the quantity of land classes, which is equal to 3 in this calculation, excluding water surfaces, which cannot be considered as an inhabitable land class.
As indicated by Hu and colleagues, the index value is classified into five grades [53]: 1.92 < B A i , t 2 as high-speed expansion, 1.05 < B A i , t 2 1.92 as fast-speed expansion, 0.59 < B A i , t 2 1.05 as medium-speed expansion,   0.28 < B A i , t 2 0.59 as slow-speed expansion, and 0 < B A i , t 2 0.28 as slow expansion.

4. Findings

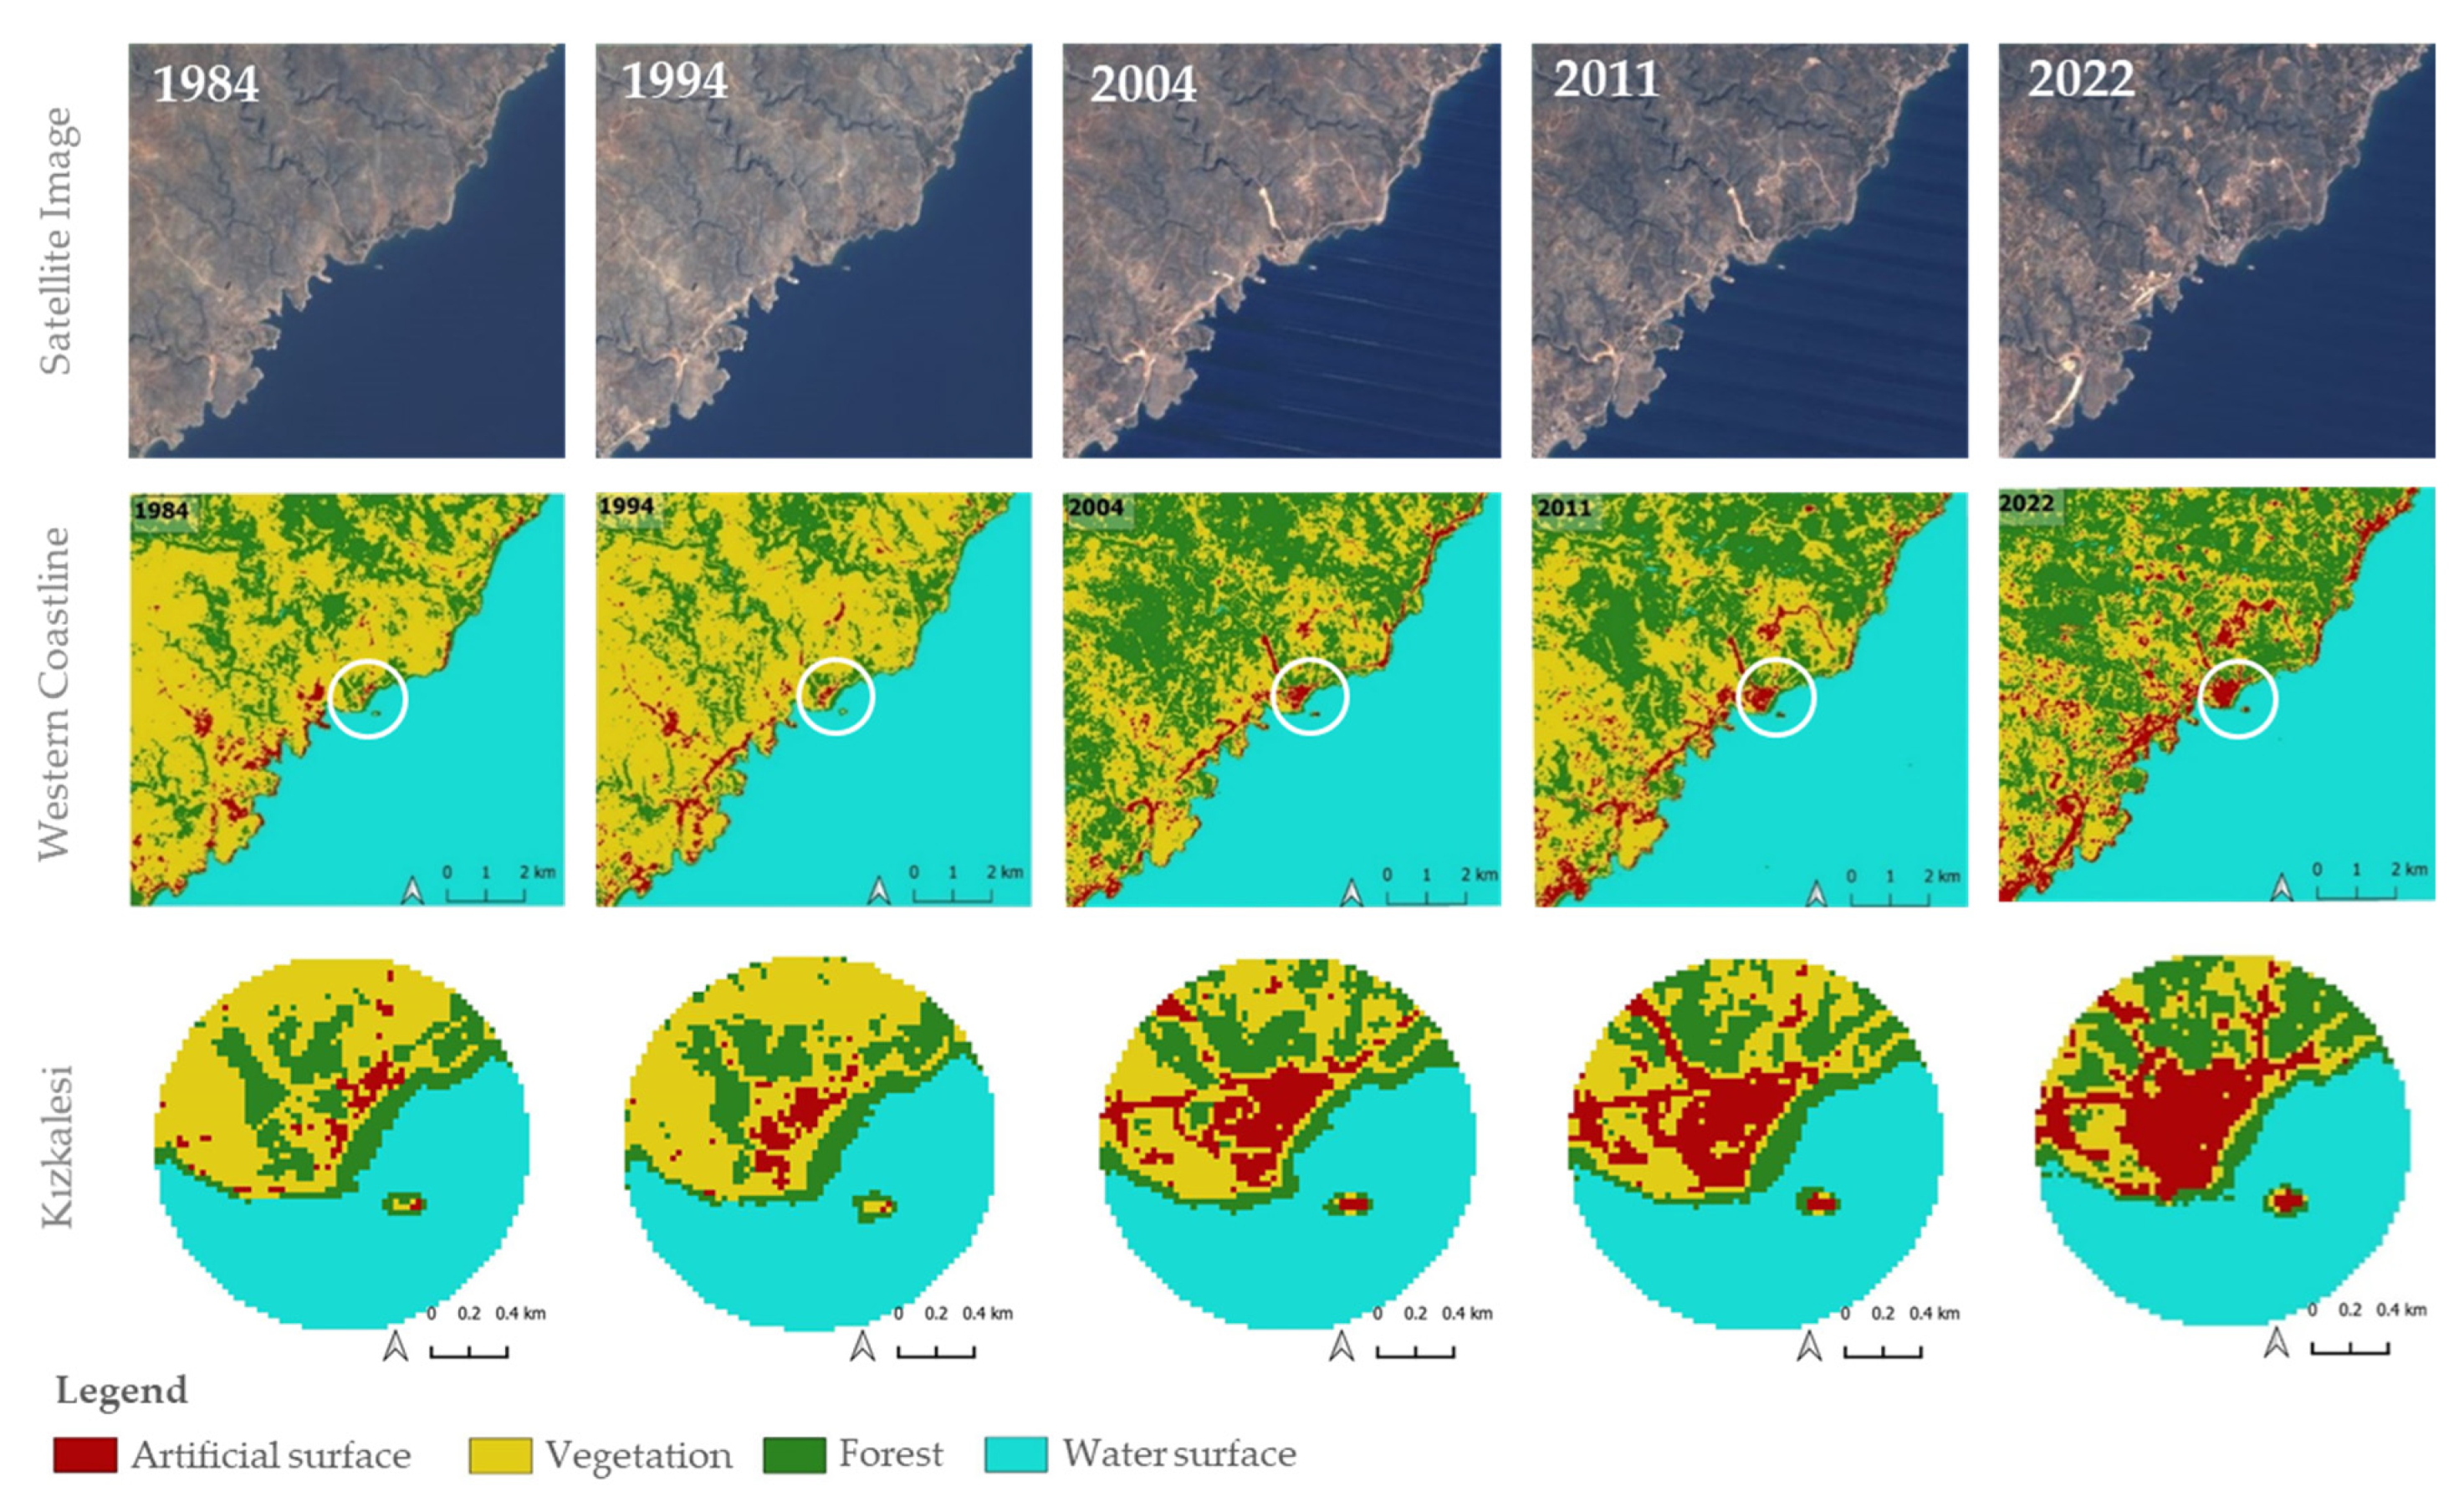
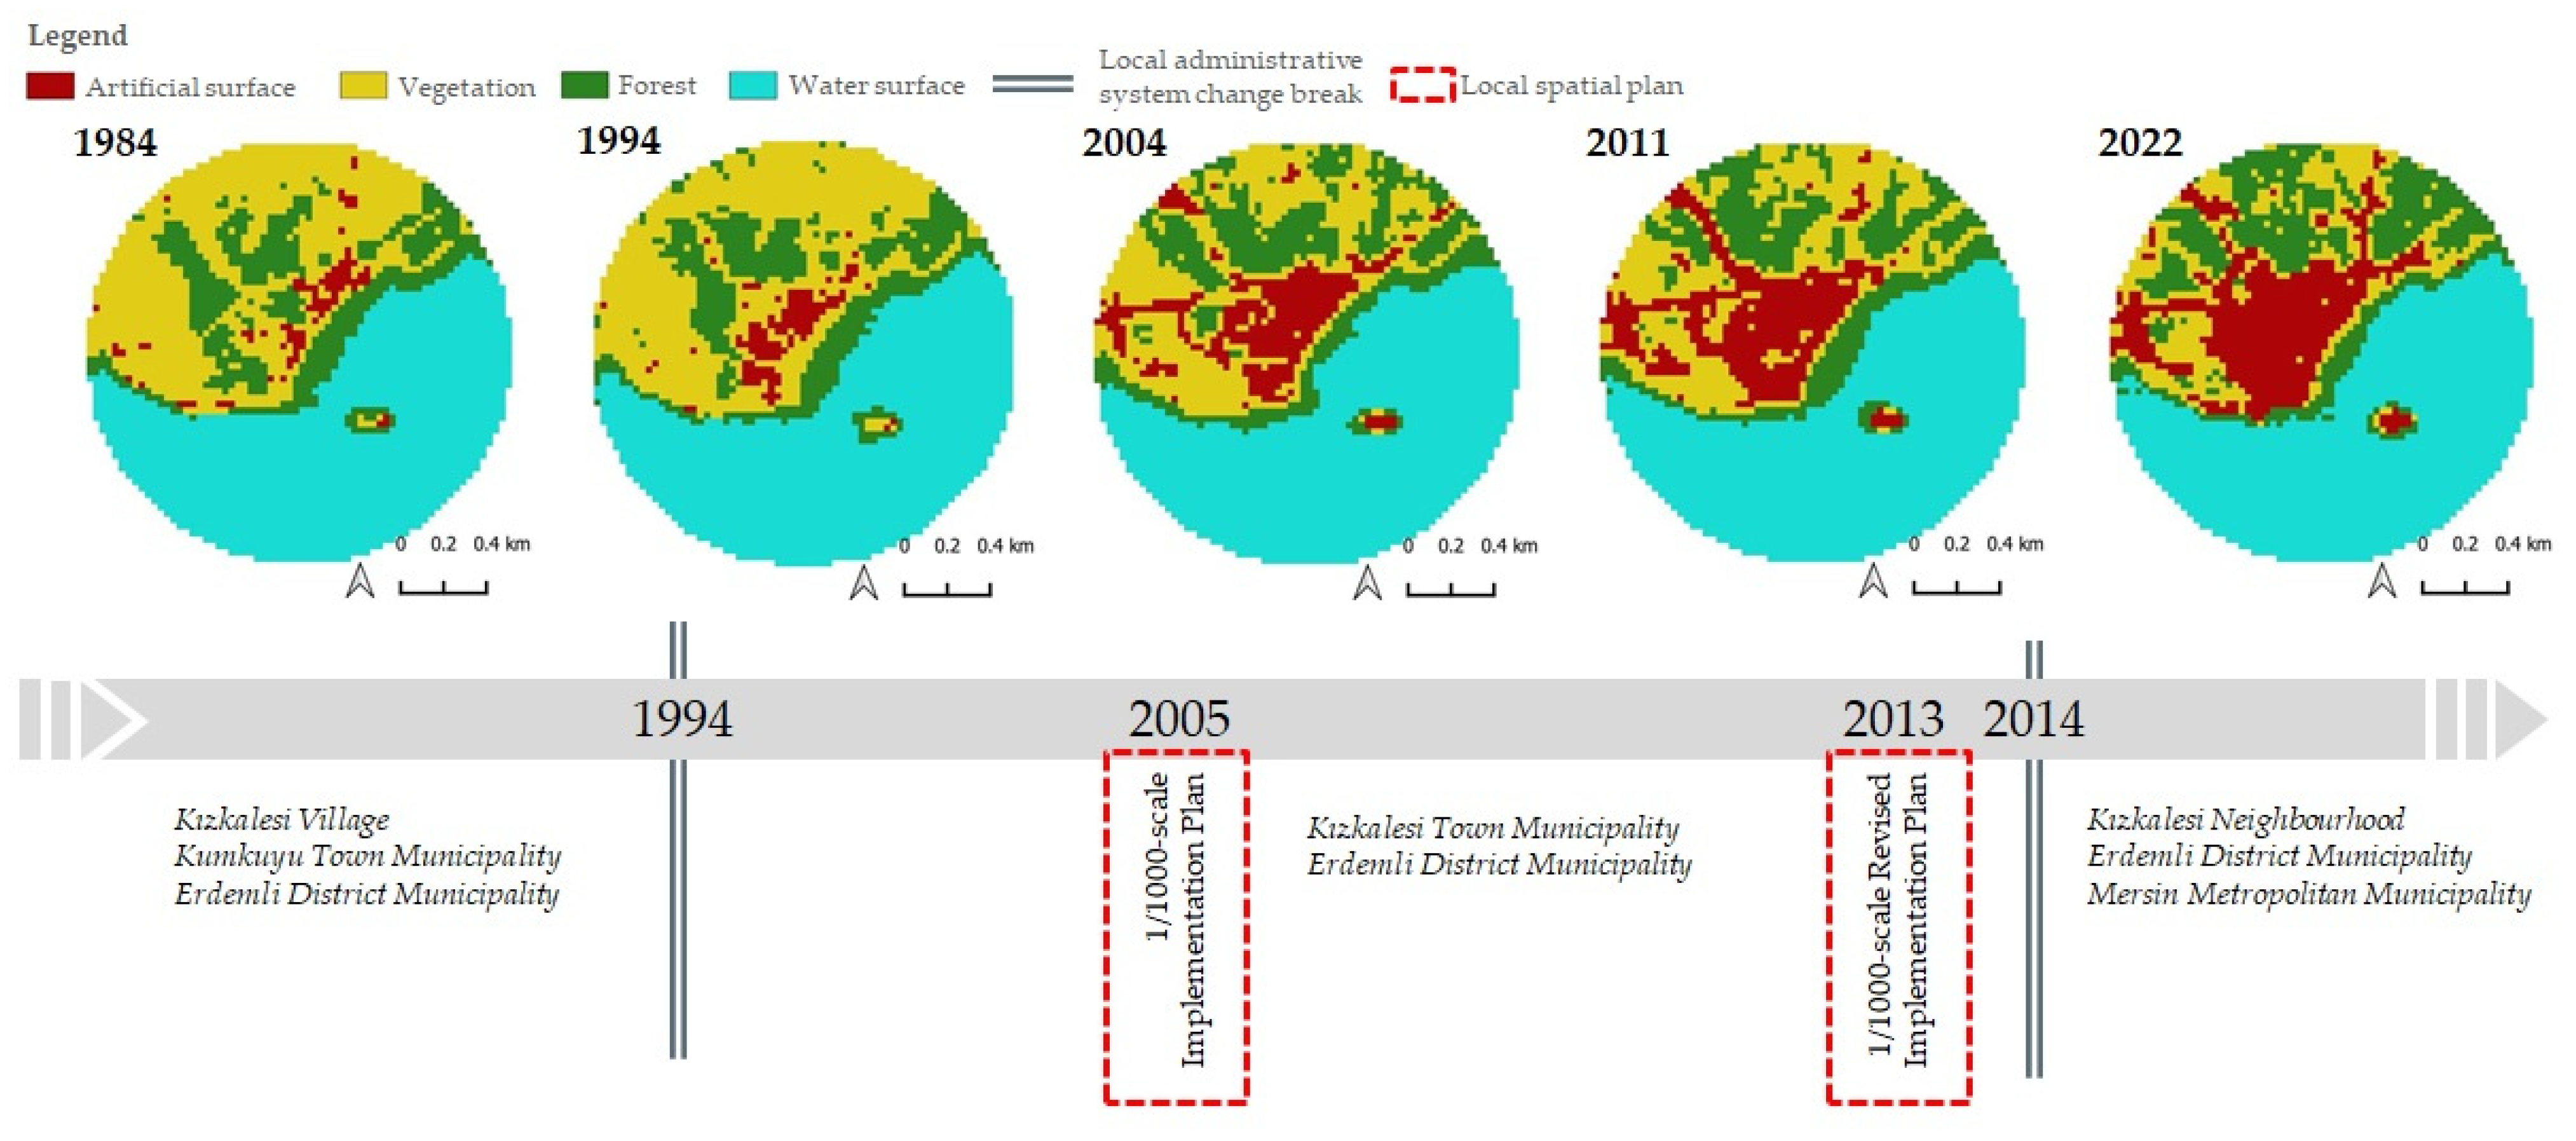
4.1. The Spatiotemporal Patterns of Land Use/Land Cover along the Western Coastline of Mersin and in Kızkalesi

This study focuses on the spatiotemporal patterns of LULC change on two spatial scales: the first covers the western coastline of Mersin, with an area of 11,913.75 hectares, whereas the second specifically focuses on the Kızkalesi settlement, with an area of 307.62 hectares. The spatiotemporal analysis of LULC changes was performed for the years 1984, 1994, 2004, 2011, and 2022. The spatiotemporal patterns of land classes considered in this study, derived from the Landsat images, are shown in Figure 5, whereas Table 3 and Table 4 illustrate the temporal changes in the land classes from 1984 to 2022. From the results, it can be observed that there have been distinct LULC changes, especially for artificial surfaces, on both scales over the 38-year period.
Due to the geographical context, the study area is mainly composed of vegetation, forest, and water surface as land classes. The settlement pattern on the western coastline of Mersin has historically been influenced by its mountainous terrain. The sloping areas in the north result in a concentration of settlements in considerably flat areas that are suitable for habitation and agricultural activities. Since these flat areas are largely located along the Mediterranean Sea, the artificial surface lies along the coastline. The water surface is the most dominant land class, covering almost half of the research area on both scales. The water surface primarily includes the sea, which explains why there has been essentially no change in this category. The slight fluctuations in water surface are due to the seasonal changes along the coastline.
The spatiotemporal analysis of LULC changes from 1984 to 2022 along the western coastline demonstrated a noticeable expansion of the artificial surface over the study period. It was determined that there was almost threefold growth in the artificial surface from 1984 to 2022. This growth was mainly triggered by tourism activities in specific localities, one of which is Kızkalesi. The extent of vegetation, encompassing both agricultural fields and sparsely vegetated shrubland, exhibited a decline at a rate of 16.79%, while forest showed a twofold increase. This increase in forest can be attributed partially both to afforestation efforts implemented by government agencies, specifically targeting shrubland, and to the growth of shrubs into densely populated thickets over the course of the research period. This argument is justified by the transfer matrix of LULC changes between the years 1984 and 2022 along the western coastline, indicating that 1886.76 hectares of vegetation has been replaced by forest, and also that the growth of the artificial surface has mainly taken place over the 490.86 hectares of vegetation (Table 5).
The spatiotemporal analysis of LULC changes in Kızkalesi presents similarities in terms of the predominant form of land class, which is forest; however, there is a distinct contrast to the western coastline of Mersin with respect to artificial surfaces and vegetation. From the period spanning from 1984 to 2022, there has been a notable increase in the artificial surface in Kızkalesi, amounting to a multiplication factor of 6.4. While the artificial surface has increased, there has been a major decline in vegetation. The transfer matrix of LULC changes reveals that the artificial surface has gained 31.86 hectares from vegetation (Table 6). From this, it can be inferred that the development of the built-up area in Kızkalesi has primarily taken place on agricultural land and sparsely vegetated shrubland between the years 1984 and 2022. In addition to the artificial surface, there has also been a transfer between forest and vegetation. Therefore, the forest in Kızkalesi presented a slight increase from 1984 to 2022.
Between the years 1984 and 2022, the growth of the built-up environment has resulted in detrimental effects on vegetation, both along the western coastline and in Kızkalesi. The transfer matrices (Table 5 and Table 6) indicate that vegetation is the main land class losing its area to other land classes. On the other hand, artificial surface was the land class that gained the most from other classes in almost all periods. It is worth noting that the forest has not been significantly impacted by the expansion of the artificial surface. The primary factor contributing to the protection of forest is its unsuitability for habitation due to the steep slopes, limited accessibility, and legislative regulations in forest areas.
Table 5. Transfer matrix from 1984 to 2022 along the western coastline of Mersin. Please refer to the Supplementary Materials for the transfer matrices of each study period.
Western Coastline2022
ArtificialVegetationForestWaterTotalLOSS
1984Artificial149.4093.694.59-247.6898.28
Vegetation490.862281.501886.76-4659.122377.62
Forest68.22284.311242.2727.991622.79380.52
Water0.090.0921.245362.745384.1621.24
Total708.572659.593154.865390.73
GAIN559.17378.091912.5927.99
Table 6. Transfer matrix from 1984 to 2022 in Kızkalesi. Please refer to the Supplementary Materials for the transfer matrices of each study period.
Kızkalesi2022
ArtificialVegetationForestWaterTotalLOSS
1984Artificial6.931.44--8.371.44
Vegetation31.8637.7129.52-99.0961.38
Forest14.408.7331.14-54.2723.13
Water0.180.093.42142.92146.613.42
Total53.3747.9764.08142.92
GAIN46.4410.2632.940.00
Figure 6. Annual rate of change for each LULC class along the western coastline of Mersin and in Kızkalesi from 1984 to 2022.
Land 13 00151 g006
In order to understand the intensity of LULC changes in the study periods, the annual rate of change for each LULC class (Figure 6), along with the single dynamics index results (Table 7), was evaluated on both scales simultaneously. The period between the years 1994 and 2004 can be identified as the most dynamic period in terms of LULC changes. The intensity of vegetation loss can be observed on both scales within this period, but the intensity of gain has different directions on each scale. While there has been a rapid increase in forest along the western coastline, it was the artificial surface, with a dynamic index value of 19.11, that showed the most rapid increase in Kızkalesi. Since 2004, the artificial surface intensity along the western coastline has increased, in contrast to the decrease in the artificial surface intensity in Kızkalesi.
The expansion direction of the artificial surface, based on centre-of-gravity movement analysis (Figure 7), indicates that the centre of gravity of the western coastline hovered in west–east direction during the study period, except for the last period, during which there occurred a considerable move towards the north, most probably due to the increase in the number and intensity of dispersed rural residential units, farms, and agricultural fields in the foothills of the Taurus Mountains. The main shift along the western coastline was observed between the years 1994 and 2004, at 1048 m, under the influence of the significant expansion of the artificial surface in Kızkalesi within the same period. The centre of gravity of the artificial surface in Kızkalesi shifted first towards the southwest, due to the pull effect of tourism attractions such as the sea and beaches, and then towards the northwest and west once the coastline had been saturated with tourism facilities. The longest distance of movement in Kızkalesi was observed between the years 1984 and 1994, at 143 m towards the southwest, whereas the second-longest shift was observed in the subsequent period, during which the change in the artificial surface had the highest annual rate, at 10.69%.

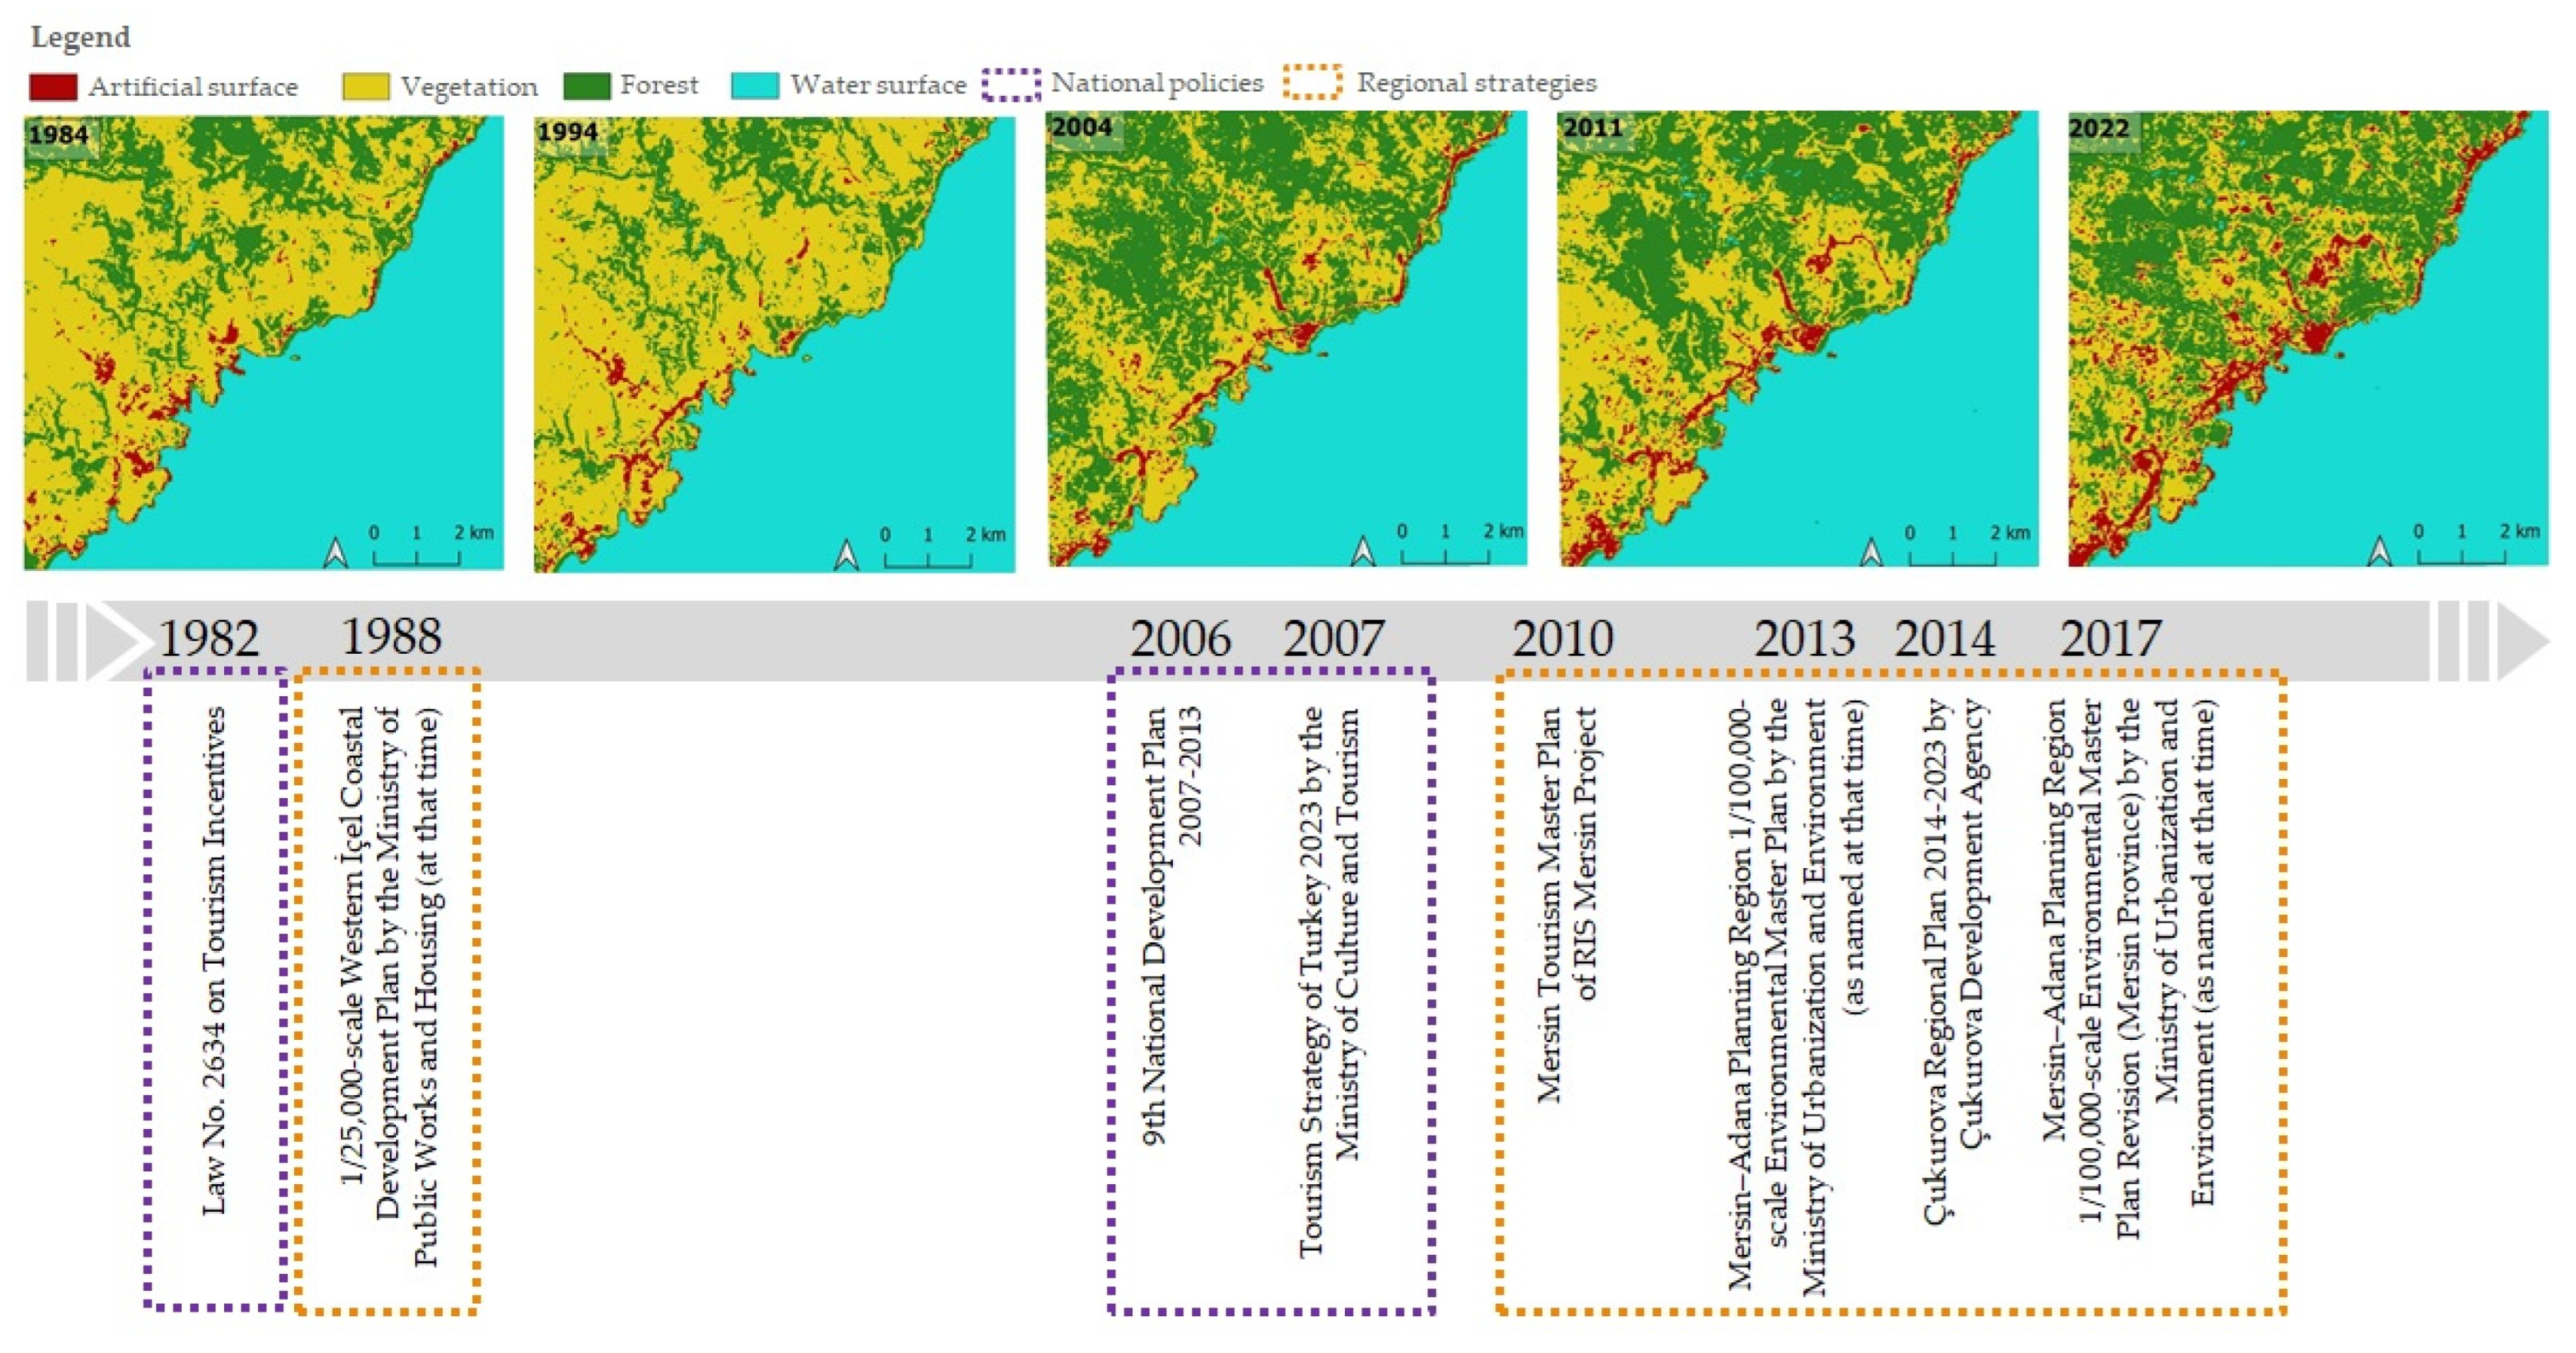
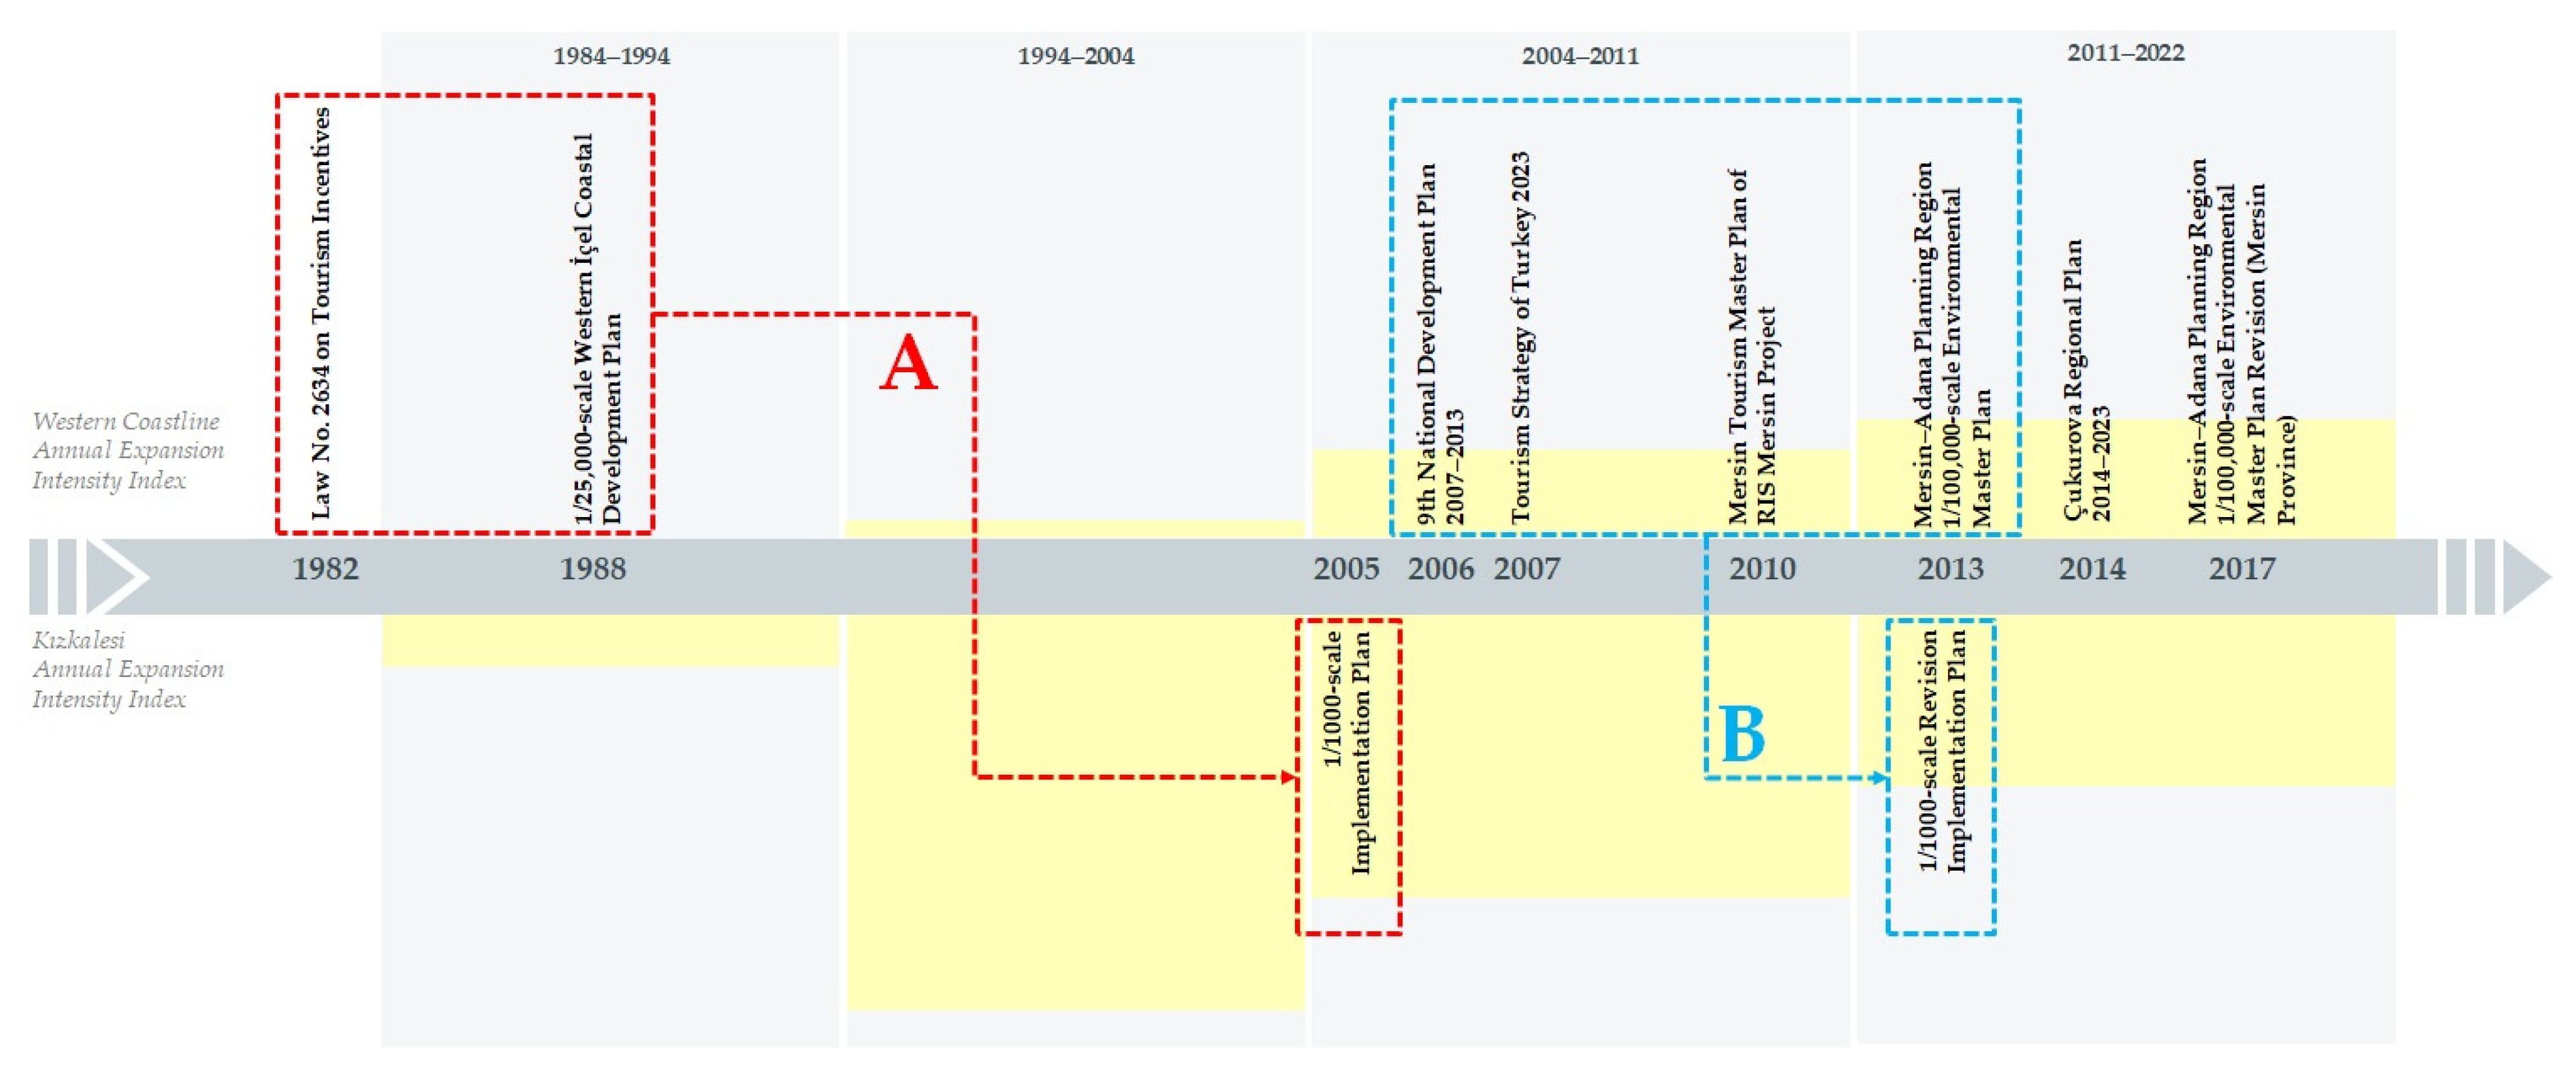
4.2. Tourism Planning Process along the Western Coastline of Mersin and in Kızkalesi

The history of tourism planning in Türkiye can be traced back to the 1960s [54]. During this period, Türkiye embarked on a planning era aimed at regulating its economic activities, which commenced in 1963 [55]. Tourism was acknowledged as a subsector within the framework of national development plans, with the primary objectives of utilising the potential of tourism, generating revenue from tourism activities, establishing essential infrastructure for providing services to domestic tourists, and ensuring an ideal balance between the preservation and development of tourism destinations [56], especially by focusing on mass tourism and coastal tourism activities.
Tourism has emerged as a prominent economic sector in Türkiye, particularly through the adoption of an open economy in the 1980s [57]. According to Oskay, the enactment of Tourism Incentive Law No. 2634 has proven to be particularly successful in stimulating tourism development by strategically channelling tourism investments towards locales with high potential and utilising incentives, financial assistance, and subsidies [58]. During this period, neoliberal macroeconomic policies have changed tourism-related priorities, facilitated the easy allocation of public land for tourism investments [59], and led to an increasing share of private enterprise and foreign investment in the tourism sector [60].
The initiation of tourism development in Mersin, particularly along the western coastline and in specific tourism destinations such as Kızkalesi, has been attributed to the implementation of national and regional tourism policies and strategies. This development primarily occurred during the 1980s and involved the construction of summer houses and hotels, primarily targeting domestic tourism under the influence of national policies promoting coastal tourism investments [14]. The Ministry of Public Works and Housing (of the time) produced a 1/25,000-scale Western İçel Coastal Development Plan in 1988. The proposed plan encompassed the entirety of the western coastline of Mersin Province, extending from the Erdemli district to the Anamur district. It put forth suggestions for the development of tourism areas, daily tourism activity areas, and tourism centres within the region, with the aim of spatially guiding tourism investments [14]. The plan recommended that the eastern and southern regions of Kızkalesi be designated as tourism development areas. At that point in time, Kızkalesi had emerged as a prominent destination within the region, leading to a notable increase in tourism investments.
The inception of the regional tourism planning process in 1988 evolved into a more comprehensive process of tourism planning in the 2000s, guided by national and regional policies and strategies (Figure 8). The central government officially released the “Tourism Strategy of Turkey 2023” and the “Activity Plan for Tourism Strategy of Turkey 2007–2013” in February 2007. These initiatives aimed to improve the management and implementation of strategic planning in the tourism sector and promote collaboration between the public and private sectors [61]. The Ministry of Culture and Tourism has taken on the role of coordinator in order to facilitate the organisation of tourism activities and provide guidance to the tourism and travel industries throughout the many stages of production, management, and implementation. This coordination was carried out with a participatory planning perspective, involving all relevant stakeholders. The strategic plan was structured in accordance with the goals outlined in the 9th National Development Plan of 2007–2013 [62], which stipulated the need for the formulation of a comprehensive tourism master plan to facilitate the sustainable and robust growth of the tourism sector.
In line with national policies by the beginning of 2000s, the Mersin Regional Innovation Strategy, prepared in 2008, was a notable regional initiative aimed at revitalising the economy in Mersin after the turn of the millennium [63]. It was the final dissemination of the RIS-Mersin Project, which took place from 2006 to 2008. The strategy document was not deemed to be an official document. Rather, it served as a bottom–up advisory document generated by local initiatives, with the purpose of guiding investments and planning decisions [64]. For enhancing the resilience of the local economic framework, the primary objective of the strategy was to identify the key sectors that drive innovation in the local economy. The sectors identified were logistics, the agriculture–food industry, and tourism [65]. In order to attain the desired level of thickness, sector-specific forums were established with representatives from relevant public and private sectors. These forums formulated sector-specific visions, identified objectives for each sector, and put forth appropriate initiatives, along with sector-specific master plans [63,64].
One of the sector-specific master plans derived from the Mersin Regional Innovation Strategy was the Mersin Tourism Master Plan of 2010. This plan encompassed strategies pertaining to the sociocultural, economic, and organisational aspects of tourism. Nevertheless, the spatial dimension within the master plan exhibited a relative lack of strength. The master plan focused solely on identifying the subregions of tourism activities in Mersin and the overall bed capacities in these regions [66]. The Mersin Regional Innovation Strategy has been found to have generated economic enthusiasm and fostered improved trust and confidence at the local level [64,67]. Although the plan’s scope for innovation is likewise restricted, the recommendations put forth in the Mersin Tourism Master Plan of 2010 have played a crucial role in shaping subsequent regional planning attempts.
At the regional level, there are two different plans encompassing Kızkalesi and its rural hinterland. The initial plan under consideration is the “Çukurova Regional Plan 2014–2023”, which was produced by the Çukurova Development Agency for the TR62 NUTS-2 region, covering the provinces of Adana and Mersin [68]. The primary objective of this plan is to transform the region into a globally recognised hub of attractions and a prominent centre for production activities. The main purpose of this primary objective is to prioritise the active utilisation of the regional tourism potential, yet this particular plan has limited spatial considerations. Instead, comprehensive sectoral analyses and proposals are systematically produced. The regional plan encompasses a range of comprehensive tourism strategies for the region, many of which have not been translated into specific spatial proposals. The regional plan aims to establish effective connections between the tourism destinations in southeastern Anatolia and inner Anatolia. However, it is worth noting that the western section of Mersin has not been thoroughly taken into account. Therefore, the regional plan does not place any particular emphasis on Kızkalesi and its rural hinterland.
The second regional plan is the “Mersin—Adana Planning Region 1/100,000-scale Environmental Master Plan”, which was first approved in 2013 and then revised in 2017 by the Ministry of Environment and Urbanisation (as known at the time). This environmental master plan aims to develop a sustainable and liveable rural and urban environment in the provinces of Mersin and Adana, with a target year of 2025 [69]. Unlike the Çukurova Regional Plan of 2014–2023, it has strong emphasis on the spatial aspects of the regional development. The objective of the plan is to protect the agricultural, touristic, and historical identity while also guiding development in a systematic manner, adhering to the planning principles established in alignment with Türkiye’s national development plans and sectoral development objectives. The tourism policies outlined in the environmental master plan aim to facilitate the development of sun–sand–sea tourism while simultaneously promoting the diversification of alternative tourism activities within the region. These policies are designed to enhance the economic benefits derived from the tourism sector by increasing the overall number of visitors to the region. The environmental master plan highlights Kızkalesi as one of the tourism attraction centres for the region. Considering the tourism potential of the settlement, the plan projects the population of Kızkalesi as 20,000 for the year 2025, whereas it was 1687 inhabitants in the year 2012. In parallel with the projected population increase, the plan proposes new development areas in the northern part.
In 2014, the municipal administrative system in Türkiye changed, and Mersin was assigned as one of the metropolitan municipalities. Considering the requirement to revise the environmental master plan in parallel with the changes in the administrative system, the Ministry of Environment and Urbanisation (as known at the time) revised the Mersin Province section of the 1/100,000-scale environmental master plan in 2017 [70]. The revised environmental master plan aims to maintain the current status of Kızkalesi and its rural hinterland. However, the tourism facilities lack a distinct categorisation within the legend categories in the revised environmental master plan, as they are all encompassed under the designation of “preferential land-use area”, which is described as comprising tourism accommodation facilities as well including residential units, complementary commercial activities, and areas dedicated to social, cultural, and technical infrastructure [71] (p. 4). This legend category suggests the development of tourism accommodation facilities within the context of mixed-use areas. The revised environmental master plan does not provide specific measurements for the size of tourism areas. However, it is assumed that 50% of preferential land-use areas would consist of tourism facilities. All projections in the revised environmental master plan are based on this assumption, as indicated in the planning report [70].
In line with the national policies and regional strategies, the local spatial plans in the Turkish planning hierarchy have the objective of directing and monitoring the spatial (re)development of settlements, as outlined in the legislation known as Spatial Development Law No. 3194 [54]. Spatial planning plays a crucial role in determining the direction and size of urban expansion, as well as shaping future land uses, population densities, transportation systems, and infrastructure development. Focusing on spatial organisation and directed by local-level governmental institutions, spatial plans are considered to be the main tools for controlling spatial development.
Spatial plans are mainly prepared and approved by municipalities. Consequently, appreciating the changes in the municipal administrative system is essential for assessing the past course of the spatial planning process. Changes in the administrative system may lead to alterations in both administrative boundaries and corresponding responsibilities regarding spatial planning. The administrative system in Kızkalesi has undergone significant changes in recent decades, resulting in direct impacts on how the spatial planning is authorised and operated (Figure 9).
Kızkalesi was a rural village within the Kumkuyu Town Municipality (of the time) in the jurisdiction of the Erdemli district. The main spatial planning authority was the Kumkuyu Town Municipality, yet there was no comprehensive spatial plan for the settlement as a village. Development activities were coordinated in line with the Unplanned Areas Development Regulation. According to this regulation, any physical development on a cadastral parcel is considered separately through the proposed project, and a construction permit is granted after free-of-charge abandonment of a part of the cadastral parcel given for public uses, such as roads. This type of spatial development process initiated with cadastral parcels can be called “regulation-based development”.
The population of Kızkalesi experienced a rise to 3091 people during the 1990 census. Consequently, Kızkalesi was officially designated as a town municipality in 1994, with the purpose of effectively addressing administrative issues and guiding the process of spatial development within the settlement [14]. The intention to prepare a comprehensive spatial plan—officially named the 1/1000-scale implementation plan—started right after the establishment of Kızkalesi Town Municipality (of the time). Nevertheless, the municipality faced deficiencies in technical capacity and the financial and human resources necessary to carry out the spatial planning process enforced by Law No. 3194. Kızkalesi Town Municipality sought assistance from the central government. The preparation of base maps required for the preparation of local spatial plans by the Provincial Bank (of the time—a former central public institution in charge of planning and infrastructure investments) took a long time and was completed in 2004 [14]. In order to manage the growing demand for new construction, particularly in the southern part of the D-400 Highway, construction activities have been organised through regulation-based development on individual cadastral parcels or groups of parcels, as demanded by the landowners or developers.
Later, in 2005, Kızkalesi Town Municipality prepared and approved the 1/1000-scale implementation plan, so regulation-based development activities were replaced with “plan-led development” in the urban node. The implementation plan was a comprehensive spatial plan to direct new development areas and to unify them with the existing built-up area. The main aims of the spatial plan were to control changes in the physical environment, to specifically direct tourism investments, and to achieve spatial organisation in the urban node. The implementation plan proposed a building layout with a maximum height of five storeys.
Following the implementation of administrative system changes and the revision of the administrative boundaries in 2014, Kızkalesi Town Municipality was disbanded, and the settlement was designated as a neighbourhood under the jurisdiction of Erdemli district. The disbandment of Kızkalesi Town Municipality resulted in the transfer of spatial planning authority to Erdemli District Municipality at the local level, and to Mersin Metropolitan Municipality at the regional level.
Just before the administrative system changes in 2014, Kızkalesi Town Municipality issued 1/1000-scale revised implementation plan in December 2013, in line with the Mersin—Adana Planning Region 1/100,000-scale environmental master plan. The revised implementation plan adopted the planning decision of the environmental master plan about the new development areas to the north of the D-400 Highway. The primary focus of the revised implementation plan’s land-use proposal is the development of residential areas for tourism purposes by using the legend category “preferential land-use” in the environmental master plan. Additionally, there were limited provisions directly for tourism accommodation facilities. The revised implementation plan granted all buildings the right to use their ground floors for commercial purposes through the issuance of permits. The revised plan has resulted in an increase in development rights and an expansion of the boundaries pertaining to the built-up area. The maximum height for buildings was revised up to 12 storeys at specific locations in the northern part of the D-400 Highway. Kızkalesi Town Municipality authorised the increase in building rights, as requested by landowners and developers during the revised plan’s preparation phase [72], and subsequently endorsed it in the plan’s revision. The revised implementation plan, which was approved in 2013, is still in force.

4.3. The Effectiveness of the Tourism Planning Process along the Western Coastline and in Kızkalesi

Since the early periods of the development of tourism in the region, tourism planning at different scales has tried to direct and control this growth (Table 8, Figure 10). Tourism has been acknowledged as an important economic sector in the national policies and this was supported by legislative regulations for tourism incentives in 1982. These national policies were followed by the approval of the Western İçel Coastal Development Plan in 1988, which fostered tourism investments in the region. The tourism planning process during this period can be considered as having been the first planning period (Figure 10, notation A), during which a limited number of strategies and spatial plans were in active use. The 1/25,000-scale Western İçel Coastal Development Plan was the main strategic plan document directing tourism investments at the regional level. As a small-scale settlement with a new municipality in charge, Kızkalesi was vulnerable to speculations on tourism development, which resulted in a rapid growth of the built-up area, with a fast expansion. The settlement lacked a comprehensive plan, and all development activities were directed and controlled within the framework of regulation-based development. The significant problem of the initial period could be considered to be the time gap in the tourism planning process, during which regional strategies were not translated into spatial decisions through local spatial plans. By the turn of the millennium, national policies and regional tourism strategies continued to be introduced and, correspondingly, new regional plans were drafted in the 2010s. This period can be considered as having been the second planning period (Figure 10, notation B), which was more comprehensive and integrated compared to the first planning period. The regional planning decisions were transferred into local spatial plans in a timely manner, without any delay. However, this period had another problem than the time gap in the tourism planning process, which was the imbalanced distribution of tourism accommodation facilities.
Within the first planning period, the influence of national and regional tourism policies and strategies on the LULC changes along the western coastline of Mersin was found to be limited. As revealed by the annual expansion intensity index (Figure 11), the initial impacts of the 1/25,000-scale Western İçel Coastal Development Plan have not been observed homogeneously along the entire western coastline, but in specific localities, one of which was Kızkalesi, attracting tourism investments especially between the years 1994 and 2004, with a fast expansion. The development plan has been essential in guiding tourism investments. However, there was a lack of a local spatial plan to regulate the spatial organisation of these investments.
The Western İçel Coastal Development Plan has provided local municipalities with the authority to supervise and guide the development of tourism through local spatial plans, by developing a comprehensive spatial framework in the region. Nevertheless, small-scale municipalities, such as Kızkalesi Town Municipality (of the time), faced limitations in terms of technical capacity, as well as financial and human resources. These limitations hindered their ability to effectively manage the spatial planning process. Consequently, these municipalities opted to guide spatial development through the utilisation of regulation-based development. This type of development entails the allocation of building rights for specific cadastral parcels, typically in response to the demands of the respective landowners or developers. Furthermore, the implementation of regulation-based development has resulted in the formation of a physical environment that lacks not only technical and social infrastructure, but also urban structure.
In-depth examination of the first planning period in relation to the annual expansion intensity reveals a remarkable time gap, during which the highest annual expansion intensity was observed in Kızkalesi (Figure 10, notation A). The approval of the 1/1000-scale implementation plan of Kızkalesi was 17 years later than that of the Western İçel Coastal Development Plan. The regulation-based development had a significant impact on the formation of the settlement pattern, and the urban node of Kızkalesi was already built before the approval of the 1/1000-scale implementation plan of Kızkalesi, dated to 2005. Therefore, the spatial plan could not achieve one of its aims—to produce a well-organised spatial structure. Instead, it could only serve as a means to unify the new development with the existing built-up area by increasing the building rights.
These collective planning efforts during the second planning period (Figure 10, notation B) had a significant impact on the LULC changes observed along the western coastline. The growth pattern, which initially emerged as nodes in certain tourism destinations during the 1990s, has evolved into a linear tourism corridor through the establishment of tourism facilities and construction of summer houses along the D-400 Highway. Thereafter, slow expansion during the period between 1994 and 2004 turned into slow expansion in the following period, whereas the annual expansion intensity of Kızkalesi started to decrease from fast to medium-speed expansion.
The Adana–Mersin Planning Region 1/100,000-scale Environmental Master Plan of 2013 was one of the most prominent regional strategy plans of the second planning period, directing tourism development in the region through spatial decisions. Considering national policies and regional strategies that promote tourism development in the region, and also to adopt the proposal of the environmental master plan with regard to new settlement areas in the northern parts, Kızkalesi Town Municipality reacted aptly and revised the implementation plan without any delay. However, the revised implementation plan resulted in an expansion of the planned area, as well as an increase in the building rights. Furthermore, the revised implementation plan adopted the “preferential land-use area” legend category of the environmental master plan and denoted almost every plot in the settlement under this legend category. Accordingly, the landowners or developers had the right to construct either residential buildings—mostly summer houses—or, preferably, tourism accommodation establishments. Even though the environmental master plan assumed that 50% of preferential land-use areas would consist of tourism accommodation establishments, the revised implementation plan did not set any limitations or measurements for preferential land-use areas in terms of the share of residential buildings or tourism accommodation establishments. This flexibility in the revised implementation plan has resulted in an imbalanced distribution of residential buildings and tourism accommodation establishments in favour of residential buildings used as summer houses, which, in turn, has created two major problems: increasing building rights in a small settlement with a constant population size and, consequently, imbalanced occupancy rates observed as an excessive number of empty buildings during the off-season, yet overpopulation during the peak season.
The analysis of population changes in connection to the expansion of the artificial surface over the study periods demonstrates the impact of tourism on the transformation of the built-up area, corroborating the findings of Özüpekçe’s research [73] (p. 958). However, the population of the settlement has remained relatively stable, despite the increase in the artificial surface over the study period in Kızkalesi (Figure 12). The expansion of the built-up area over time, along with a stable population size, indicates that the primary factor influencing the growth of the settlement is tourism development.
The revised implementation plan has expanded the settlement not only horizontally, but also vertically, by increasing the building rights. The increased building rights can be observed by examining the shifts in the weighted centre of gravity of the built-up area, which can be calculated by assigning a weight according to the buildings’ heights (Figure 13). Due to the increasing heights of buildings over time, it was observed that the weighted centre of gravity stretched towards the western direction in the study periods.
The increase in building rights has, in turn, resulted in an inefficient use of building stock, particularly concerning the duality of overtourism and ghost town (Figure 14). In instances of increased demand, the settlement’s carrying capacity is mostly surpassed by short-term and daily visits, as opposed to medium-term stays during the peak season. On the other hand, the settlement is abandoned for almost half of the year, because it primarily consists of tourism accommodation facilities that are not utilised during the off-season. Not only accommodation facilities, but also a substantial number of commercial establishments, experience temporary closure, and there is a decrease in the availability of public services.

5. Conclusions

Kızkalesi had turned into an important tourism destination by the 1980s, under the influence of national policies and regional strategies. Since the early 2000s, local spatial plans have been introduced and implemented to direct and control the spatial repercussions of tourism development in the settlement. Notwithstanding the presence of a tourism planning process, Kızkalesi has faced multiple challenges pertaining to spatial organisation. This article has argued that these challenges stem from the ineffectiveness of the tourism planning processes. To comprehend the impact of the tourism planning process on LULC changes along the western coastline of Mersin and in Kızkalesi, several statistical studies were performed using image classification data.
Through the analysis of the LULC changes in Kızkalesi, it was found that the growth of the built-up area—specifically, the increase in artificial surface—was mainly driven by the construction of summer houses and tourism accommodation establishments during the 1980s and 1990s. The neoliberal perspective has positioned tourism as a profitable and convenient means of generating income. However, the settlement lacked a local spatial plan to effectively direct and regulate the development of tourism. The settlement experienced regulation-based development during this period due to the delay in the formulation of the local spatial plan. The development process driven by regulations has prioritised private interests at the expense of understanding the long-term implications for the urban structure. Consequently, the settlement has been predominantly influenced by the preferences and financial motivations of landowners and developers. This form of development on individual plots increased the population density without implementing a sustainable comprehensive urban structure. The 1/1000-scale implementation plan of Kızkalesi was adopted in 2005, with the primary objective of addressing the shortcomings in the existing settlement. However, it primarily focused on granting additional building rights, without adequately evaluating the capacity of the technical and social infrastructure. The lack of full control over land-use decisions in the settlement, as dictated by spatial plans, led to a failure to recognise the imminent issues arising from the significant demographic differences between the summer and winter populations. The assessment of LULC changes in relation to the tourism planning process in Kızkalesi uncovered two fundamental deficiencies in the process.
The first issue pertains to the acknowledgment of tourism as a prominent economic sector. Türkiye’s national and regional policies and strategies aim to foster tourism development in order to achieve financial benefits. Such strategies garner local support because they have the potential to benefit private interests. However, these policies and plans failed to take into account the potential negative consequences and challenges that may arise at the local level. These challenges were expected to be addressed and incorporated into local spatial plans. However, the case of Kızkalesi demonstrated that the delay between national and regional policies and strategies and local spatial plans can result in several problems, including overtourism, insufficient technical and social infrastructure, and disharmonious urban development caused by uncontrolled and rapid tourism growth. To address these problems, it is crucial to approach the tourism planning process in a systematic way. Additionally, it is important to ensure that tourism policies and strategies at both the national and regional levels are effectively reinforced by local-level spatial plans in a timely manner. If there are several constraints in creating spatial plans at the local level, the central authority should support local administrations to ensure the sustainable development of tourism destinations. This can be achieved by effectively utilising resources and promoting long-term sustainability.
The second issue is related to the technical capacity of the planning process. It is also necessary to have precision in planning decisions. Although legend categories such as preferential land-use area produce a level of flexibility for the settlement, they mostly prevent future projections from being made viable, which are crucial for spatial planning. These kinds of flexible legend categories can be used only if there is a technical capacity at the local level to monitor the development and keep further development within the intervals that the legend categories propose.
The study conducted in Kızkalesi highlights the deficiencies of policy, strategy, and spatial planning frameworks in directing and controlling LULC changes. These deficiencies are not exclusive to Kızkalesi, but they may be relevant to other rapidly expanding small-scale tourism destinations. Examining similar settlements can aid in conducting comprehensive assessments of deficiencies, facilitate comparative analysis, and assist in the restructuring of long-term tourism planning in a sustainable manner.

Supplementary Materials

The following supporting information can be downloaded at: https://www.mdpi.com/article/10.3390/land13020151/s1, Supplementary Files S1 and S2.

Author Contributions

Conceptualisation, Y.S.L., E.Ş. and T.L.; methodology, Y.S.L. and E.Ş.; formal analysis, E.Ş. and Y.S.L.; investigation, E.Ş., Y.S.L. and T.L.; data curation, E.Ş. and Y.S.L.; writing—original draft preparation, Y.S.L. and E.Ş.; writing—review and editing, Y.S.L. and T.L.; visualisation, Y.S.L. and E.Ş. All authors have read and agreed to the published version of the manuscript.

Funding

This research received no external funding.

Data Availability Statement

Data is contained within the article and supplementary material.

Acknowledgments

The earlier discussion about the scope of this article was conducted by Y.S.L. and E.Ş. during the International Tourism Conference 2022, through the presentation titled “The Role of Spatial Planning in Tourism Development: Opportunities and Challenges”. Initial research on the spatial planning process in Kızkalesi has been published as “Turkish case study analysis and policy recommendations”, the output of the “SPOT: Sustainable Spatial Planning of Tourism Destinations” project granted by the European Commission under the Erasmus+ Programme (2019-1-PL01-KA203-064946). For details, please visit www.spot-erasmus.eu.

Conflicts of Interest

The authors declare no conflicts of interest.

References

  1. Inskeep, E. Tourism Planning: An Integrated and Sustainable Development Approach; Van Nostrand Reinhold: New York, NY, USA, 1991. [Google Scholar]
  2. Briassoulis, H. Sustainable Tourism and the Question of the Commons. Ann. Tour. Res. 2002, 29, 1065–1085. [Google Scholar] [CrossRef]
  3. Higgins-Desbiolles, F. More than an “industry”: The forgotten power of tourism as a social force. Tour. Manag. 2006, 27, 1192–1208. [Google Scholar] [CrossRef]
  4. Aji, R.R.; Faniza, V. Land Cover Change Impact on Coastal Tourism Development near Pacitan Southern Ringroad. MIMBAR J. Sos. Dan Pembang. 2021, 37, 101–109. [Google Scholar] [CrossRef]
  5. Atik, M.; Altan, T.; Artar, M. Land Use Changes in Relation to Coastal Tourism Development in Turkish Mediterranean. Pol. J. Environ. Stud. 2010, 19, 21–33. [Google Scholar]
  6. Boori, M.S.; Voženílek, V.; Choudhary, K. Land cover disturbance due to tourism in Jeseníky mountain region: A remote sensing and GIS based approach. Egypt. J. Remote Sens. Space Sci. 2015, 18, 17–26. [Google Scholar] [CrossRef]
  7. Saha, J.; Paul, S. An insight on land use and land cover change due to tourism growth in coastal area and its environmental consequences from West Bengal, India. Spat. Inf. Res. 2021, 29, 577–592. [Google Scholar] [CrossRef]
  8. Inskeep, E. Tourism Planning: An Emerging Specialization. J. Am. Plan. Assoc. 1988, 54, 360–372. [Google Scholar] [CrossRef]
  9. Cerić, D.; Czapiewski, K. Diverse Challenges of Tourism Spatial Planning: Evidence from Italy, Norway, Poland, Portugal, and Turkey. In Contemporary Challenges of Spatial Planning in Tourism Destinations; Napierała, T., Leśniewska-Napierała, K., Cotella, G., Eds.; The SPOT Project: Lodz, Poland, 2022; pp. 141–154. [Google Scholar] [CrossRef]
  10. Dede, O.M.; Ayten, A.M. The role of spatial planning for sustainable tourism development: A theoretical model for Turkey. Tour. Int. Interdiscip. J. 2012, 60, 431–445. [Google Scholar]
  11. Dredge, D.; Moore, S.A. Methodology for the Integration of Tourism in Town Planning. J. Tour. Stud. 1992, 3, 8–21. [Google Scholar]
  12. Risteskia, M.; Kocevskia, J.; Arnaudov, K. Spatial Planning and Sustainable Tourism as Basis for Developing Competitive Tourist Destinations. Procedia—Soc. Behav. Sci. 2021, 44, 375–386. [Google Scholar] [CrossRef]
  13. Koca, H.; Şahin, İ.F. Turistik Aktiviteye Katkıları Yönünden Kızkalesi Kasabası [Kızkalesi Town in terms of Touristic Activities]. Türk Coğrafya Derg. 1998, 33, 349–375. [Google Scholar]
  14. Sarıkaya Levent, Y.; Levent, T.; Birdir, K.; Sahilli Birdir, S. Local Attraction Centre Kızkalesi: The Natural and Cultural Assets for Sustainable Tourism. The SPOT Project: Lodz. 2022. Available online: https://spot-erasmus.eu/wp-content/uploads/2023/03/TurkeyCaseStudy_SPOT_vFINAL.pdf (accessed on 27 October 2023).
  15. UENSCO. Ancient City of Korykos. Date of Submission: 14 May 2014. Available online: https://whc.unesco.org/en/tentativelists/5909/ (accessed on 22 November 2023).
  16. Türkiye Gazetesi. Mersin’de Nüfus Patladı, Plajlar Hareketlendi [Population Boomed in Mersin, Beaches Became Lively]. 22 May 2018. Available online: https://www.turkiyegazetesi.com.tr/yasam/mersinde-nufus-patladi-plajlar-hareketlendi-561322 (accessed on 27 October 2023).
  17. Ning, J.; Liu, J.; Kuang, W.; Xu, X.; Zhang, S.; Yan, C.; Li, R.; Wu, S.; Hu, Y.; Du, G.; et al. Spatiotemporal patterns and characteristics of land-use change in China during 2010–2015. J. Geogr. Sci. 2018, 28, 547–562. [Google Scholar] [CrossRef]
  18. Pauleit, S.; Ennos, R.; Golding, Y. Modeling the environmental impacts of urban land use and land cover change—A study in Merseyside, UK. Landsc. Urban Plan. 2005, 71, 295–310. [Google Scholar] [CrossRef]
  19. Rawat, J.S.; Kumar, M. Monitoring land use/cover change using remote sensing and GIS techniques: A case study of Hawalbagh block, district Almora, Uttarakhand, India. Egypt. J. Remote Sens. Space Sci. 2015, 18, 77–84. [Google Scholar] [CrossRef]
  20. Jalayer, S.; Sharifi, A.; Abbasi-Moghadam, D.; Tariq, A.; Qin, S. Modeling and predicting land use land cover spatiotemporal changes: A case study in chalus watershed, Iran. IEEE J. Sel. Top. Appl. Earth Obs. Remote Sens. 2022, 15, 5496–5513. [Google Scholar] [CrossRef]
  21. Khaddor, I.; Achab, M.; Soumali, M.R.; Alaoui, A.H. Rainfall-Runoff calibration for semi-arid ungauged basins based on the cumulative observed hyetograph and SCS Storm model: Application to the Boukhalef watershed (Tangier, North Western Morocco). J. Mater. Environ. Sci. 2017, 8, 3795–3808. [Google Scholar]
  22. Li, X.; Cheng, G.; Ge, Y.; Li, H.; Han, F.; Hu, X.; Tian, W.; Tian, Y.; Pan, X.; Nian, Y.; et al. Hydrological cycle in the Heihe River Basin and its implication for water resource management in endorheic basins. J. Geophys. Res. Atmos. 2018, 123, 890–914. [Google Scholar] [CrossRef]
  23. Wu, D.; Jia, K.; Zhang, X.; Zhang, J.; El-Hamid, A.; Hazem, T. Remote sensing inversion for simulation of soil salinization based on hyperspectral data and ground analysis in Yinchuan, China. Nat. Resour. Res. 2021, 30, 4641–4656. [Google Scholar] [CrossRef]
  24. Pandey, B.W.; Prasad, A.S. Slope vulnerability, mass wasting and hydrological hazards in Himalaya: A case study of Alaknanda Basin, Uttarakhand. Terræ Didat. 2018, 14, 395–404. [Google Scholar] [CrossRef]
  25. Abd El-Kawy, O.R.; Rød, J.K.; Ismail, H.A.; Suliman, A.S. Land use and land cover change detection in the western Nile delta of Egypt using remote sensing data. Appl. Geogr. 2011, 31, 483–494. [Google Scholar] [CrossRef]
  26. Kirui, K.B.; Kairo, J.G.; Bosire, J.; Viergever, K.M.; Rudra, S.; Huxham, M.; Briers, R.A. Mapping of mangrove forest land cover change along the Kenya coastline using Landsat imagery. Ocean. Coast. Manag. 2013, 83, 19–24. [Google Scholar] [CrossRef]
  27. Sánchez-Cuervo, A.M.; Aide, T.M.; Clark, M.L.; Etter, A. Land cover change in Colombia: Surprising forest recovery trends between 2001 and 2010. PLoS ONE 2012, 7, e43943. [Google Scholar] [CrossRef] [PubMed]
  28. Napierała, T.; Leśniewska-Napierała, K.; Cotella, G. Theoretical Fundamentals of Sustainable Spatial Planning of European Tourism Destinations. In Contemporary Challenges of Spatial Planning in Tourism Destinations; Napierała, T., Leśniewska-Napierała, K., Cotella, G., Eds.; The SPOT Project: Lodz, Poland, 2022; pp. 7–15. [Google Scholar] [CrossRef]
  29. Oral, H.V. Land Use Change Analysis of Erdemli-Kızkalesi Region by Using GIS Methodology. Master’s Thesis, Boğaziçi University, İstanbul, Türkiye, 10 July 2002. [Google Scholar]
  30. Phan, T.N.; Kuch, V.; Lehnert, L.W. Land Cover Classification using Google Earth Engine and Random Forest Classifier—The Role of Image Composition. Remote Sens. 2020, 12, 2411. [Google Scholar] [CrossRef]
  31. Liu, C.; Li, W.; Zhu, G.; Zhou, H.; Yan, H.; Xue, P. Land Use/Land Cover Changes and Their Driving Factors in the Northeastern Tibetan Plateau Based on Geographical Detectors and Google Earth Engine: A Case Study in Gannan Prefecture. Remote Sens. 2020, 12, 3139. [Google Scholar] [CrossRef]
  32. Lin, L.; Hao, Z.; Post, C.J.; Mikhailova, E.A.; Yu, K.; Yang, L.; Liu, J. Monitoring land cover change on a rapidly urbanizing island using Google Earth Engine. Appl. Sci. 2020, 10, 7336. [Google Scholar] [CrossRef]
  33. Qu, L.A.; Chen, Z.; Li, M.; Zhi, J.; Wang, H. Accuracy Improvements to Pixel-Based and Object-Based LULC Classification with Auxiliary Datasets from Google Earth Engine. Remote Sens. 2021, 13, 453. [Google Scholar] [CrossRef]
  34. Quintero, N.; Viedma, O.; Urbieta, I.R.; Moreno, J.M. Assessing Landscape Fire Hazard by Multitemporal Automatic Classification of Landsat Time Series Using the Google Earth Engine in West-Central Spain. Forests 2019, 10, 518. [Google Scholar] [CrossRef]
  35. Lasaponara, R.; Abate, N.; Fattore, C.; Aromando, A.; Cardettini, G.; Di Fonzo, M. On the Use of Sentinel-2 NDVI Time Series and Google Earth Engine to Detect Land-Use/Land-Cover Changes in Fire-Affected Areas. Remote Sens. 2022, 14, 4723. [Google Scholar] [CrossRef]
  36. Lee, J.; Cardille, J.A.; Coe, M.T. BULC-U: Sharpening Resolution and Improving Accuracy of Land-Use/Land-Cover Classifications in Google Earth Engine. Remote Sens. 2018, 10, 1455. [Google Scholar] [CrossRef]
  37. Tassi, A.; Vizzari, M. Object-Oriented LULC Classification in Google Earth Engine Combining SNIC, GLCM, and Machine Learning Algorithms. Remote Sens. 2020, 12, 3776. [Google Scholar] [CrossRef]
  38. Mahdianpari, M.; Jafarzadeh, H.; Granger, J.E.; Mohammadimanesh, F.; Brisco, B.; Salehi, B.; Homayouni, S.; Weng, Q. A large-scale change monitoring of wetlands using time series Landsat imagery on Google Earth Engine: A case study in Newfoundland. GIScience Remote Sens. 2020, 57, 1102–1124. [Google Scholar] [CrossRef]
  39. Ji, Q.; Liang, W.; Fu, B.; Zhang, W.; Yan, J.; Lü, Y.; Yue, C.; Jin, Z.; Lan, Z.; Li, S.; et al. Mapping Land Use/Cover Dynamics of the Yellow River Basin from 1986 to 2018 Supported by Google Earth Engine. Remote Sens. 2021, 13, 1299. [Google Scholar] [CrossRef]
  40. Matarira, D.; Mutanga, O.; Naidu, M. Google Earth Engine for Informal Settlement Mapping: A Random Forest Classification Using Spectral and Textural Information. Remote Sens. 2022, 14, 5130. [Google Scholar] [CrossRef]
  41. Oliphant, A.J.; Thenkabail, P.S.; Teluguntla, P.; Xiong, J.; Gumma, M.K.; Congalton, R.G.; Yadav, K. Mapping cropland extent of Southeast and Northeast Asia using multi-year time-series Landsat 30-m data using a random forest classifier on the Google Earth Engine Cloud. Int. J. Appl. Earth Obs. Geoinf. 2019, 81, 110–124. [Google Scholar] [CrossRef]
  42. Teluguntla, P.; Thenkabail, P.S.; Oliphant, A.; Xiong, J.; Gumma, M.K.; Congalton, R.G.; Yadav, K.; Huete, A. A 30-m landsat-derived cropland extent product of Australia and China using random forest machine learning algorithm on Google Earth Engine cloud computing platform. ISPRS J. Photogramm. Remote Sens. 2018, 144, 325–340. [Google Scholar] [CrossRef]
  43. Batar, A.K.; Watanabe, T.; Kumar, A. Assessment of Land-Use/Land-Cover Change and Forest Fragmentation in the Garhwal Himalayan Region of India. Environments 2017, 4, 34. [Google Scholar] [CrossRef]
  44. Li, Y.; Liu, G.; Huang, C. Dynamic Changes Analysis and Hotspots Detection of Land Use in the Central Core Functional Area of Jing-Jin-Ji from 2000 to 2015 Based on Remote Sensing Data. Math. Probl. Eng. 2017, 2017, 2183585. [Google Scholar] [CrossRef]
  45. Zhang, B.; Zhang, Q.; Feng, C.; Feng, Q.; Zhang, S. Understanding Land Use and Land Cover Dynamics from 1976 to 2014 in Yellow River Delta. Land 2017, 6, 20. [Google Scholar] [CrossRef]
  46. Munthali, M.G.; Botai, J.O.; Davis, N.; Adeola, M.A. Multi-temporal Analysis of Land Use and Land Cover Change Detection for Dedza District of Malawi using Geospatial Techniques. Int. J. Appl. Eng. Res. 2019, 14, 1151–1162. [Google Scholar]
  47. Fan, Y.; Zhu, X.; Zhang, S.; Gao, J.; Chen, F.; Peng, X.; Li, J. Urban Expansion Assessment in Huaihe River Basin, China, from 1998 to 2013 Using Remote Sensing Data. J. Sens. 2017, 2017, 9281201. [Google Scholar] [CrossRef]
  48. Bera, S.; Chatterjee, N.D. Mapping and monitoring of land use dynamics with their change hotspot in North 24-Parganas district, India: A geospatial and statistical-based approach. Model. Earth Syst. Environ. 2019, 5, 1529–1551. [Google Scholar] [CrossRef]
  49. Zhao, Y.; Zhang, K.; Fu, Y.; Zhang, H. Examining Land-Use/Land-Cover Change in the Lake Dianchi Watershed of the Yunnan-Guizhou Plateau of Southwest China with Remote Sensing and GIS Techniques: 1974–2008. Int. J. Environ. Res. Public Health 2012, 9, 3843–3865. [Google Scholar] [CrossRef] [PubMed]
  50. Mohamed, A.; Worku, H. Quantification of the land use/land cover dynamics and the degree of urban growth goodness for sustainable urban land use planning in Addis Ababa and the surrounding Oromia special zone. J. Urban Manag. 2019, 8, 145–158. [Google Scholar] [CrossRef]
  51. Chen, H.; Chen, C.; Zhang, Z.; Lu, C.; Wang, L.; He, X.; Chu, Y.; Chen, J. Changes of the spatial and temporal characteristics of land-use landscape patterns using multi-temporal Landsat satellite data: A case study of Zhoushan Island, China. Ocean Coast. Manag. 2021, 213, 105842. [Google Scholar] [CrossRef]
  52. Wang, Y.; Xia, T.; Shataer, R.; Zhang, S.; Li, Z. Analysis of Characteristics and Driving Factors of Land-Use Changes in the Tarim River Basin from 1990 to 2018. Sustainability 2021, 13, 10263. [Google Scholar] [CrossRef]
  53. Hu, Z.; Du, P.; Guo, D. Analysis of Urban Expansion and Driving Forces in Xuzhou City Based on Remote Sensing. J. China Univ. Min. Technol. 2007, 17, 267–271. [Google Scholar] [CrossRef]
  54. Levent, T.; Sarıkaya Levent, Y.; Birdir, K.; Sahilli Birdir, S. Spatial Planning System in Turkey: Focus on Tourism Destinations. In Contemporary Challenges of Spatial Planning in Tourism Destinations; Napierała, T., Leśniewska-Napierała, K., Cotella, G., Eds.; The SPOT Project: Lodz, Poland, 2022; pp. 111–140. [Google Scholar] [CrossRef]
  55. Yolal, M. History of Tourism Development in Turkey. In Alternative Tourism in Turkey: Role, Potential Development and Sustainability; Egresi, I., Ed.; Springer: Cham, Switzerland, 2019; pp. 23–33. [Google Scholar] [CrossRef]
  56. Tarhan, C. Tourism Policies; Bilkent University: Ankara, Türkiye, 1999. [Google Scholar]
  57. Atça Tonbil, S. Türkiye’de Turizm Politikası ve Planlaması [Tourism Policy and Planning in Turkey]. Master’s Thesis, İstanbul University, İstanbul, Türkiye, 4 September 2019. [Google Scholar]
  58. Oskay, C. Mersin Turizminin Türkiye Ekonomisindeki Yeri ve Önemi [The Importance and Place of Tourism in Mersin in Turkish Economy]. Çukurova Üniversitesi Sos. Bilim. Enstitüsü Derg. 2012, 21, 185–202. [Google Scholar]
  59. Afşar, A. Türkiye Turizm Sektöründe Konaklama İşletmelerinin Finansal Analizi [Financial Analysis of Accommodation Establishments in Tourism Sector in Turkey]. Anadolu Üniversitesi İktisadi Ve İdari Bilim. Fakültesi Derg. 2002, 18, 147–166. [Google Scholar]
  60. Coşgun, M.; Alkan, A.D. Liberalleşme Eğilimlerinin Turizm Sektörüne Etkileri: Türkiye Örneği [The Effects of Libaralisation Approach on Tourism Industry: Case of Turkey]. Sivas Interdisip. Tur. Araştırmaları Derg. 2020, 5, 37–62. [Google Scholar]
  61. Ministry of Culture and Tourism. Tourism Strategy of Tukey 2023; Ministry of Culture and Tourism: Ankara, Türkiye, 2007. Available online: https://www.ktb.gov.tr/Eklenti/43537,turkeytourismstrategy2023pdf.pdf (accessed on 27 October 2023).
  62. State Planning Organisation. 9. Kalkınma Planı 2007–2013 [9th National Development Plan 2007–2013]; Official Gazette no. 26215: Ankara, Türkiye, 2006. Available online: https://www.sbb.gov.tr/wp-content/uploads/2022/07/Dokuzuncu_Kalkinma_Plani-2007-2013.pdf (accessed on 27 October 2023).
  63. Mersin Chamber of Commerce and Industry. Mersin Bölgesel İnovasyon Stratejisi 2006–2016 [Mersin Regional Innovation Strategy 2006–2016]; Mersin Chamber of Commerce and Industry: Mersin, Türkiye, 2008; Available online: https://oda.mtso.org.tr/files/mersin_inovasyon_stratejisi.pdf (accessed on 27 October 2023).
  64. Levent, T.; Sarıkaya Levent, Y. RIS-Mersin Projesi ve Mersin Bölgesel Yenilik Stratejisi: Yenilik Üzerine Yerel Bir Değerlendirme [RIS-Mersin Project and Mersin Regional Innovation Strategy: A Local Evaluation on Innovation]. In TÜCAUM VII. Ulusal Coğrafya Sempozyumu, Ankara, Turkey, 18–19 October 2012; Ankara University: Ankara, Türkiye, 2012. [Google Scholar]
  65. Gök, T. RIS Mersin Projesi Üzerine Bir Özet Değerlendirme [A Short Evaluation on RIS Mersin Project]. Planlama 2009, 3–4, 93–95. [Google Scholar]
  66. Mersin Special Provincial Administration. Mersin İli Turizm Master Planı [Mersin Province Tourism Master Plan]. Mersin. 2010. Available online: http://www.mersin.gov.tr/kurumlar/mersin.gov.tr/Genel/depo/ARASTIRMA_RAPORU(1).pdf (accessed on 27 October 2023).
  67. Metin, H. Social and Institutional Impacts of Mersin Regional Innovation Strategy: Stakeholders’ Perspective. Master’s Thesis, Middle East Technical University, Ankara, Türkiye, 28 April 2010. [Google Scholar]
  68. Çukurova Development Agency. Çukurova Bölge Planı 2014–2023 [Çukurova Regional Plan 2014–2023]. Adana. 2015. Available online: https://www.cka.org.tr/uploads/pages_v/2014--2023-cukurova-bolge-plani.pdf (accessed on 27 October 2023).
  69. Ministry of Environment and Urbanization. Mersin–Adana Planlama Bölgesi 1/100,000 Ölçekli Çevre Düzeni Planı Açıklama Raporu [Mersin–Adana Planning Region 1/100,000 Scale Environmental Plan Report]. Ankara. 2013. Available online: http://webdosya.csb.gov.tr/db/mpgm/editordosya/file/Mersin-Adana%20Planlama%20Bolgesi/PLAN_ACIKLAMA_RAPORU.pdf (accessed on 22 November 2023).
  70. Ministry of Environment and Urbanization. Mersin–Adana Planlama Bölgesi 1/100,000 Ölçekli Çevre Düzeni Planı Revizyonu (Mersin İli) Plan Açıklama Raporu [Mersin–Adana Planning Region 1/100,000 Scale Environmental Plan Revision (Mersin Province) Plan Report]. Ankara. 2017. Available online: https://webdosya.csb.gov.tr/db/mpgm/editordosya/file/CDP_100000/ma/PLANACIKLAMARAPORU_mersinrevizyon_03042017.pdf (accessed on 27 October 2023).
  71. Ministry of Environment and Urbanization. Mersin–Adana Planlama Bölgesi 1/100,000 Ölçekli Çevre Düzeni Planı Revizyonu Plan Hükümleri [Mersin–Adana Planning Region 1/100,000 Scale Environmental Plan Revision Plan Provisions]. Ankara. 2017. Available online: https://webdosya.csb.gov.tr/db/mpgm/editordosya/file/CDP_100000/ma/PLANHUKUMLERI_03042017.pdf (accessed on 27 October 2023).
  72. Kızkalesi Town Municipality. Kızkalesi Town Municipality Council Decision no.23 Dated on 23 December 2013; Mersin Metropolitan Municipality Archive: Mersin, Türkiye, 2013. [Google Scholar]
  73. Özüpekçe, S. Turizme Bağlı Olarak Büyüyen Bir Yerleşme: Kızkalesi, Erdemli/ Mersin [A Settlement Growing Depending on Tourism: Kızkalesi, Erdemli/ Mersin]. In VIII. National IV. International Eastern Mediterranean Tourism Symposium, Mersin, Turkey, 19–20 April 2019; Mersin University: Mersin, Türkiye, 2019. [Google Scholar]
  74. Turkish Statistical Institute (TSI). Adrese Dayalı Nüfus Kayıt Sistemi Veri Tabanı [Address Based Population Registration System Database]. Available online: https://biruni.tuik.gov.tr/medas/?kn=95&locale=tr (accessed on 27 October 2023).
  75. Akpınar, E. 2000 Genel Nüfus Sayımına Eleştirel Bir Bakış: Erzincan Örneği [A Critical View to 2000 General Population Census: Erzincan Case]. Doğu Coğrafya Derg. 2005, 10, 31–45. [Google Scholar]
Figure 1. Location of Kızkalesi in Mersin, and actual distances to settlement centres. Base map © OpenStreetMap.
Land 13 00151 g001
Figure 2. Kızkalesi neighbourhood and its surroundings. Base map © OpenStreetMap.
Land 13 00151 g002
Figure 3. (a) Kızkalesi and the sea castle; photo by Derviş Çömez, 2012. (b) Kızkalesi public beach, and land and sea castles; photo by Hakan Can Şahin, 2020. Photographs are under the licence, and reprinted with the permission from the copyright holder AA-Anadolu Ajansı.
Land 13 00151 g003
Figure 4. Research methodology.
Land 13 00151 g004
Figure 5. Satellite images and LULC classification of the western coastline of Mersin and Kızkalesi.
Land 13 00151 g005
Figure 7. The centre of gravity’s movement for the artificial surface along the western coastline of Mersin and in Kızkalesi from 1984 to 2022.
Land 13 00151 g007
Figure 8. The LULC changes along the western coastline of Mersin in relation to the national policies and regional strategies and plans.
Land 13 00151 g008
Figure 9. The LULC changes in Kızkalesi in relation to the changes in the local administrative system and spatial planning process.
Land 13 00151 g009
Figure 10. Evaluation diagram of the tourism planning process along the western coastline of Mersin and in Kızkalesi for the study periods, between the years 1984 and 2022. Note: The yellow- surfaces are the abstract representations of the annual expansion intensity of each scale based on the study periods. For the actual values, please refer to Figure 11.
Land 13 00151 g010
Figure 11. Annual expansion intensity index for artificial surface along the western coastline and in Kızkalesi for the study periods, from 1984 to 2022.
Land 13 00151 g011
Figure 12. Population changes over the years and the total area (in hectares) of artificial surface for the study periods in Kızkalesi. Prepared by the authors based on data from the Turkish Statistical Institute [74]. Note: The 2000 census was intentionally not used in the analysis due to its low accuracy [75]. The census data was last collected via traditional surveys on 22 October 2000, which could be considered as part of the tourism season for Kızkalesi. The number of residents at that time was counted high due to the presence of summer-house residents in the settlement. Census data collected after the year 2007 were collected digitally and, therefore, are more accurate.
Land 13 00151 g012
Figure 13. The weighted centre of gravity’s movement in Kızkalesi urban node from 1975 to 2021.
Land 13 00151 g013
Figure 14. Kızkalesi during (a,b) the peak season and (c,d) the off-season. Photo (a) by Derviş Çömez, 2019; photo (b) by Derviş Çömez, 2020; photo (c) by Hakan Can Şahin, 2020; photo (d) by Hakan Can Şahin, 2019. Photographs are under the licence, and reprinted with the permission from the copyright holder AA-Anadolu Ajansı.
Land 13 00151 g014
Table 1. Statistics of tourism facilities in Kızkalesi in the years 1994 and 2021 *.
Kızkalesi Tourism
Accommodation Facilities
19942021
NumberBed CapacityNumberBed Capacity
Tourism accommodation establishments **6729851044750
Summer houses ***856342418147256
Total9286409191812,006
* Prepared by the authors based on data obtained from [13] and from the Kızkalesi Culture and Tourism Association in 2021. ** Tourism accommodation establishments include hotels, motels, pensions, and camping areas that are licenced by the Ministry of Culture and Tourism or the Mersin Metropolitan Municipality. *** The bed capacity of summer houses determined by the assumption that a summer house has an average capacity of four beds.
Table 2. Satellite images and accuracy values for given years—summarised report. Please refer to the Supplementary Materials for details of the image information.
Satellite ImageNumber of Images Used for Image CompositionYearOverall AccuracyKappa Coefficient
Landsat 5 TM3019840.810.80
Landsat 5 TM4319940.850.81
Landsat 7 ETM+920040.820.81
Landsat 7 ETM+2420110.960.95
Landsat 8 OLI/TIRS 4420220.900.88
Table 3. Area (in hectares) of LULC classifications along the western coastline of Mersin, with reference to the boundaries of the western coastline maps in Figure 5.
Western
Coastline
19841994200420112022
Area%Area%Area%Area%Area%
Artificial surface247.682.08246.422.07295.472.48428.313.60708.575.95
Vegetation4659.1239.114321.4436.272799.0923.493108.8726.092659.5922.32
Forest1622.7913.621974.5116.573426.2128.762980.9825.023154.8626.48
Water surface 5384.1645.195371.3845.095392.9845.275395.5945.295390.7345.25
Table 4. Area (in hectares) of LULC classifications in Kızkalesi, with reference to the boundaries of the western coastline maps in Figure 5.
Kızkalesi19841994200420112022
Area%Area%Area%Area%Area%
Artificial Surface 8.372.7111.163.6232.4910.5443.2014.0153.3717.31
Vegetation99.0932.1496.8431.4172.4523.5066.6021.6047.9715.56
Forest54.2717.6053.1017.2257.5118.6554.9917.8361.3819.91
Water Surface 146.6147.55147.2447.75145.8947.31143.5546.56145.6247.23
Table 7. Single dynamics index of LULC changes along the western coastline (WC) and in Kızkalesi from 1984 to 2022.
LULC Class1984–19941994–20042004–20112011–20221984–2022
WCKızkalesiWCKızkalesiWCKızkalesiWCKızkalesiWCKızkalesi
Artificial surface−0.053.331.9919.116.424.715.952.144.9014.15
Vegetation−0.72−0.23−3.52−2.521.58−1.15−1.31−2.54−1.13−1.36
Forest2.17−0.227.350.83−1.86−0.630.531.062.480.34
Water surface−0.020.040.04−0.090.01−0.23−0.010.130.00−0.02
Table 8. Tourism-planning-related policies, strategies, and planning documents and their impact on tourism development along the western coastline of Mersin.
YearDocument Scale/Type Decision on Western Coastline/in Kızkalesi
1982Law No. 2634 on Tourism Incentives National level
Legal document
Increase in the number of summer houses constructed
1988Western İçel Coastal Development Plan Regional level
1/25,000-scale spatial plan
Increase in the numbers of summer houses and tourism facilities constructed
2005The Implementation Plan of KızkalesiLocal level
1/1000-scale spatial plan
Increase in building heights up to 5 storeys, new development areas in the southern part of the D-400 Highway
20069th National Development Plan 2007–2013 National level
Strategic document
Tourism as one of the basic economic sectors to be supported
2007Tourism Strategy of Turkey 2023 National level
Strategic document
Tourism centres on the western coastline declared
2010Mersin Tourism Master Plan (RIS-Mersin)Regional level
Strategic document
Tourism as one of the three pillars of the regional/local economy
2013 Adana—Mersin Planning Region Environmental Master Plan Regional level
1/100,000-scale spatial plan
New tourism development zones, especially for the construction of summer houses
2013The Revised Implementation Plan of Kızkalesi Local level
1/1000-scale spatial plan
Increase in building heights up to 14 storeys, new development areas in the northern part of the D-400 Highway, main land-use category proposed as “preferential land-use areas”
2014Çukurova Regional Plan 2014–2023 Regional level
Strategic document
Maintaining the existing situation along the western coastline
2017Adana—Mersin Planning Region Environmental Master Plan Revision (Mersin province) Regional level
1/100,000-scale spatial plan
Maintaining the existing situation along the western coastline
Disclaimer/Publisher’s Note: The statements, opinions and data contained in all publications are solely those of the individual author(s) and contributor(s) and not of MDPI and/or the editor(s). MDPI and/or the editor(s) disclaim responsibility for any injury to people or property resulting from any ideas, methods, instructions or products referred to in the content.

