Abstract
As the largest ecological carbon sequestration systems on the Earth, forests play a significant role in reducing carbon dioxide, and countries around the world are actively expanding their forest areas. However, China’s carbon emissions and forest area have shown an upward trend, which has seriously hindered the implementation of forestry carbon sequestration projects. This paper analyzed the temporal variation, spatial distribution, and deviation degree of the forest area and carbon emissions in China from 2004 to 2020 by using a decoupling model and a coordination model. Firstly, according to the decoupling model, the national carbon emissions and forest area are negatively decoupled. At the provincial level, Beijing, Shanghai, Jiangsu, Guizhou, Yunnan, and Gansu have weak decoupling. Expansive link areas include Shanxi, Henan, Hubei, Ningxia, and Xinjiang. The other 19 provinces show expansive negative decoupling. Secondly, according to the coordination model, national carbon emissions are coordinated to the forest area. Zhejiang, Fujian, Jiangxi, and Guangdong are basically coordinated provinces. More coordinated provinces include Ningxia. The other 25 provinces are coordinated provinces. Finally, according to the comprehensive measurement model, Inner Mongolia, Qinghai, Shaanxi, Hainan, Jilin, Anhui, Liaoning, and Heilongjiang are high-quality expansive negative decoupling provinces. Chongqing, Hunan, Tianjin, Shandong, Hebei, and Guangxi are moderate to strong expansive negative decoupling provinces. This study not only provides a new perspective for analyzing forest carbon sinks, but also provides theoretical guidance for enhancing the natural carbon sink capacity, helping to achieve global carbon peak and carbon neutrality goals.
1. Introduction
Forests, as the largest ecological carbon sequestration systems on the Earth, play an irreplaceable regulatory role in the global carbon cycle and carbon accumulation process [,,]. Forest carbon sequestration systems have the features of being clean, low cost, stable, and sustainable [,]. Due to its low cost, China has implemented afforestation projects and encouraged all sectors of society to participate in afforestation activities. According to the China Environmental Statistics Yearbook 2005 and China Environmental Statistics Yearbook 2021, China’s forest area increased from 195 million hectares in 2004 to 220 million hectares in 2020, an increase of 25 million hectares. The increased area of forests in China ranks first in the world.
The increase in the forest area has improved the ecological carbon sequestration capacity and absorbed a large amount of carbon dioxide [,,,,]. However, according to the World Resources Institute 1, China’s carbon dioxide emissions increased from 4808 million tons in 2004 to 9848 million tons in 2020, an increase of 5040 million tons, accounting for 105.8% in 2004. China’s carbon emissions have not decreased with the increase in the forest area and have even shown a phenomenon of simultaneous growth of carbon emissions and the forest area.
The increase in forests has played an essential role in carbon sequestration, but the change in carbon emissions and forest area in China has occurred in the same direction. Forest carbon sequestration has been developed into a tradable carbon sequestration project because of its great advantages [,]. Various regions are accelerating the implementation of forest carbon sink projects. However, the inability to sort out the relationship between the forest area and carbon emissions not only hinders the integration of forest carbon sinks with other carbon reduction methods, but also interferes with the distribution of carbon reduction responsibilities and income equity among regions []. In addition, due to the great heterogeneity in geographical conditions and economic development models among provinces, the forest area and carbon emissions vary from area to area. Therefore, what are the spatiotemporal trends for the forest area and carbon emissions in China? What is the degree of decoupling between the forest area and carbon emissions in each region? What are the essential reasons for the differences in the decoupling relationship between the forest area and carbon emissions in different regions? Under the background of uneven distribution of carbon emission reduction responsibilities in all regions, we urgently need to analyze the relationship types for the forest area and carbon emissions in each region to improve the ecological carbon sequestration policies in each region.
Some analyses of the relationship between the forest area and carbon emissions are present in the existing literature, and the linear regression model has been widely used. For example, Raihan and Tuspekova [] used a linear model to find that Kazakhstan’s carbon emissions have decreased due to the increase in the forest area. Some scholars have also used decomposition models to verify the relationship between the forest area and carbon emissions. Mandal, et al. [] established a dynamic model of forest carbon storage, litter carbon, and the soil organic carbon pool and found that India’s forest area has reduced carbon emissions. Based on the decomposition model of carbon fixation, Sasaki, et al. [] found that Cambodia’s forest coverage increased carbon sinks and thus reduced net carbon emissions. Both linear regression models and decomposition models are linear analysis methods. However, linear analysis can only be used for qualitative analysis, and there is a shortage of quantitative thinking. Qualitative analysis can only reveal the average relationship between the forest area and carbon emissions and cannot reveal the relationships between different quantitative characteristics of the forest area and carbon emissions. Therefore, this paper applied the decoupling model and coordination model to analyze the decoupling degree of the forest area and carbon emissions in China. Then, we verified and enriched the research contents of the forest area and carbon emissions in various regions of China. The research contributions can be summarized as follows: (1) The temporal and spatial characteristics of the forest area and carbon emissions in China were revealed; (2) the decoupling relationship between China’s forest area and carbon emissions was evaluated and analyzed; and (3) according to the coordination degree model, the coordination relationship between the forest area and carbon emissions was analyzed.
The second part is the data source, decoupling model, and coordination model. The third part reports and discusses the types of decoupling and coordination between carbon emissions and the forest area. The fourth part is the conclusion and policy recommendations.
2. Data and Methods
2.1. Data Source
Forest area data in this paper come from the China Environmental Statistics Yearbooks from 2005 to 2021, and carbon emissions data come from the Public Environmental Research Center: https://www.ipe.org.cn/MapLowCarbon/LowCarbon.html?q=5(accessed on 20 May 2023). The authors manually compiled the carbon emissions for each province.
2.2. Methods
2.2.1. Decoupling Model
The decoupling models commonly used in the existing literature include the decoupling model proposed by the OECD and the decoupling model proposed by Tapio [,]. The OECD decoupling model emphasizes the comparison of the change rates for the two variables of the starting and ending years. The Tapio decoupling model can reflect the decoupling relationship between two variables in different years and has been widely used in the field of environmental issues. This paper combines the decoupling calculation model and the Tapio decoupling coefficient definition table to construct a decoupling model of the average annual change rate for carbon emissions relative to the average annual change rate for the forest area. The relationship between carbon emissions and forest area in China from 2004 to 2020 was analyzed. The decoupling coefficient was used to reflect whether China’s carbon emissions are compatible with the forest area. The decoupling model can be expressed as follows:
where n is the nth year; is the decoupling coefficient between carbon emissions and the forest area in year n + 1; is the carbon emissions in year n + 1; is the carbon emissions in the nth year; is the forest area in year n + 1; and is the forest area in the nth year.
According to Xia et al. and Tapio [,], 0.8 and 1.2 can be used as values to classify the decoupling type. Combining the changes in carbon emissions and the forest area, the decoupling types for carbon emissions and the forest area in each province can be divided into eight categories (Table 1):
- (1)
- Strong decoupling refers to the increase in the forest area and the decrease in carbon emissions;
- (2)
- Weak decoupling means that both forest area and carbon emissions increase, but the growth rate of the forest area is less than that of carbon emissions;
- (3)
- Expansive link means that carbon emissions increase similarly to the forest area growth;
- (4)
- Expansive negative decoupling means that both carbon emissions and the forest area increase, but carbon emissions increase faster than the forest area;
- (5)
- Strong negative decoupling refers to the decrease in the forest area and the increase in carbon emissions;
- (6)
- Weak negative decoupling is when both the forest area and carbon emissions are decreasing, and the rate of decline for carbon emissions is slower than that for the forest area;
- (7)
- Recessive link means that carbon emissions and forest area are reduced at similar rates;
- (8)
- Recessive decoupling refers to reductions in the forest area and carbon emissions, but the reduction rate of carbon emissions is greater than the reduction rate of the forest area.
The decoupling classification is shown in the following table:

Table 1.
Definition of the decoupling degree.
Table 1.
Definition of the decoupling degree.
| Decoupling State | RC | RF | α | |
|---|---|---|---|---|
| Negative decoupling | Expansive negative decoupling | >0 | >0 | >1.2 |
| Strong negative decoupling | >0 | <0 | <0 | |
| Weak negative decoupling | <0 | <0 | 0 < α < 0.8 | |
| Decoupling | Weak decoupling | >0 | >0 | 0 < α < 0.8 |
| Strong decoupling | <0 | >0 | <0 | |
| Recessive decoupling | <0 | <0 | >1.2 | |
| Link | Expansive link | >0 | >0 | 0.8 < α < 1.2 |
| Recessive link | <0 | <0 | 0.8 < α < 1.2 | |
2.2.2. Coordination Degree Model
The coordination degree model can be used to calculate the coordination degree between the forest area and carbon emissions, which reflects the changing trend from disorder to order in the system. The coordination model between the forest area and carbon emissions established is as follows:
where x is the average annual rate of change in carbon emissions; y is the annual average rate of change in the forest area; and is the degree of coordination between carbon emissions and the forest area. The value of is generally between −1.414 and 1.414. The type of coordination between carbon emissions and the forest area is shown in Table 2:
Table 2.
The type of coordination degree.
3. Results and Discussion
3.1. Temporal Changes in the Forest Area and Carbon Emissions from 2004 to 2020
As shown in Figure 1, China’s forest area showed an increasing trend from 2004 to 2020. The forest area increased from 15,456.73 million hectares in 2004 to 22,654.32 million hectares in 2020, an increase of 7197.59 million hectares, with an average annual increase of 449.85 million hectares and an average annual growth rate of 2.418%. The increasing trend for the forest area was relatively stable. The continuous growth of forest areas was related to the joint participation of the Chinese government, enterprises, and the public. In 2003, the concept of sustainable development was positioned as the guiding ideology for China’s development, and the Chinese government increased investment in afforestation. In 2012, “Green water and green mountains are golden mountains and silver mountains” became the new guiding ideology for China’s development, which further emphasized the importance of ecosystems for economic and social development. The Chinese government increased the investment in the protection and restoration of forest ecosystems and increased the forest area through a combination of artificial and natural afforestation. In addition, the China business community has recognized the importance of green development and built a good corporate image by increasing public welfare investment. For example, Alibaba set up a special green fund for afforestation. With the continuous improvement in environmental awareness, the public continues to participate in afforestation activities. With the participation of the above-mentioned multiparties, China’s forest area is increasing continuously. According to the ninth national forest resources inventory report, China ranks first in the world in the area of artificial afforestation.
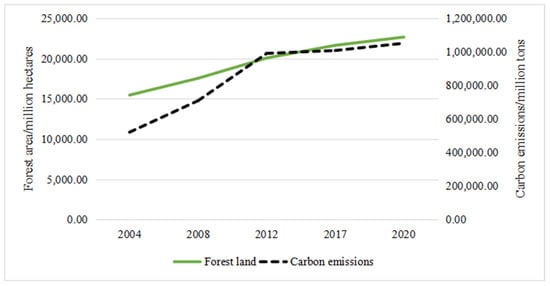
Figure 1.
Change trend for China’s forest area and carbon emissions from 2004 to 2020.
From 2004 to 2020, China’s carbon emissions showed a continuous growth trend. The carbon emissions increased from 521,031.69 million tons in 2004 to 1,050,662.84 million tons in 2020, with an average annual increase of 33,101.94,688 million tons and an average annual growth rate of 4.481%. In different periods, the trend for carbon emissions in China differed. The first period, from 2004 to 2012, saw a higher growth rate for carbon emissions. The carbon emissions increased from 521,031.69 million tons in 2004 to 990,266.6 million tons in 2012, with an average annual increase of 58,649.36 million tons and an average annual growth rate of 8.3574%. The second stage, from 2012 to 2020, was a period of slower growth in carbon emissions. Carbon emissions increased from 990,266.6 million tons in 2012 to 1,050,662.84 million tons in 2020, an increase of 60,436.27 million tons, with an average annual increase of 7554.53375 million tons and an average annual growth rate of 0.7432%. China’s forest area is increasing, and the absorption of carbon dioxide from the air is also increasing. However, since the reform and opening up, industrialization and urbanization have increased carbon emissions. The amount of carbon emitted has been far greater than the amount of carbon dioxide absorbed by ecosystems such as forests, resulting in an increasing amount of carbon dioxide in the air. From 2004 to 2012, China focused on pursuing GDP growth. The economic development mode is the extensive economic development mode. Economic development has consumed a large amount of traditional fossil energy, resulting in a large number of carbon dioxide emissions. In 2012, the new Chinese government came to power, and the concept of green development penetrated the economic and social development systems. China has accelerated the upgrading of industrial structure and technological innovation, accelerated the replacement of old and new kinetic energy, and pursued high-quality development. In order to improve the environmental quality, China has continuously increased the scale of afforestation and implemented various environmental regulation policies, which have reduced the growth rate of carbon emissions.
3.2. Spatial Changes in Carbon Emissions and the Forest Area from 2004 to 2020
From 2004 to 2020, the forest area increased in all provinces in China. Thirty provinces in China were divided into four groups by using the natural breakpoint method provided by ArcGIS. The results are shown in Figure 2.
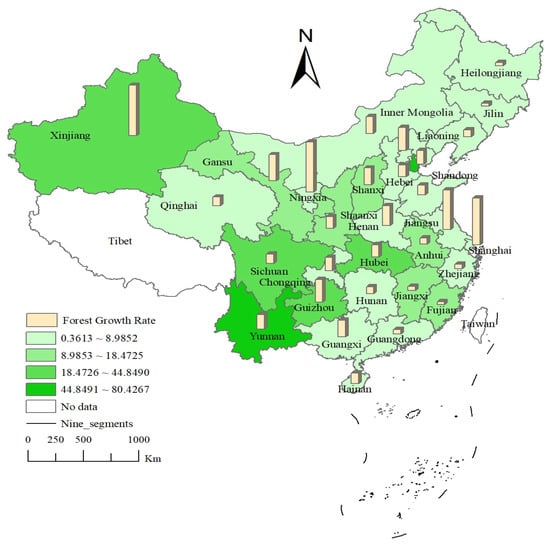
Figure 2.
Spatial pattern for the average growth and the average growth rate of the forest area in China from 2004 to 2020.
Inner Mongolia and Yunnan have had the largest increases in forest area, ranking in the first echelon. From 2004 to 2020, the forest area in Inner Mongolia increased by 80.427 million hectares, and the forest area in Yunnan increased by 56.431 million hectares. The increase in the forest area in these provinces accounted for 29.523% of the increase in the forest area in China. Climatic and geographical conditions have been an important basis for the increase in the forest area in these provinces. Inner Mongolia has always been the largest forestry province in China, especially the Greater Khingan Range, which has the largest forest area in China. The Greater Khingan Range in the eastern part of Inner Mongolia is the boundary between the monsoon climate and nonmonsoon climate. The climatic conditions in the eastern part of Inner Mongolia are suitable for plant growth, including stable light, temperature, moisture, and soil conditions. Relying on natural conditions, Inner Mongolia has been promoting natural forest cultivation, which has increased the forest area. In addition, Inner Mongolia has implemented key ecological projects, such as the construction of the “Three-North” shelterbelt system, returning farmland to forests, and returning grazing land to grassland to promote the construction of artificial forest cultivation. There are many rivers and lakes in Yunnan, and water resources are abundant. The cold zone, temperate zone, and tropical climate meet in Yunnan, resulting in a prominent three-dimensional climate, which provides superior natural conditions for species reproduction and plant growth. Yunnan has simultaneously promoted several measures such as returning farmland to forests, ecological public welfare forests, artificial afforestation, closing hillsides for afforestation, and natural regeneration to increase the forest area.
The second echelon of forest area increases included Xinjiang, Guangxi, Sichuan, and Guizhou. Xinjiang has a complex terrain, including vast deserts, river valleys, and mountains. Xinjiang implemented a pilot project to protect natural forests and stopped cutting down natural forests for commercial use. The natural forest area increased significantly. In order to prevent and control desertification, Xinjiang started ten forestry ecological projects in 2009, which mainly selected tree species for planting according to the regional natural conditions of Xinjiang and protected them with strict planting management measures, thus increasing the forest area in Xinjiang. However, the increases in the forest area in Guangxi, Sichuan, and Guizhou were different from that in Xinjiang. These provinces are located in the southwest of China and have many mountains and rivers, abundant rainfall, complex biodiversity, and a strong ecosystem restoration capacity. Natural forest areas in these areas are expanding as the government invests more in ecosystem restoration. In addition, natural disasters, such as landslides, often occur in these provinces, and the government has increased its investment in artificial afforestation and returning farmland to forests to reduce natural disasters such as landslides and mudslides.
Shaanxi, Gansu, Hunan, Hubei, Heilongjiang, and Henan have undergone significant increases in their forest areas, ranking them in the third echelon. The reasons for the increases in the forest area in these provinces differ. Many areas in Shaanxi and Gansu have loess high slopes, and soil erosion is serious. In order to increase the forest area, local governments have implemented differentiated policies based on the local climate and terrain conditions. The main reasons for the increase in the forest area in Shaanxi are manifold. On the one hand, Shaanxi is located in the Qinling Mountains of China, where the climate is suitable for forest growth. Natural forest cultivation has become the main way to increase vegetation in the Qinling Mountains. On the other hand, soil erosion is very serious in some areas of Shaanxi. Shaanxi has increased its investment in soil erosion control and has planted special tree species through artificial afforestation, increasing the forest area. The terrain in Gansu Province is complex and has the characteristics of great differences in natural conditions. In order to increase the forest area, Gansu has implemented differentiated measures in different regions. Gansu implements a combination of natural afforestation and artificial afforestation on Qilian Mountain. The restoration of the water resources supply system in the southern region of Gansu has been accelerated to provide conditions for vegetation growth. Vegetation planted has been adapted to loess on loess high slopes. The investment in soil and water loss control has been strengthened in the east and middle of Gansu to maintain the soil and water resources in the plateau area. The above measures have effectively increased the forest area in Gansu Province. Hunan, Hubei, and Heilongjiang have similar reasons for increases in the forest area. The abundant black soil resources in Heilongjiang and the abundant rainfall in Hunan and Hubei provide natural conditions for the growth of natural forests. In order to increase the area of the natural forests, these provinces have completely stopped commercial logging and established a system of natural forest protection and maintenance with clear rights and responsibilities. In addition, Hunan and Hubei have vigorously promoted the planting of characteristic tree species on barren hills to increase the forest area.
The increases in the forest area in Shanxi, Jiangxi, Guangdong, Liaoning, Chongqing, Jiangsu, Qinghai, Zhejiang, Fujian, Jilin, Anhui, Shandong, Hebei, Hainan, Ningxia, Beijing, Shanghai, and Tianjin led these provinces to be ranked in the fourth echelon. From the perspective of geographical location, Jiangxi, Guangdong, Liaoning, Jiangsu, Zhejiang, Fujian, Jilin, Anhui, Shandong, Hebei, Hainan, Beijing, Shanghai, and Tianjin are located in the central and eastern regions, accounting for 80% of China’s total population. These provinces have increased their forest areas through investment in forest cultivation projects every year. However, urbanization and industrialization limit the area that these provinces can use for afforestation. As the main inflow provinces of population, these regions have a complete industrial development system and sound industrial structure in China, which puts forward higher requirements for industrial land. These provinces have a high level of urbanization, which has accelerated the development of land, especially housing and construction land, and reduced the area of forestry land. Nevertheless, these areas have increased their forest areas through the combination of artificial forest cultivation and the conversion of farmland to forest. The increases in the forest area in Chongqing, Qinghai, Ningxia, and Shanxi differ from those in the above provinces. Chongqing is located along the Yangtze River and has sufficient water resources. Chongqing has increased the forest area by carrying out ecological restoration work, strengthening water pollution control, and cultivating and promoting the planting of Phoebe nanmu. Qinghai and Ningxia have increased the forest area by focusing on the implementation of a project to return farmland to forests. Shanxi has been developing its local economy by providing coal resources, which has also led to the fragility of its ecological resources. Shanxi has carried out large-scale land greening operations. By selecting suitable tree species, artificial afforestation has increased the forest area.
From 2004 to 2020, carbon emissions in all provinces of China increased. The growth of carbon emissions varied from province to province. As shown in Figure 3, Inner Mongolia, Hebei, Shandong, Jiangsu, Liaoning, Guangdong, and Xinjiang had the largest growth in carbon emissions, which ranked them in the first echelon. The reasons for the growth of carbon emissions in these regions were closely related to local economic development and resource application. Hebei, Shandong, Jiangsu, Liaoning, and Guangdong have undergone relatively high levels of economic development and have relatively sound industrial systems, but most industries are resource-consuming industries. Economic development in these provinces has consumed a large amount of traditional fossil energy, and the carbon emissions are serious. Different from the above regions, Xinjiang and Inner Mongolia have large numbers of coal resources. Xinjiang and Inner Mongolia formed an industrial structure based on the coal industry. The industrial structure focuses on low-end manufacturing, which consumes a lot of resources and has led to a large increase in carbon emissions.
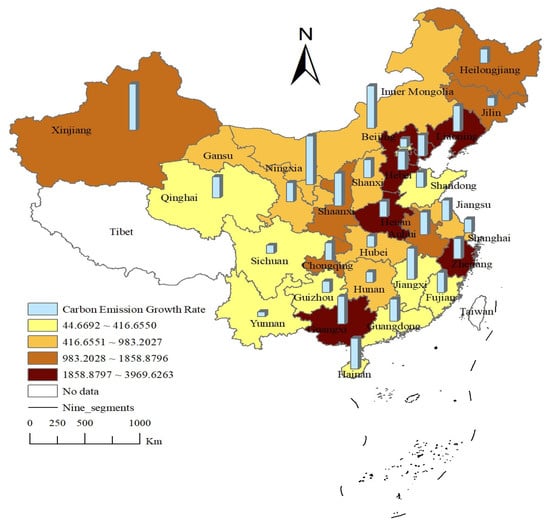
Figure 3.
Spatial pattern for the average growth and the average growth rate of carbon emissions in China from 2004 to 2020.
The provinces with increased carbon emissions in the second echelon included Shanxi, Zhejiang, Shaanxi, Henan, Anhui, Ningxia, Jiangxi, and Fujian. Shanxi has a large number of coal resources, which form the development structure of the heavy industry surrounding coal resources. However, this has also led to a serious imbalance in Shanxi’s industrial structure. In the process of heavy industry development, there was excessive rigid demand for coke resources, resulting in an increase in carbon emissions. Textile, paper, chemical, building materials, steel, and petrochemical industries in Zhejiang have developed rapidly. These industries rely heavily on traditional fossil energy, resulting in an increase in carbon emissions. Shaanxi, Henan, Anhui, Ningxia, Jiangxi, and Fujian are important places for industrial transfer. Due to low environmental regulations, a large number of low-end and high-energy-consuming industries have been transferred to these provinces, which has increased energy consumption, increasing carbon emissions.
The regions in the third echelon of carbon emissions growth include Guangxi, Tianjin, Shanghai, Heilongjiang, Gansu, Hubei, Chongqing, and Guizhou. However, the reasons for the increase in carbon emissions in these regions differ. Shanghai, Tianjin, and Chongqing have undergone high levels of urbanization, and a large number of workers and capital have been gathered. To ensure the operation of urban functions, these regions increased the construction of urban infrastructure systems, which consume a lot of energy and increase carbon emissions. The economic and industrial structure of Guangxi, Heilongjiang, Gansu, Hubei, and Guizhou were relatively backward, and economic development was the main task in these regions. Promoting the transformation of the primary industry to the secondary industry and establishing an industrial production system increased the exploitation and consumption of traditional fossil energy sources, increasing carbon emissions.
Sichuan, Hunan, Jilin, Beijing, Hainan, Yunnan, and Qinghai showed significant growth of carbon emissions, ranking them in the fourth echelon. Beijing transferred its resource-based industries to Hebei and other surrounding areas, but Beijing’s urbanization level has continued to improve. The continuous influx of foreign populations has increased the pressure on Beijing’s infrastructure. Beijing had to increase housing construction and develop transportation services, which consumed a lot of energy and led to an increase in carbon emissions. The increase in carbon emissions in Hainan is closely related to tourism. With the improvement in people’s incomes, Hainan has welcomed many tourists from home and abroad. In order to improve the tourism service system, Hainan has continuously increased the infrastructure for tourism services, such as through housing construction and transportation construction, which has consumed a lot of resources. The reasons for the growth of carbon emissions in Sichuan, Hunan, Jilin, Yunnan, and Qinghai differ from those in the above regions. On the one hand, these provinces have accelerated the process of urbanization, and the population is constantly gathering in cities. The continuous improvement of urban infrastructure construction has consumed a lot of energy. On the other hand, these provinces have continuously upgraded low-end industries, especially accelerating the construction of industrial systems to develop their economies, which has expanded the demand for energy and led to an increase in carbon emissions.
3.3. Relationship between Carbon Emissions and Forest Area in 2004–2020
In order to understand the relationship between China’s forest area and carbon emissions, the decoupling model and coordination model between carbon emissions and forest area were established. According to the decoupling and coordination model, the decoupling index and coordination degree of China’s carbon emissions and forest area from 2004 to 2020 were calculated, and the results are shown in the following table.
The change in the decoupling relationship between carbon emissions and the forest area included three states: weak decoupling, expansive negative decoupling, and expansive link. From a national perspective, China’s carbon emissions and forest area increased from 2004 to 2020, and the growth rate of carbon emissions was greater than that of the forest area. The decoupling coefficient was 1.8531 (Table 3), which is expansive negative decoupling. At the provincial level, Beijing, Shanghai, Jiangsu, Guizhou, Yunnan, and Gansu showed weak decoupling. Both the forest area and carbon emissions were increasing, and the growth rate of the forest area was greater than that of carbon emissions. However, the reasons for weak decoupling in these provinces were different. Beijing, Shanghai, and Jiangsu are economically developed regions with advanced industrial structures and a high level of urbanization. The main reason for the increase in carbon emissions was the consumption of large amounts of energy in order to maintain normal urban operations and increase urban infrastructure construction. The industrial structures of Guizhou, Yunnan, and Gansu are dominated by primary and low-end industries. These provinces have implemented industrial upgrading policies, transforming from the primary industry to industrialization to develop the economy, which increased resource consumption. Shanxi, Henan, Hubei, Sichuan, Ningxia, and Xinjiang were growth links. Both carbon emissions and forest areas increased, and the growth rates of carbon emissions and forest areas increased simultaneously. Other provinces, including Tianjin, Hebei, and Inner Mongolia, all showed negative decoupling of expansion. Both carbon emissions and the forest area increased, and the growth rate of carbon emissions was greater than that of the forest area. These areas increased their forest areas through various measures every year, but most of them were in the growth or mature stage of industrial development. The industrial system was heavily dependent on energy, so the growth rate of carbon emissions was high. In addition, these provinces were in the growth stage of urbanization, and cities were actively expanding infrastructure construction, which consumed a lot of resources, increasing carbon emissions. The above analysis shows that all regions, especially those undergoing expansive negative decoupling, need to further strengthen forest cultivation action to improve the carbon fixation level of their forest ecosystems.
Table 3.
Decoupling coefficient and coordination degree of carbon emissions and the forest area.
According to the coordination degree model, the coordination degree of national carbon emissions and the forest area is 1.355. The national carbon emissions have increased, and the forest area has also increased, both of which are of the coordinated type. At the provincial level, there are three types of coordination: basic coordinated, coordinated, and more coordinated. Zhejiang, Fujian, Jiangxi, and Guangdong are basically coordinated provinces. The growth rate of carbon emissions in these regions has been far greater than the growth rate of the forest area, but the reasons vary from province to province. Zhejiang and Guangdong have developed economies and relatively advanced industrial systems. Industries in these provinces consume a large amount of energy, resulting in a significantly higher growth rate of carbon emissions than the growth rate of the forest area. Urbanization is another reason for the increase in carbon emissions in these provinces. In order to maintain the basic functions of the city, urbanization increased the investment in urban construction, which again consumed a lot of energy and increased carbon emissions. In addition, these provinces are more economically developed, and people consume a lot of goods, which has also increased carbon emissions. Carbon emissions are far greater than the forest ecological carbon sequestration capacity, forming basic coordination between carbon emissions and the forest area. The Fujian and Jiangxi industries are mostly low-end industries, with severe resource dependence. Energy consumption increased during economic development, resulting in significant carbon emissions. In addition, in order to develop the economy, these provinces have taken over some highly polluting industries, resulting in a rapid increase in carbon emissions.
The coordination degree of more coordinated provinces, including Ningxia and Xinjiang, is 1.414. The growth rate of carbon emissions and the forest area is of the coordinated type, indicating that the growth rate of carbon emissions has been approximately equal to the growth rate of the forest area. However, from 2004 to 2020, the average annual growth of carbon emissions in Ningxia was 983.2027 million tons, and that in Xinjiang was 1858.879 million tons, which indicates that the average annual increase in carbon emissions in Xinjiang was much larger than that in Ningxia. The average annual increase in the forest area in Ningxia was 3.532 million hectares, while that in Xinjiang was 44.849 million hectares, which indicates that the average annual increase in the forest area in Xinjiang was much larger than that in Ningxia. For Xinjiang, coal resources are very rich, and the industrial system has formed an upstream and downstream industrial chain centered on coal resources. As a result, Xinjiang consumes a large amount of coal resources, increasing carbon emissions. In recent years, due to the promotion of the top ten forestry ecological projects in Xinjiang, the forest area has increased significantly, which has formed a synchronous growth trend of carbon emissions and the forest area. The background reasons for carbon emissions and the forest area increase in Ningxia are different from those in Xinjiang. Ningxia continued to develop manufacturing to boost economic growth. Manufacturing, especially primary processing manufacturing, consumes a lot of resources and increases carbon emissions. Due to the long-term invasion of sandstorms in Ningxia, the ecological environment is fragile, and the land is barren. Through measures such as returning farmland to forest, natural afforestation, and ecological restoration, Ningxia has promoted the improvement of the ecological environment, increased the forest area, and formed the phenomenon whereby carbon emissions and the forest area increase simultaneously and at the same frequency.
Other provinces, including Beijing, Tianjin, and Hebei, and another 24 provinces, have coordinated carbon emissions and forest areas. The growth rate of the forest area was close to the growth rate of carbon emissions, but the growth rate of the forest area was less than the growth rate of carbon emissions. The fundamental reason for this phenomenon is that these regions continued to promote urbanization and industrialization, consumed a lot of energy, and generated a lot of carbon emissions. Although these provinces continued to increase the forest area through natural forest cultivation, the conversion of farmland to forests, afforestation, and other measures, the carbon dioxide absorbed by the increase in the forest area was far less than the growth rate of carbon dioxide emissions. This also shows that the forest ecosystem presents a saturated state for carbon dioxide absorption. Therefore, the growth rate of carbon emissions was greater than that of the forest area, and there was coordination between carbon emissions and the forest area.
Combining the decoupling model with the coordination degree model can allow more accurate analysis of the coordination degree of carbon emissions and the forest area. This study used the natural breakpoint method provided by GIS to divide the provinces with expansive negative decoupling into high-quality expansive negative decoupling provinces and moderately strong expansive negative decoupling provinces. The results show that
- (1)
- The provinces with moderate to strong expansive negative decoupling include Chongqing, Hunan, Tianjin, Shandong, Hebei, and Guangxi. The annual growth rate of the forest area in these regions was 2.6%, higher than the national average growth rate of 2.418%. The average annual growth rate of carbon emissions in these regions was 3.842%, higher than the national average growth rate of 4.481%. Carbon emissions and the forest area were increasing, but the growth rate of carbon emissions was lower than that of the forest area, which was the main reason for the coordination of carbon emissions and the forest area in these provinces.
- (2)
- Inner Mongolia, Qinghai, Shaanxi, Hainan, Jilin, Anhui, Liaoning, and Heilongjiang showed high-quality negative decoupling of expansion. The annual growth rate of the forest area in these areas was 1.976%, lower than the national average growth rate of 2.418%. The average annual growth rate of carbon emissions in these regions was 5.472%, higher than the national average growth rate of 4.481%. Both carbon emissions and forest areas increased continuously, but the growth rate of carbon emissions was much higher than the growth rate of the forest area, which is the main reason for coordinating carbon emissions and forest area in these provinces.
With the increasing awareness of forest carbon sinks, more and more scholars have focused on the relationship between forests and carbon emissions and the impact of forests on carbon emission reduction. Most of the literature indicates that the forest area has been able to significantly influence carbon emission reduction. For example, Ke, et al. [] (2013) found that forest carbon sinks effectively reduce carbon emissions and help to achieve carbon neutral carbon peaking targets. Qu, et al. [] (2021) indicated that kelp forests effectively increase ocean carbon storage and enhance the value of ocean carbon use. Therefore, expanding the forest area to enhance the ecological carbon sequestration capacity and reduce carbon emissions has become a research consensus [,]. It is important to clarify the relationship between the forest area and carbon emissions in various regions and reveal the reasons behind the differences.
The paper further discusses the background reasons that shape the relationship between the forest area and carbon emissions. The changes in China’s forest area and carbon emissions from 2004 to 2020 were caused by a variety of reasons. The comprehensive effect of various reasons has formed the imbalance between the increase in the forest area and the increase in carbon emissions in China. From the perspective of provinces, diversified causes have also played different roles in increasing carbon emissions and forest areas, which has created heterogeneity across provinces in terms of the carbon emissions increase and forest area increase, leading to different types of decoupling and coordination across provinces.
The decoupling and coordination level of carbon emissions and forest area in each province are affected by the natural conditions, resource endowment, industrial structure, and urbanization of each region. In areas with better natural conditions, such as Heilongjiang, Inner Mongolia, Xinjiang, and Yunnan, the forest area has increased significantly. The forest area of provinces with frequent natural disasters, such as Xinjiang, Inner Mongolia, Gansu, Ningxia, Gansu, Yunnan, and Guizhou, has increased rapidly. The level of urbanization is the main manifestation of economic development and is also an important reason for affecting the growth rate of the forest area. People in provinces with higher urbanization put forward higher requirements for the environment. In order to meet people’s requirements for the environment, the government increased the forest area through artificial forest cultivation. The growth of carbon emissions was also affected by the industrial structure, resource endowment, urbanization, and other aspects of each province. Provinces with complete industrial structures, such as Shandong, Jiangsu, Guangdong, Liaoning and other eastern provinces, consume a lot of resources, showing the largest increases in carbon emissions. In order to develop the economy, provinces with a single industrial structure and a low level of industrial development, such as Jiangxi, Fujian, Shanxi and other provinces, have adopted a large number of energy-intensive industries, resulting in the fastest growth rate of carbon emissions. Provinces with strong resource endowments, such as Xinjiang, Shanxi, Liaoning, and Henan, have developed their economies by consuming a large amount of energy, and their carbon emissions have increased significantly. In addition, the impact of urbanization on carbon emissions cannot be ignored. In order to maintain the urban operation function, regions with a high urbanization level, such as Beijing, Shanghai, Tianjin, and Jiangsu, consume a lot of resources to maintain the infrastructure, thus increasing carbon emissions.
4. Conclusions and Recommendations
Clarifying the relationship between the forest area and carbon emissions will help to promote the implementation of natural carbon sink projects. Based on the comprehensive perspective of the relationship between carbon emissions and the forest area, the temporal characteristics, spatial differences, and decoupling coordination relationship of China’s carbon emissions and forest area changes were analyzed by the decoupling model and coordination model. The main conclusions are as follows: (1) From the perspective of time, China’s carbon emissions and forest area continued to increase in 2004–2020, and the growth rate of carbon emissions in 2012–2020 was lower than that in 2004–2012. In terms of space, carbon emissions and forest areas increased in all provinces. Xinjiang, Inner Mongolia, Hebei, Liaoning, Shandong, Jiangsu, and Guangdong had the largest increases in carbon emissions. Inner Mongolia and Yunnan had the largest increases in forest area. (2) China’s carbon emissions and forest area showed expansive negative decoupling. At the provincial level, Beijing, Shanghai, Jiangsu, Guizhou, Yunnan, and Gansu showed weak decoupling. Shanxi, Henan, Hubei, Sichuan, Ningxia, and Xinjiang were growth links. The other 13 provinces, including Tianjin, Hebei, and Inner Mongolia, all showed negative decoupling of expansion. (3) The national carbon emissions and forest area were coordinated. At the provincial level, the basically coordinated provinces included Zhejiang, Fujian, Jiangxi, and Guangdong. The more coordinated provinces included Ningxia and Xinjiang, and the other 24 provinces, such as Beijing, Tianjin, and Hebei, showed coordinated carbon emissions and forest areas. (4) The provinces with moderately strong expansive negative decoupling included Chongqing, Hunan, Tianjin, Shandong, Hebei, and Guangxi. Inner Mongolia, Qinghai, Shaanxi, Hainan, Jilin, Anhui, Liaoning, and Heilongjiang showed negative decoupling with high-quality expansion.
China has been increasing its forest area through natural and artificial afforestation to improve the carbon sequestration capacity of the ecosystem, leading to the absorption of large amounts of carbon dioxide and improving the environmental quality. However, China’s carbon emissions have not decreased with the increase in the forest area and have even increased simultaneously, which has caused much harm. First, the continuous increase in carbon emissions has destroyed the ecological environment and affected the diversity and stability of species. Secondly, the increase in carbon emissions has reduced the carbon absorption carrying capacity of the ecosystem and the restoration and carbon storage capacity of the ecosystem. All regions of China are faced with the task of reducing carbon emissions. In order to ensure the carbon sequestration capacity of forest ecosystems, the following policy recommendations are proposed: (1) The government forestry department should strengthen the supervision of deforestation and the punishment for deforestation in various regions to prevent the destruction of forest areas; (2) the government, enterprises, and scientific research institutions should jointly cultivate and plant tree species suitable for the natural conditions of each region; (3) considering that social groups have become important participants in afforestation, the government should encourage social groups and individuals to actively participate in afforestation activities by publicizing the significance of carbon sequestration in forest ecosystems; (4) the industrial structure and urbanization level affect energy consumption and carbon emissions. All regions need to promote the transformation from low-level industries to high-level industries and promote the development of high-quality urbanization.
In terms of limitations, (1) forests absorb more carbon dioxide through photosynthesis than they release through respiration. This article analyzed the net effect of forests on carbon dioxide. (2) This paper assumed that forests have the same CO2 absorption capacity. However, different forests have different vegetation characteristics, and there are significant differences in the ability of vegetation to absorb carbon dioxide, which also affects the results. (3) There are differences in the forest distribution in different regions. This paper assumed that forests are distributed according to the same standard among regions, which also affects the bias of the results. In future studies, we will further analyze the differences and distribution of forest species in different regions to further explore the impact of forests on carbon dioxide absorption.
Author Contributions
S.Z.: Writing, data processing. H.S.: Project management, Funding support. X.X.: supervision, assisting in statistical analysis, data collection, and manuscript editing. Z.Y.: assisting in statistical analysis. All authors have read and agreed to the published version of the manuscript.
Funding
This work was supported by National Natural Science Foundation of China (No. 71963030).
Data Availability Statement
Not applicable.
Conflicts of Interest
The authors declare no conflict of interest.
Note
| 1 | https://wri.org.cn/insights/data-viz-6-graphics-ghg-emissions-china (accessed on 20 May 2023). |
References
- Raihan, A.; Muhtasim, D.A.; Farhana, S.; Pavel, M.I.; Faruk, O.; Rahman, M.; Mahmood, A. Nexus between carbon emissions, economic growth, renewable energy use, urbanization, industrialization, technological innovation, and forest area towards achieving environmental sustainability in Bangladesh. Energy Clim. Chang. 2022, 3, 100080. [Google Scholar] [CrossRef]
- Raihan, A.; Muhtasim, D.A.; Pavel, M.I.; Faruk, O.; Rahman, M. Dynamic Impacts of Economic Growth, Renewable Energy Use, Urbanization, and Tourism on Carbon Dioxide Emissions in Argentina. Environ. Process. 2022, 9, 38. [Google Scholar] [CrossRef]
- Teimoory, N.; Sasaki, N.; Abe, I. Estimation of baseline emissions, forest reference emission level, and carbon removals due to forest area changes in Afghanistan between 1993 and 2030. Clean. Prod. Lett. 2022, 2, 100003. [Google Scholar] [CrossRef]
- Kumar, A.; Shabnam, S.; SunitaKumari, P.R. Carbon Sequestration and Carbon Credit. Multilogic Sci. 2018, 3, 50–53. [Google Scholar]
- Mackey, B. Counting trees, carbon and climate change. Significance 2014, 11, 19–23. [Google Scholar] [CrossRef]
- Zhang, Y.; Fu, B. Impact of China’s establishment of ecological civilization pilot zones on carbon dioxide emissions. J. Environ. Manag. 2023, 325, 116652. [Google Scholar] [CrossRef]
- Qiu, S.; Fang, M.; Yu, Q.; Niu, T.; Liu, H.; Wang, F.; Xu, C.; Ai, M.; Zhang, J. Study of spatialtemporal changes in Chinese forest eco-space and optimization strategies for enhancing carbon sequestration capacity through ecological spatial network theory. Sci. Total Environ. 2023, 859, 160035. [Google Scholar] [CrossRef]
- Cai, W.; Xu, L.; Li, M.; Li, O.J.; He, N. Imbalance of inter-provincial forest carbon sequestration rate from 2010 to 2060 in China and its regulation strategy. J. Geogr. Sci. 2023, 33, 3–17. [Google Scholar] [CrossRef]
- Yin, S.; Gong, Z.; Gu, L.; Deng, Y.; Niu, Y. Driving forces of the efficiency of forest carbon sequestration production: Spatial panel data from the national forest inventory in China. J. Clean. Prod. 2022, 330, 129776. [Google Scholar] [CrossRef]
- Zhao, M.; Kong, Z.-h.; Escobedo, F.J.; Gao, J. Impacts of urban forests on offsetting carbon emissions from industrial energy use in Hangzhou, China. J. Environ. Manag. 2010, 91, 807–813. [Google Scholar] [CrossRef]
- Ba, F.; Liu, J.; Zhu, T.; Liu, Y.; Zhao, J. CDM forest carbon sequestration projects in western China: An analysis using actor-centered power theory. For. Policy Econ. 2020, 115, 102139. [Google Scholar] [CrossRef]
- Yang, F.; Paudel, K.P.; Cheng, R.; Qiu, L.; Zhuang, T.; Zeng, W. Acculturation of rural households participating in a clean development mechanism forest carbon sequestration program: A survey of Yi ethnic areas in Liangshan, China. J. For. Econ. 2018, 32, 135–145. [Google Scholar] [CrossRef]
- Liu, J.; Ren, Y.; Hong, Y.; Glauben, T. Does forest farm carbon sink projects affect agricultural development? Evidence from a Quasi-experiment in China. J. Environ. Manag. 2023, 335, 117500. [Google Scholar] [CrossRef]
- Raihan, A.; Tuspekova, A. Toward a sustainable environment: Nexus between economic growth, renewable energy use, forested area, and carbon emissions in Malaysia. Resour. Conserv. Recycl. Adv. 2022, 15, 200096. [Google Scholar] [CrossRef]
- Mandal, S.; Chatterjee, P.; Das, N.; Banerjee, R.; Batabyal, S.; Gangopadhyay, S.; Mondal, A. Modelling the role of urban forest in the regulation of carbon balance in an industrial area of India. Acta Ecol. Sin. 2022, 42, 553–564. [Google Scholar] [CrossRef]
- Sasaki, N.; Chheng, K.; Mizoue, N.; Abe, I.; Lowe, A.J. Forest reference emission level and carbon sequestration in Cambodia. Glob. Ecol. Conserv. 2016, 7, 82–96. [Google Scholar] [CrossRef]
- Lin, S.-J.; Beidari, M.; Lewis, C. Energy consumption trends and decoupling effects between carbon dioxide and gross domestic product in South Africa. Aerosol Air Qual. Res. 2015, 15, 2676–2687. [Google Scholar] [CrossRef]
- Tapio, P. Towards a theory of decoupling: Degrees of decoupling in the EU and the case of road traffic in Finland between 1970 and 2001. Transp. Policy 2005, 12, 137–151. [Google Scholar] [CrossRef]
- Xia, X.; Sun, H.; Yang, Z.; Yuan, W.; Ma, D. Decoupling Analysis of Rural Population Change and Rural Electricity Consumption Change in China. Int. J. Environ. Res. Public Health 2022, 19, 6676. [Google Scholar] [CrossRef]
- Ke, S.; Zhang, Z.; Wang, Y. China’s forest carbon sinks and mitigation potential from carbon sequestration trading perspective. Ecol. Indic. 2023, 148, 110054. [Google Scholar] [CrossRef]
- Qu, Z.; Thrush, S.; Blain, C.; Lewis, N. Assessing the carbon storage value of kelp forest restoration in the Hauraki Gulf Marine Park, New Zealand: Lessons from no-take Marine Protected Areas. Mar. Policy 2023, 154, 105682. [Google Scholar] [CrossRef]
- Ge, J.; Zhang, Z.; Lin, B. Towards carbon neutrality: How much do forest carbon sinks cost in China? Environ. Impact Assess. Rev. 2023, 98, 106949. [Google Scholar] [CrossRef]
- Huang, C.; Li, S.; He, H.S.; Liang, Y.; Xu, W.; Wu, M.M.; Wu, Z.; Huang, C.; Chen, F. Effects of forest management practices on carbon dynamics of China’s boreal forests under changing climates. J. Environ. Manag. 2023, 335, 117497. [Google Scholar] [CrossRef] [PubMed]
Disclaimer/Publisher’s Note: The statements, opinions and data contained in all publications are solely those of the individual author(s) and contributor(s) and not of MDPI and/or the editor(s). MDPI and/or the editor(s) disclaim responsibility for any injury to people or property resulting from any ideas, methods, instructions or products referred to in the content. |
© 2023 by the authors. Licensee MDPI, Basel, Switzerland. This article is an open access article distributed under the terms and conditions of the Creative Commons Attribution (CC BY) license (https://creativecommons.org/licenses/by/4.0/).