Abstract
Habitat loss and fragmentation are primary threats to biodiversity in urban areas. Least-cost path analyses are commonly used in ecology to identify and protect wildlife corridors and stepping-stone habitats that minimise the difficulty and risk for species dispersing across human-modified landscapes. However, they are rarely considered or used in the design of urban green infrastructure networks, particularly those that include building-integrated vegetation, such as green walls and green roofs. This study uses Linkage Mapper, an ArcGIS toolbox, to identify the least-cost paths for four native keystone birds (kererū, tūī, korimako, and hihi) in Wellington, New Zealand, to design a network of green roof corridors that ease native bird dispersal. The results identified 27 least-cost paths across the central city that connect existing native forest habitats. Creating 0.7 km2 of green roof corridors along these least-cost paths reduced cost-weighted distances by 8.5–9.3% for the kererū, tūī, and korimako, but there was only a 4.3% reduction for the hihi (a small forest bird). In urban areas with little ground-level space for green infrastructure, this study demonstrates how least-cost path analyses can inform the design of building-integrated vegetation networks and quantify their impacts on corridor quality for target species in cities.
1. Introduction
The expansion and densification of urban environments drive habitat loss and fragmentation, making urbanisation a primary threat to global biodiversity [1,2]. Though some cities may have larger green spaces and protected natural areas on their peripheries, the lack of vegetated habitats in urban centres makes it difficult for species to survive in or disperse across them, resulting in isolated populations and local extinctions [3,4,5]. Despite a large body of evidence documenting the importance of providing green spaces and habitats for species and the resulting environmental and human health benefits such provision brings [6,7,8], green spaces in cities are limited by development pressures and a lack of available ground-level space, which will be exacerbated as city populations grow [9]. However, taking advantage of the abundance of building surfaces in cities for building-integrated vegetation, such as green roofs, could provide a potential solution [10]. While building-integrated vegetation cannot replace or fully replicate high-quality ground-level habitats, there is evidence that it can provide habitat connectivity benefits for some species in cities [11]. Green roofs are one of the most well-studied types of building-integrated vegetation and have demonstrated the ability to support biodiversity [12,13]. Wooster et al. [14] found that an urban green roof in Sydney, Australia, supported four times the bird diversity and seven times the arthropod diversity of conventional roofs. Baumann et al. [15] found that extensive green roofs in Switzerland were used for breeding by the northern lapwing (Vanellus vanellus), an endangered ground-nesting bird. Partridge and Clark [16] found a higher abundance of birds and arthropods on green roofs than on conventional roofs, including more urban-avoider species. Belcher et al. [17] also found higher bird richness and native bird abundance on green roofs than on conventional roofs; however, they found no specialist forest types, indicating that they may not be suitable for supporting all species.
Because building-integrated vegetation is not often considered in urban green infrastructure planning, research on designing urban green infrastructure networks that include building-integrated vegetation is limited [18]. Venter et al. [19] and Langemeyer et al. [20] used spatial multi-criteria analyses for urban green roof planning that targeted sociocultural factors and ecosystem services for human needs. Some studies have also used hydrological simulations to propose urban green roof scenarios that could improve urban stormwater water management and reduce flooding risks [21,22]. Urban microclimate simulation software has been used to propose and demonstrate the potential impacts of implementing building-integrated vegetation into cities to improve air quality and reduce the urban heat island effect [23,24]. While these approaches to planning building-integrated vegetation target important urban issues that impact human health and well-being, they do not target habitat connectivity outcomes that are specific to the needs of local non-human species.
Least-cost distance analyses have been commonly used in the fields of ecology and conservation biology to identify, protect, and improve species dispersal paths across landscapes [25,26]. These analyses use species’ behaviour and habitat requirements combined with landscape features to determine the metabolic cost and risk a species incurs when traversing a landscape [26]. The outputs of these analyses often include least-cost paths, which show the easiest (least metabolically expensive or risky) routes for a target species to cross. Two sets of values describe these paths, the actual (or Euclidean) distance and the cost-weighted distance, which is the equivalent distance if dispersal barriers and risks are taken into account [27]. For example, a bird may fly 3 km between two habitat patches, but if it has to cross a densely built area with cars and tall glass buildings, then the metabolic expense and risk associated with that 3 km crossing may be equivalent to flying 30 km. Another output of these analyses is cost-weighted distance maps, which show the dispersal costs/risks of areas surrounding the least-cost paths for a target species [27]. Several digital tools, such as Linkage Mapper [28], are available through geographic information system software for least-cost analyses. Though Linkage Mapper has been used in several studies for species-specific conservation [29,30,31,32], there is limited research on how it can be used as a tool to inform and test the design of urban green infrastructures. Kong et al. [33] used Linkage Mapper to identify and prioritise ecological corridors that considered the complex 3D qualities of built environments. Linkage Mapper was also used to identify the ecological barriers in Amman, Jordan, that could inform urban green infrastructure planning [34]. While the authors of both papers briefly discuss building-integrated vegetation as a potential strategy to reduce dispersal barriers, they did not design or simulate the impacts of incorporating building-integrated vegetation.
Protecting and enhancing habitat connectivity will be critical to sustaining native biodiversity in urban environments. Despite growing evidence in the literature of the connectivity benefits of building-integrated green infrastructures, like green roofs, they are rarely considered in urban habitat connectivity analyses and stepping-stone/corridor planning. Therefore, this research proposes a methodology for using a common habitat connectivity method (least-cost path models) to design green roof networks and assess their impact on urban habitat connectivity.
Using Wellington, Aotearoa New Zealand, as a case study, this research will use Linkage Mapper to identify the least-cost paths for native birds in a dense urban area and use them to design green roof corridors that can help native birds disperse across the city more easily. The objectives of this research study are to identify the least-cost paths across the area with the current green infrastructure network, use these paths to create a network of green roofs, and assess the level to which they ease dispersal across the catchment for the study species. Better habitat connectivity analyses and design methodologies could optimise urban green infrastructure connectivity for target species and quantify their benefits, which may, in turn, increase their uptake by communities, conservation organisations, and local councils.
2. Materials and Methods
2.1. Study Area and Species
Due to its long geological isolation, the South Pacific island nation of Aotearoa New Zealand has become a unique biodiversity hotspot and is home to thousands of endemic species (mostly birds) that exist nowhere else in the world [35]. The country has made conserving these endemic species a high priority through key documents, such as the Te Mana o te Taiao—Aotearoa New Zealand Biodiversity Strategy 2020 [36] and the work of community organisations like Predator Free NZ [37].
Wellington, the capital of Aotearoa New Zealand, is a temperate coastal city on the North Island with a population of approximately 203,000 [38]. It has declared its ambitions to enhance its native ecosystems through policy documents such as the Our Natural Capital Biodiversity Strategy and Action Plan [39] and its membership in the Biophilic Cities Network [40]. The city currently has a relatively high amount of green space due to the preservation of the Town Belt, a series of green spaces that surround the city, and its hilly topography, which constrains development (Figure 1). However, green spaces are not evenly spread across the city, and areas filled with buildings and roads result in fragmented habitats that limit the movement of native species [41]. This is particularly true in the central city area of Lambton Harbour-Oriental Bay (13.7 km2), which has the lowest levels of green space in Wellington and a high density of existing buildings [41]. Predicted population growth and urban densification in this area [42] will limit the amount of new green spaces and put existing green spaces at risk of development, which could exacerbate habitat fragmentation and increase the difficulties and risks native species, such as birds, have to deal with when moving to different habitat patches.
Fatal collisions, pollution, and a lack of resources (such as food and fresh water) can make it difficult for birds to live and disperse across urban environments [43,44]. However, their survival in urban environments is important because they contribute to many supportive, regulatory, and cultural ecosystem services, such as pollination, seed dispersal, species maintenance, and mental well-being [45,46]. Birds are a good indicator species of ecosystem health due to their sensitivity to pollution and environmental changes. They often have keystone roles in their ecosystems, meaning that their functions are so important to the point that their removal could have catastrophic consequences for the whole ecosystem [47,48].
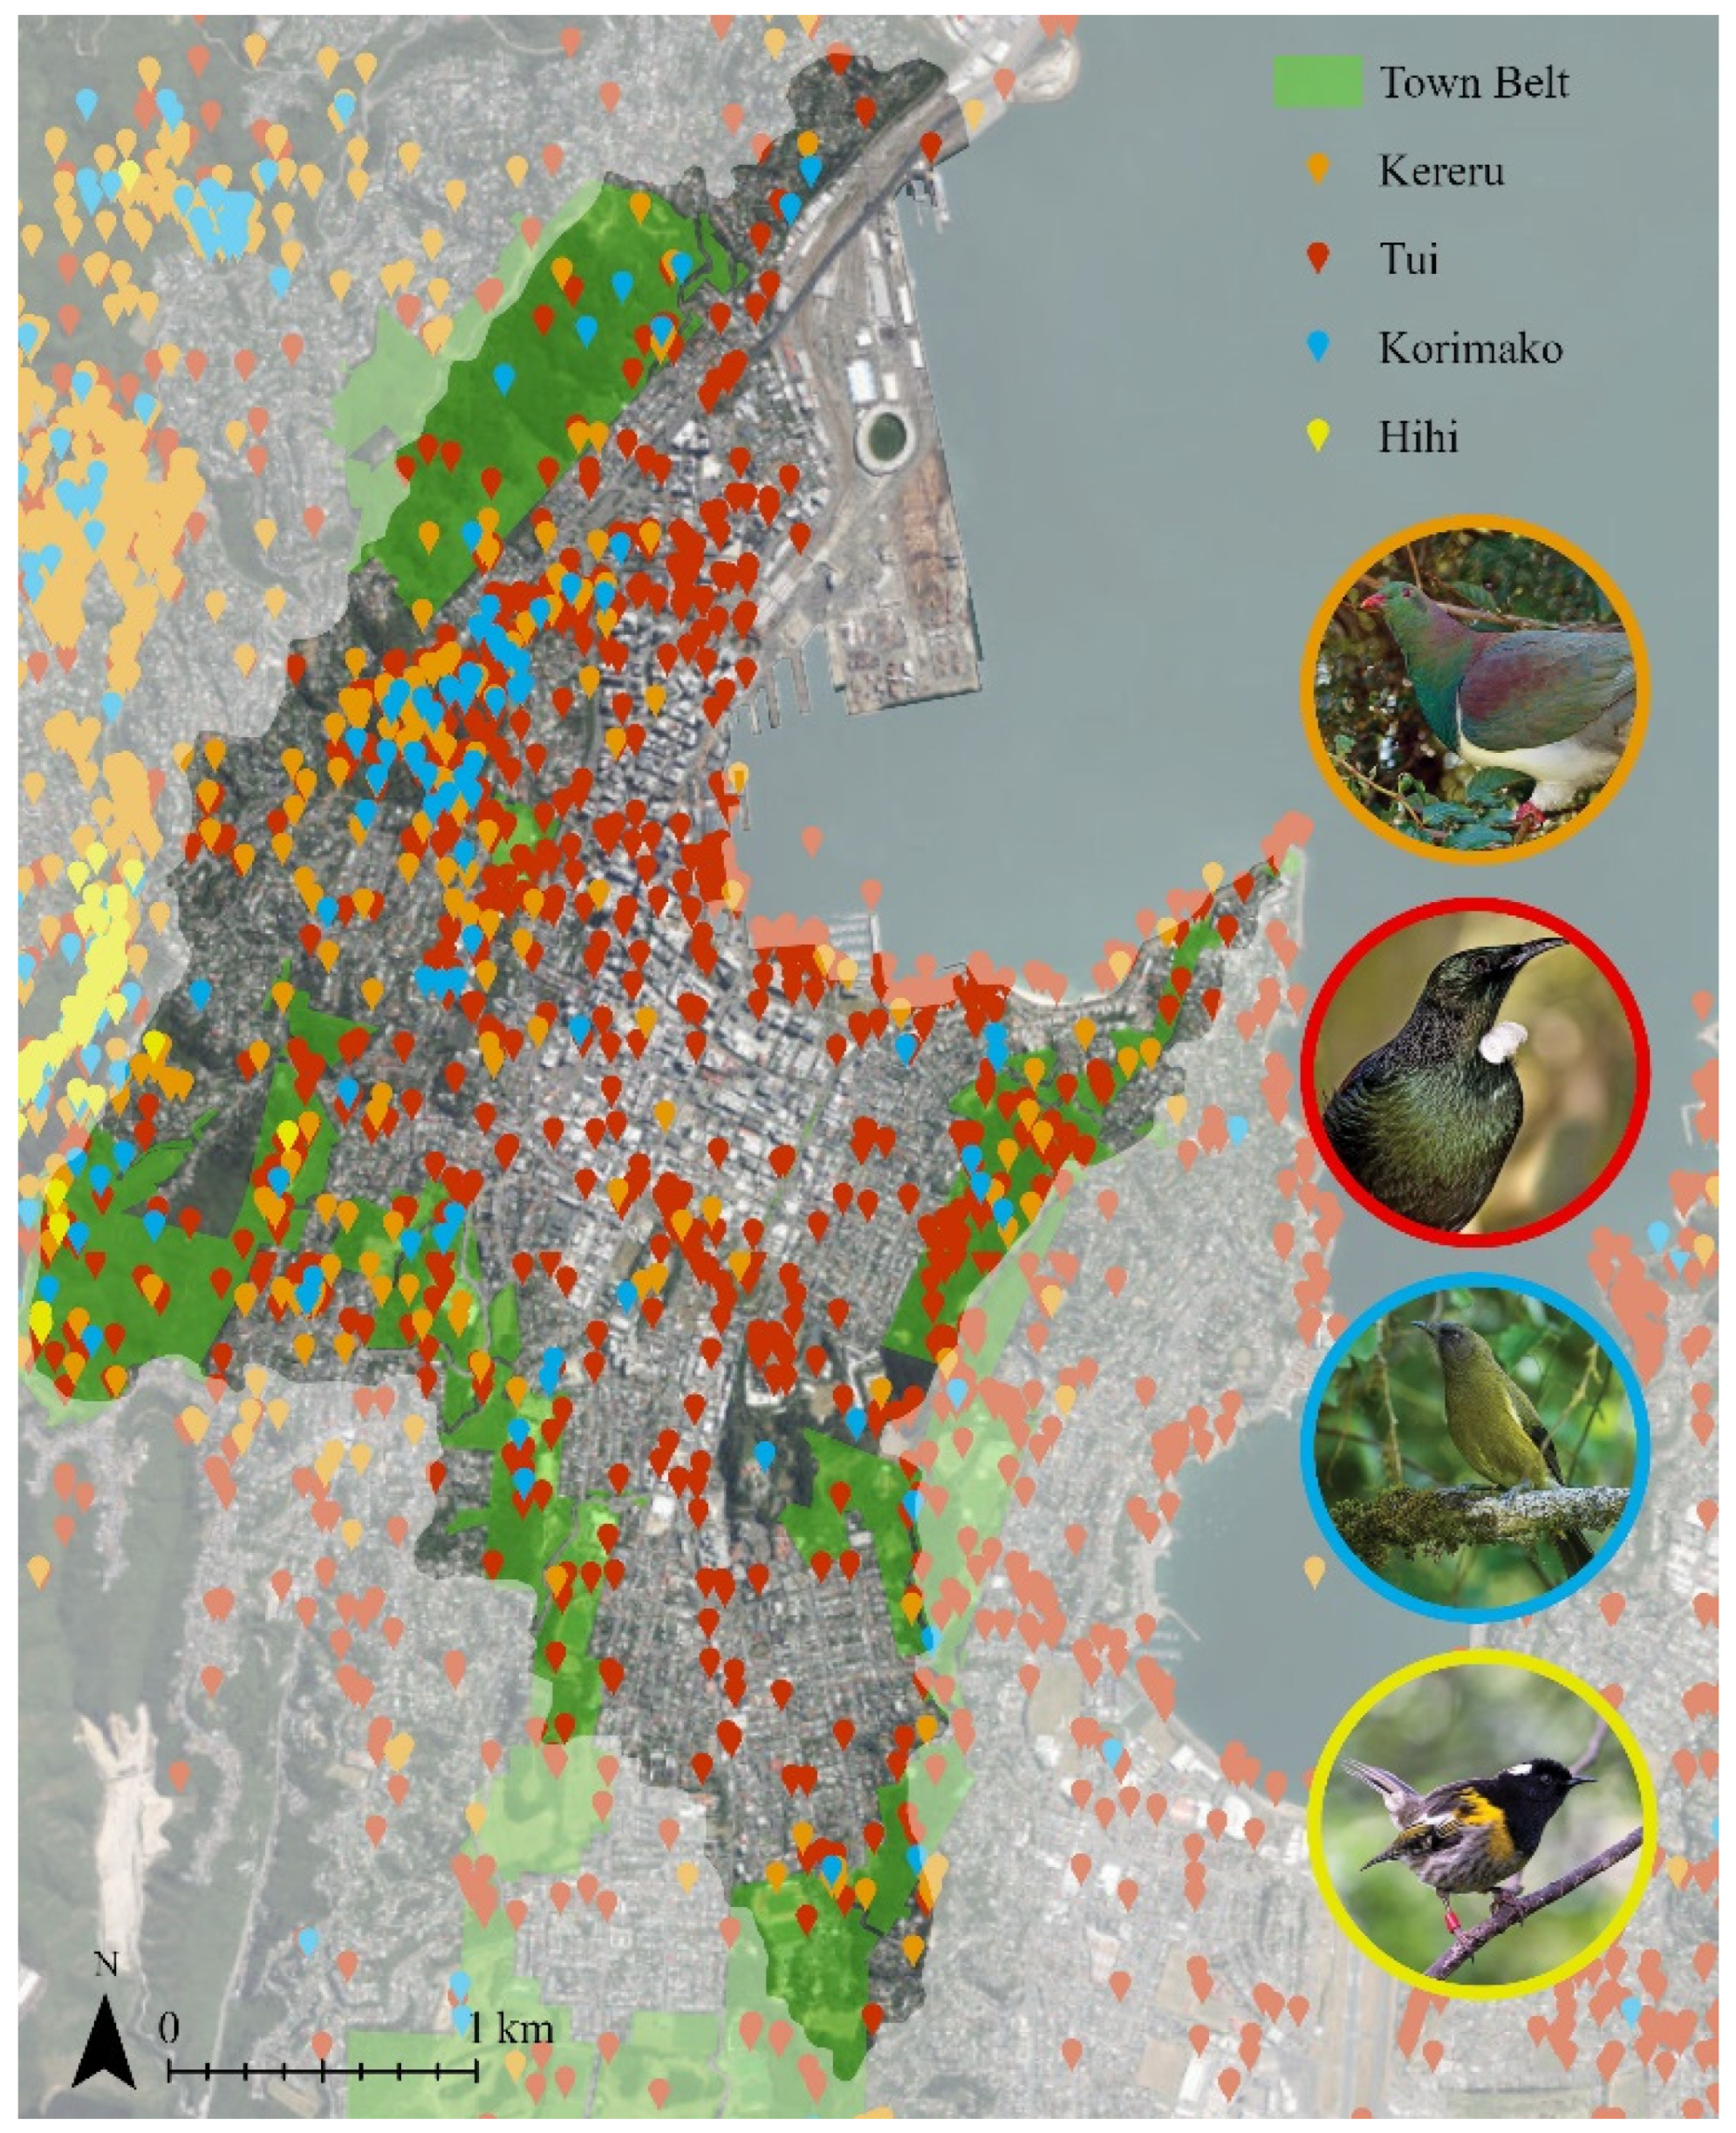
Previous research has identified that the most important endemic keystone birds in Wellington are the kererū (Hemiphaga novaeseelandiae), the tūī (Prosthemadera novaeseelandiae), the korimako (Anthornis melanura), and the hihi (Notiomystis cincta) [47,49]. The kererū is a large, brightly coloured wood pigeon whose primary habitat is a variety of forest types (both native and exotic), but they can also be found in urban environments [50]. They are strong fliers and can have home ranges that span several hectares; however, 2.5 km has been identified as the limit for seed dispersal [51]. The tūī is a medium-sized honeyeater with black feathers that have a blue-green iridescent sheen and white tufts on their throats. Tūī are strong fliers and primarily inhabit native forests and scrub; however, they can also be found in backyard gardens and urban parks [52]. The korimako is a slightly smaller species of honeyeater with yellow-green feathers and a curved black bill. Korimako inhabit native and exotic forests and scrub and can also be found in backyard gardens and urban parks but at a lower frequency than tūī [53]. The hihi is the smallest and rarest of the four keystone species, with greyish-brown feathers and noticeable white wing bars. The habitats of the hihi are limited to mature native forests, resulting in their presence in Wellington currently being limited to one or two protected native forest reserves on the city’s edge [54]. Kererū and tūī are commonly observed across the Lambton Harbour-Oriental Bay area, whereas the korimako observations are more limited to green spaces (Figure 1). The hihi is rarely observed in the area, with the majority of sightings being reported only in the predator-free eco-sanctuary of Zealandia, just outside the catchment’s western border.
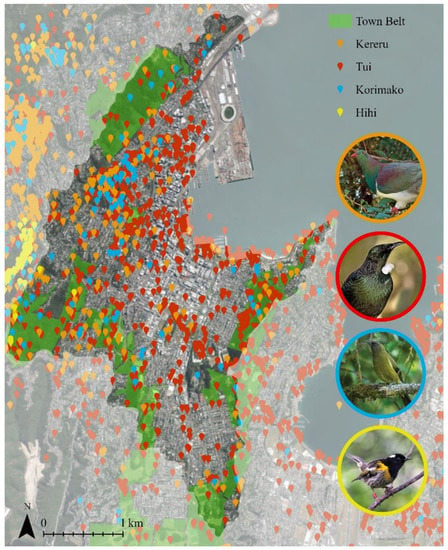
Figure 1.
Study species distributions across the Lambton Harbour-Oriental Bay catchment area, which defines the city centre and is bordered by the town belt. The base satellite image is from ref. [55] (CC BY 4.0). The four native birds selected for this research are the kererū (image credit ref. [56] CC BY CCO 1.0), tūī (image credit ref. [57] CC BY CCO 1.0), korimako (image credit ref. [58] CC BY-SA 2.0), and hihi (image credit ref. [59] CC BY 4.0). The observation data were obtained from the Global Biodiversity Information Facility (CC BY 4.0) for the kererū [60], tūī [61], korimako [62], and hihi [63].
2.2. Linkage Mapper
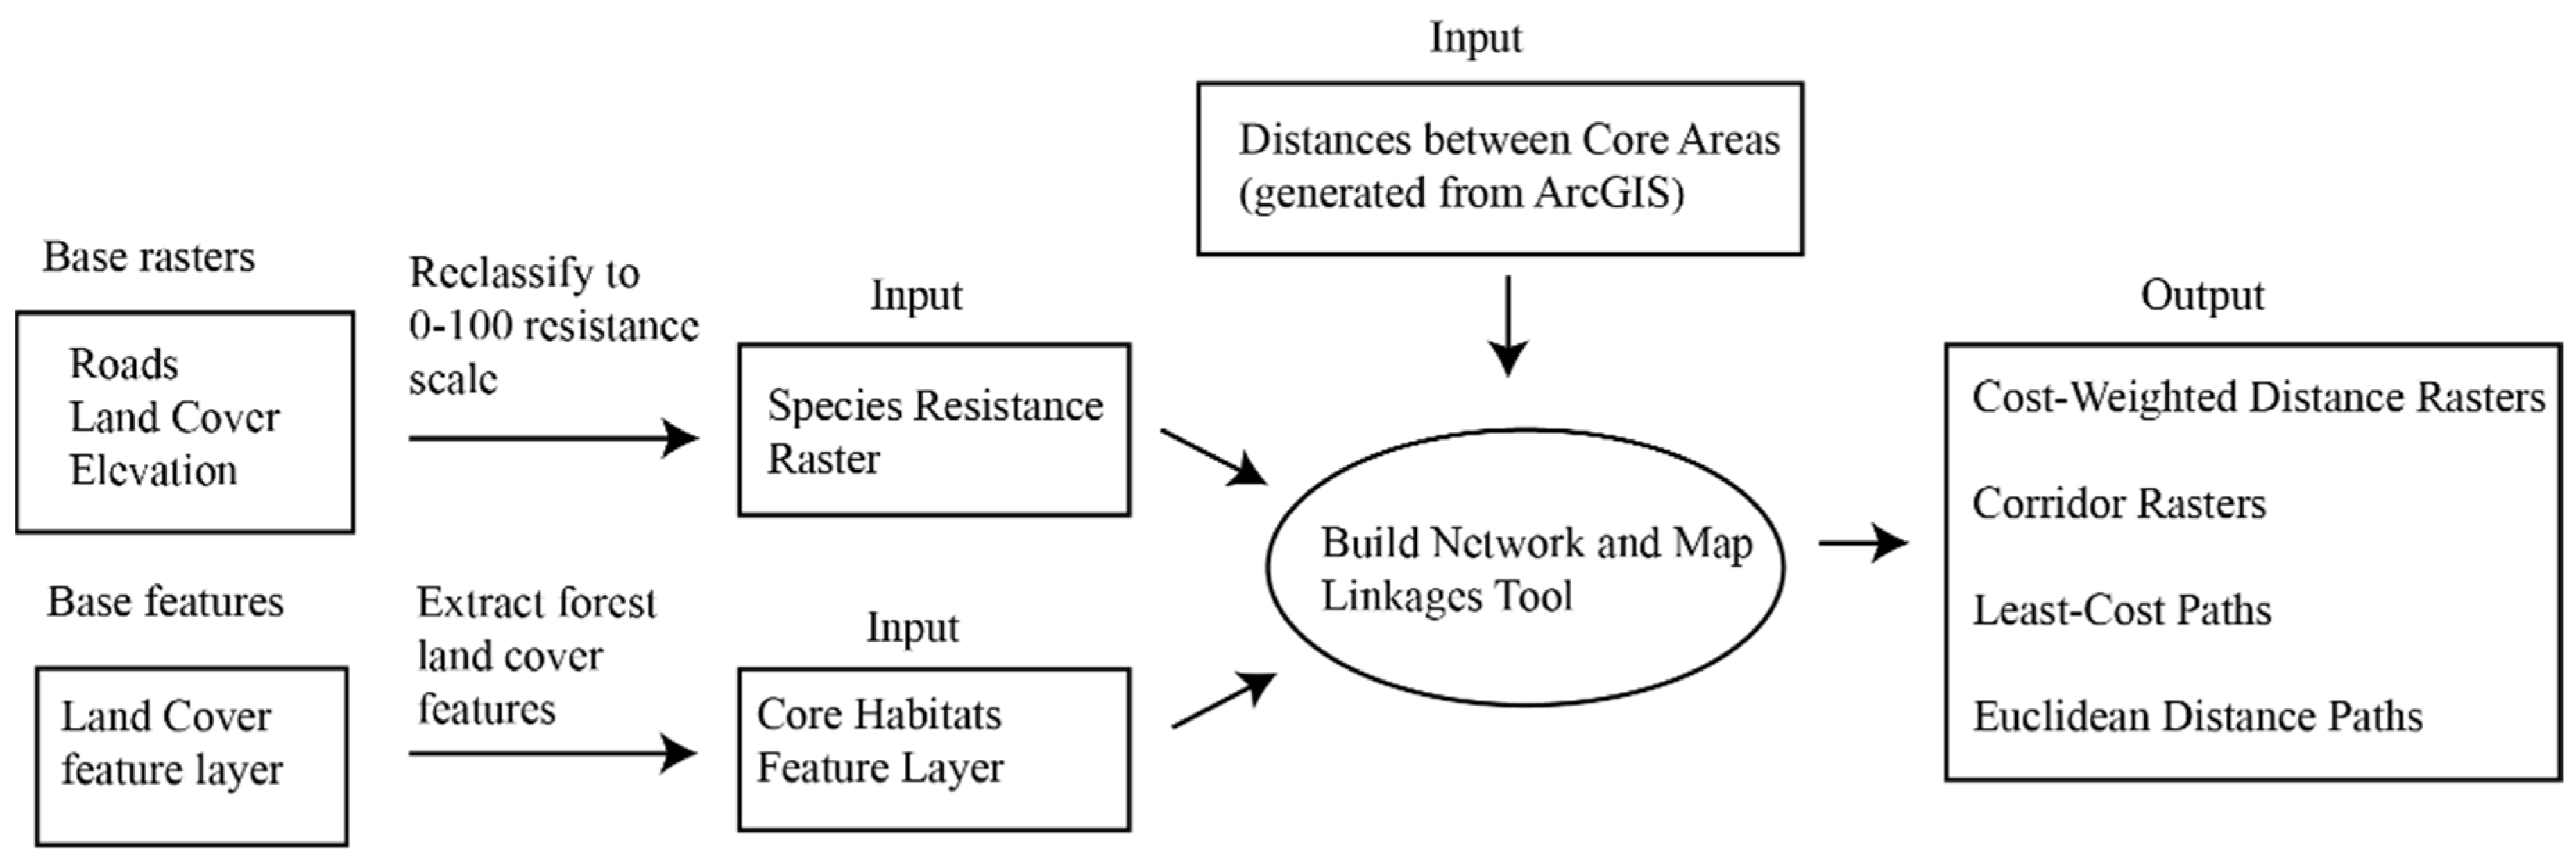
Linkage Mapper [28] is a free toolbox extension for ArcGIS (a subscription software) that can help identify where ecological corridors are or are needed for different species. Though there are many tools within Linkage Mapper, the Linkage Pathways tool was used in this research as it is the most useful for determining the location of stepping stones (unconnected vegetated patches) and wildlife corridors (vegetated links connecting habitat patches). The Linkage Pathways tool (Figure 2) uses species resistance rasters (rasters are images where pixels represent values of information, such as height) and core habitat features (features are vector shapes) to generate least-cost paths and cost-weighted distance maps [27].
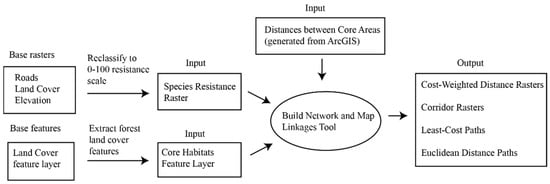
Figure 2.
Workflow for the Linkage Pathways tool. The inputs required are species resistance rasters and core habitat features. The tool produces least-cost paths, actual (or Euclidean) distance paths, cost-weighted distance rasters, and corridor rasters.
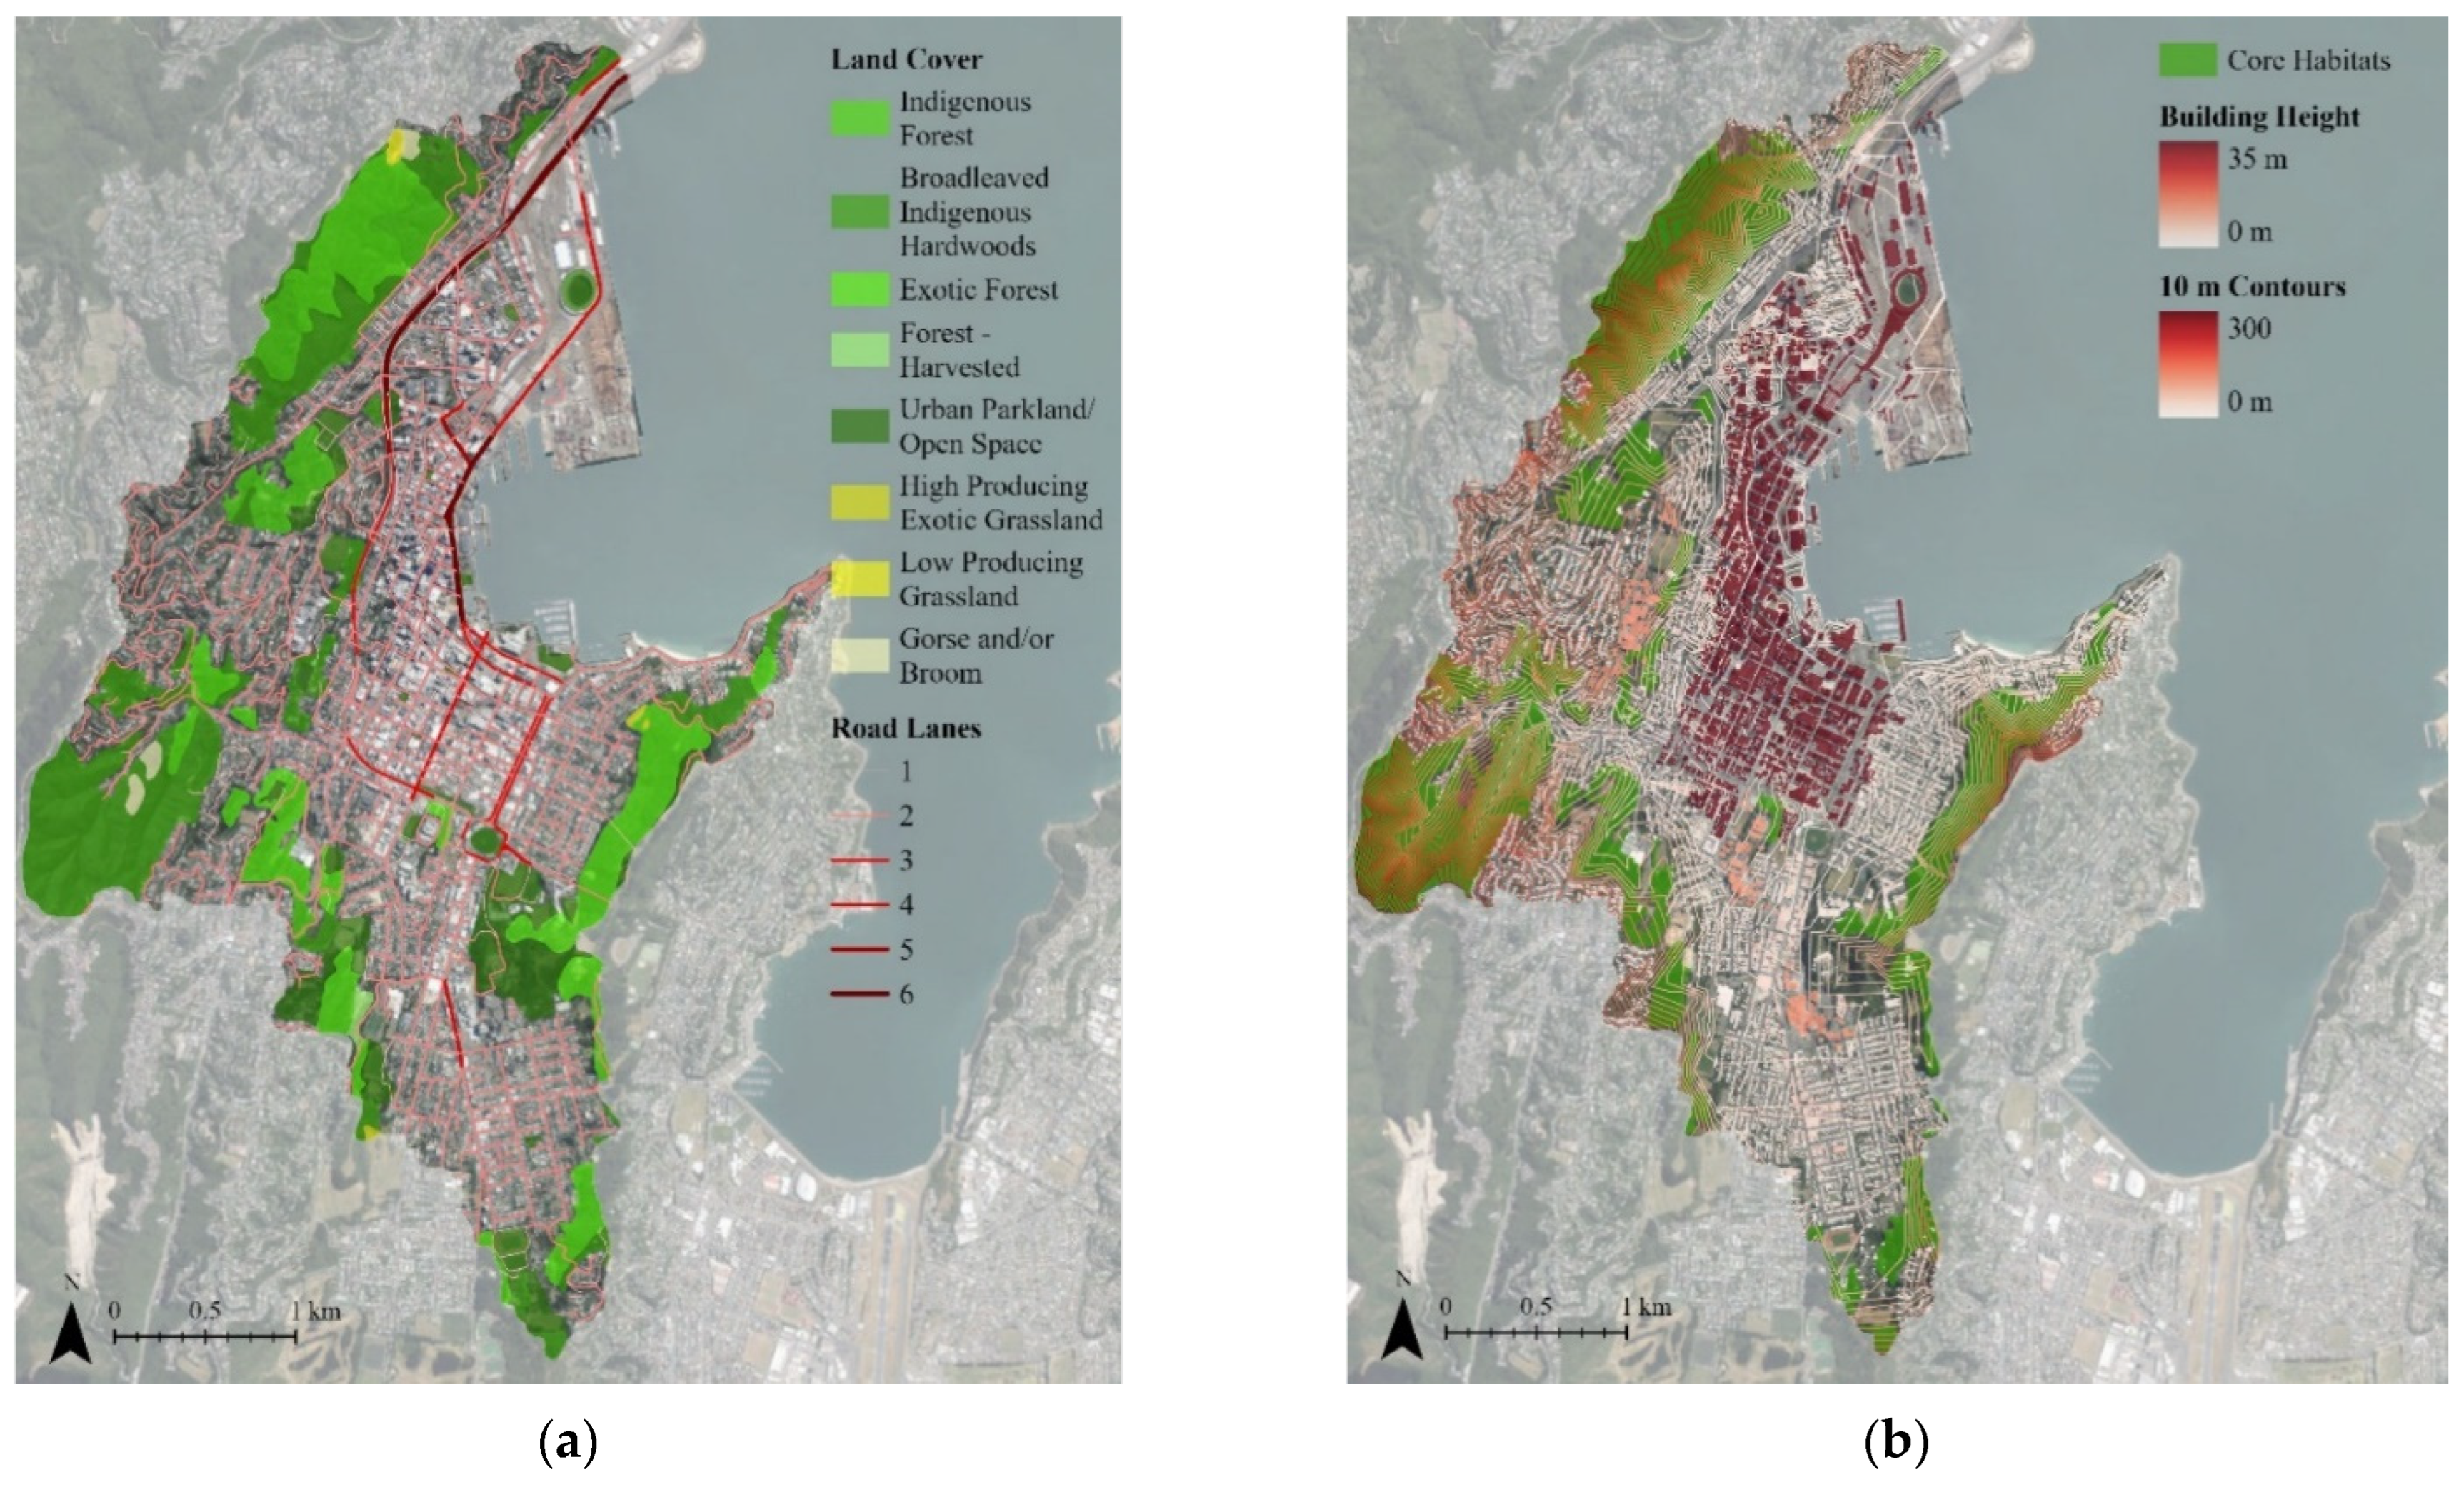
The four study species are all mostly forest dwellers; therefore, forest land cover typologies (Indigenous Forest, Broadleaved Indigenous Forest, and Exotic Forest) were extracted from the New Zealand Land Cover Database version 5.0 [64] to create the core habitats feature layer (Figure 3). While Indigenous Forest is the optimal habitat for the study species, Broadleaved Indigenous Forests and Exotic Forests can also be suitable, especially if there is some level of pest management, as is the case for several of these habitat patches in the study area [65].
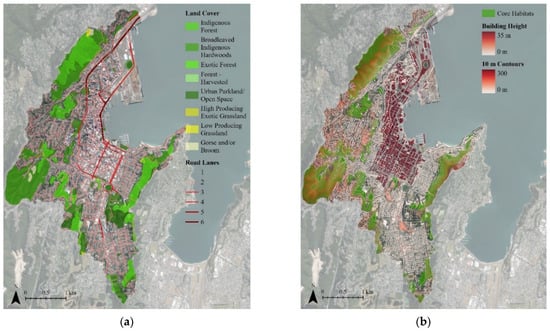
Figure 3.
Landscape features of the study area for the Linkage Pathways tool: (a) land cover types and roads in the study area; (b) the three forest land cover types were extracted to create a core habitat map overlayed with topography contours and building heights. The base satellite image is from ref. [55] (CC BY 4.0).
Resistance rasters quantify the costs of landscape features such as elevation, built infrastructure, land cover, and waterways for use in least-cost path analyses [66]. Each pixel of a resistance raster is assigned a resistance value, a number that quantifies the level of difficulty a species has crossing a landscape element. For this research, a 0–100 resistance scale was used, corresponding to a percentage range with 0 meaning an area is easy to cross and 100 meaning an area is impossible to cross. The four study species have no established resistance values for different landscape elements. Therefore, the resistance values were approximated based on previous Linkage Mapper research for other native bird species [67]; the presence and distribution of the study species in central Wellington from the government-funded international database Global Biodiversity Information Facility (GBIF) [60,61,62,63]; and descriptions of their size, flight patterns, and habitat preferences [50,51,52,53,54] (Table 1). The landscape features included in the resistance rasters for the four study species were ground elevation, roads, and land cover (Figure 3). Waterways, such as streams and rivers, are often included in least-cost path analyses because they can provide resources and shelter for some species but can also be dispersal barriers [68]. However, waterways were not included in this analysis as there are no major waterways in the Lambton Harbour-Oriental Bay catchment area, and over 95% of streams have been culverted beneath the city [69].

Table 1.
Species resistance values for landscape features in the study area. A 0–100 resistance scale was used, with 0 meaning a feature is easy to cross and 100 meaning a feature is impossible to cross.
Ground elevation is included in resistance rasters because there is a general decrease in species richness for both plants and animals at higher altitudes [70,71]. This is particularly important to consider in cities because, due to their height and material composition, buildings can be significant dispersal barriers for many species and contribute to bird fatalities due to collisions [72]. Most birds tend to fly below 150 m (which is approximately equivalent to a 40-story building) [73], but this is highly species-dependent due to large variations in flight capabilities and patterns [74]. The Wellington City LiDAR 1 m DEM (2019–2020) was obtained from Land Information New Zealand [75] to create the ground elevation resistance raster. The Wellington Buildings shapefile [76] was used to add building height information to the base digital elevation model (DEM). Gaps in the building height data of the shapefile were corrected by organising building footprint polygons into Zones based on the Wellington City Council District Plan [77] and applying the maximum height for each Zone. The Raster Calculator function of ArcGIS Pro was then used to combine the DEM raster with a building height raster generated from the building footprint polygons to create a ground elevation raster that includes buildings.
Other built elements of infrastructure, such as roads, can also pose significant barriers and collision fatality risks for avian and terrestrial species [78,79]. The level of barriers and risks of road crossings are different for different birds, with small, forest-dwelling birds (like the hihi) struggling more than some other species of honeyeater (like the tūī and korimako) or large forest birds (like the kererū) due to physical characteristics that are not suited for sustained direct flight [80]. The NZ Road Centre Lines [81] dataset was used to create a raster of roads and motorways in the study area.
Habitat needs and preferences are species-specific; therefore, land cover is important to consider in least-cost analyses because habitat type can significantly impact how easy or difficult it is to transverse landscapes based on the resources and risks they contain [82,83]. The land cover raster was created using the New Zealand Land Cover Database version 5.0 [64], which is the standard national land cover file used in ecological and habitat connectivity research in Aotearoa New Zealand, including in key references used to determine species resistance values for this research [47,51,67]. The land cover file was cross-checked with site visits to improve its accuracy. Waitangi Park, a significant waterfront green space, had been classified as a ‘Built Area’ in the original file, and this was corrected to the ‘Urban Park-land/Open Space’ classification.
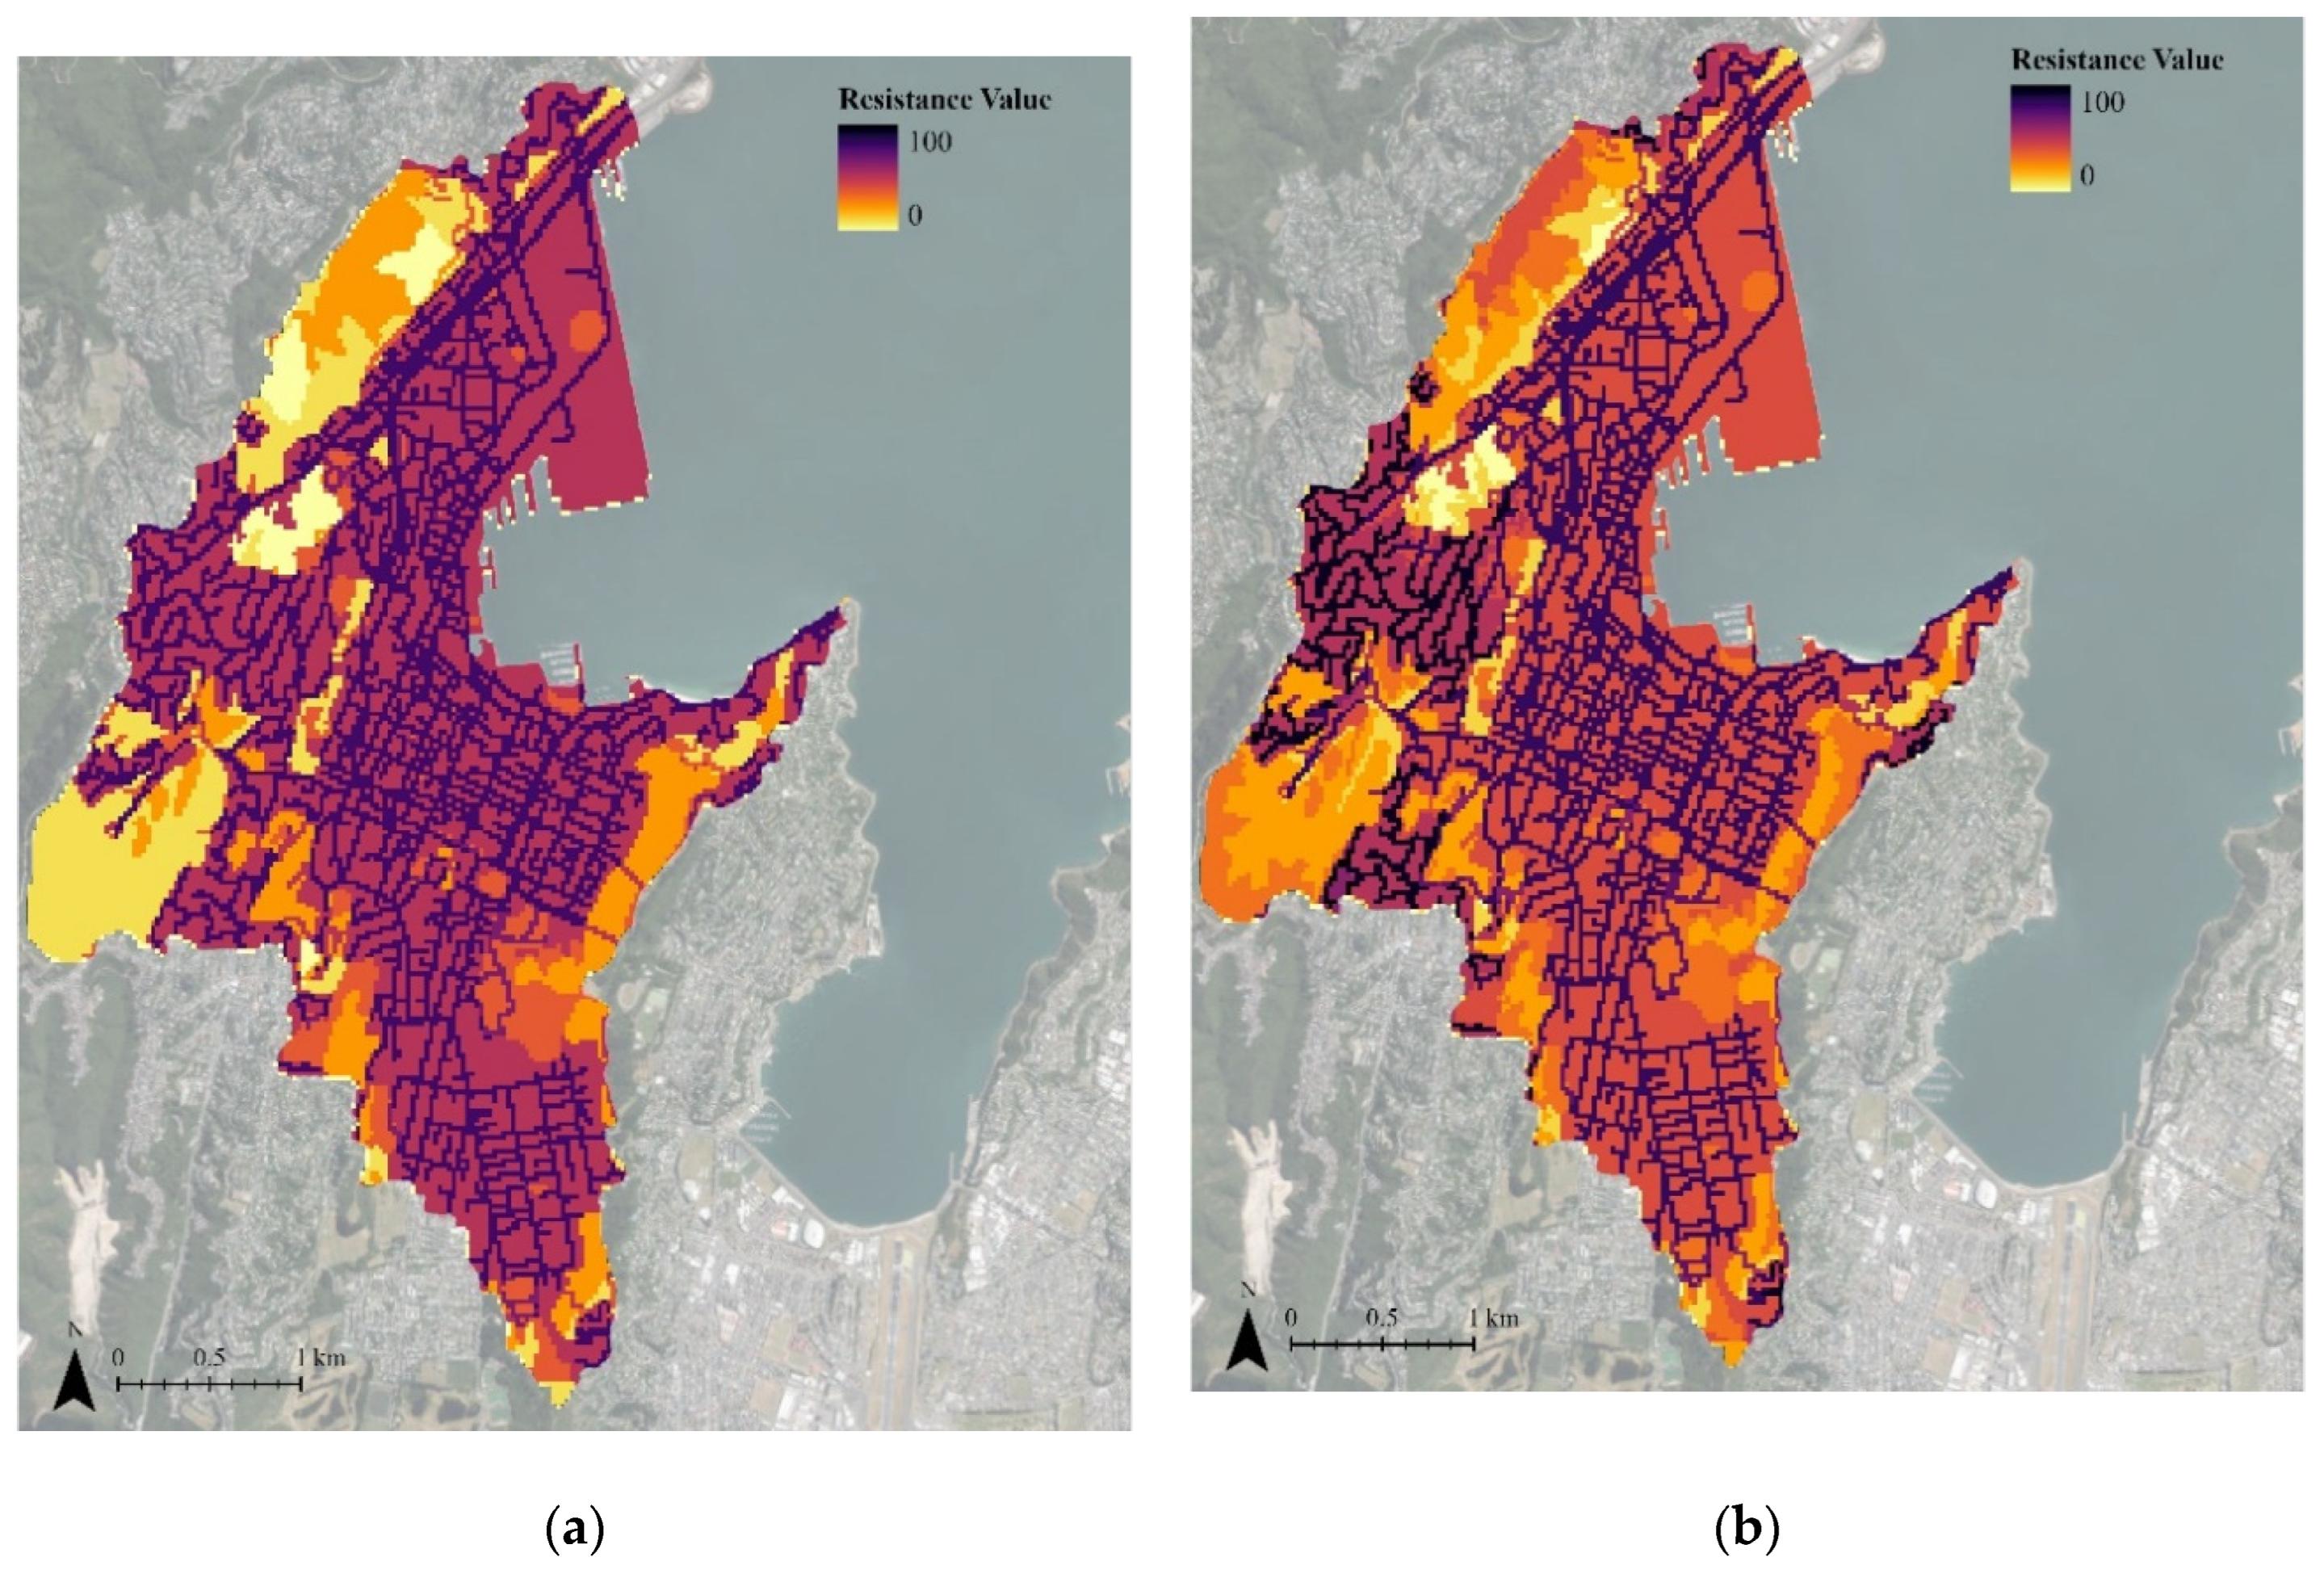
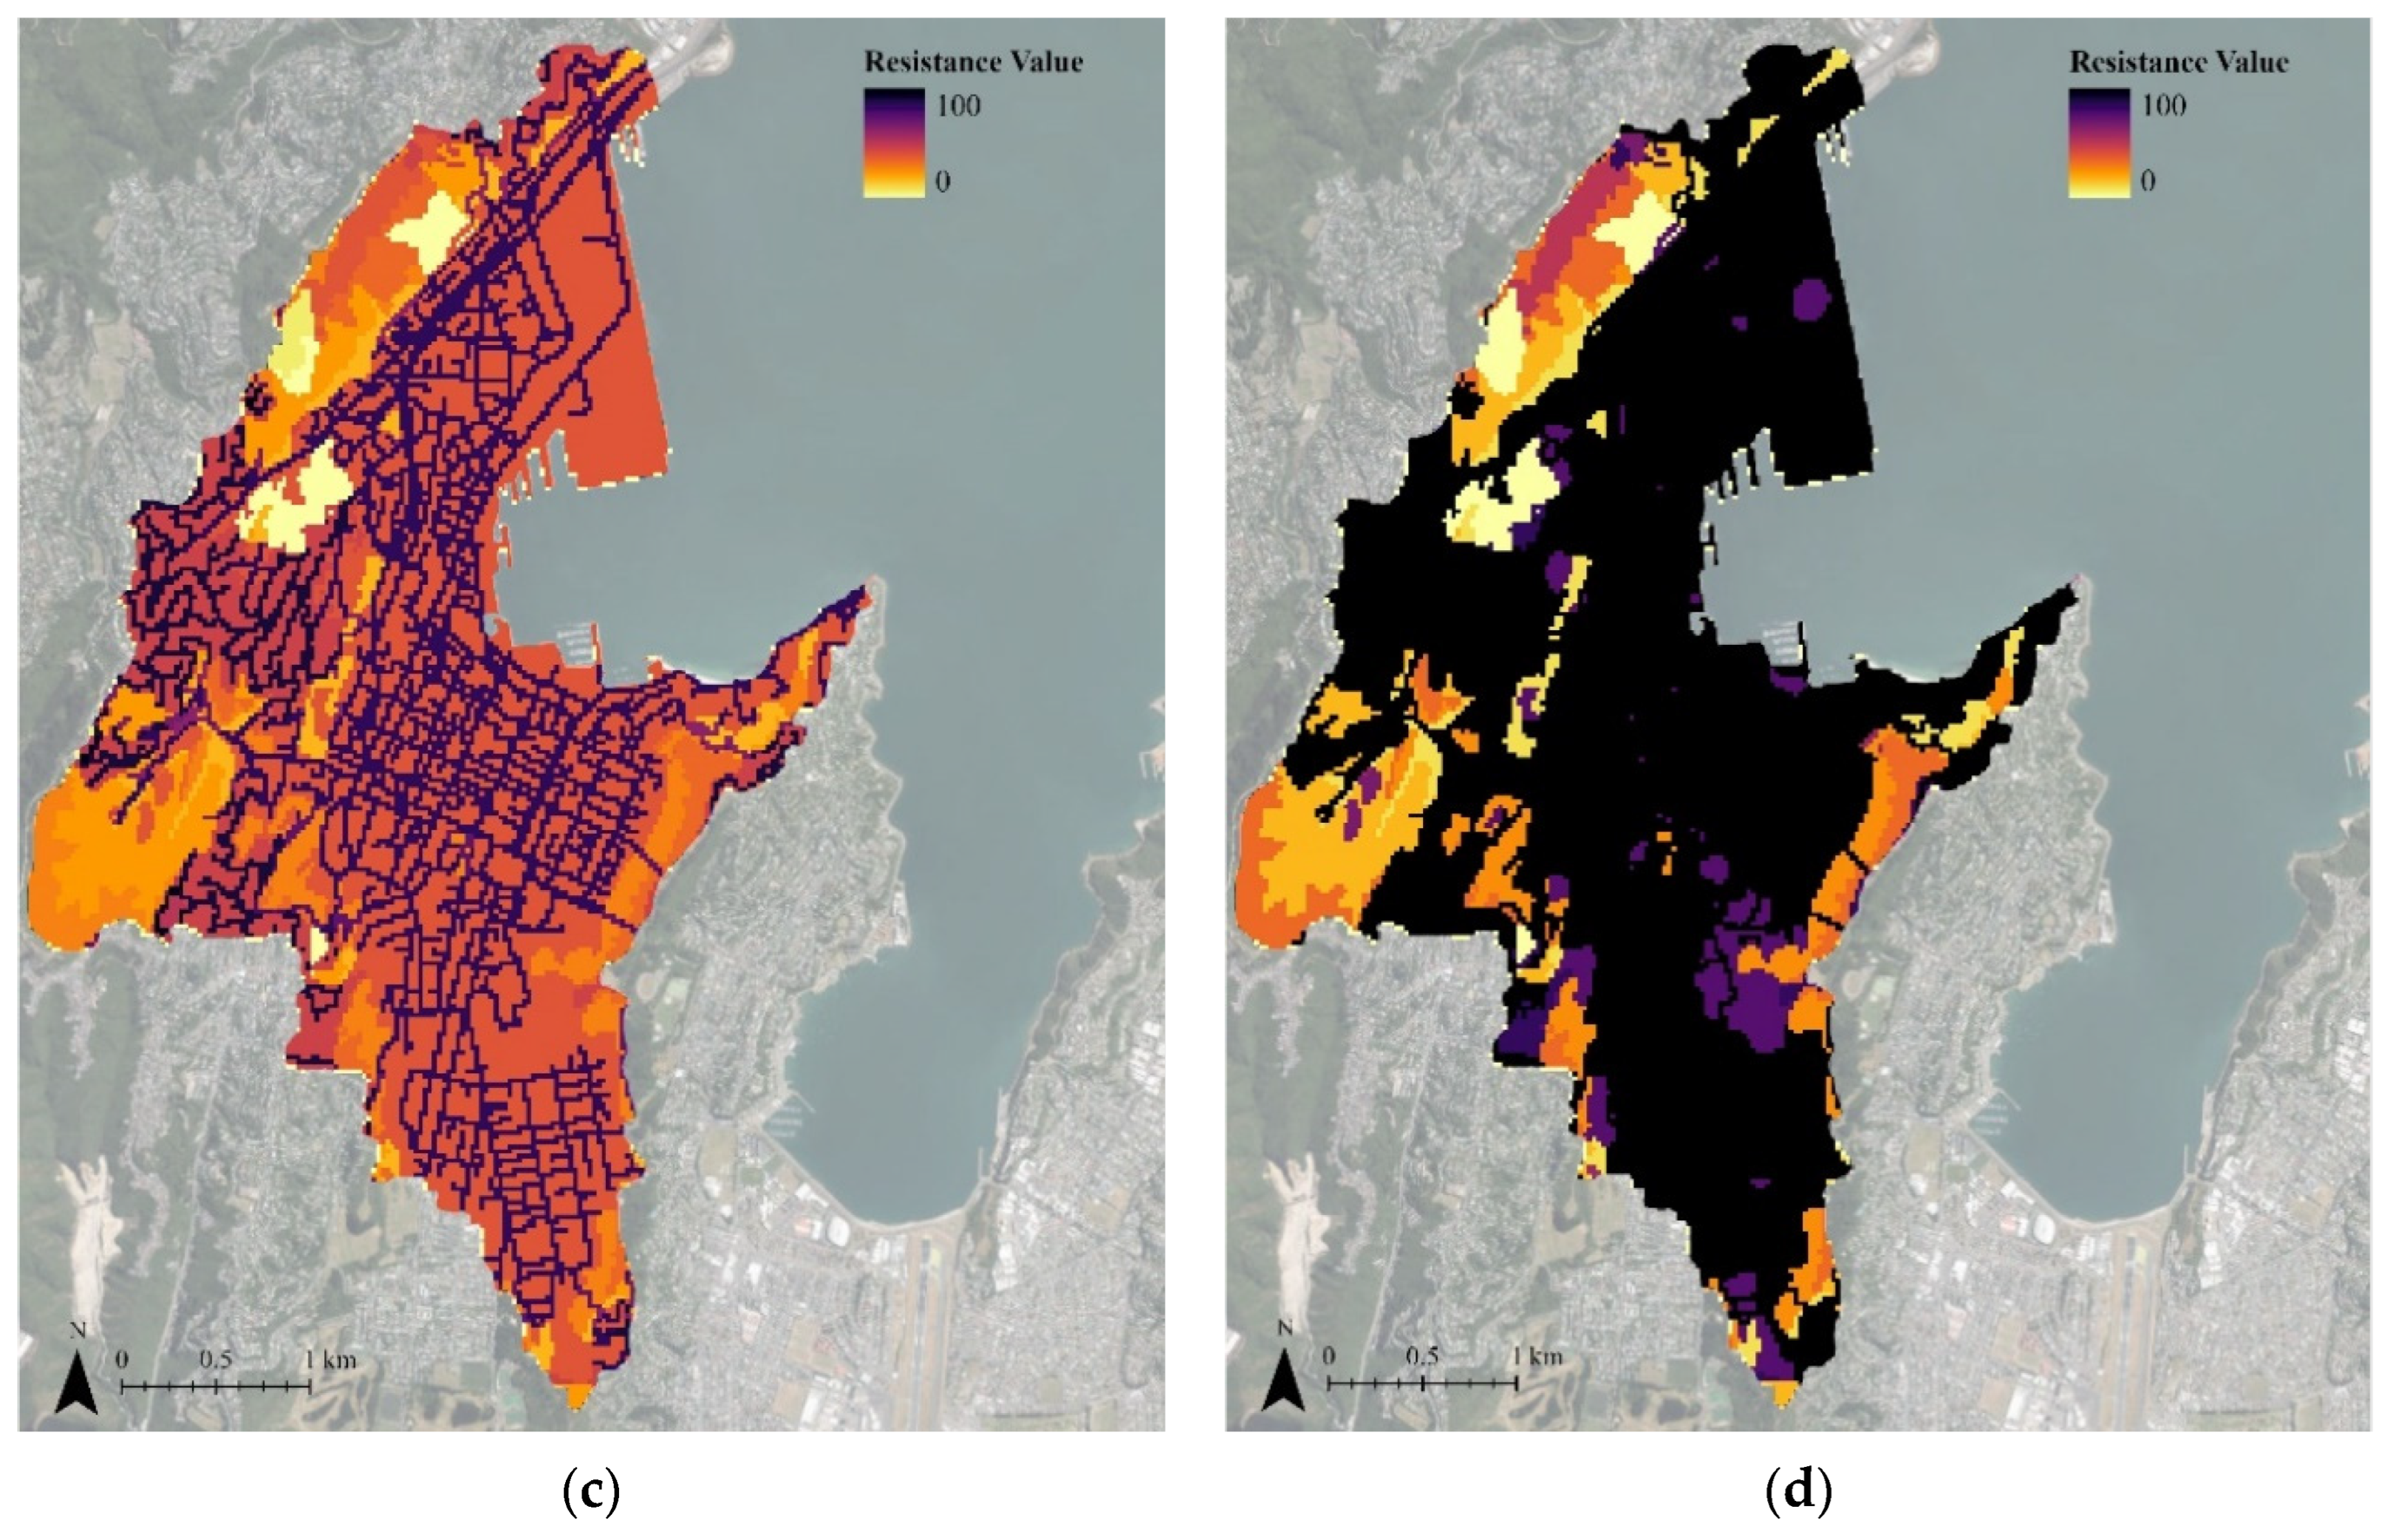
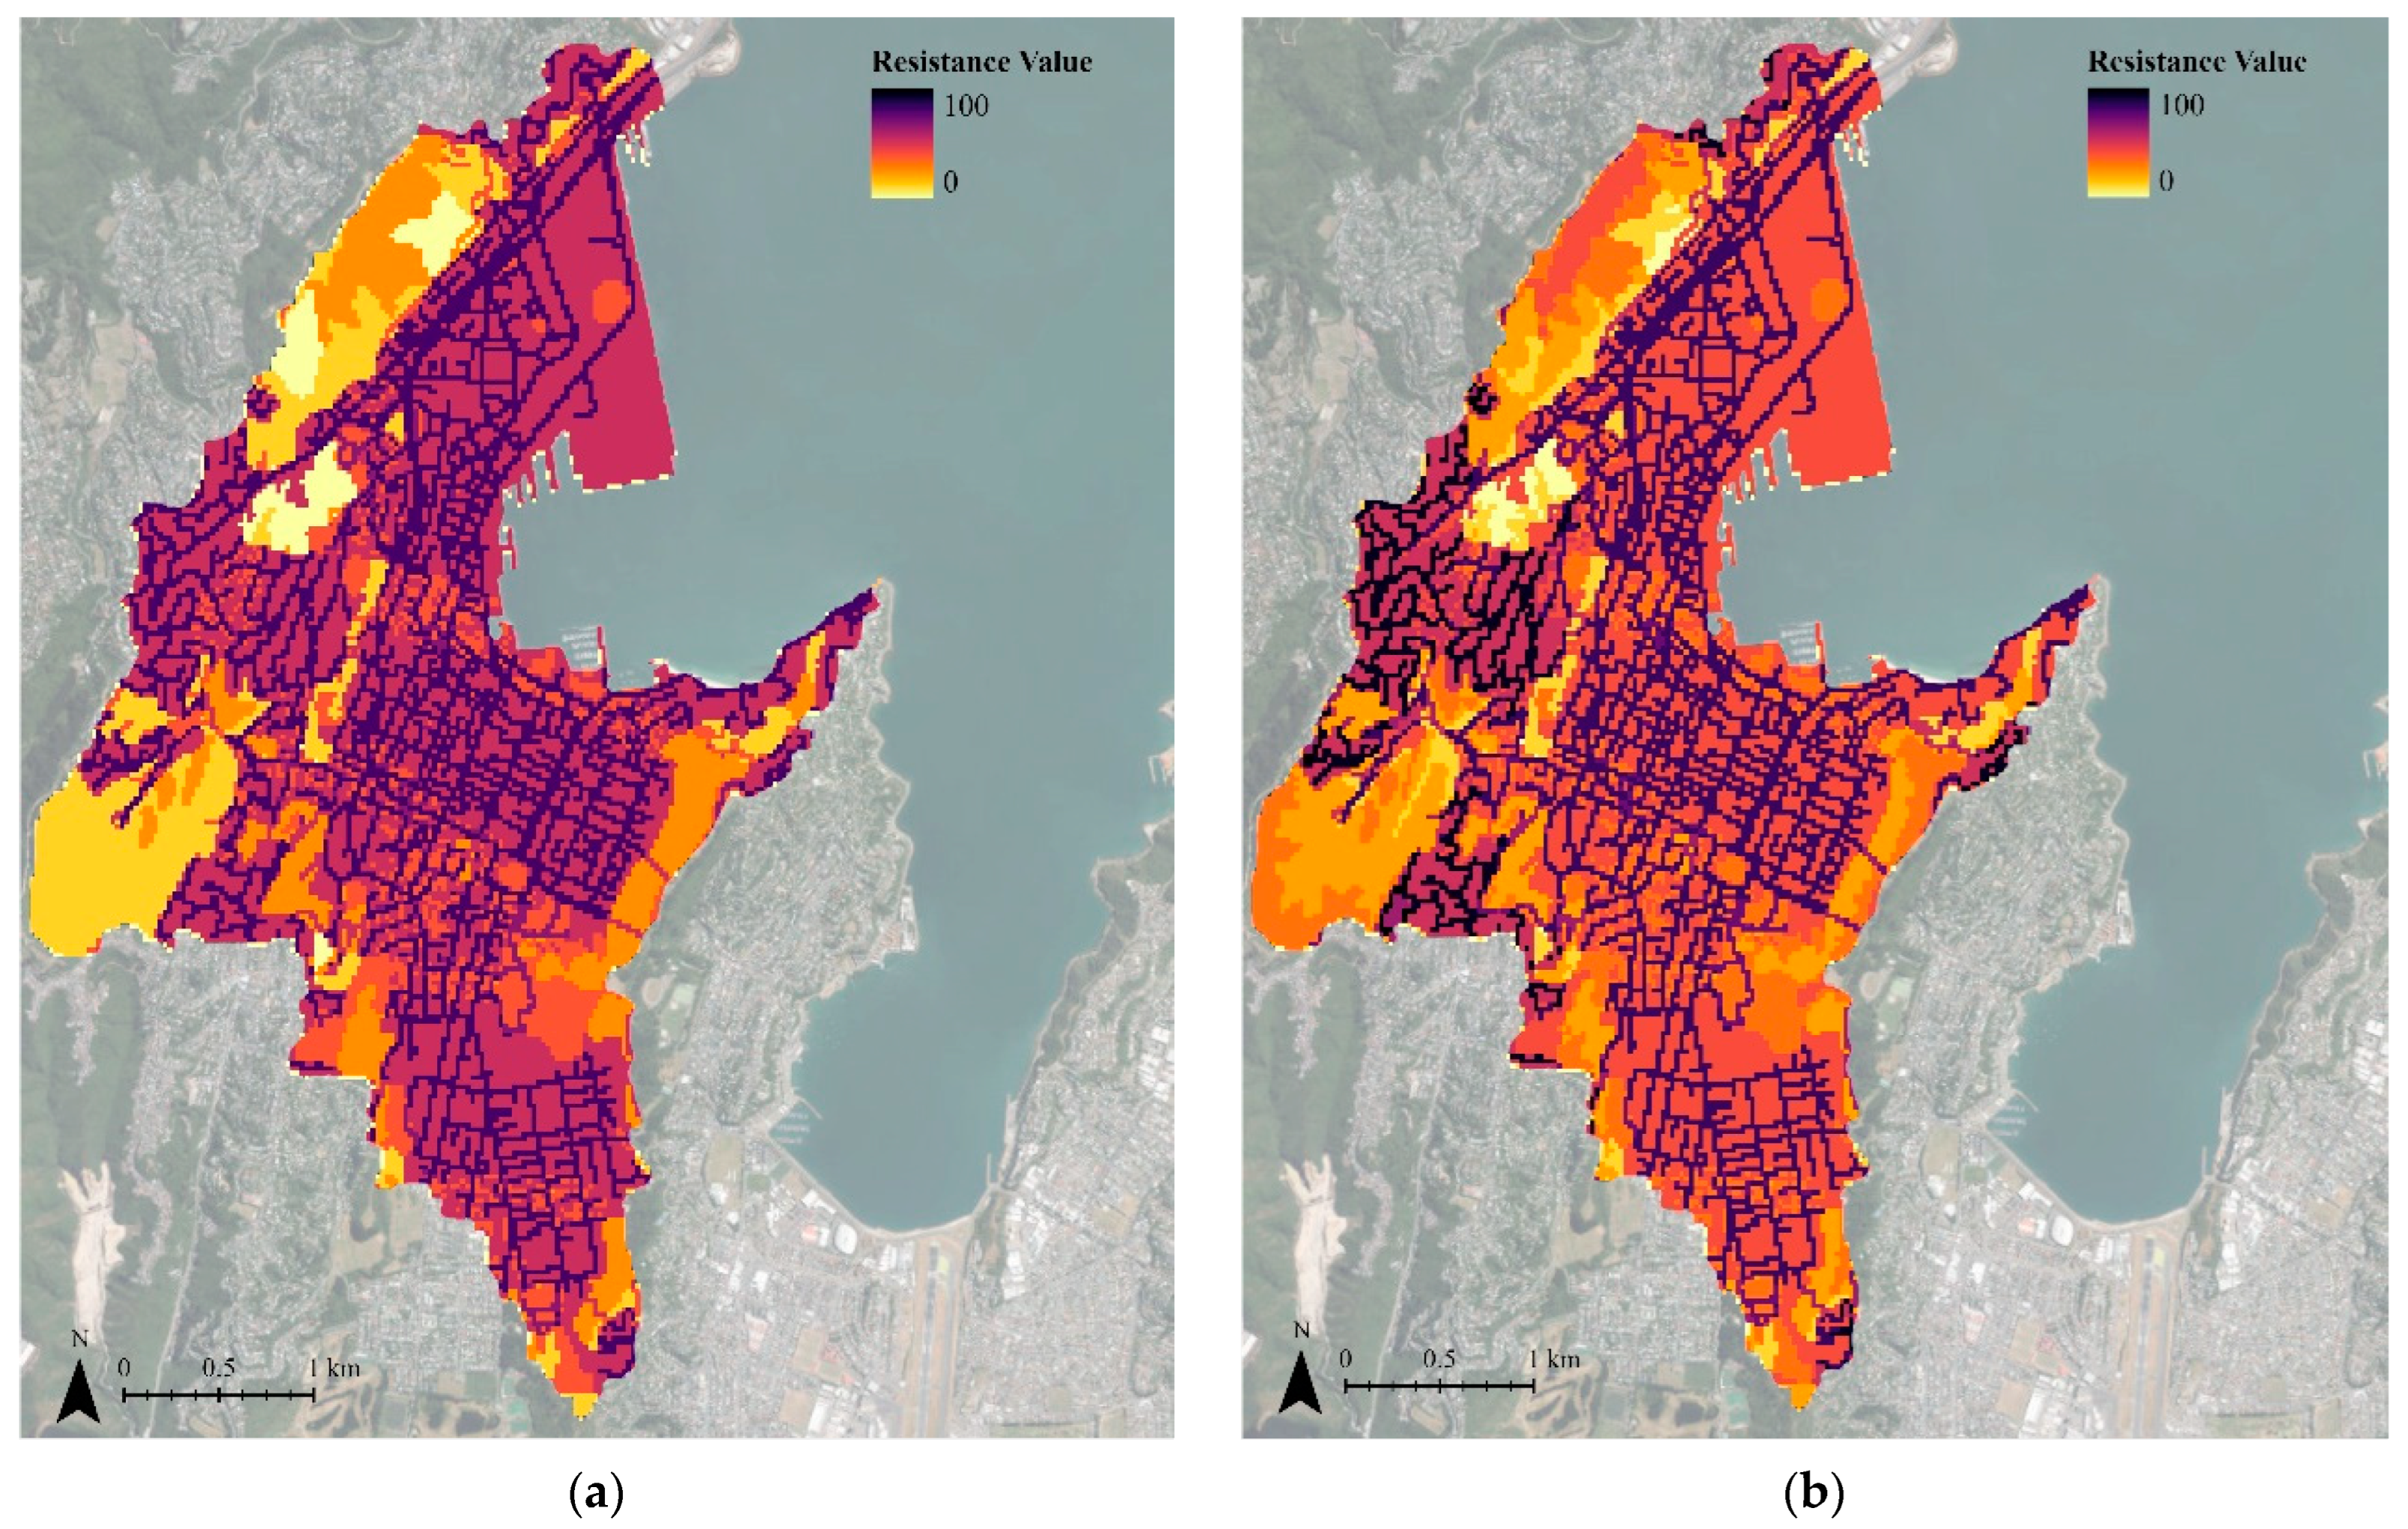
All species resistance rasters were created with a pixel size of 25 × 25 m, which was the most suitable for the vector data sets (roads and land cover). Using the Reclassify tool in ArcGIS Pro, the pixel information of the landscape rasters was reclassified to the 0–100 scale based on the species resistance values in Table 1. The Raster Calculator tool in ArcGIS Pro was then used to sum all the land cover, roads, and elevation rasters into one resistance raster for each species (Figure 4). The Reclassify tool was used again on the korimako and hihi rasters to assign any landscape feature overlaps with values greater than 100 to be equal to 100, as that is the maximum value.
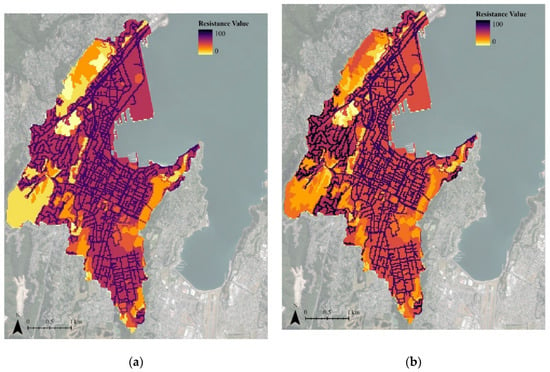
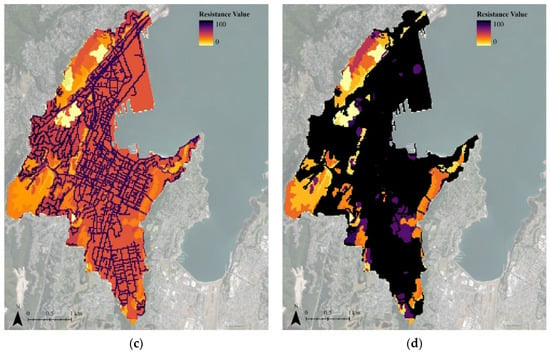
Figure 4.
Species resistance rasters of the existing green infrastructure network for the Linkage Pathways tool: (a) kererū; (b) tūī; (c) korimako; (d) hihi. The base satellite image is from ref. [55] (CC BY 4.0).
The species resistance rasters and core habitat feature layer were then used to run the Linkage Pathways tool. The two outputs from the Linkage Pathways tool that will be discussed in the Results section (Section 3) are cost-weighted distances and cost-weighted distance to Euclidean (actual) distance ratio. Cost-weighted distances are the equivalent distance of travel for species if the metabolic costs of crossing different landscape features are taken into account [27]. Cost-weighted to Euclidean distance ratios can be used as a metric of corridor quality, with lower values indicating higher quality corridors as the actual and cost-weighted distances approach equality [84].
3. Results
For the existing green infrastructure network, on average, the Linkage Pathways tool identified 27 least-cost paths for the four study species, with an average Euclidean (actual) least-cost path distance of 0.5 km. The average cost-weighted distance of the least-cost paths was 22.8 km, meaning that the 0.5 km paths are the equivalent of travelling a distance 43.5 times longer, if the metabolic expense and risks of traversing the landscape are considered. There were large variations in the cost-weighted distances and corridor quality between the four study species (discussed in Section 3.1, Section 3.2, Section 3.3 and Section 3.4); however, the location of the least cost paths was similar for all species.
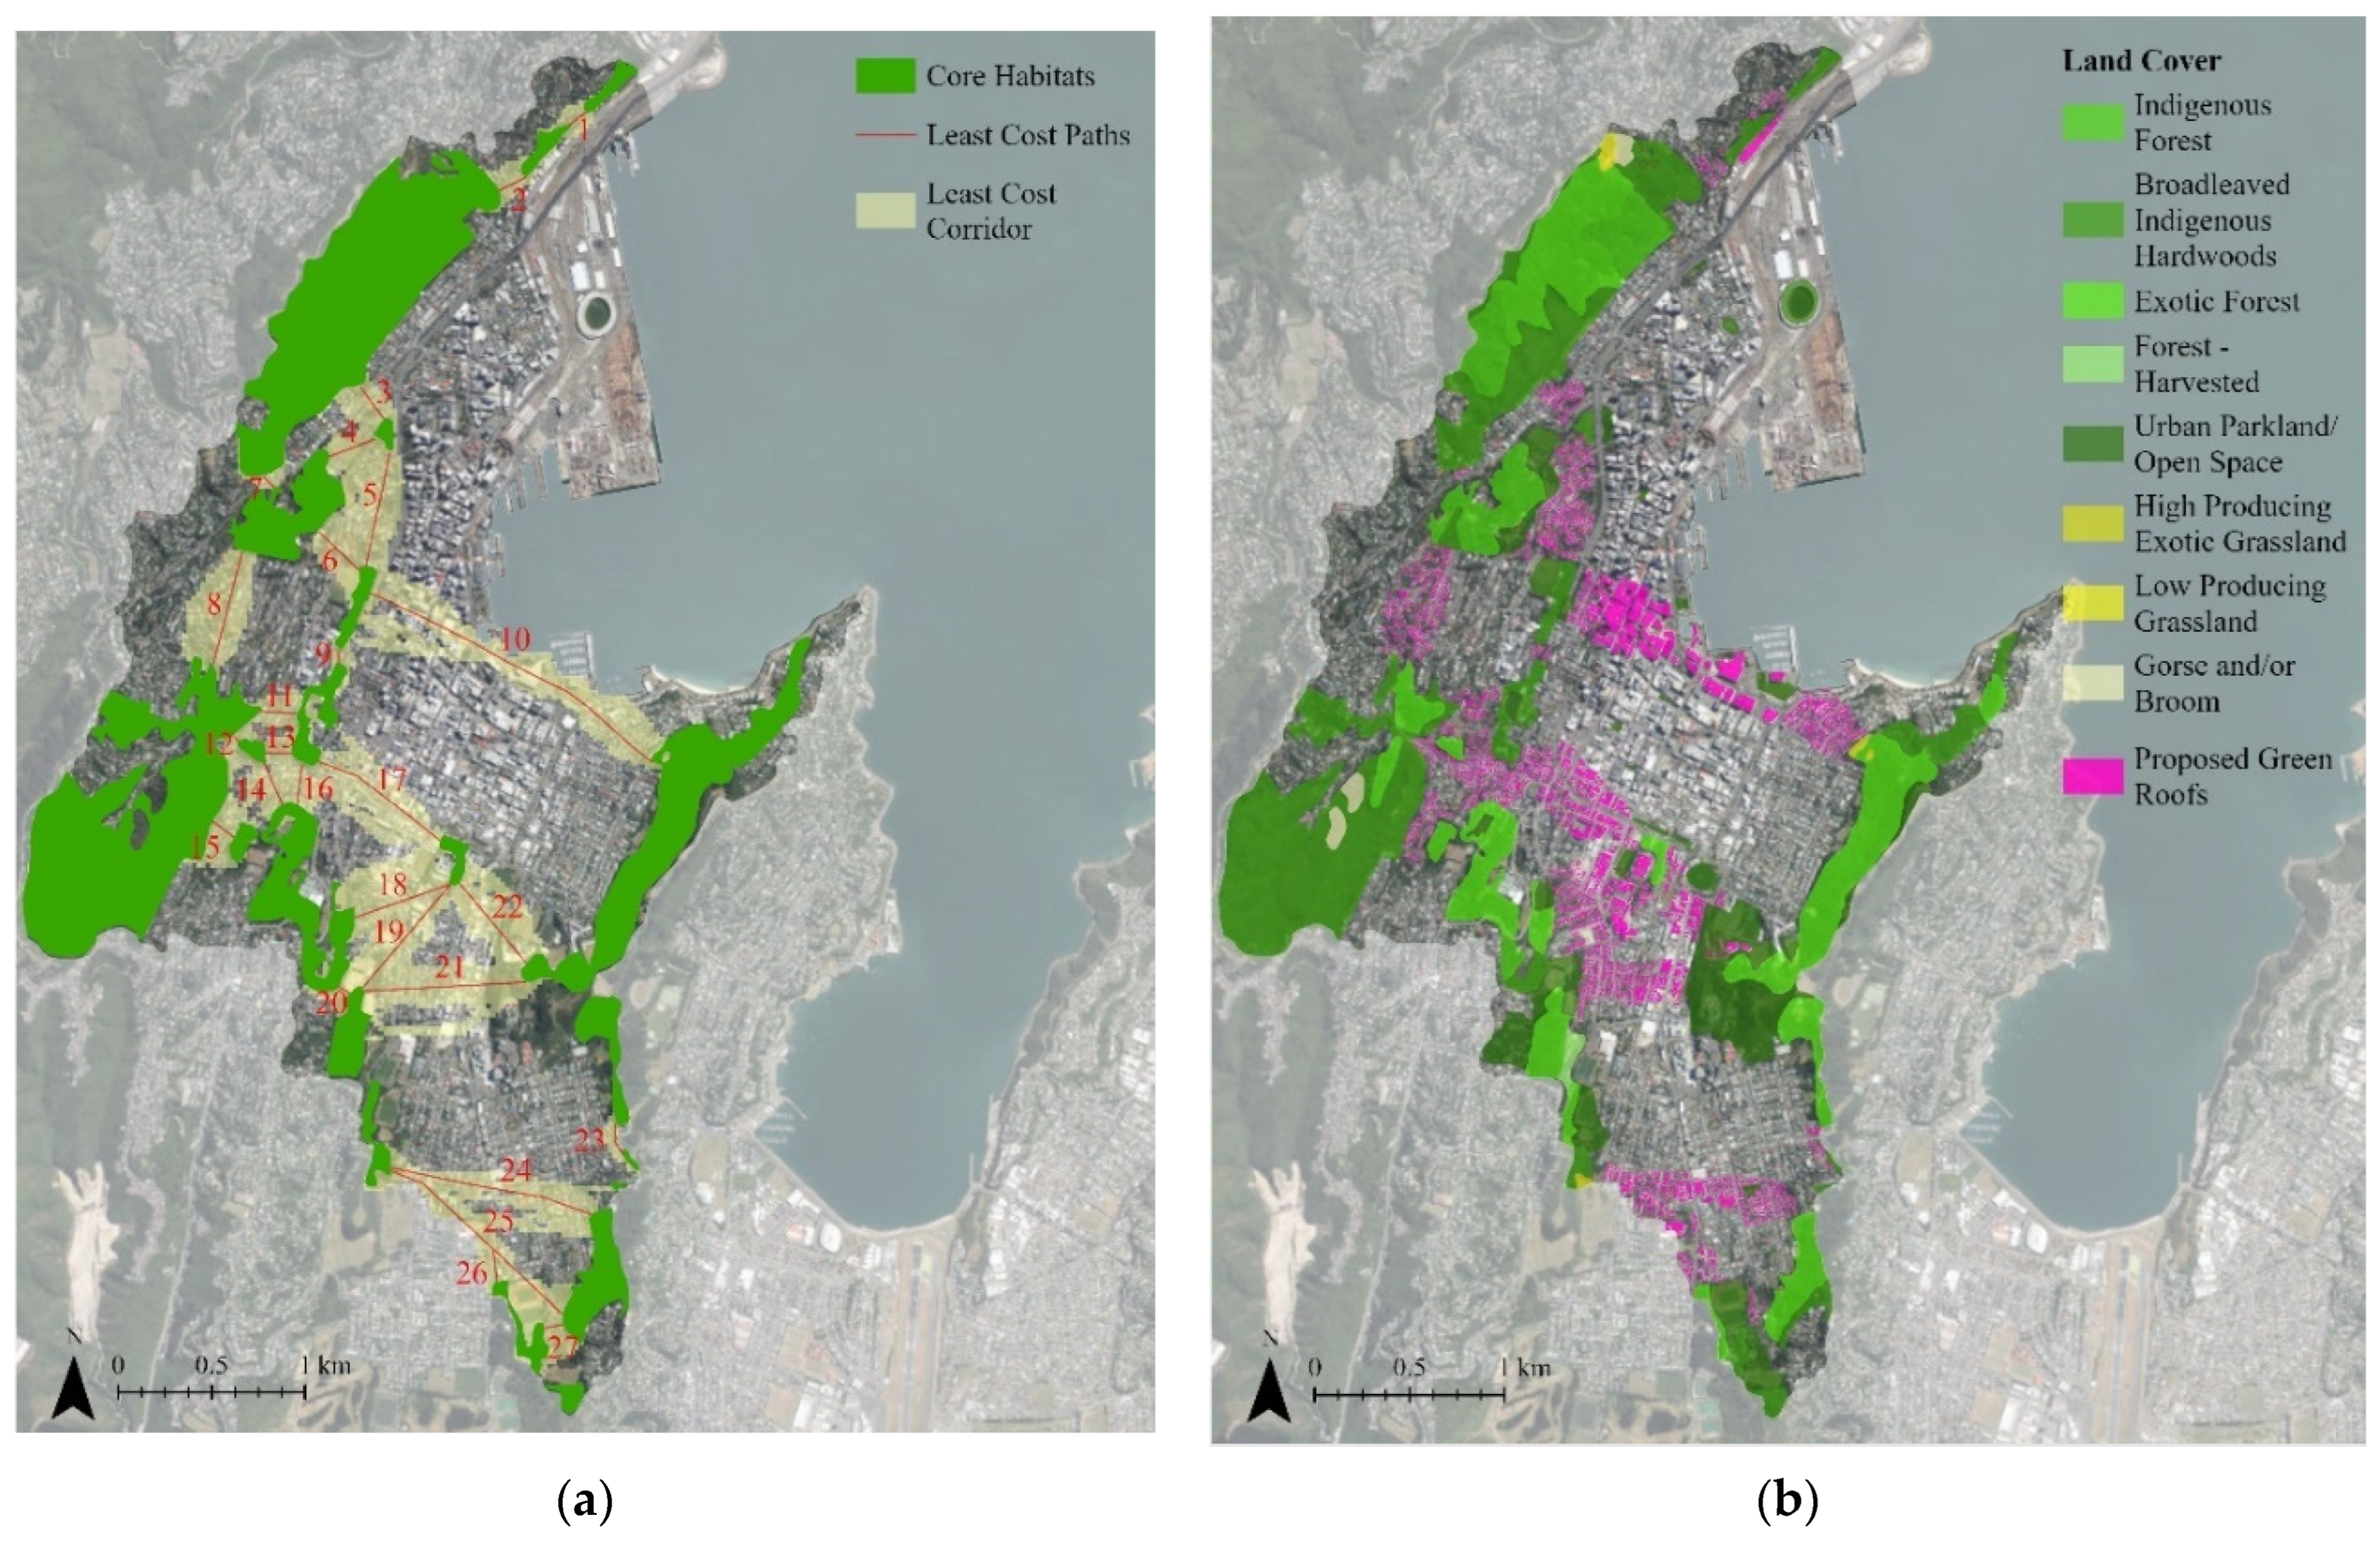
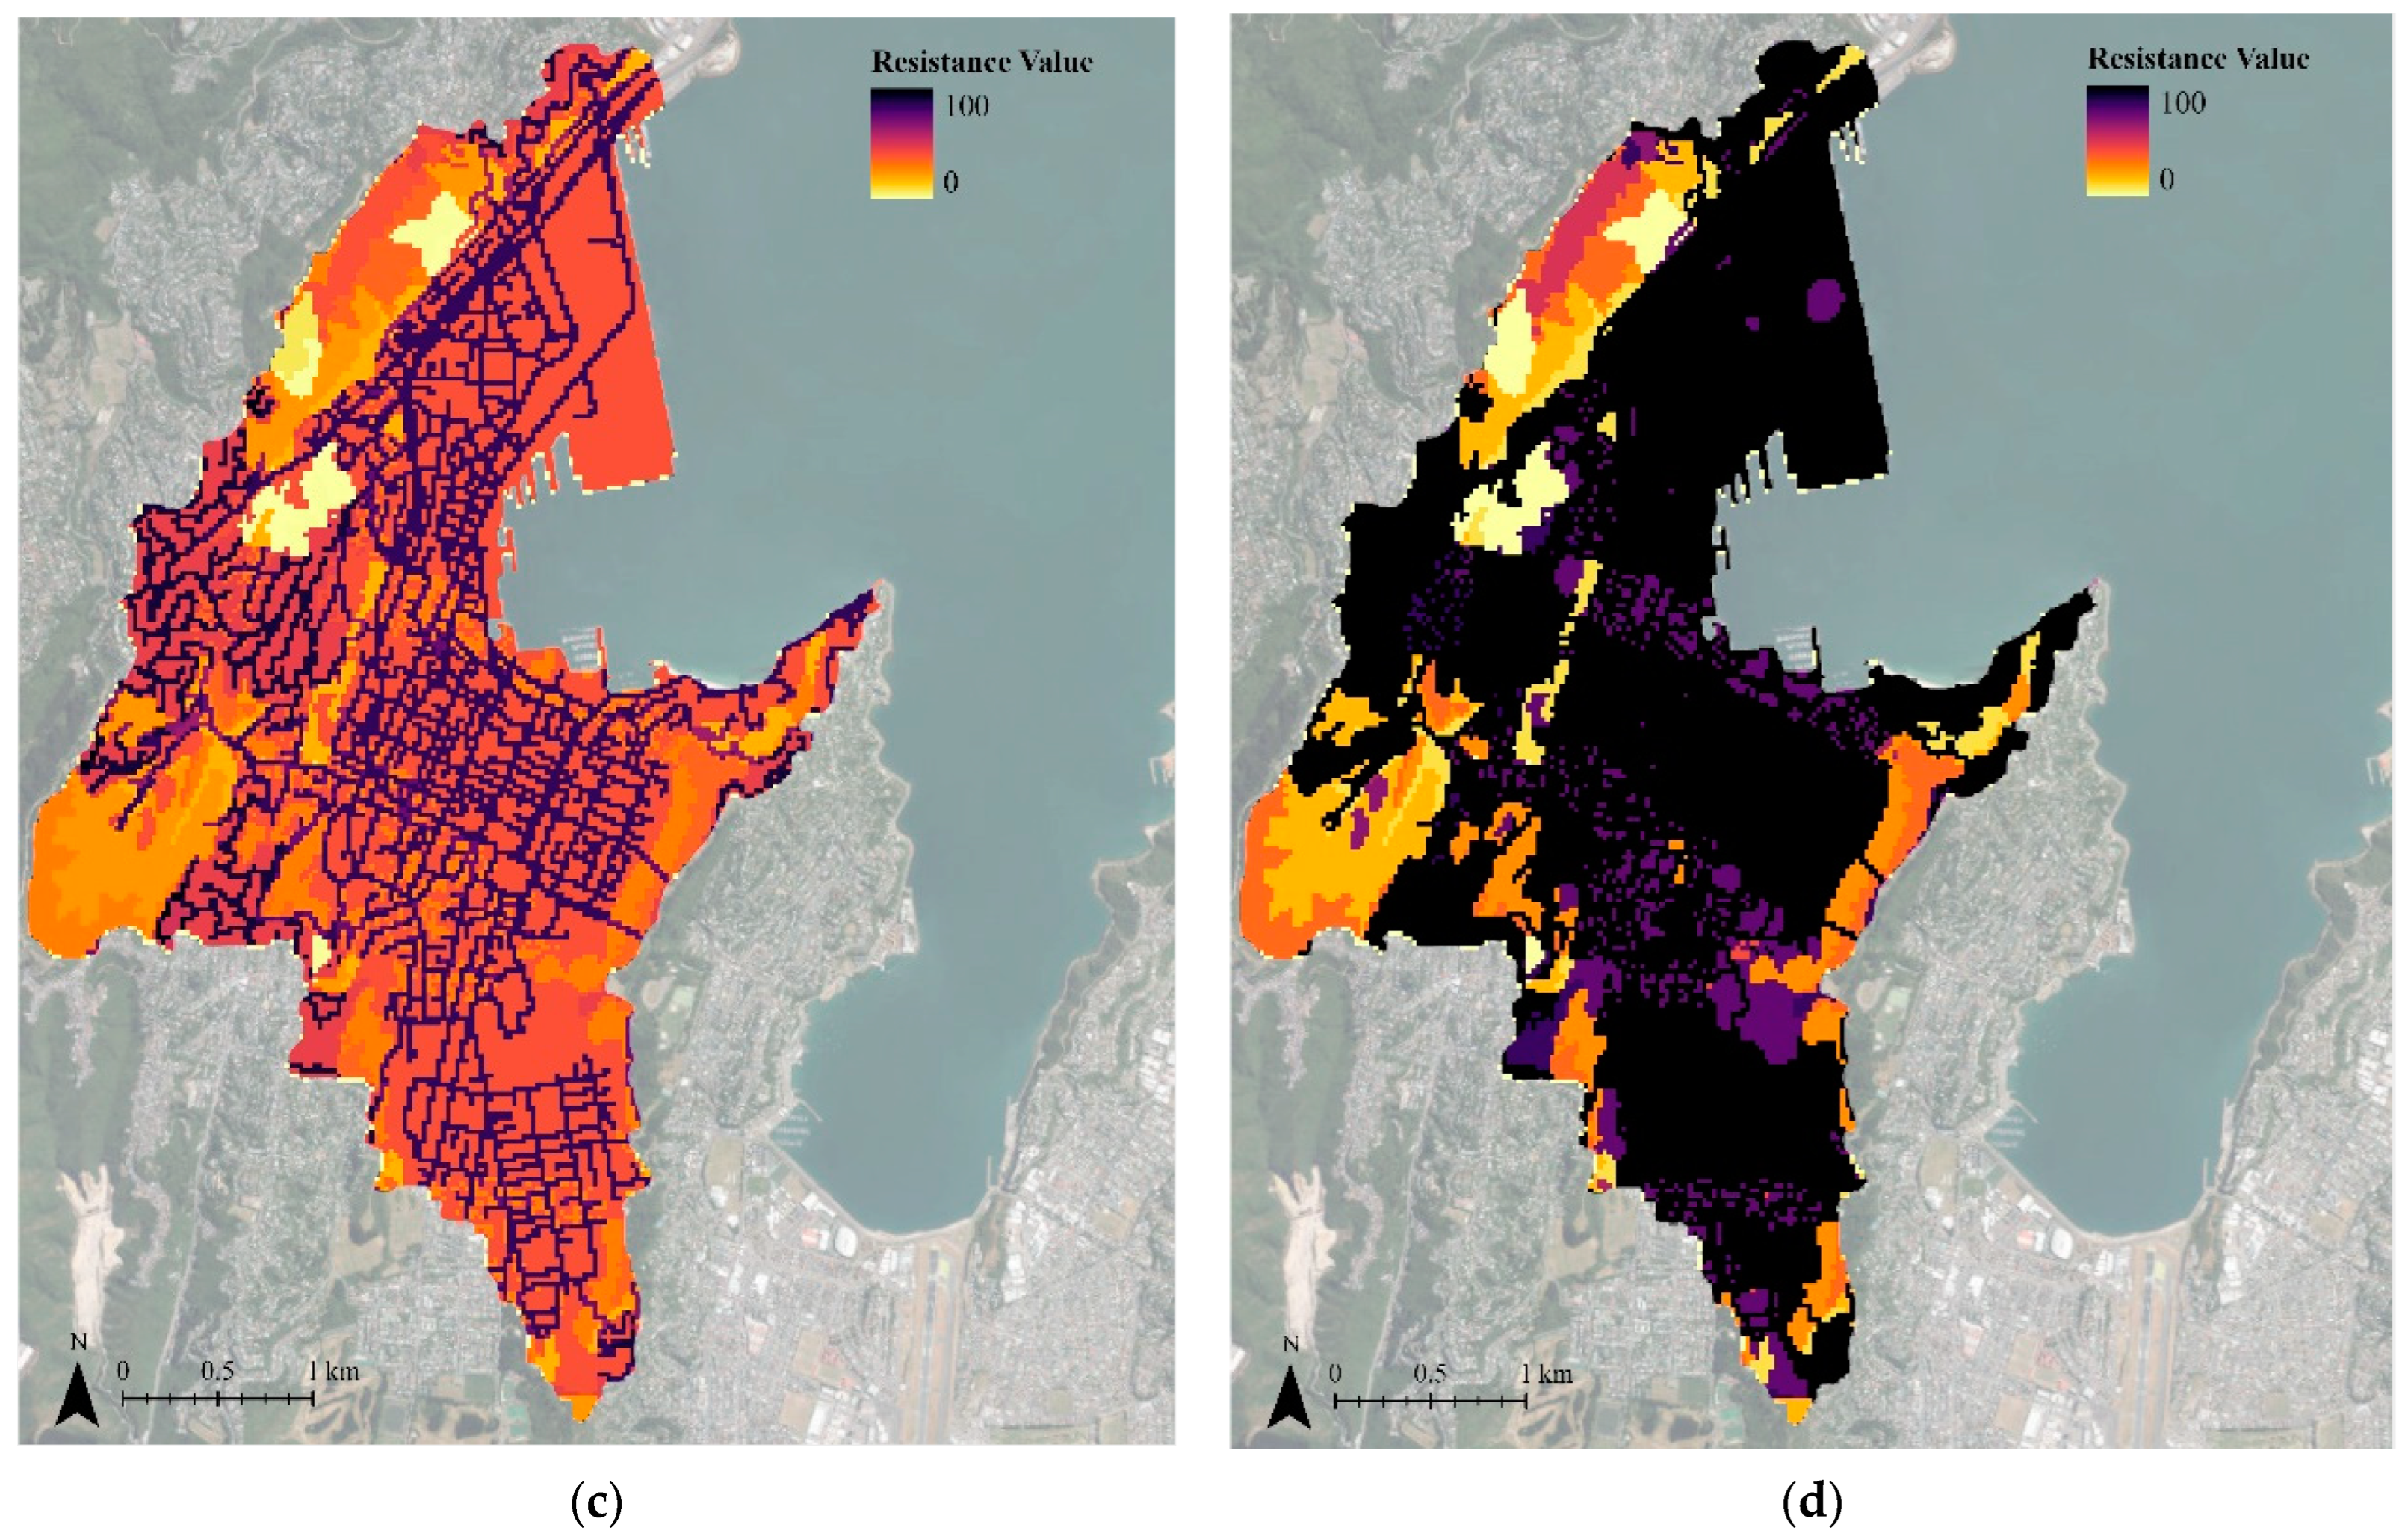
After obtaining the results from the Linkage Pathways tool for the existing green infrastructure network, the least-cost paths for all four species were overlayed and consolidated to identify key dispersal routes where additional habitats are needed to make the movement and dispersal of all four species easier. Figure 5a was used to guide the design of green roof corridors that could reduce the resistance values of the least-cost paths that connect core habitats. The Wellington Buildings shapefile [76] was used to change the land cover classification (i.e., material composition) of the building roofs along the least-cost paths (Figure 5b). The green roofs were assigned the same resistance values as the ‘Urban Parkland/Open Space’ classification due to their similarities to the constructed habitats and designed planting communities of typical urban parks. The diversity of the type of green spaces included in the ‘Urban Parkland/Open Space’ classification, including grassy open areas, gardens, and sparsely-treed areas [64], was the best proxy for the variation in green roof types, which can support plant communities in a manner that is similar to that of deserts/grasslands (extensive), meadows (semi-intensive), or sparsely-treed gardens/open areas (intensive) [85,86,87]. There was no change to the core habitats’ feature layer as the green roofs would likely be unable to replicate forest habitats well enough for them to be considered core habitats. The updated land cover file was used to generate new species resistance rasters (Figure 6). The Linkage Pathways tool was then run again for the four study species.
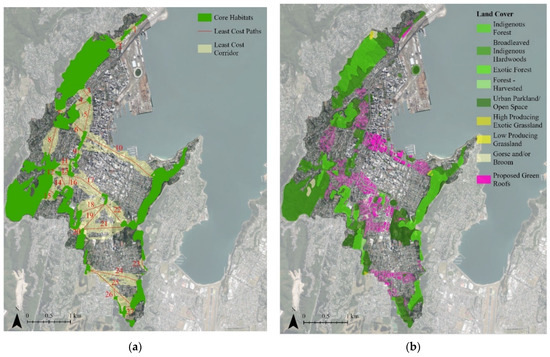
Figure 5.
Urban green infrastructure design using outputs from the Linkage Pathways tool: (a) consolidated least-cost paths connecting core habitats for the four study species; (b) proposed locations for green roofs to supplement the existing green space network. The base satellite image is from ref. [55] (CC BY 4.0).
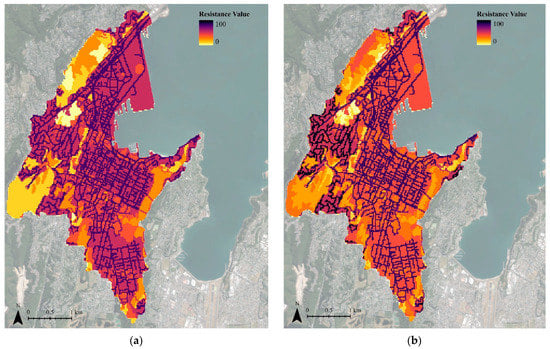
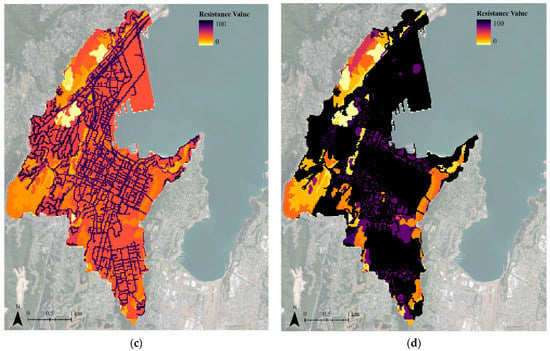
Figure 6.
Species resistance rasters of the proposed green infrastructure network for the Linkage Pathways tool: (a) kererū; (b) tūī; (c) korimako; (d) hihi. The base satellite image is from ref. [55] (CC BY 4.0).
With the addition of the green roof network, the average Euclidean (actual) least-cost path distance remained 0.5 km for all four species, as no new core habitats were added. The average cost-weighted distance of the least-cost paths was 21.9 km, meaning that the 0.5 km paths are equivalent to travelling a distance 41.3 times longer, a slight reduction compared to the existing green infrastructure network. There were large variations in the impacts of the additional green roofs on the cost-weighted distances and corridor quality between the four study species. This will be discussed for each species in Section 3.1, Section 3.2, Section 3.3 and Section 3.4.
3.1. Kererū
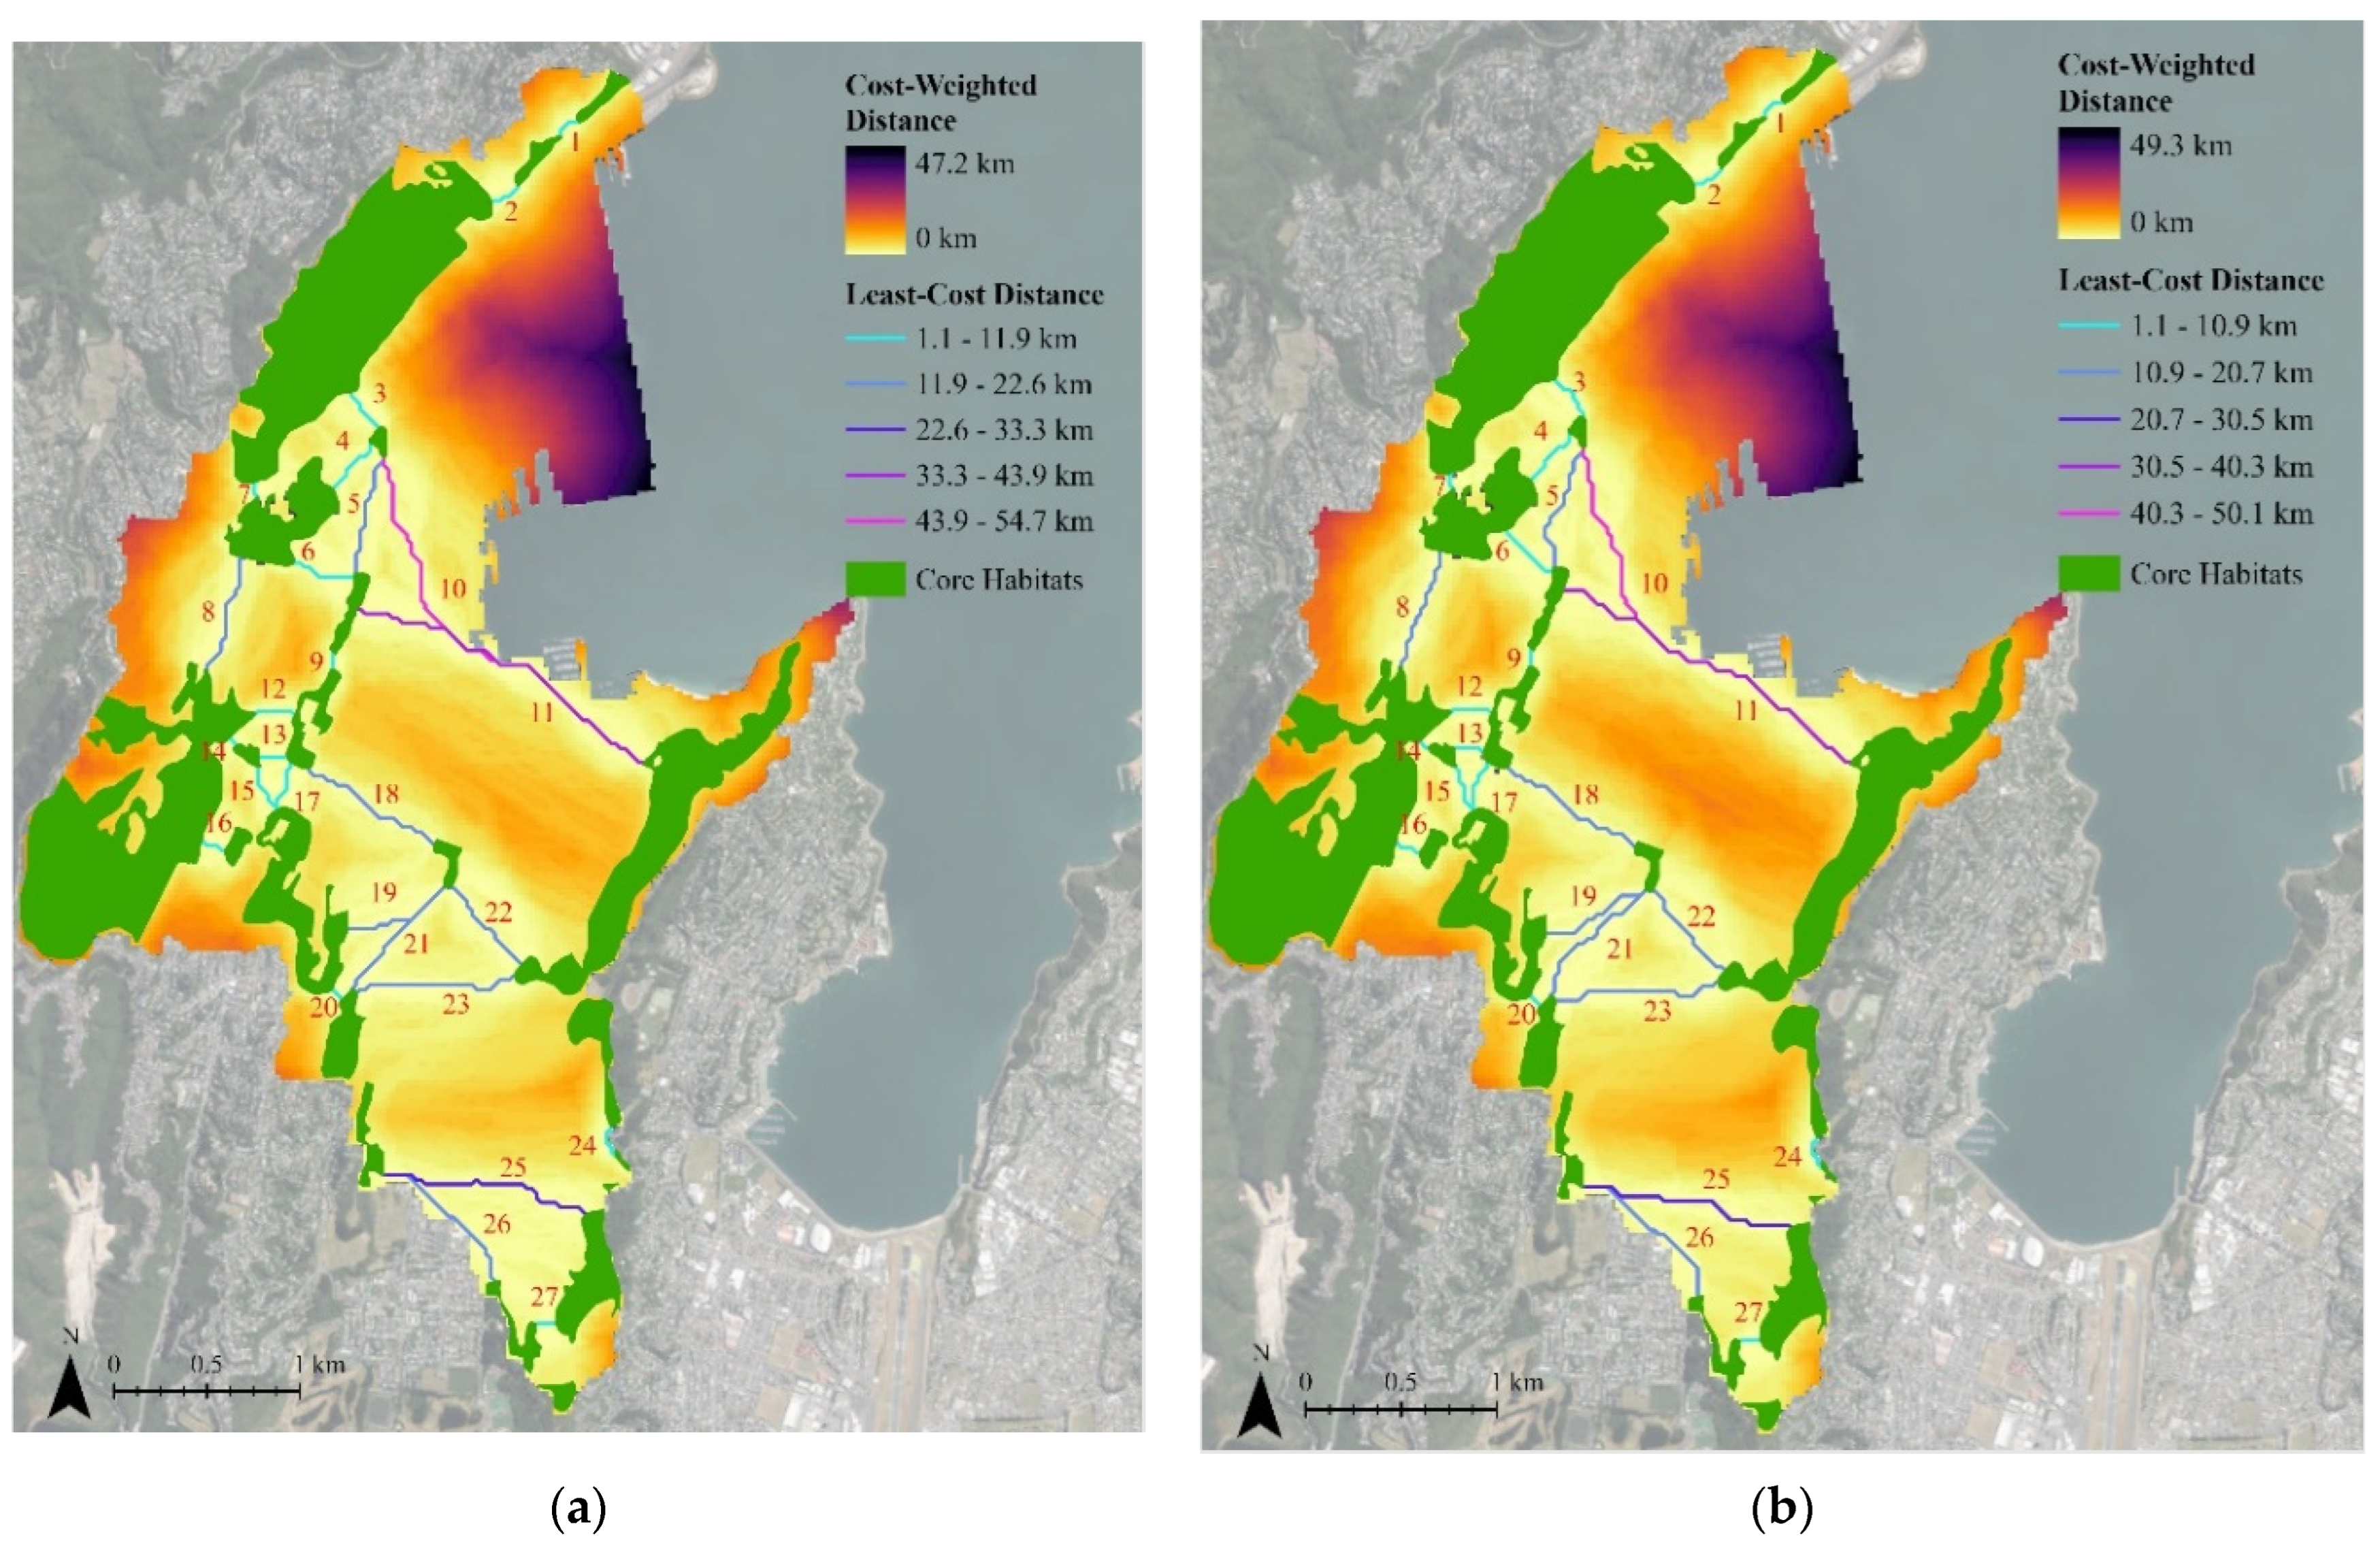
The kererū had the easiest time dispersing across the study area of the four study species. The Linkage Pathways tool identified 27 least-cost paths between core habitat patches for the kererū. The average Euclidean (actual) distance of the paths was 0.4 km; however, the average least-cost distance was 10.9 km for the existing green infrastructure network (Figure 7). The actual distance only accounts for 4% of the cost of traversing the study area. Adding 0.7 km2 of green roof area (5% of the total study area) reduced the average least-cost distance of the paths by 9.3%, meaning that the green roof corridors helped ease travel across the study area by removing approximately 1 km of cost-weighted distance. The reduction in cost-weighted distances was not the same for all paths. Paths 10 and 11 had the highest cost-weighted distances (50.6 km and 38.5 km, respectively) for the existing green infrastructure network. These were reduced by 9.1% (4.6 km) and 13.0% (5.0 km), respectively, with the addition of green roof corridors along these paths. Some of the shorter linkages that were already close to existing green spaces did not have as large of a reduction. For example, the cost-weighted distance of path 8 was only reduced by 2.7% (177 m) with the addition of green roofs.
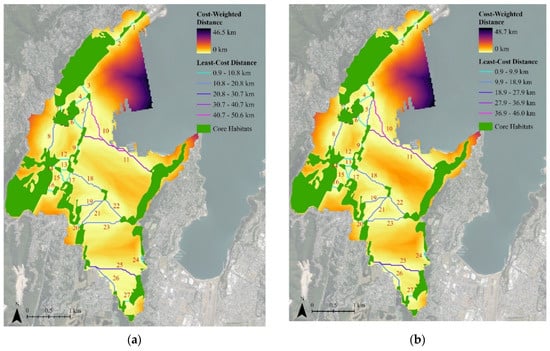
Figure 7.
Least-cost paths and cost-weighted distance maps for the kererū for: (a) the existing green infrastructure network; (b) the proposed green infrastructure network. The numbers identify individual least-cost paths. The base satellite image is from ref. [55] (CC BY 4.0).
The average cost-weighted distance to Euclidean distance ratio for the 27 least-cost paths was 24.9 for the existing green infrastructure network, which was reduced to 23.1 (a 7.1% improvement in corridor quality) with the addition of green roof corridors. Paths 11 and 17 were most impacted by the addition of green roofs, with 13.0% and 12.5% improvements in corridor quality, respectively. Even with these improvements, the paths along the waterfront (paths 10 and 11) remain the most difficult for kererū. There was no notable change in the cost-weighted distances of the areas outside the least-cost paths, with the transportation and port infrastructure along the waterfront acting as major barriers to dispersal in both scenarios.
3.2. Tūī
Tūī had levels of dispersal ease across the study area that were similar to that of the kererū. The Linkage Pathways tool identified 27 least-cost paths between core habitat patches for the tūī. The average Euclidean (actual) distance of the least-cost paths was 0.4 km; however, the average cost-weighted distance was 11.9 km for the existing green infrastructure network (Figure 8). The actual distance only accounts for 4% of the cost of traversing the study area. Adding 0.7 km2 of green roof area (5% of the total study area) reduced the average least-cost distance of the paths by 8.5%, meaning that the green roof corridors helped ease travel across the study area by removing approximately 1 km of cost-weighted distance. The reduction in cost-weighted distances was not the same for all paths. Paths 10 and 11 had the highest cost-weighted distances, 54.7 km and 41.4 km, respectively, for the existing green infrastructure network. These were reduced by 8.4% (4.6 km) and 11.9% (4.9 km), respectively, with the addition of green roof corridors along these paths. Some of the shorter linkages that were already close to existing green spaces did not have as large reductions. For example, the cost-weighted distance of path 8 was only reduced by 2.1% (158 m) with the addition of green roofs.
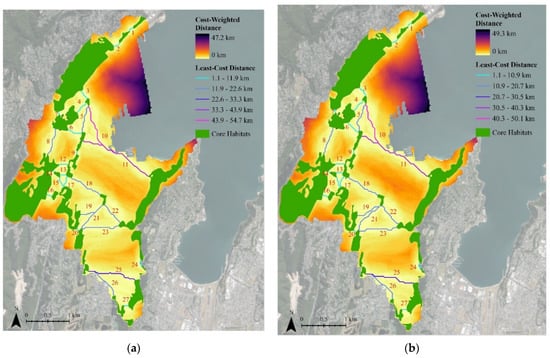
Figure 8.
Least-cost paths and cost-weighted distance maps for the tūī for: (a) the existing green infrastructure network; (b) the proposed green infrastructure network. The numbers identify individual least-cost paths. The base satellite image is from ref. [55] (CC BY 4.0).
The average cost-weighted distance to Euclidean distance ratio for the 27 least-cost paths was 28.0 for the existing green infrastructure network, which was reduced to 26.2 (a 6.4% improvement in corridor quality) with the addition of green roof corridors. Paths 11 and 17 were most impacted by the addition of green roofs, with 11.9% and 14.1% improvements in corridor quality, respectively. Similar to the kererū, the paths along the waterfront (paths 10 and 11) remain the most difficult routes for tūī, even with green roof corridors. There was no notable change in the cost-weighted distances of the areas outside the least-cost paths, with the transportation and port infrastructure along the waterfront acting as major barriers to dispersal in both scenarios.
3.3. Korimako
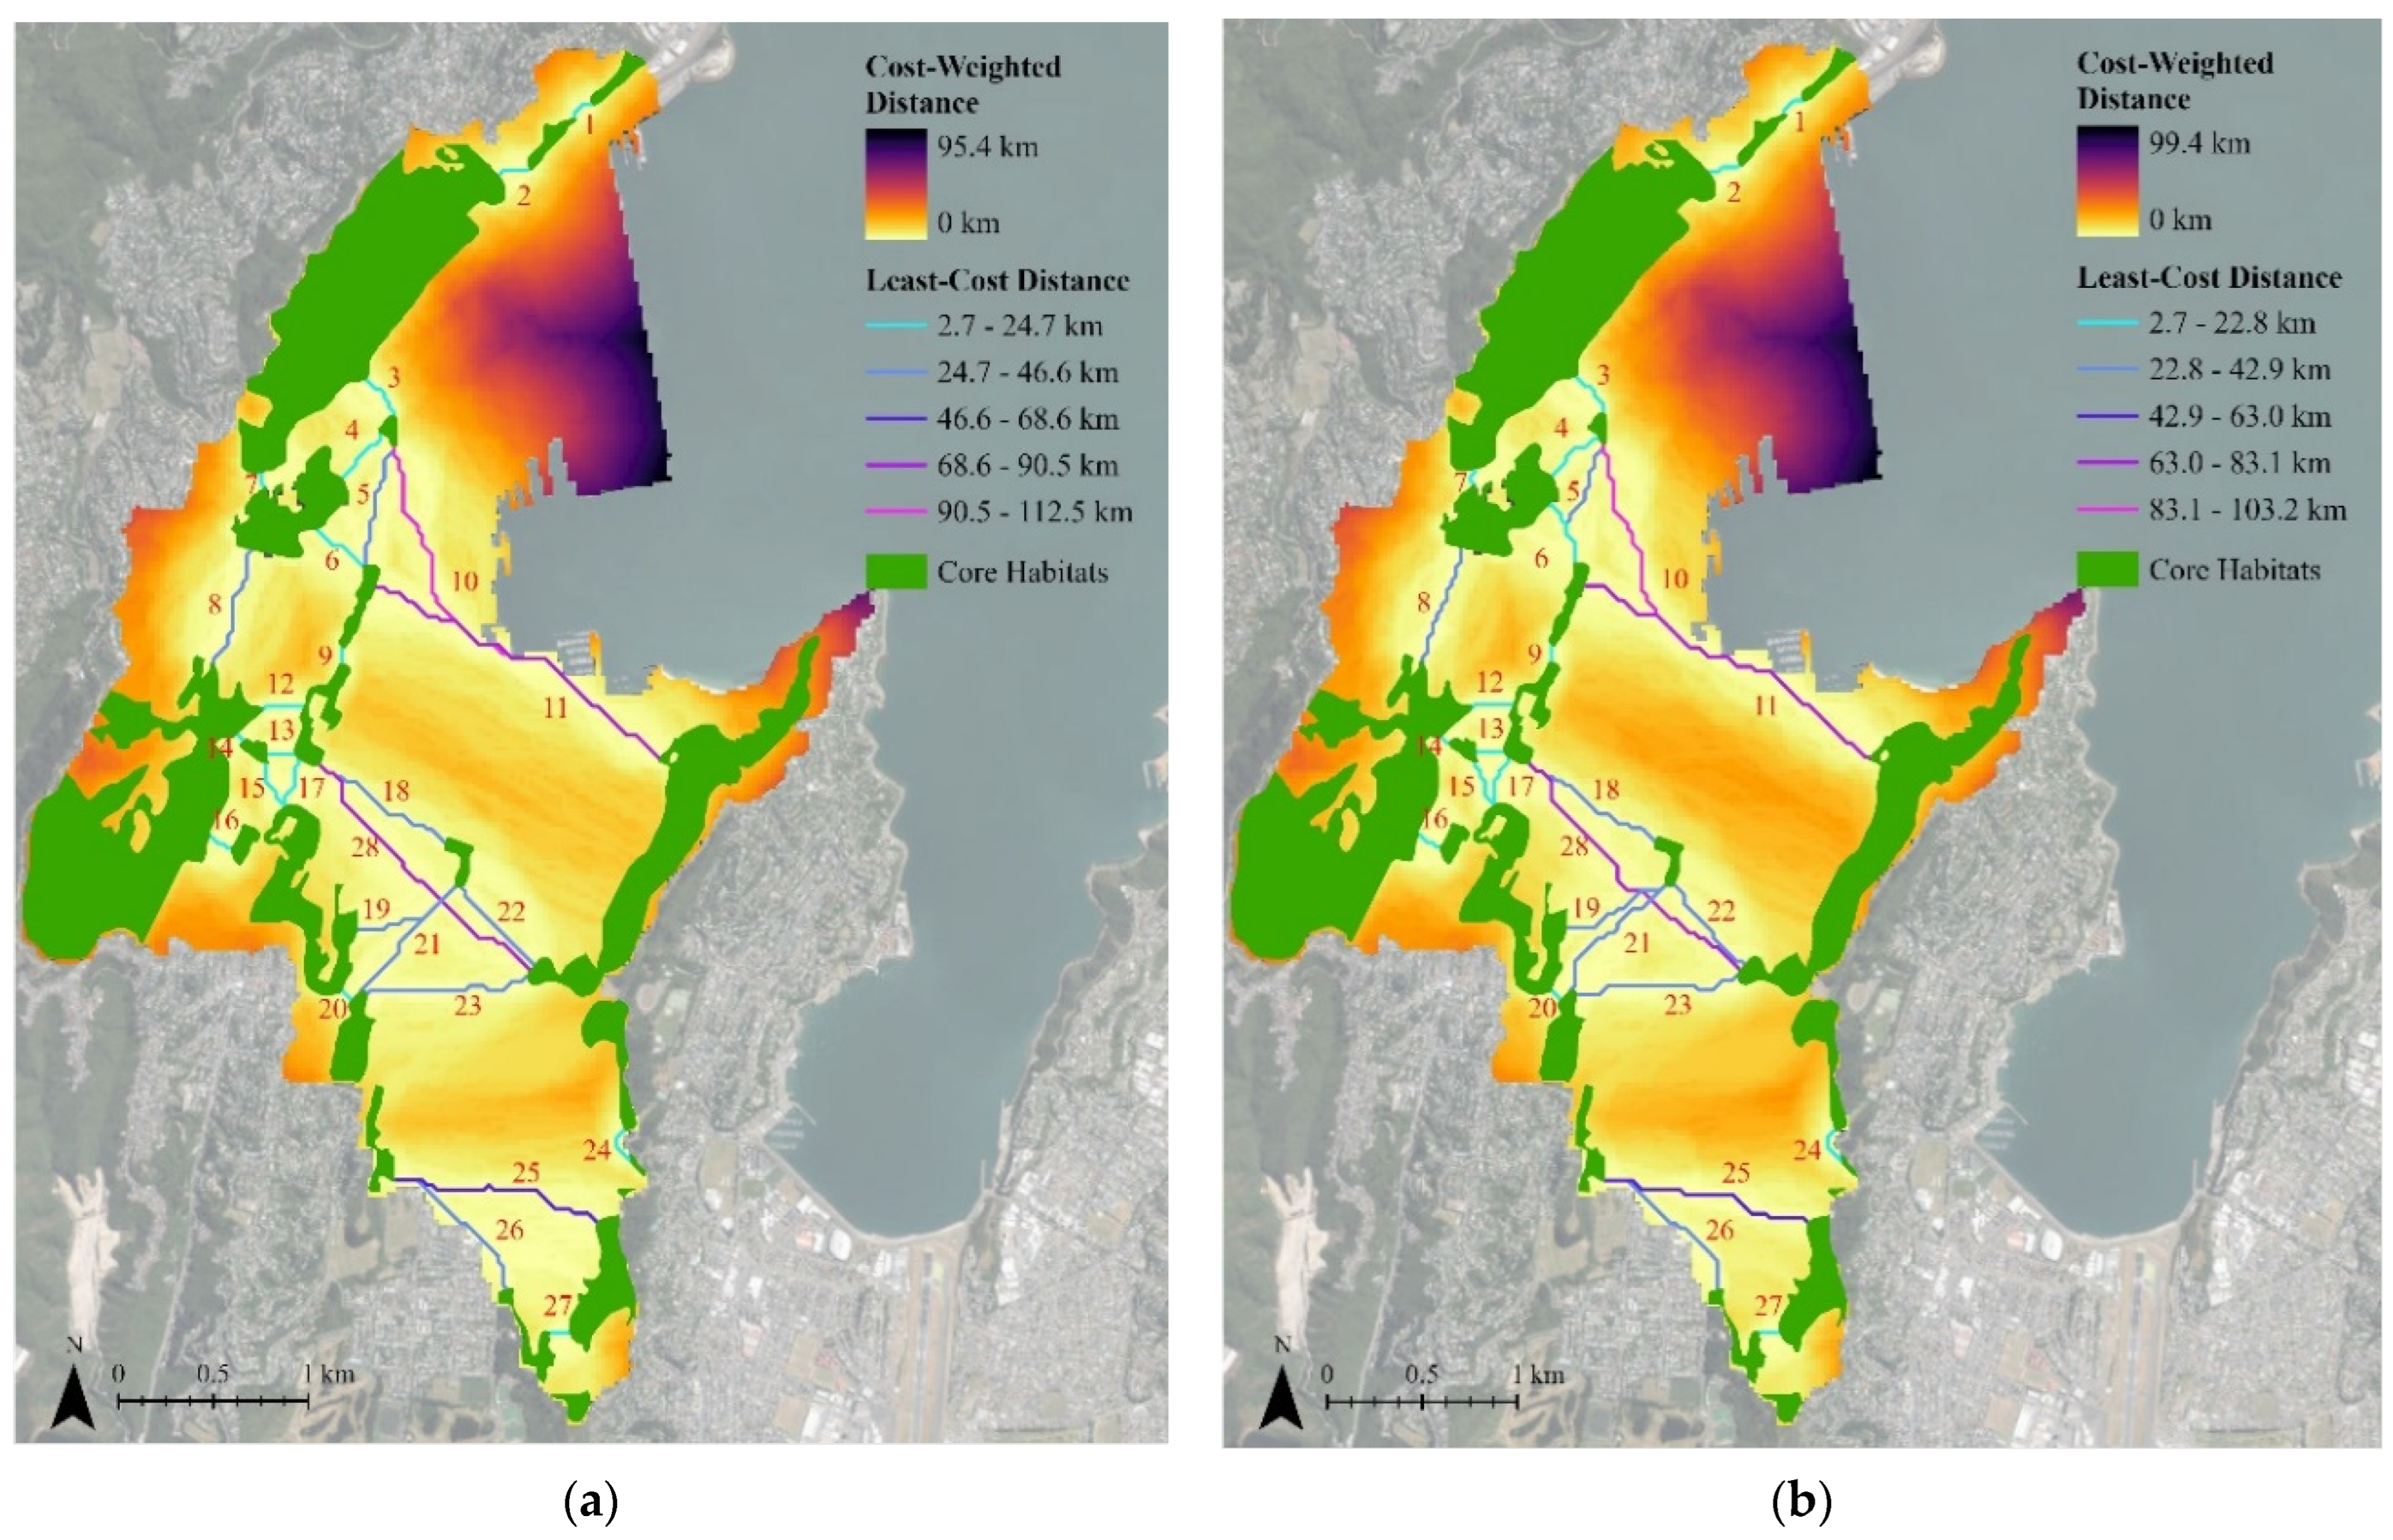
The study area is nearly twice as difficult for the korimako to disperse across compared to the kererū and tūī. The Linkage Pathways tool identified 28 least-cost paths between core habitat patches for the korimako. The average Euclidean (actual) distance of the least-cost paths was 0.5 km; however, the average cost-weighted distance was 26.6 km for the existing green infrastructure network (Figure 9). The actual distance only accounts for 2% of the cost of traversing the study area. Adding 0.7 km2 of green roof area (5% of the total study area) reduced the average least-cost distance of the paths by 8.7%, meaning that the green roof corridors helped ease travel across the study area by removing approximately 2.3 km of cost-weighted distance. The reduction in cost-weighted distances was not the same for all paths. Paths 10 and 11 had the highest cost-weighted distances (112.5 km and 85.8 km, respectively) for the existing green infrastructure network. These were reduced by 8.1% (9.2 km) and 11.7% (10.1 km), respectively, with the addition of green roof corridors along these paths. Some of the shorter linkages that were already close to existing green spaces did not have as large reductions. For example, the cost-weighted distance of path 8 was only reduced by 5.1% (794 m) with the addition of green roof corridors.
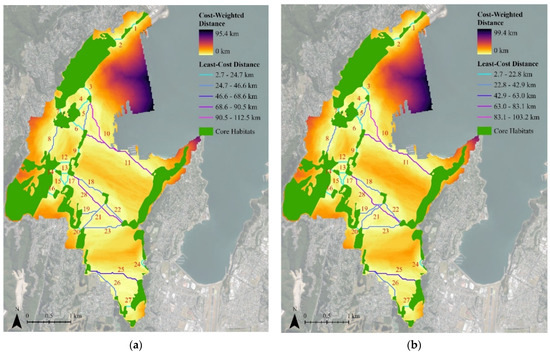
Figure 9.
Least-cost paths and cost-weighted distance maps for the korimako for: (a) the existing green infrastructure network; (b) the proposed green infrastructure network. The numbers identify individual least-cost paths. The base satellite image is from ref. [55] (CC BY 4.0).
The average cost-weighted distance to Euclidean distance ratio for the 28 least-cost paths was 58.4 for the existing green infrastructure network, which was reduced to 54.4 (a 6.9% improvement in corridor quality) with the addition of green roof corridors. Paths 11 and 17 were most impacted by the addition of green roofs, with 11.7% and 13.6% improvements in corridor quality, respectively. Similar to the kererū and tūī, for the korimako, the paths along the waterfront (paths 10 and 11) are the most difficult to cross, even with green roof corridors. There was no notable change in the cost-weighted distances of the areas outside the least-cost paths, with the transportation and port infrastructure along the waterfront acting as major barriers to dispersal in both scenarios.
3.4. Hihi
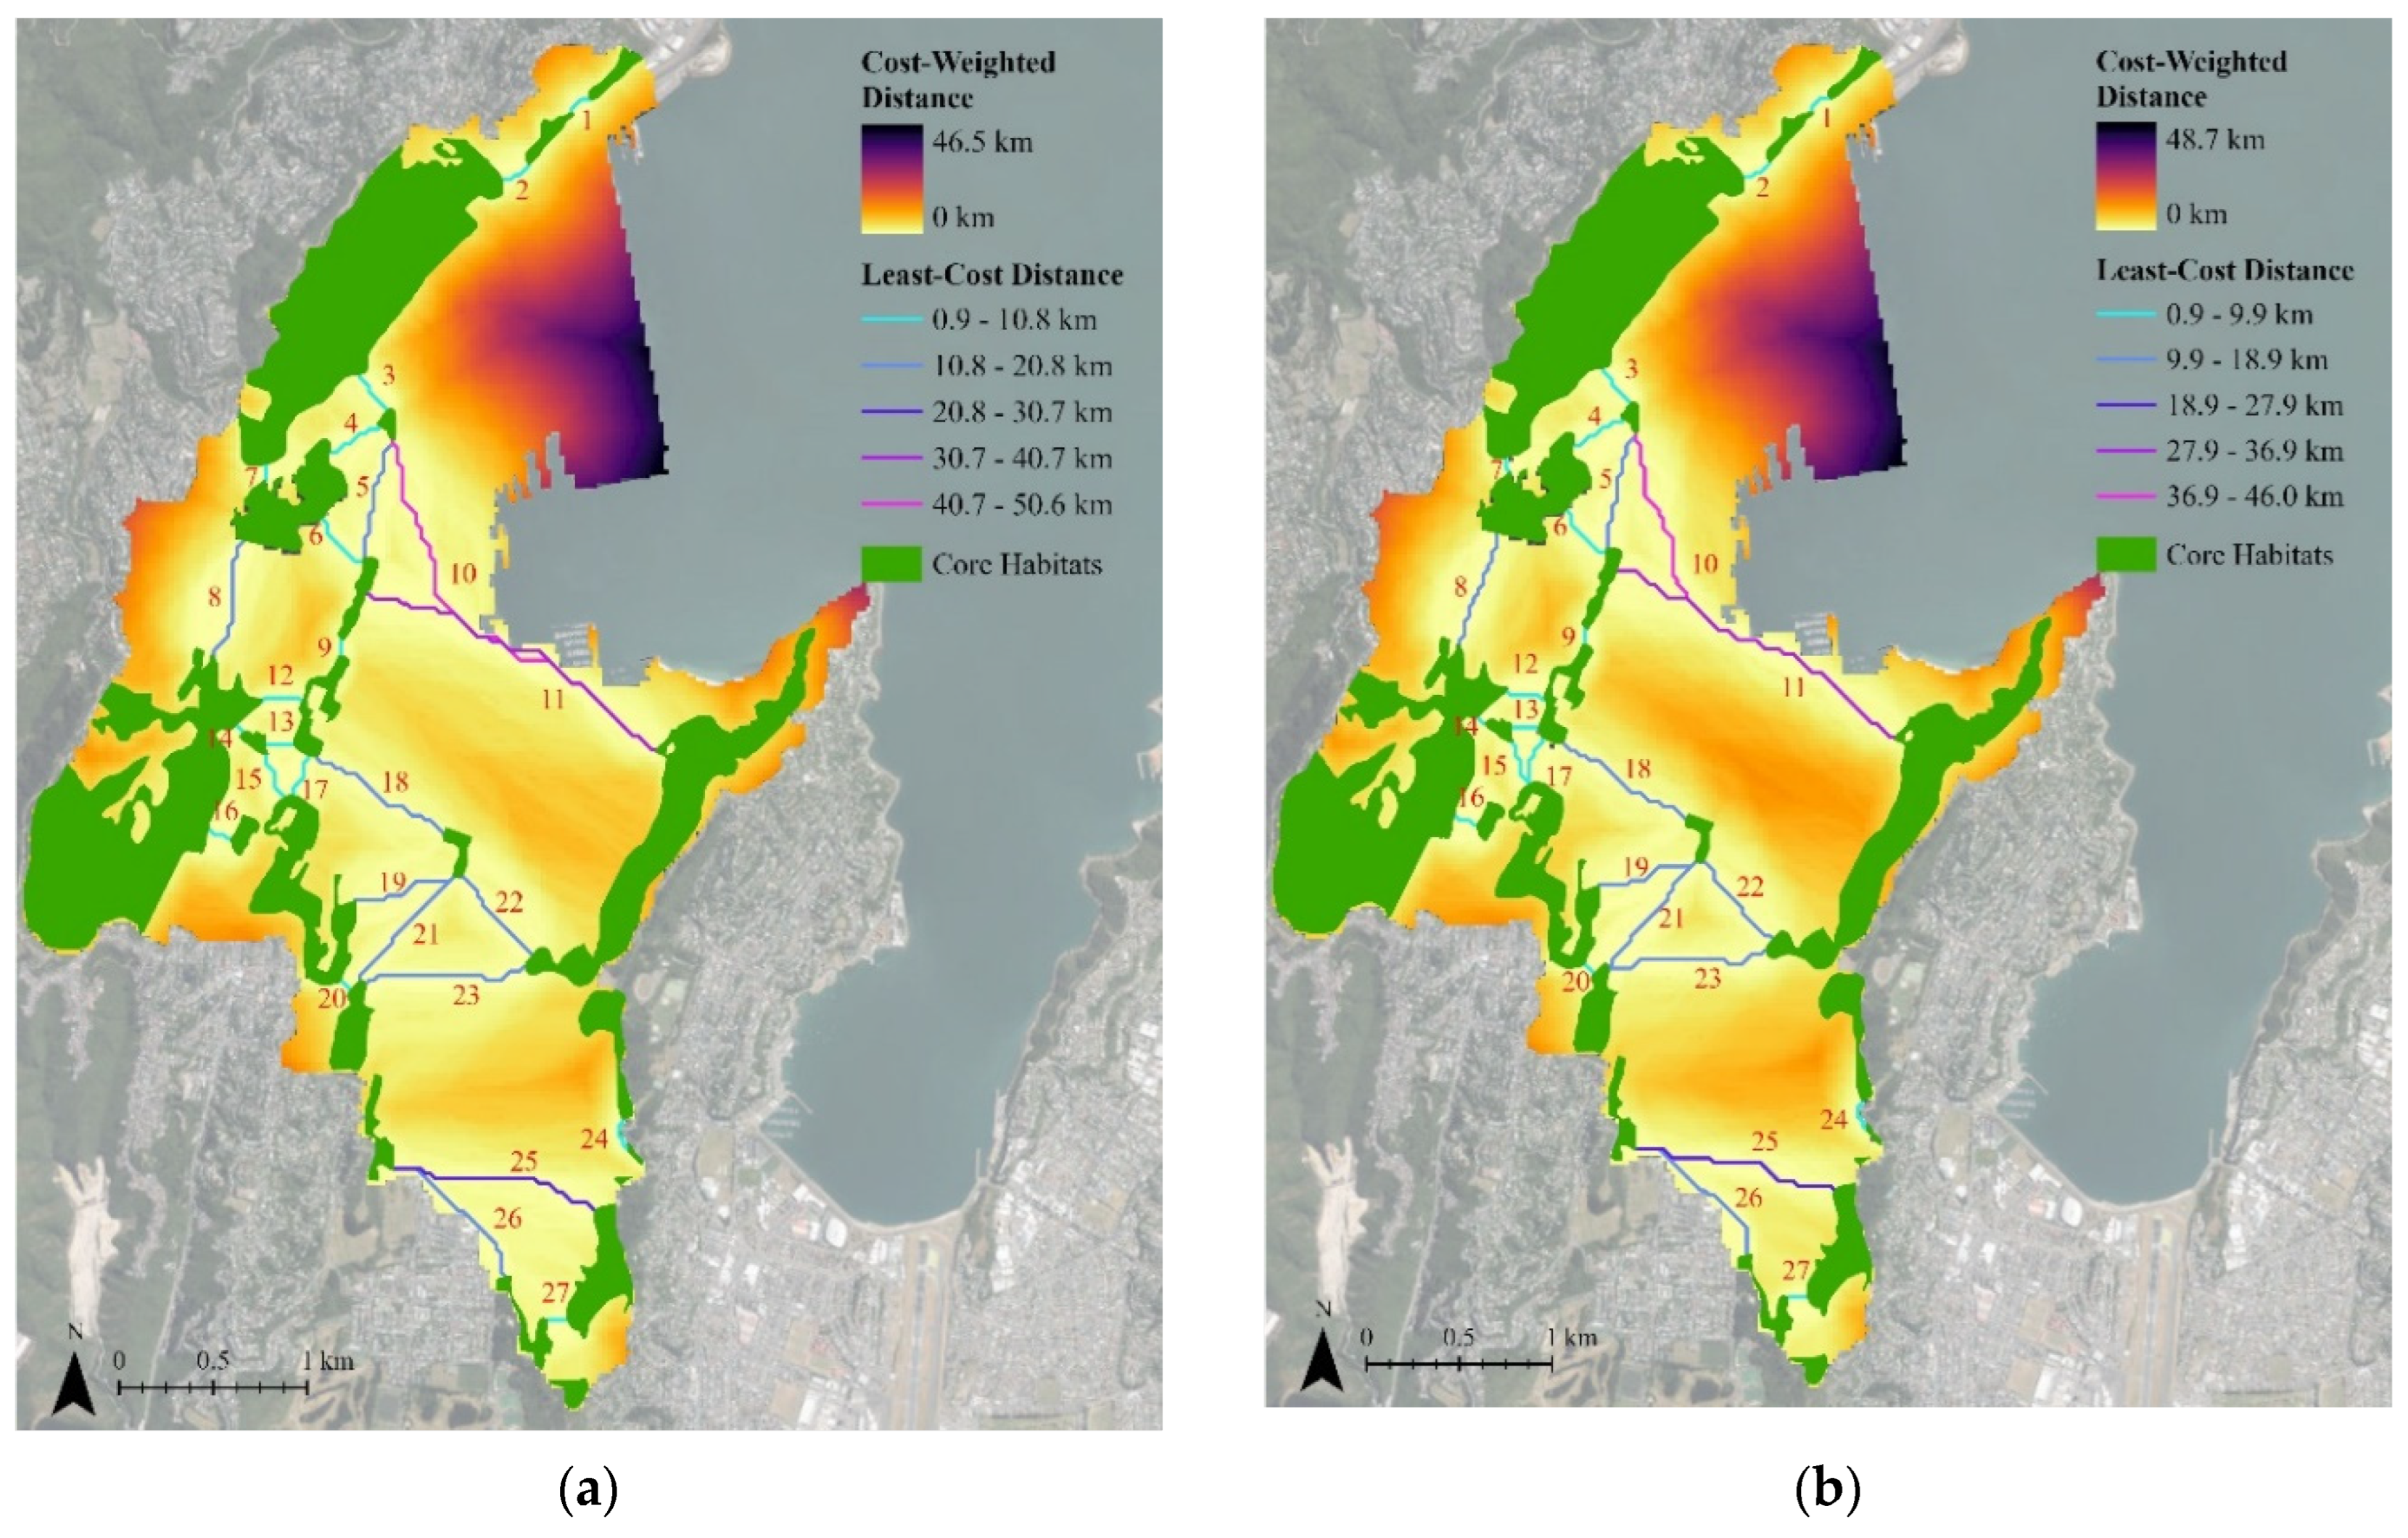
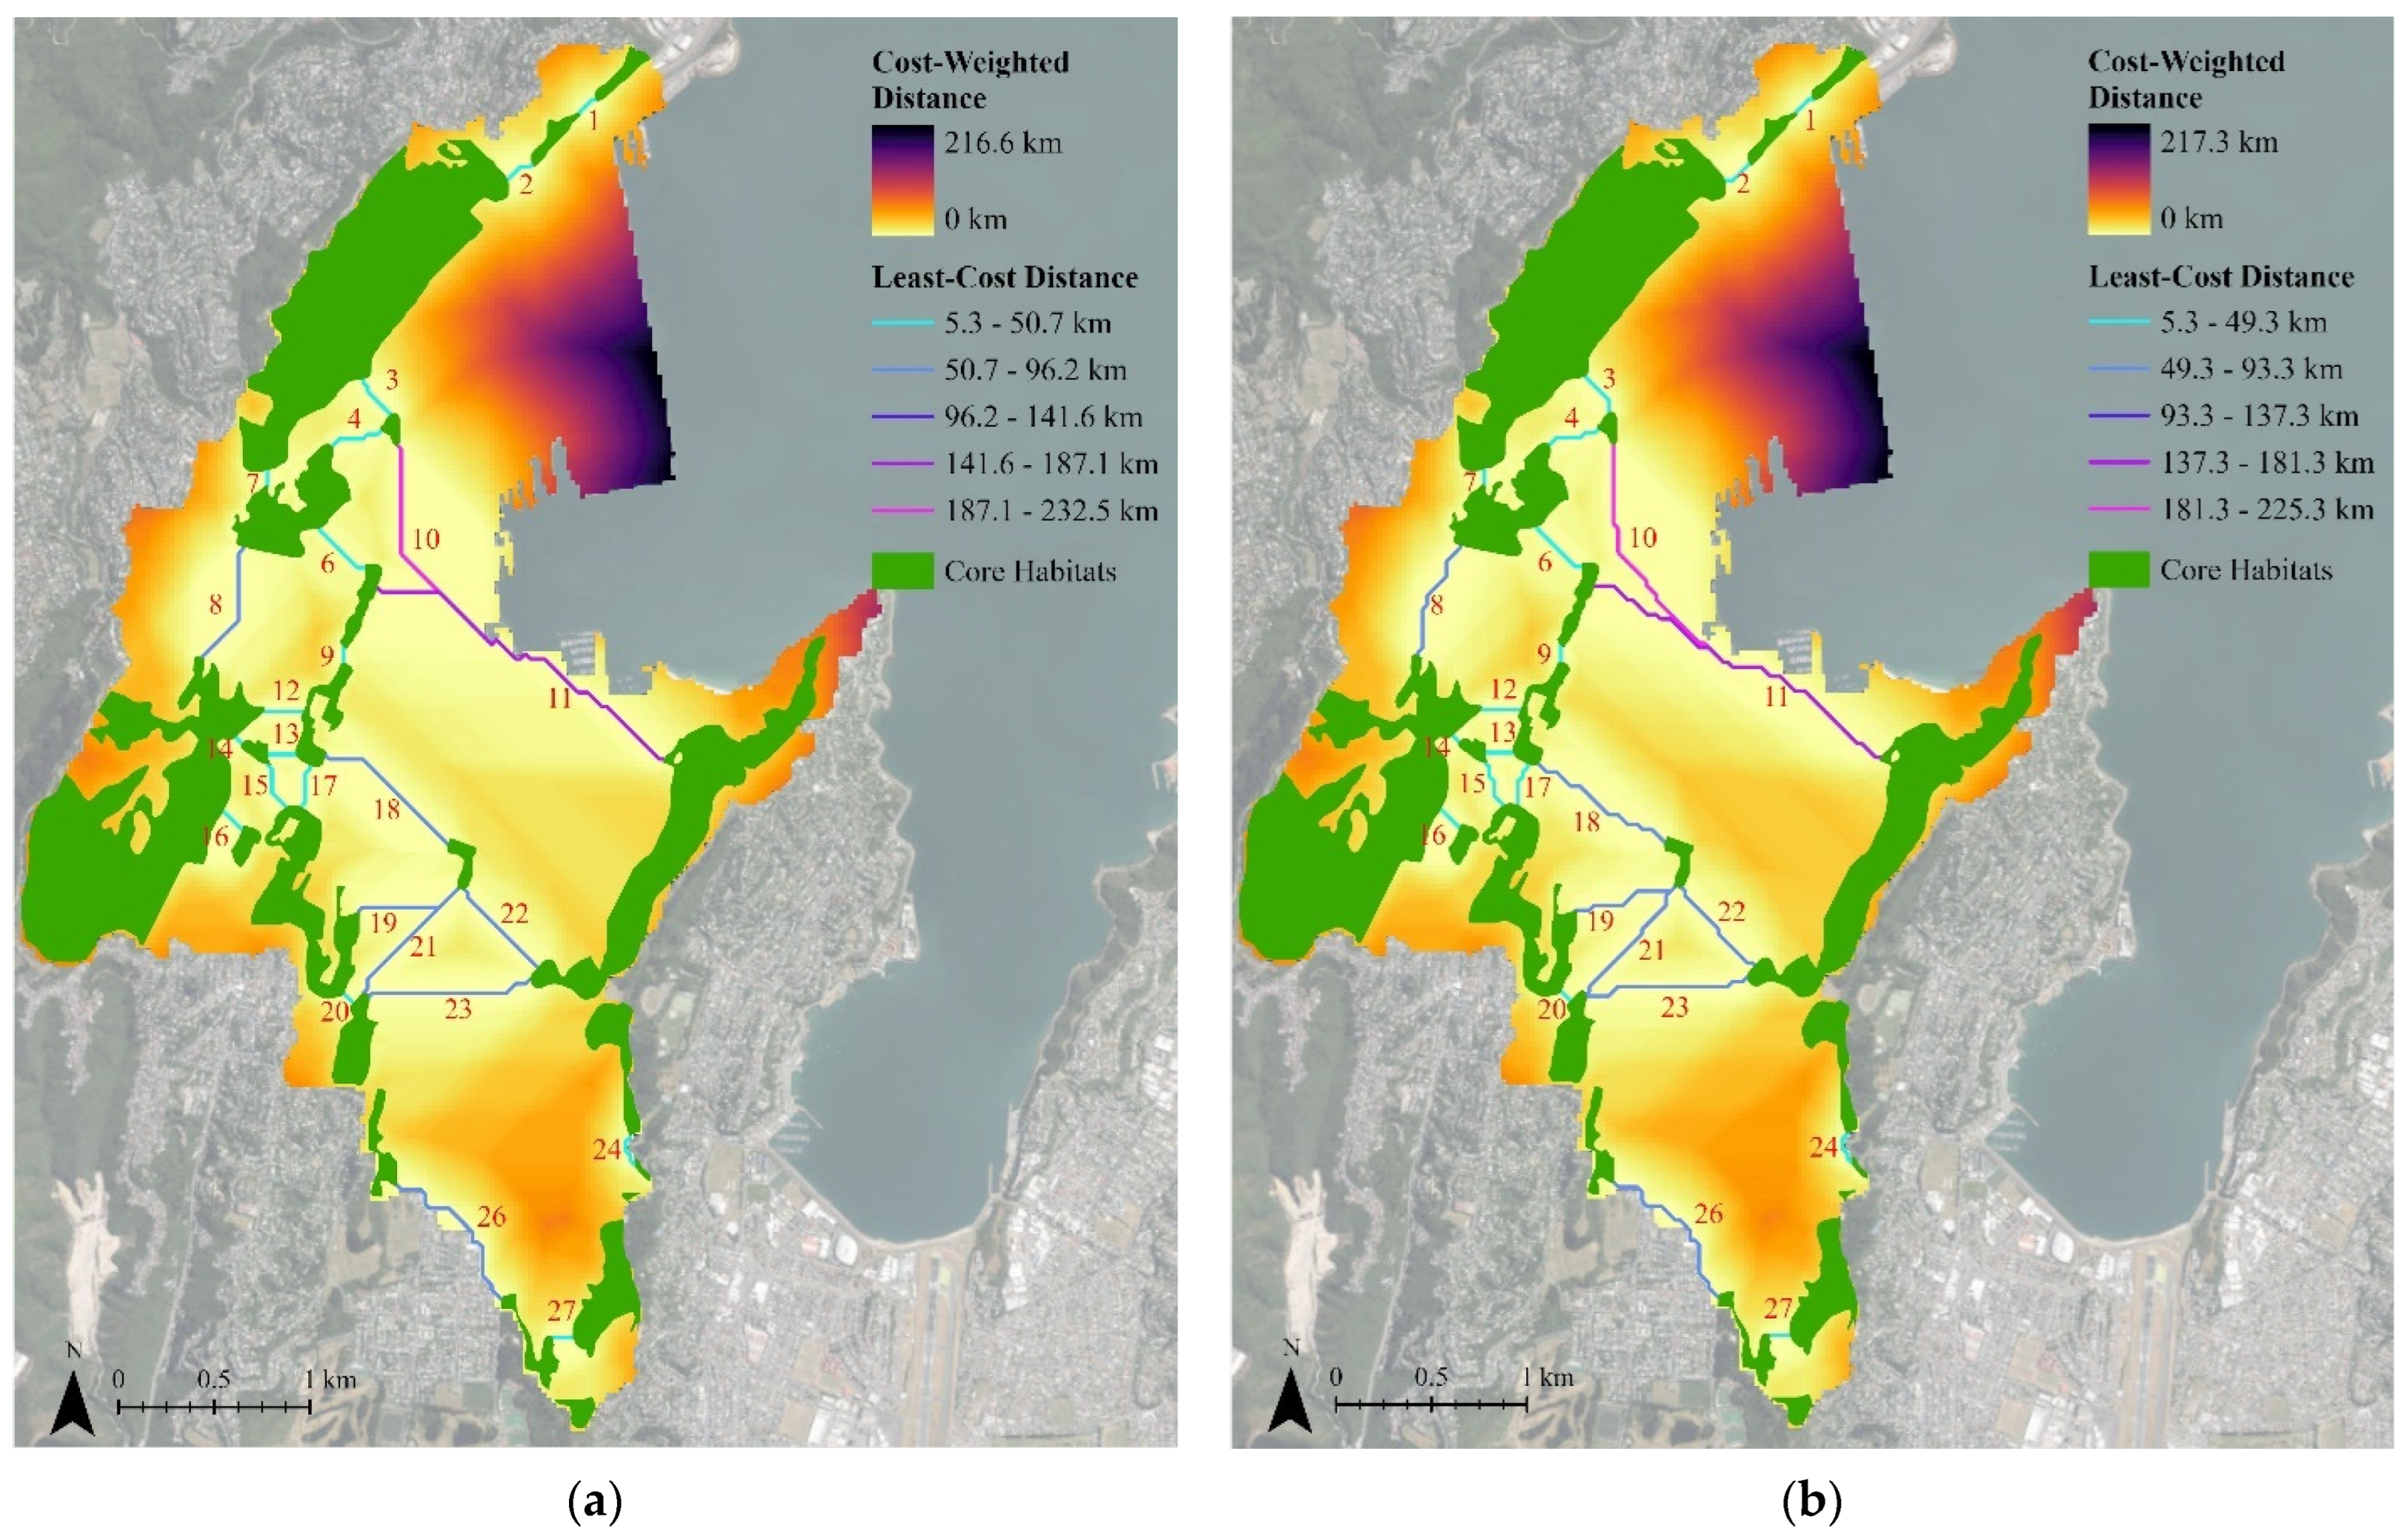
The study area is nearly four times as difficult for the hihi to disperse across compared to the kererū and tūī and twice as difficult compared to the korimako. The Linkage Pathways tool identified 24 least-cost paths between core habitat patches for the hihi. The average Euclidean (actual) distance of the least-cost paths was 0.4 km; however, the average cost-weighted distance was 46.3 km for the existing green infrastructure network (Figure 10). The actual distance only accounts for less than 1% of the cost of traversing the study area. Adding 0.7 km2 of green roof area (5% of the total study area) reduced the average least-cost distance of the paths by 4.3%, meaning that the green roof corridors helped ease travel across the study area by removing approximately 2 km of cost-weighted distance. The reduction in cost-weighted distances was not the same for all paths. Paths 10 and 11 had the highest cost-weighted distances, 232.5 km and 179.2 km, respectively, for the existing green infrastructure network. These were reduced by 3.1% (7.3 km) and 6.2% (11.2 km), respectively, with the addition of green roof corridors along these paths. Some of the shorter linkages that were already close to existing green spaces did not experience any reductions in cost-weighted distances with the addition of green roof corridors, such as paths 8, 16, and 20.
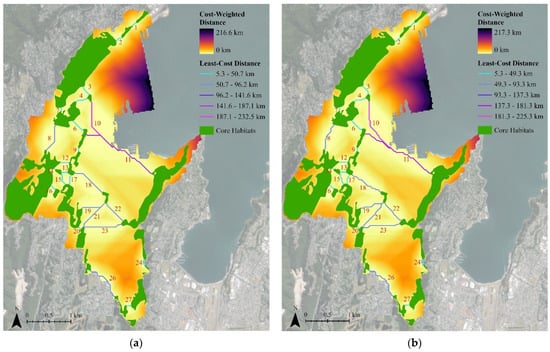
Figure 10.
Least-cost paths and cost-weighted distance maps for the hihi for: (a) the existing green infrastructure network; (b) the proposed green infrastructure network. The numbers identify individual least-cost paths. The base satellite image is from ref. [55] (CC BY 4.0).
The average cost-weighted distance to Euclidean distance ratio for the 24 least-cost paths was 114.5 for the existing green infrastructure network, which was reduced to 110.2 (a 3.8% improvement in corridor quality) with the addition of green roof corridors. Paths 17 and 19 were most impacted by the addition of green roofs, with 10.3% and 8.1% improvements in corridor quality, respectively. Like the other species, the paths along the waterfront (paths 10 and 11) remain the most difficult for the hihi. There was no notable change in the cost-weighted distances of the areas outside the least-cost paths, with the transportation and port infrastructure along the waterfront acting as major barriers to dispersal in both scenarios.
4. Discussion
4.1. Linkage Pathways Results
The results of the Linkage Pathways analysis show that the costs of dispersing across the study area can be 23 to 105 times more than the actual (Euclidean) distance for the four bird species studied. Kererū and tūī have the least difficulty dispersing across the city, but there are high dispersal costs for the hihi and, to a lesser extent, the korimako. As a result, the korimako and the hihi are most likely to suffer the negative consequences of isolated populations, including a lack of genetic diversity and higher local extinction risks [88]. Adding 0.7 km2 of green roofs (5% of the catchment area) reduced dispersal costs and improved the corridor quality for all study species. The largest average reduction in cost-weighted distance was observed for the kererū (9.3%), followed by the korimako (8.7%), the tūī (8.5%), and then the hihi (4.3%). The green roof corridors did not result in larger changes to the cost-weighted distances, likely partly because green roofs cannot replicate the core habitats the study species need. Therefore, their utility is limited to providing stepping-stone habitats. The kererū and tūī are strong fliers and have already demonstrated some level of urban adaptability; therefore, they are more likely to benefit from and use the green roof corridors. The green roofs may not be optimal stepping-stone habitats for smaller, urban-avoider species like the hihi.
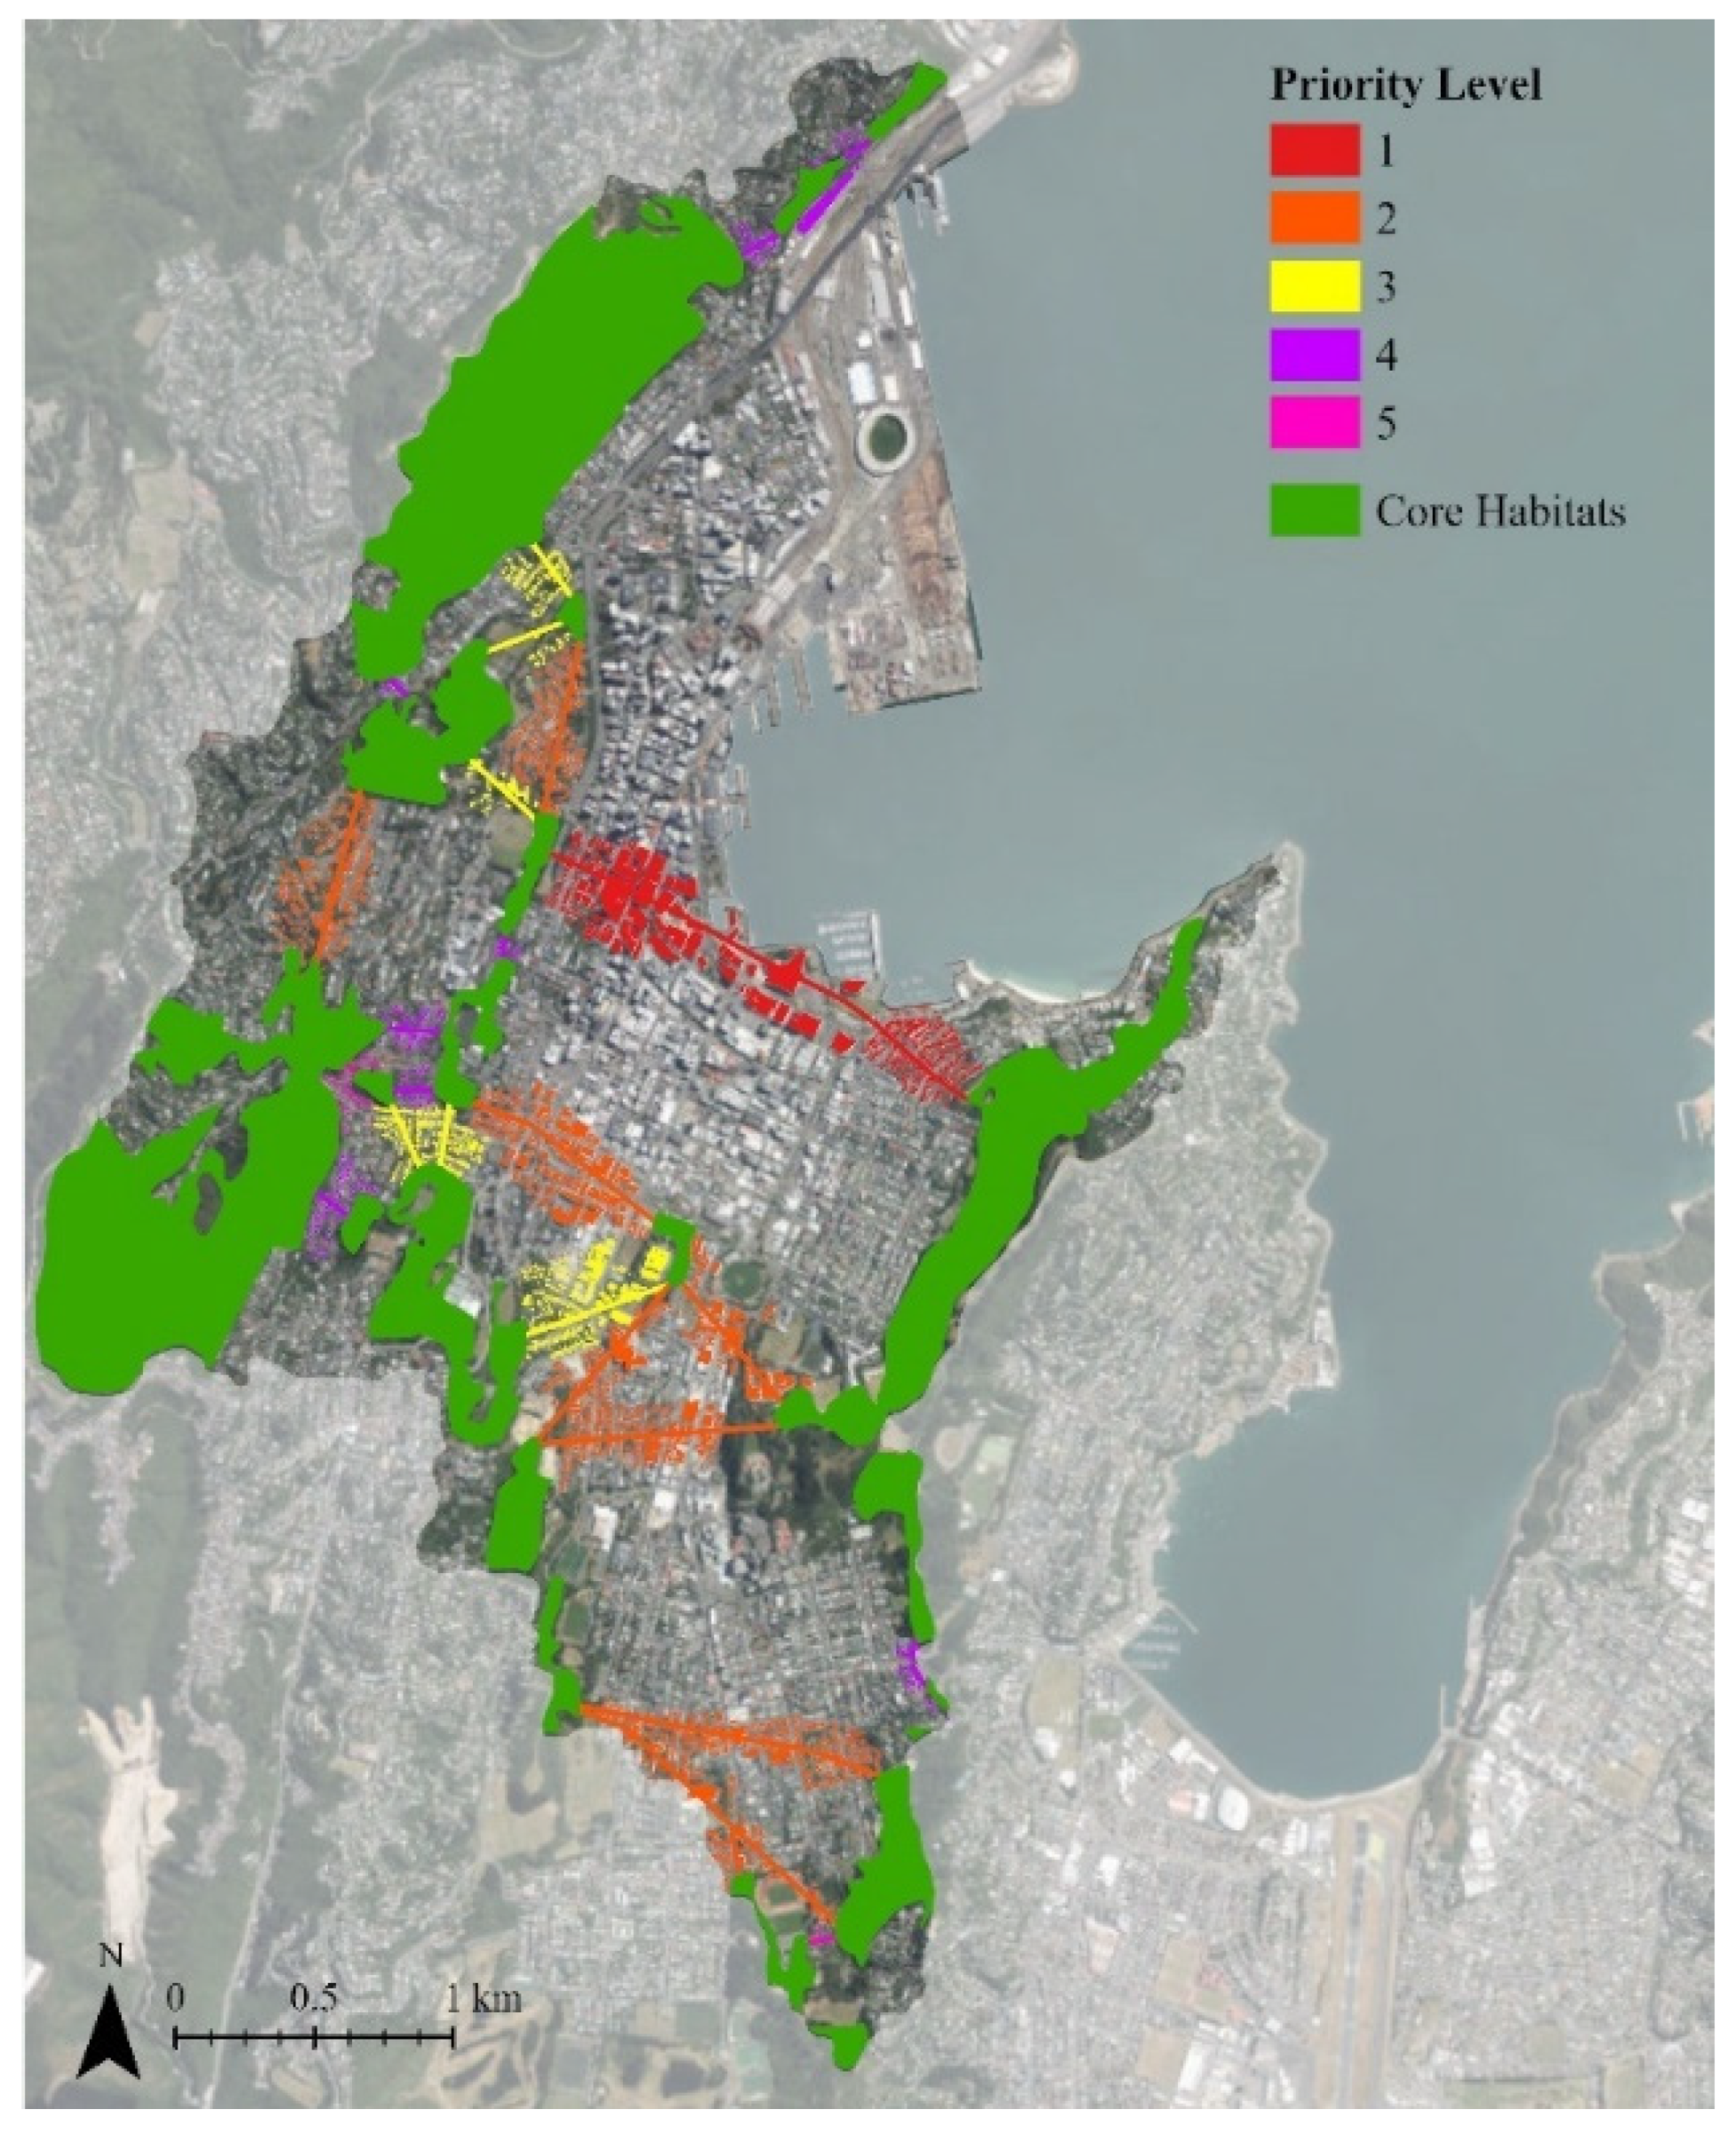
The phased implementation of 0.7 km2 green roofs could be based on the priority level of the corridor (Figure 11). The first priority should be reducing the costs of the longest and most difficult-to-cross corridors. This would require 182,601 m2 of green roof area (27% of the total green roof area proposed). The second priority corridors should be those that triangulate between multiple green spaces. This would require 335,919 m2 of green roofs (49% of the total green roof area proposed). The priority level 3–5 corridors (23.6% of the total green roof area proposed) are primarily shorter connections between core habitats that may not be as necessary for strong-disperser species, like the kererū. Therefore, they could be implemented later once their value and design for urban-avoider species, like the hihi, can be better ascertained.
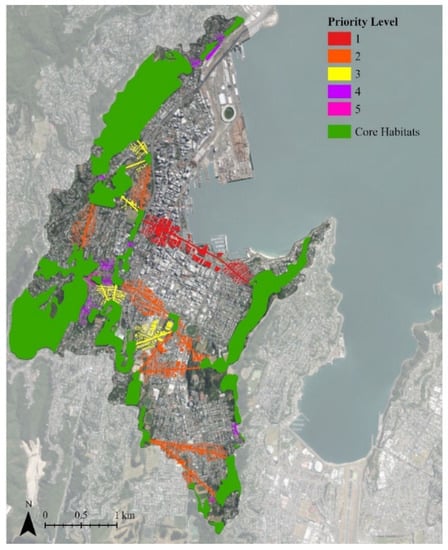
Figure 11.
Priority of implementation for the 27 green roof corridors. The base satellite image is from ref. [55] (CC BY 4.0).
Though the Linkage Mapper tool can provide information about dispersal paths and barriers for target species in a given area, there are some limitations to the conclusions that can be drawn from the results. The accuracy of the species resistance rasters is limited by the knowledge of species behaviour, population levels in core habitats, and other errors in the landscape datasets used to generate them. For instance, the Land Cover Database v5.0 does not include street trees or smaller green spaces. Adding these additional plantings in the dense city centre could impact the cost-weighted distances for some species. The land cover file also does not include a classification for green roofs and their subtypes (extensive, semi-intensive, and intensive). The ‘Urban Parkland/Open Space’ classification was used as a proxy; however, developing a more detailed classification that takes into account the different soil types and planting communities of green roofs is needed to improve the accuracy of habitat connectivity analyses that include them. There are also some limitations to Linkage Mapper’s utility as a design tool. The green infrastructure solutions proposed were limited to ones that could be drawn on a map. Though they could not be modelled in Linkage Mapper, vertical building-integrated vegetation, like green walls, could drastically increase the amount of urban vegetation and vertical habitat connectivity if paired with green roofs and green space.
4.2. Related Habitat Connectivity Analyses
There are a few examples where Linkage Mapper has been used to identify important ecological corridors [33,34], including two examples where it was used specifically for native Aotearoa New Zealand bird species [67,89]. However, this is the first study to use Linkage Mapper to design an urban green roof network and assess its impact on species dispersal. As a result, no studies directly comparing the impact on cost-weighted distances of adding building-integrated vegetation to an existing green infrastructure network are available. However, there are a few related studies that have used different methodologies. Kim and Kang [90] used i-Tree Canopy to simulate tree canopy ecosystem services and found that adding 290 green roofs to their 121.3 km2 study area in Suwon City, Republic of Korea, doubled the number of connectivity links between fragmented forest habitats across the landscape. Comparatively, in this study, though approximately 4000 green roofs were added to the 13.7 km2 Lambton Harbour-Oriental Bay catchment area, there was no significant change in the number of links connecting core habitat patches. This is likely due to green roofs not being able to replicate the forest habitat needed by the study species; however, there was a 3.8–7.1% improvement in the quality of the links.
Nguyen et al. [51] used the Biological and Environmental Evaluation Tools for Landscape Ecology (BEETLE) within the ecosystem services assessment tool Nature Braid (formerly LUCI) [91] to propose a 2.7% and 1.5% increase in ground-level habitats to improve connectivity for the kererū and paradise shelduck, respectively, in Christchurch. The green roof network proposed in this research study resulted in a 5% increase in habitats in the Lambton Harbour-Oriental Bay catchment area; however, adding green roofs to just the first and second priority links requires only a 1.3–3.8% increase in habitats, which may be sufficient for strong-flier species like the kererū. Nguyen et al. [51] also highlighted the different habitat connectivity needs between species, as was found in this study where the hihi had four times more difficulty crossing the study area than the kererū and did not benefit as much from the addition of green roofs.
Eakin et al. [92] found that species richness and species-specific occupancy probabilities were generally lower for green roofs than the surrounding landscape. The authors concluded that green roofs can provide habitats for some birds that have already adapted to living in urban areas but surrounding vegetated landscapes still provide better-quality habitats for birds. The height and habitats that green roofs can replicate contributed to the limited benefits of green roof corridors for the hihi and korimako in this study. Elevated or building-integrated green infrastructures are likely more suitable to species that have already demonstrated some level of urban adaptation (such as the kererū and tūī). Certain vulnerable urban-avoider species, like the hihi, may never be able to adapt to using habitats in dense urban centres; however, urban green infrastructures could create better buffers between built areas and their core habitats.
4.3. Future Research
This paper used landscape features and species behaviour to propose the location and quantities of green roof corridors in central Wellington; however, many other aspects need to be considered and investigated to make this design proposal plausible. The presence or absence of certain types of plants can influence the birds that visit green roofs [18]; therefore, determining a green roof planting community to target native bird species is an important design consideration. The height of green roofs can also impact their ability to improve habitat connectivity. Wang et al. [93] found that bird diversity decreased as green roof height increased and recommended that green roofs for biodiversity should be lower than 50 m from the ground. A decrease in diversity and abundance with green roof height has also been found for some food resources that birds depend upon, such as invertebrates [94]. Using Graphab, an ecological modelling software, Louis-Lucas et al. [95] found that green roofs higher than 20 m were disconnected from the surrounding ecological networks. Therefore, not all buildings will be suitable for green roof stepping stones based on their height; however, other building-integrated vegetation strategies, such as planted balconies and living walls, could be considered instead. Other structural, budget, and owner-interest barriers would also affect the implementation of green roof corridors. Supportive policies and incentives will be essential to realising these large-scale green infrastructure projects [96], and further research on how to design them and the quantifiable benefits they provide could help build a strong argument for their uptake by local councils and communities [97].
5. Conclusions
As increasing urban expansion and densification drives more habitat destruction and fragmentation, innovative urban green infrastructure strategies will be needed to maintain and possibly increase the ease with which species can disperse across cities. This research demonstrates the potential of using common habitat connectivity methods, like least-cost path models, to design green roof networks that can provide valuable stepping-stone habitats for certain bird species in dense urban environments. Though there are some limitations to the accuracy of the Linkage Mapper results due to gaps in the input data, this research found that the addition of 0.7 km2 (5% of the catchment area) of green roofs along the least-cost paths reduced dispersal costs across the catchment area by up to 9.3% for the study species. Using our buildings to create stepping stones and green corridors for native birds could help sustain urban biodiversity, increase the ecosystem services provided, and enhance species’ resiliency to climate change. Integrating habitat connectivity methods into the site analysis and design of urban green infrastructure networks can help ecologists and built environment professionals in making cities easier and safer for birds and other target species to navigate.
Author Contributions
Conceptualisation, M.M.; methodology, M.M.; formal analysis, M.M.; writing—original draft preparation, M.M.; writing—review and editing, M.M., M.P.Z. and D.K.B.; visualisation, M.M.; supervision, M.P.Z. and D.K.B. All authors have read and agreed to the published version of the manuscript.
Funding
This research received no external funding.
Institutional Review Board Statement
Not applicable.
Data Availability Statement
Data supporting the reported results can be obtained by contacting the authors.
Acknowledgments
The authors would like to acknowledge Henry Morse at Te Herenga Waka Victoria University of Wellington for answering questions about how he used Linkage Mapper in his research.
Conflicts of Interest
The authors declare no conflict of interest.
References
- United Nations, Department of Economic and Social Affairs, Population Division. World Urbanization Prospects: The 2018 Revision (ST/ESA/SER.A/420); United Nations: New York, NY, USA, 2019; pp. 1–126. Available online: https://population.un.org/wup/Publications/Files/WUP2018-Report.pdf (accessed on 30 May 2023).
- zu Ermgassen, S.O.S.E.; Utamiputri, P.; Bennun, L.; Edwards, S.; Bull, J.W. The Role of “No Net Loss” Policies in Conserving Biodiversity Threatened by the Global Infrastructure Boom. One Earth 2019, 1, 305–315. [Google Scholar] [CrossRef]
- McKinney, M. Effects of urbanisation on species richness: A review of plants and animals. Urban Ecosyst. 2008, 11, 161–176. [Google Scholar] [CrossRef]
- Mcdonald, R.; Kareiva, P.; Forman, R. The implications of current and future urbanisation for global protected areas and biodiversity conservation. Biol. Conserv. 2008, 141, 1695–1703. [Google Scholar] [CrossRef]
- Dupras, J.; Marull, J.; Parcerisas, L.; Coll, F.; Gonzalez, A.; Girard, M.; Tello, E. The impacts of urban sprawl on ecological connectivity in the Montreal Metropolitan Region. Environ. Sci. Policy 2016, 58, 61–73. [Google Scholar] [CrossRef]
- Tzoulas, K.; Korpela, K.; Venn, S.; Yli-Pelkonen, V.; Kaźmierczak, A.; Niemela, J.; Philip, J. Promoting ecosystem and human health in urban areas using Green Infrastructure: A literature review. Landsc. Urban Plan. 2007, 81, 167–178. [Google Scholar] [CrossRef]
- Botzat, A.; Fischer, L.; Kowarik, I. Unexploited opportunities in understanding liveable and biodiverse cities. A review on urban biodiversity perception and valuation. Glob. Environ. Chang. 2016, 39, 220–233. [Google Scholar] [CrossRef]
- Dadvand, P.; Bartoll, X.; Basagaña, X.; Dalmau-Bueno, A.; Martinez, D.; Ambros, A.; Cirach, M.; Triguero-Mas, M.; Gascon, M.; Borrell, C.; et al. Green spaces and general health: Roles of mental health status, social support, and physical activity. Environ. Int. 2016, 91, 161–167. [Google Scholar] [CrossRef]
- Vargas-Hernández, J.; Pallagst, K.; Zdunek-Wielgołaska, J. Urban green spaces as a component of an ecosystem. In Handbook of Engaged Sustainability; Marques, J., Ed.; Springer International Publishing: New York, NY, USA, 2018; pp. 885–916. [Google Scholar] [CrossRef]
- Weisser, W.W.; Hensel, M.; Barath, S.; Culshaw, V.; Grobman, Y.J.; Hauck, T.E.; Joschinski, J.; Ludwig, F.; Mimet, A.; Perini, K.; et al. Creating ecologically sound buildings by integrating ecology, architecture and computational design. People Nat. 2023, 5, 4–20. [Google Scholar] [CrossRef]
- Wang, L.; Wang, H.; Wang, Y.; Che, Y.; Ge, Z.; Mao, L. The relationship between green roofs and urban biodiversity: A systematic review. Biodivers. Conserv. 2022, 31, 1771–1796. [Google Scholar] [CrossRef]
- Filazzola, A.; Shrestha, N.; MacIvor, J.S.; Stanley, M. The contribution of constructed green infrastructure to urban biodiversity: A synthesis and meta-analysis. J. Appl. Ecol. 2019, 56, 2131–2143. [Google Scholar] [CrossRef]
- Braaker, S.; Ghazoul, J.; Obrist, M.K.; Moretti, M. Habitat connectivity shapes urban arthropod communities: The key role of green roofs. Ecology 2014, 95, 1010–1021. [Google Scholar] [CrossRef]
- Wooster, E.I.F.; Fleck, R.; Torpy, F.; Ramp, D.; Irga, P.J. Urban green roofs promote metropolitan biodiversity: A comparative case study. Build. Environ. 2022, 207, 108458. [Google Scholar] [CrossRef]
- Baumann, N.; Catalano, C.; Pasta, S. Improving Extensive Green Roofs for Endangered Ground-Nesting Birds. In Urban Services to Ecosystems; Catalano, C., Andreucci, M.B., Guarino, R., Bretzel, F., Leone, M., Pasta, S., Eds.; Springer Nature: Cham, Swirzerland, 2021; Volume 17, pp. 13–29. [Google Scholar] [CrossRef]
- Partridge, D.R.; Clark, J.A. Urban green roofs provide habitat for migrating and breeding birds and their arthropod prey. PLoS ONE 2018, 13, e0202298. [Google Scholar] [CrossRef]
- Belcher, R.N.; Sadanandan, K.R.; Goh, E.R.; Chan, J.Y.; Menz, S.; Schroepfer, T. Vegetation on and around large-scale buildings positively influences native tropical bird abundance and bird species richness. Urban Ecosyst. 2019, 22, 213–225. [Google Scholar] [CrossRef]
- Catalano, C.; Balducci, A. Environmental analysis and ecosystemic design: Survey, critical issues and application solutions. Agathón 2022, 11, 246–257. [Google Scholar] [CrossRef]
- Venter, Z.S.; Barton, D.N.; Martinez-Izquierdo, L.; Langemeyer, J.; Baró, F.; McPhearson, T. Interactive spatial planning of urban green infrastructure—Retrofitting green roofs where ecosystem services are most needed in Oslo. Ecosyst. Serv. 2021, 50, 101314. [Google Scholar] [CrossRef]
- Langemeyer, J.; Wedgwood, D.; McPhearson, T.; Baró, F.; Madsen, A.L.; Barton, D.N. Creating urban green infrastructure where it is needed—A spatial ecosystem service-based decision analysis of green roofs in Barcelona. Sci. Total Environ. 2020, 707, 135487. [Google Scholar] [CrossRef]
- Mora-Melià, D.; López-Aburto, C.S.; Ballesteros-Pérez, P.; Muñoz-Velasco, P. Viability of Green Roofs as a Flood Mitigation Element in the Central Region of Chile. Sustainability 2018, 10, 1130. [Google Scholar] [CrossRef]
- Twohig, C.; Casali, Y.; Aydin, N.Y. Can green roofs help with stormwater floods? A geospatial planning approach. Urban Urban Green. 2022, 76, 127724. [Google Scholar] [CrossRef]
- Viecco, M.; Jorquera, H.; Sharma, A.; Bustamante, W.; Fernando, H.J.S.; Vera, S. Green roofs and green walls layouts for improved urban air quality by mitigating particulate matter. Build. Environ. 2021, 204, 108120. [Google Scholar] [CrossRef]
- Hirano, Y.; Ihara, T.; Gomi, K.; Fujita, T. Simulation-Based Evaluation of the Effect of Green Roofs in Office Building Districts on Mitigating the Urban Heat Island Effect and Reducing CO2 Emissions. Sustainability 2019, 11, 2055. [Google Scholar] [CrossRef]
- Adriaensen, F.; Chardon, J.P.; De Blust, G.; Swinnen, E.; Villalba, S.; Gulinck, H.; Matthysen, E. The application of “least-cost” modelling as a functional landscape model. Landsc. Urban Plan. 2003, 64, 233–247. [Google Scholar] [CrossRef]
- Balbi, M.; Petit, E.J.; Croci, S.; Nabucet, J.; Georges, R.; Madec, L.; Ernoult, A. Ecological relevance of least cost path analysis: An easy implementation method for landscape urban planning. J. Environ. Manag. 2019, 244, 61–68. [Google Scholar] [CrossRef]
- McRae, B.H.; Kavanagh, D.M. Linkage Mapper Toolbox: Linkage Pathways Tool User Guide, 3rd ed.; The Nature Conservancy: Seattle, WA, USA, 2011; pp. 1–22. Available online: https://linkagemapper.org/Downloads/ (accessed on 30 May 2023).
- Linkage Mapper Connectivity Analysis Software. Available online: https://linkagemapper.org/ (accessed on 30 May 2023).
- Ding, Z.; Cao, J.; Wang, Y. The Construction and Optimization of Habitat Networks for Urban–Natural Symbiosis: A Case Study of the Main Urban Area of Nanjing. Forests 2023, 14, 133. [Google Scholar] [CrossRef]
- Fagan, M.E.; DeFries, R.S.; Sesnie, S.E.; Arroyoâ-Mora, J.P.; Chazdon, R.L. Targeted reforestation could reverse declines in connectivity for understory birds in a tropical habitat corridor. Ecol. Appl. 2016, 26, 1456–1474. [Google Scholar] [CrossRef]
- Colyn, R.B.; Smith, D.A.E.; Smith, Y.C.E.; Smit-Robinson, H.; Downs, C.T. Predicted distributions of avian specialists: A framework for conservation of endangered forests under future climates. Divers. Distrib. 2020, 26, 652–667. [Google Scholar] [CrossRef]
- Lopez, B.E.; Urban, D.; White, P.S. Nativity and seed dispersal mode influence species’ responses to habitat connectivity and urban environments. Glob. Ecol. Biogeogr. 2018, 27, 1017–1030. [Google Scholar] [CrossRef]
- Kong, F.; Wang, D.; Yin, H.; Dronova, I.; Fei, F.; Chen, J.; Pu, Y.; Li, M. Coupling urban 3-D information and circuit theory to advance the development of urban ecological networks. Conserv. Biol. 2021, 35, 1140–1150. [Google Scholar] [CrossRef]
- Alshafei, I.; Righelato, P.U. The Human Ecosystem Spatial Networks of Amman City Center: A New Methodological Approach towards Resiliency. Sustainability 2022, 14, 8451. [Google Scholar] [CrossRef]
- Parlato, E.H.; Armstrong, D.P.; Innes, J.G. Traits influencing range contraction in New Zealand’s endemic forest birds. Oecologia 2015, 179, 319–328. [Google Scholar] [CrossRef]
- Department of Conservation. Te Mana o Te Taiao—Aotearoa New Zealand Biodiversity Strategy; Department of Conservation: Wellington, New Zealand, 2020; pp. 1–73. Available online: https://www.doc.govt.nz/globalassets/documents/conservation/biodiversity/anzbs-2020.pdf (accessed on 30 May 2023).
- Predator Free NZ. Available online: https://predatorfreenz.org/ (accessed on 30 May 2023).
- Statistics New Zealand. Census Place Summaries: Wellington City. 2018. Available online: https://www.stats.govt.nz/tools/2018-census-place-summaries/wellington-city#more-data-and-information (accessed on 30 May 2023).
- Wellington City Council. Our Natural Capital: Wellington’s Biodiversity Strategy and Action Plan; Wellington City Council: Wellington, New Zealand, 2015; pp. 1–116. Available online: https://wellington.govt.nz/~{}/media/your-council/plans-policies-and-bylaws/plans-and-policies/a-to-z/biodiversity/files/2015/our-natural-capital-entire.pdf?la=en (accessed on 30 May 2023).
- Biophilic Cities. Available online: https://www.biophiliccities.org/wellington (accessed on 30 May 2023).
- Blaschke, P.; Chapman, R.; Gyde, E.; Howden-Chapman, P.; Ombler, J.; Pedersen Zari, M.; Perry, M.; Randal, R. Green Space in Wellington’s Central City: Current Provision, and Design for FutureWellbeing; New Zealand Centre for Sustainable Cities: Wellington, New Zealand, 2019; pp. 1–96. Available online: https://www.sustainablecities.org.nz/sites/default/files/2021-12/Report-Green-Space-in-Wellington%E2%80%99s-Central-City.pdf (accessed on 30 May 2023).
- Wellington City Council. Long-Term Plan 2018-28; Wellington City Council: Wellington, New Zealand, 2018; pp. 1–236. Available online: https://wellington.govt.nz/-/media/your-council/plans-policies-and-bylaws/plans-and-policies/longtermplan/2018-28/wcclong-term-plan-2018-28-volume-1.pdf?la=en&hash=07BACEFF739B18327D43E67F890E895CC7A68E5A (accessed on 30 May 2023).
- Klem, D.; Farmer, C.J.; Delacretaz, N.; Gelb, Y.; Saenger, P.G. Architectural and Landscape Risk Factors Associated with Bird–glass Collisions in an Urban Environment. Wilson J. Ornithol. 2009, 121, 126–134. [Google Scholar] [CrossRef]
- Snep, R.; Kooijmans, J.; Kwak, R.; Foppen, R.P.; Parsons, H.; Awasthy, M.; Sierdsema, H.; Marzluff, J.; Fernandez-Juricic, E.; Laet, J.; et al. Urban bird conservation: Presenting stakeholder-specific arguments for the development of bird-friendly cities. Urban Ecosyst. 2016, 19, 1535–1550. [Google Scholar] [CrossRef]
- De Montis, A.; Caschili, S.; Mulas, M.; Modica, G.; Ganciu, A.; Bardi, A.; Ledda, A.; Dessena, L.; Laudari, L.; Fichera, C.R. Urban–rural ecological networks for landscape planning. Land Use Policy 2016, 50, 312–327. [Google Scholar] [CrossRef]
- Gharibi, S.; Shayesteh, K.; Attaeian, B. Interconnected ecological network design using lcp algorithm and cohesion index in urban scale. Urban Ecosyst. 2021, 24, 153–163. [Google Scholar] [CrossRef]
- Rastandeh, A.; Pedersen Zari, M. A spatial analysis of land cover patterns and its implications for urban avifauna persistence under climate change. Landsc. Ecol. 2018, 33, 455–474. [Google Scholar] [CrossRef]
- Payton, I.; Fenner, M.; Lee, W. Keystone species: The concept and its relevance for conservation management in New Zealand. In Science for Conservation 203; Clelland, L., Ed.; Department of Conservation: Wellington, New Zealand, 2002; pp. 1–29. Available online: https://www.doc.govt.nz/documents/science-and-technical/sfc203.pdf (accessed on 30 May 2023).
- Meurk, C.; Sullivan, J.; McWilliam, W. Vegetation History and Dynamics in New Zealand: Future Scenarios and Improved Trajectories Towards Restoring Natural Patterns. In Vegetation Structure and Function at Multiple Spatial, Temporal and Conceptual Scales, 1st ed.; Box, E., Ed.; Springer International Publishing: Cham, Switzerland, 2016; pp. 517–528. [Google Scholar] [CrossRef]
- Powlesland, R.G. Kererū New Zealand pigeon. In New Zealand Birds Online; Miskelly, C.M., Ed.; Te Papa: Wellington, New Zealand, 2022; Available online: https://www.nzbirdsonline.org.nz/species/new-zealand-pigeon (accessed on 30 May 2023).
- Nguyen, T.T.; Meurk, C.; Benavidez, R.; Jackson, B.; Pahlow, M. The Effect of Blue-Green Infrastructure on Habitat Connectivity and Biodiversity: A Case Study in the Otakaro/Avon River Catchment in Christchurch, New Zealand. Sustainability 2021, 13, 6732. [Google Scholar] [CrossRef]
- Robertson, H.A. Tūī. In New Zealand Birds Online; Miskelly, C.M., Ed.; Te Papa: Wellington, New Zealand, 2022; Available online: https://www.nzbirdsonline.org.nz/species/tui (accessed on 30 May 2023).
- Sagar, P.M. Bellbird korimako. In New Zealand Birds Online; Miskelly, C.M., Ed.; Te Papa: Wellington, New Zealand, 2022; Available online: https://nzbirdsonline.org.nz/species/bellbird (accessed on 30 May 2023).
- Castro, I. Hihi stitchbird. In New Zealand Birds Online; Miskelly, C.M., Ed.; Te Papa: Wellington, New Zealand, 2022; Available online: https://nzbirdsonline.org.nz/species/stitchbird (accessed on 30 May 2023).
- Eagle Technology. New Zealand Imagery. 2022. Available online: https://www.arcgis.com/home/item.html?id=d284729222d04a3cb548cfe27716ea43 (accessed on 30 May 2023).
- Spragg, B. Kereru NZ Wood Pigeon. Wikimedia Commons. 2016. Available online: https://commons.wikimedia.org/wiki/File:Kereru._NZ_Wood_Pigeon._(25446646940).jpg (accessed on 30 May 2023).
- Spragg, B. The Tui New Zealand. Wikimedia Commons. 2010. Available online: https://commons.wikimedia.org/wiki/File:The_Tui_New_Zealand._(9157585500).jpg (accessed on 30 May 2023).
- Veronesi, F. New Zealand Bellbird. Wikimedia Commons. 2017. Available online: https://commons.wikimedia.org/wiki/File:New_Zealand_Bellbird_-_New_Zealand_(24443084277).jpg (accessed on 30 May 2023).
- Miller, J. Male hihi Stitchbird. Wikimedia Commons. 2019. Available online: https://commons.wikimedia.org/wiki/File:Male_hihi_-_stitchbird.jpg (accessed on 30 May 2023).
- Global Biodiversity Information Facility. Hemiphaga Novaeseelandiae GBIF Occurrence Download. GBIF.org. 2023. Available online: https://doi.org/10.15468/dl.mqszyr (accessed on 29 May 2023).
- Global Biodiversity Information Facility. Prosthemadera Novaeseelandiae GBIF Occurrence Download. GBIF.org. 2023. Available online: https://doi.org/10.15468/dl.qty7bt (accessed on 29 May 2023).
- Global Biodiversity Information Facility. Anthornis Melanura GBIF Occurrence Download. GBIF.org. 2023. Available online: https://doi.org/10.15468/dl.t2evdm (accessed on 29 May 2023).
- Global Biodiversity Information Facility. Notiomystis Cincta GBIF Occurrence Download. GBIF.org. 2023. Available online: https://doi.org/10.15468/dl.axbd5x (accessed on 29 May 2023).
- Landcare Research. New Zealand Land Cover Database Version 5.0 Mainland New Zealand. 2020. Available online: https://lris.scinfo.org.nz/layer/104400-lcdb-v50-land-cover-database-version-50-mainland-new-zealand/ (accessed on 30 May 2023).
- Wellington City Council. Animal Pest control. Available online: https://wellington.govt.nz/climate-change-sustainability-environment/environment/what-we-do-for-the-environment/pest-and-predator-control/animal-pest-control (accessed on 30 May 2023).
- Matisziw, T.C.; Gholamialam, A.; Trauth, K.M. Modeling habitat connectivity in support of multiobjective species movement: An application to amphibian habitat systems. PLoS Comput. Biol. 2020, 16, e1008540. [Google Scholar] [CrossRef]
- Morse, H. Modelling Endemic and Invasive Species’ Biodiversity Corridors in the Southern North Island of Aotearoa New Zealand. Master’ Thesis, Te Herenga Waka Victoria University of Wellington, Wellington, New Zealand, 2022. [Google Scholar]
- Naka, L.N.; da Silva Costa, B.M.; Lima, G.R.; Claramunt, S. Riverine Barriers as Obstacles to Dispersal in Amazonian Birds. Front. Ecol. Evol. 2022, 10, 846975. [Google Scholar] [CrossRef]
- McLean, S. Stream or discharge? Analysing hydrosocial relations in the Waimapihi Stream to innovate urban water politics. N. Z. Geogr. 2022, 78, 9–22. [Google Scholar] [CrossRef]
- Moradi, H.; Fattorini, S.; Oldeland, J. Influence of elevation on the species–area relationship. J. Biogeogr. 2020, 47, 2029–2041. [Google Scholar] [CrossRef]
- de Groot, M.; Vrezec, A. Contrasting effects of altitude on species groups with different traits in a non-fragmented montane temperate forest. Nat. Conserv. 2019, 37, 99–121. [Google Scholar] [CrossRef]
- Loss, S.R.; Lao, S.; Eckles, J.W.; Anderson, A.W.; Blair, R.B.; Turner, R.J. Factors influencing bird-building collisions in the downtown area of a major North American city. PLoS ONE 2019, 14, e0224164. [Google Scholar] [CrossRef]
- Dolbeer, R.A. Height Distribution of Birds Recorded by Collisions with Civil Aircraft. J. Wildl. Manag. 2006, 70, 1345–1350. [Google Scholar] [CrossRef]
- Walters, K.; Kosciuch, K.; Jones, J. Can the Effect of Tall Structures on Birds be Isolated from Other Aspects of Development? Wildl. Soc. Bull. 2014, 38, 250–256. [Google Scholar] [CrossRef]
- Land Information New Zealand. Wellington City LiDAR 1m DEM (2019–2022). 2020. Available online: https://data.linz.govt.nz/layer/105023-wellington-city-lidar-1m-dem-2019-2020/ (accessed on 30 May 2023).
- Wellington City Council. Wellington Buildings. 2020. Available online: https://data-wcc.opendata.arcgis.com/datasets/WCC::wellington-buildings/explore?location=-41.301753%2C174.779914%2C17.85 (accessed on 30 May 2023).
- Wellington City Council District Plan. Available online: https://eplan.wellington.govt.nz/eplan/ (accessed on 30 May 2023).
- Hämäläinen, S.; Fey, K.; Selonen, V. The effect of landscape structure on dispersal distances of the Eurasian red squirrel. Ecol. Evol. 2019, 9, 1173–1181. [Google Scholar] [CrossRef]
- Loss, S.R.; Will, T.; Marra, P.P. Estimation of bird-vehicle collision mortality on US roads. J. Wildl. Manag. 2014, 78, 763–771. [Google Scholar] [CrossRef]
- Pell, S.; Jones, D. Are wildlife overpasses of conservation value for birds? A study in Australian sub-tropical forest, with wider implications. Biol. Conserv. 2015, 184, 300–309. [Google Scholar] [CrossRef]
- Land Information New Zealand. NZ Road Centrelines (Topo, 1:50k). 2022. Available online: https://data.linz.govt.nz/layer/50329-nz-road-centrelines-topo-150k/ (accessed on 30 May 2023).
- Alvarez-Alvarez, E.A.; Almazán-Núñez, R.C.; Corcuera, P.; González-García, F.; Brito-Millán, M.; Alvarado-Castro, V.M. Land use cover changes the bird distribution and functional groups at the local and landscape level in a Mexican shaded-coffee agroforestry system. Agric. Ecosyst. Environ. 2022, 330, 107882. [Google Scholar] [CrossRef]
- Magioli, M.; de Barros Ferraz, K.M.P.M.; Chiarello, A.G.; Galetti, M.; Setz, E.Z.F.; Paglia, A.P.; Abrego, N.; Ribeiro, M.C.; Ovaskainen, O. Land-use changes lead to functional loss of terrestrial mammals in a Neotropical rainforest. Perspect. Ecol. Conserv. 2021, 19, 161–170. [Google Scholar] [CrossRef]
- Dutta, T.; Sharma, S.; McRae, B.H.; Roy, P.S.; DeFries, R. Connecting the dots: Mapping habitat connectivity for tigers in central India. Reg. Environ. Chang. 2016, 16, 53–67. [Google Scholar] [CrossRef]
- Mahdiyar, A.; Tabatabaee, S.; Abdullah, A.; Marto, A. Identifying and assessing the critical criteria affecting decision-making for green roof type selection. Sustain. Cities Soc. 2018, 39, 772–783. [Google Scholar] [CrossRef]
- Madre, F.; Vergnes, A.; Machon, N.; Clergeau, P. A comparison of 3 types of green roof as habitats for arthropods. Ecol. Eng. 2013, 57, 109–117. [Google Scholar] [CrossRef]
- Simmons, M.T.; Gardiner, B.; Windhager, S.; Tinsley, J. Green roofs are not created equal: The hydrologic and thermal performance of six different extensive green roofs and reflective and non-reflective roofs in a sub-tropical climate. Urban Ecosyst. 2008, 11, 339–348. [Google Scholar] [CrossRef]
- Harrisson, K.A.; Pavlova, A.; Amos, J.N.; Takeuchi, N.; Lill, A.; Radford, J.Q.; Sunnucks, P. Fine-scale effects of habitat loss and fragmentation despite large-scale gene flow for some regionally declining woodland bird species. Landsc. Ecol. 2012, 27, 813–827. [Google Scholar] [CrossRef]
- Gangar, S.; Boothroyd, I. Ecological Connectivity Strategies. Boffa Miskell. 2021. Available online: https://www.boffamiskell.co.nz/project.php?v=ecological-connectivity-strategies (accessed on 30 May 2023).
- Kim, J.; Kang, W. Assessing Green Roof Contributions to Tree Canopy Ecosystem Services and Connectivity in a Highly Urbanised Area. Land 2022, 11, 1281. [Google Scholar] [CrossRef]
- Nature Braid. Available online: https://naturebraid.org/ (accessed on 30 May 2023).
- Eakin, C.J.; Campa, H.; Linden, D.W.; Roloff, G.J.; Rowe, D.B.; Westphal, J. Avian Response to Green Roofs in Urban Landscapes in the Midwestern USA. Wildl. Soc. Bull. 2015, 39, 574–582. [Google Scholar] [CrossRef]
- Wang, J.W.; Poh, C.H.; Tan, C.Y.T.; Lee, V.N.; Jain, A.; Webb, E.L. Building biodiversity: Drivers of bird and butterfly diversity on tropical urban roof gardens. Ecosphere 2017, 8, e01905. [Google Scholar] [CrossRef]
- Dromgold, J.R.; Threlfall, C.G.; Norton, B.A.; Williams, N.S.G. Green roof and ground-level invertebrate communities are similar and are driven by building height and landscape context. J. Urban Ecol. 2020, 6, juz024. [Google Scholar] [CrossRef]
- Louis-Lucas, T.; Clauzel, C.; Mayrand, F.; Clergeau, P.; Machon, N. Role of green roofs in urban connectivity, an exploratory approach using landscape graphs in the city of Paris, France. Urban For. Urban Green. 2022, 78, 127765. [Google Scholar] [CrossRef]
- Isola, F.; Lai, S.; Leone, F.; Zoppi, C. Strengthening a Regional Green Infrastructure through Improved Multifunctionality and Connectedness: Policy Suggestions from Sardinia, Italy. Sustainability 2022, 14, 9788. [Google Scholar] [CrossRef]
- Catalano, C.; Laudicina, V.A.; Badalucco, L.; Guarino, R. Some European green roof norms and guidelines through the lens of biodiversity: Do ecoregions and plant traits also matter? Ecol. Eng. 2018, 115, 15–26. [Google Scholar] [CrossRef]
Disclaimer/Publisher’s Note: The statements, opinions and data contained in all publications are solely those of the individual author(s) and contributor(s) and not of MDPI and/or the editor(s). MDPI and/or the editor(s) disclaim responsibility for any injury to people or property resulting from any ideas, methods, instructions or products referred to in the content. |
© 2023 by the authors. Licensee MDPI, Basel, Switzerland. This article is an open access article distributed under the terms and conditions of the Creative Commons Attribution (CC BY) license (https://creativecommons.org/licenses/by/4.0/).

