
City and Water Risk: Accumulated Runoff Mapping Analysis as a Tool for Sustainable Land Use Planning


Abstract
1. Introduction
2. Materials and Methods
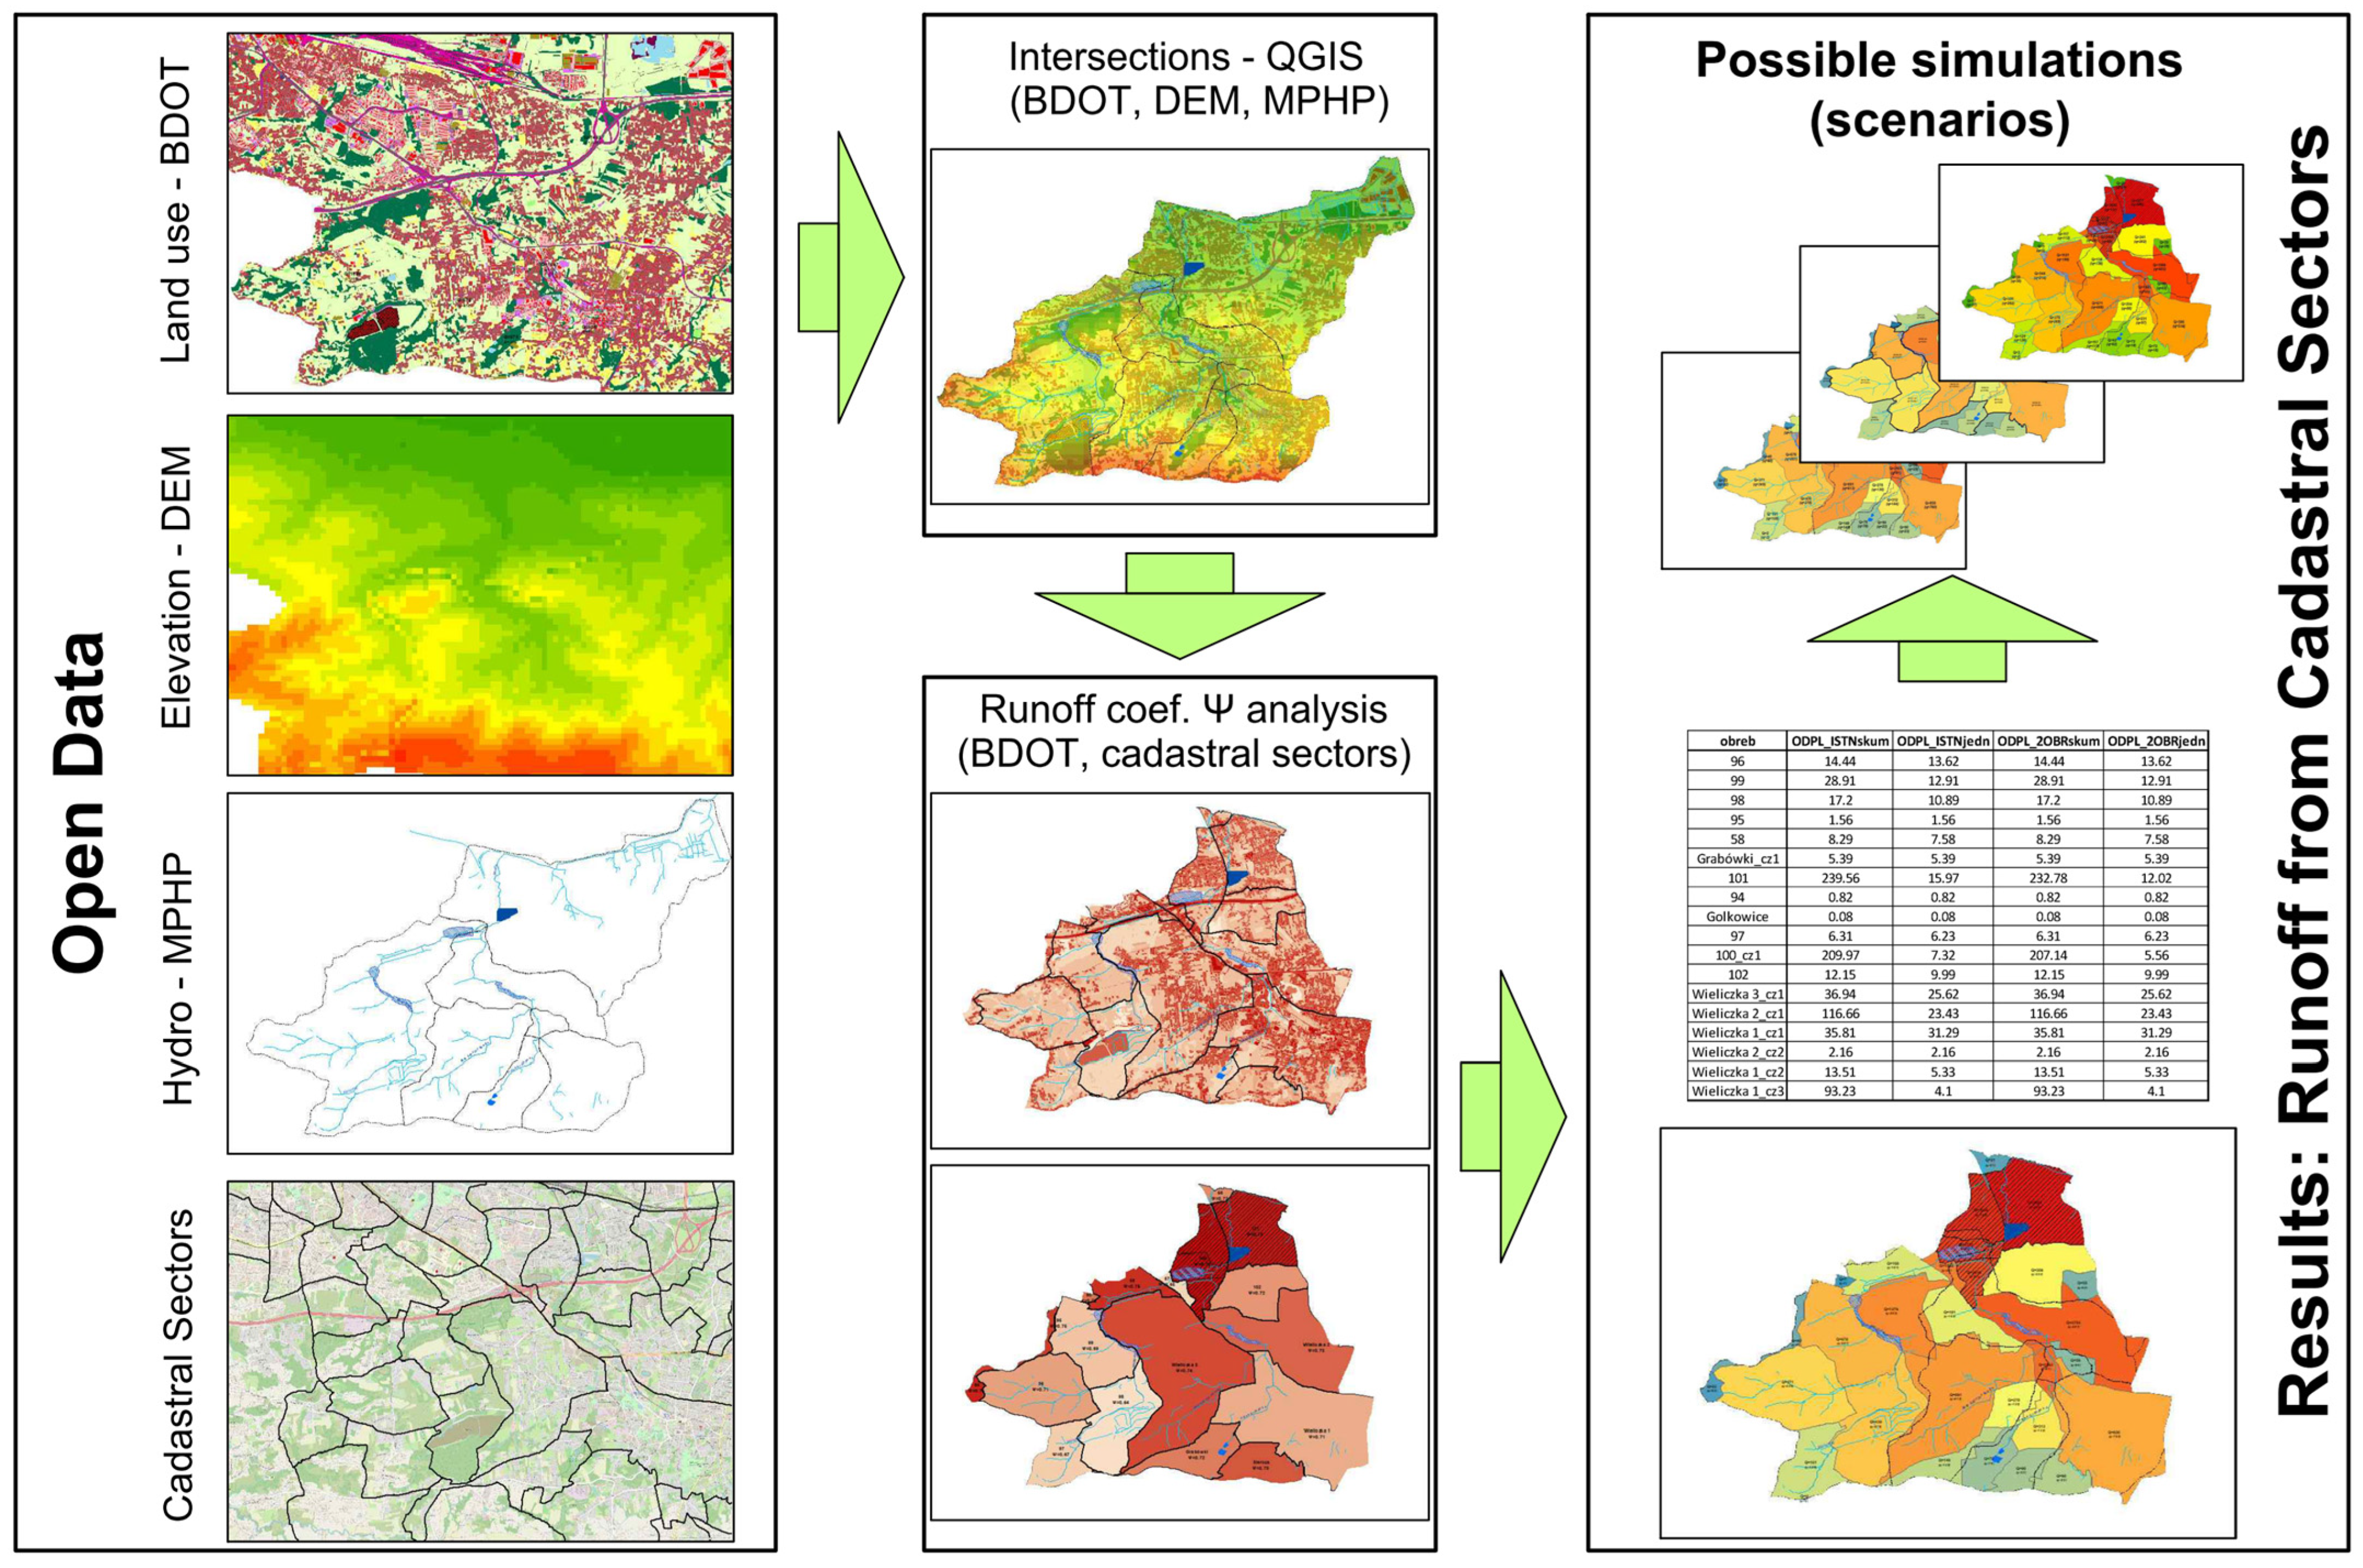
GIS and Cumulative Runoff Analysis Methodology
3. Results
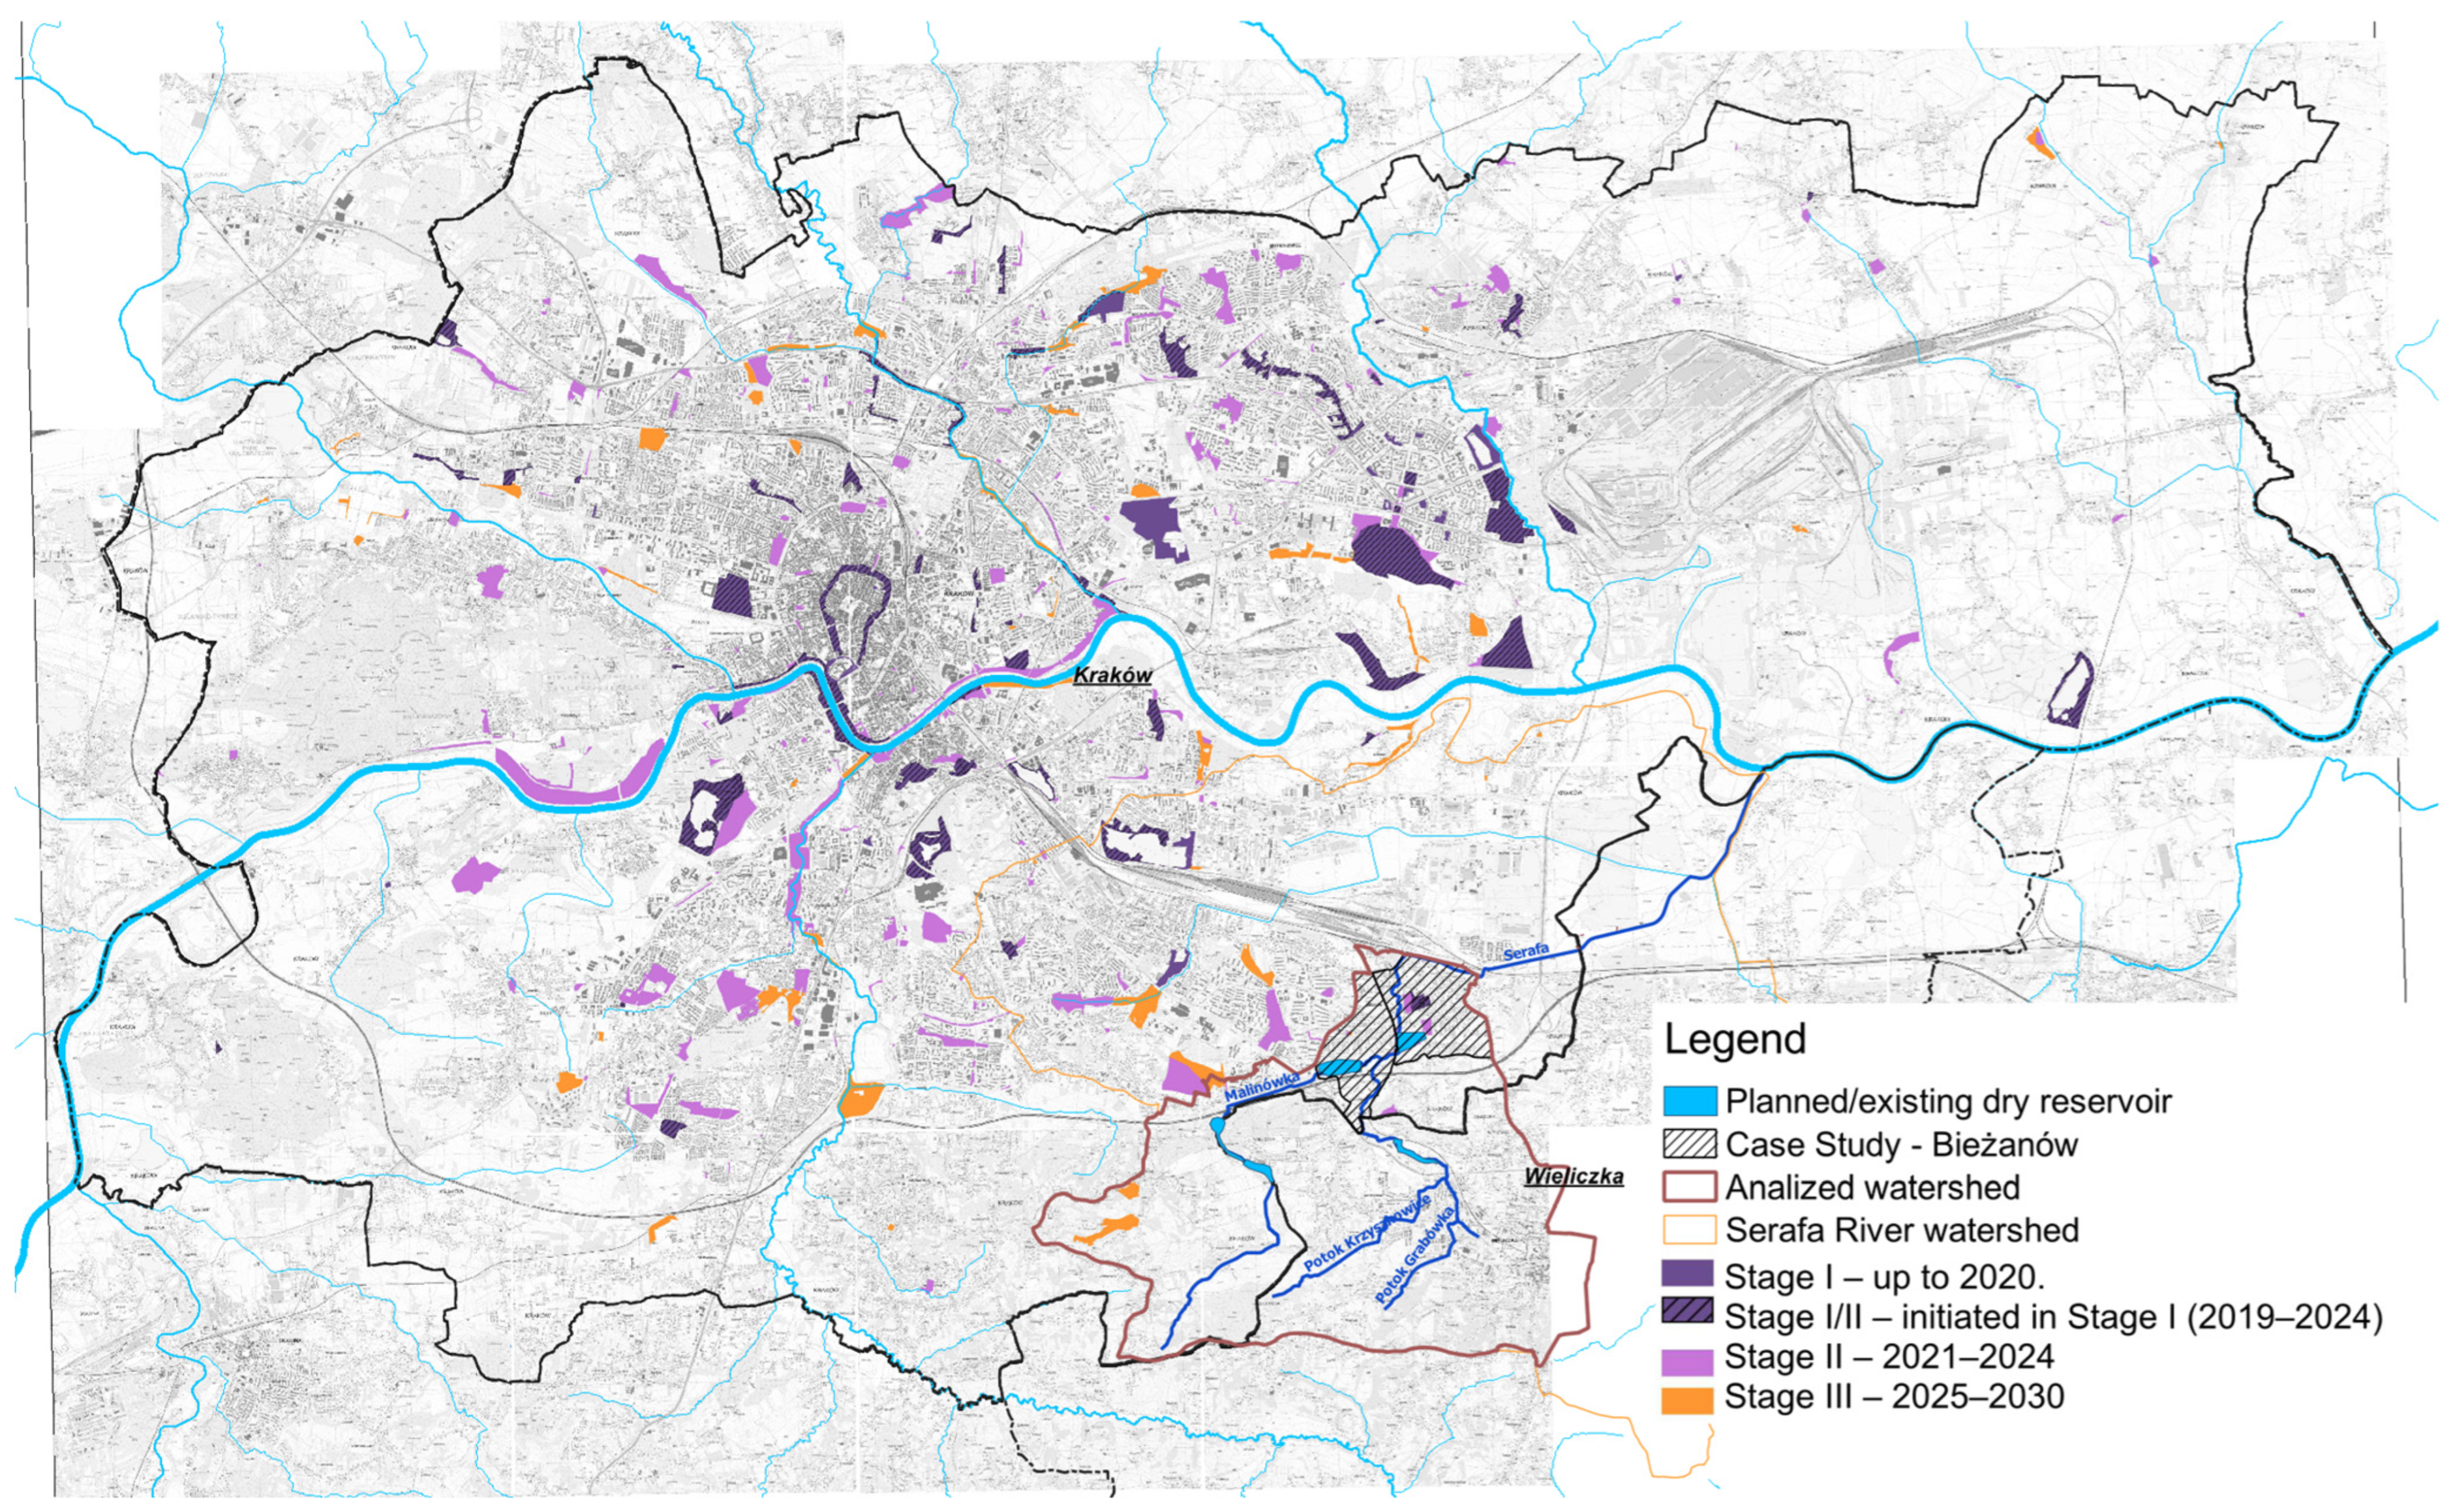
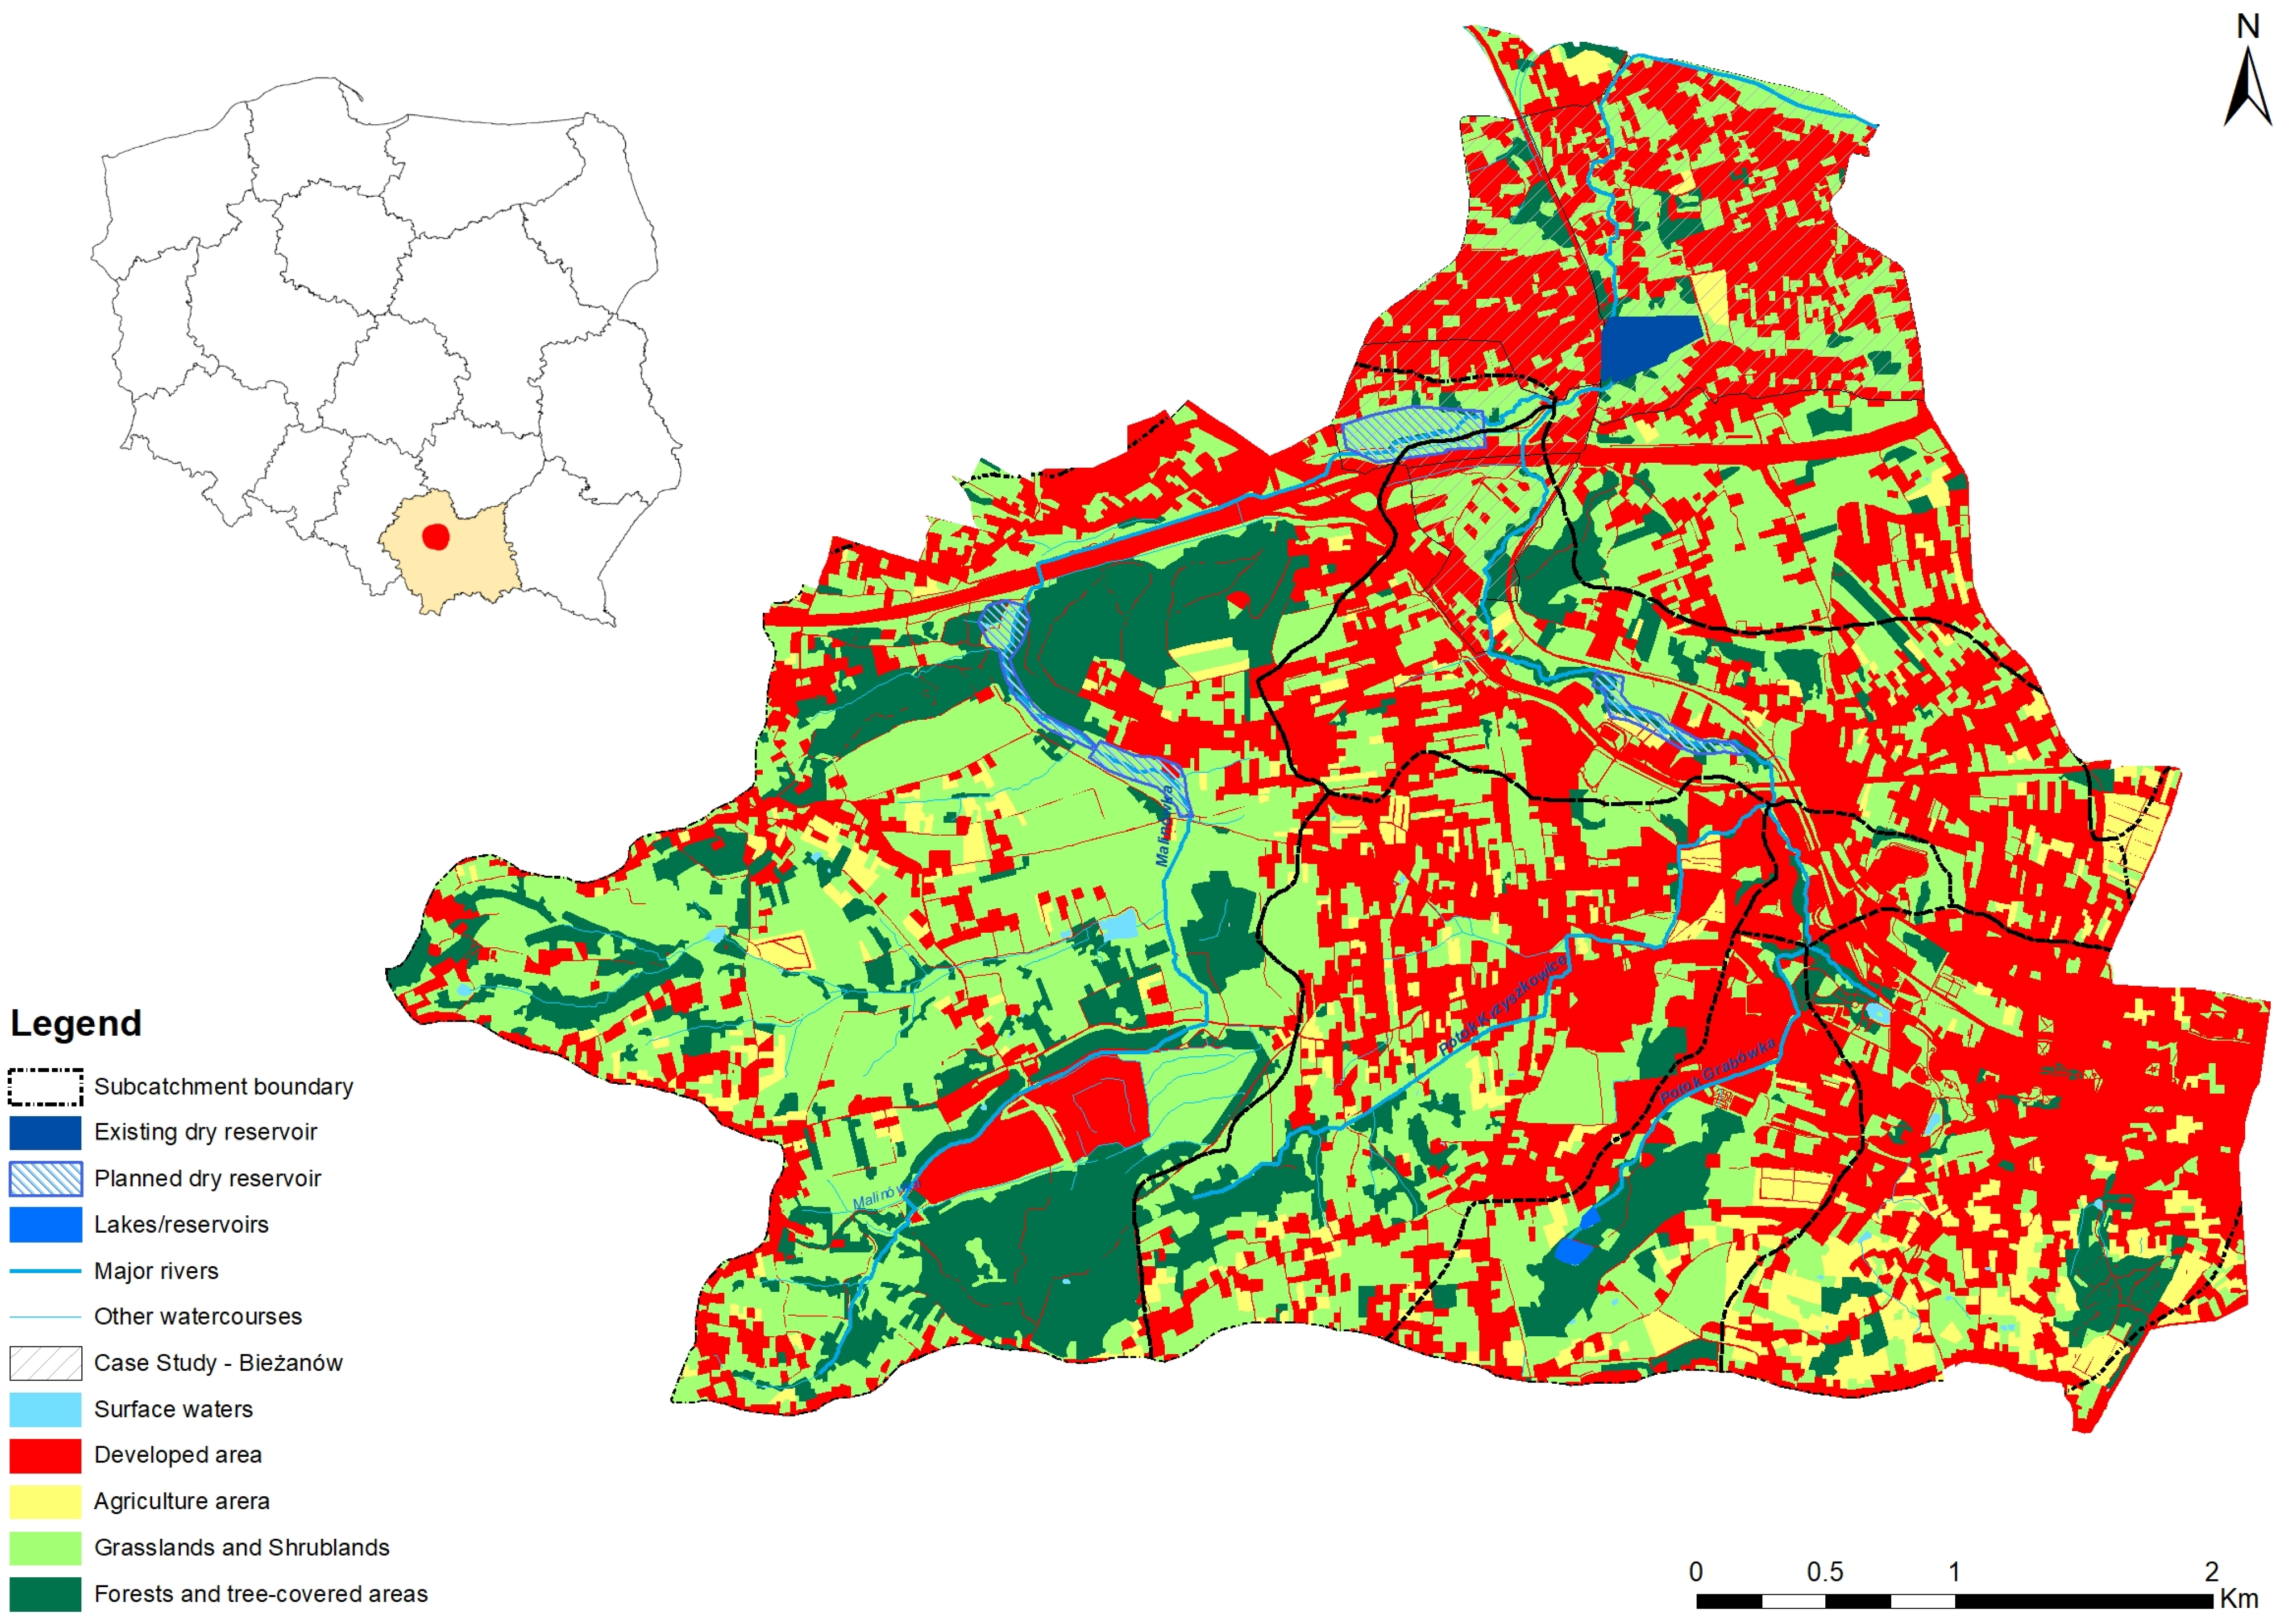
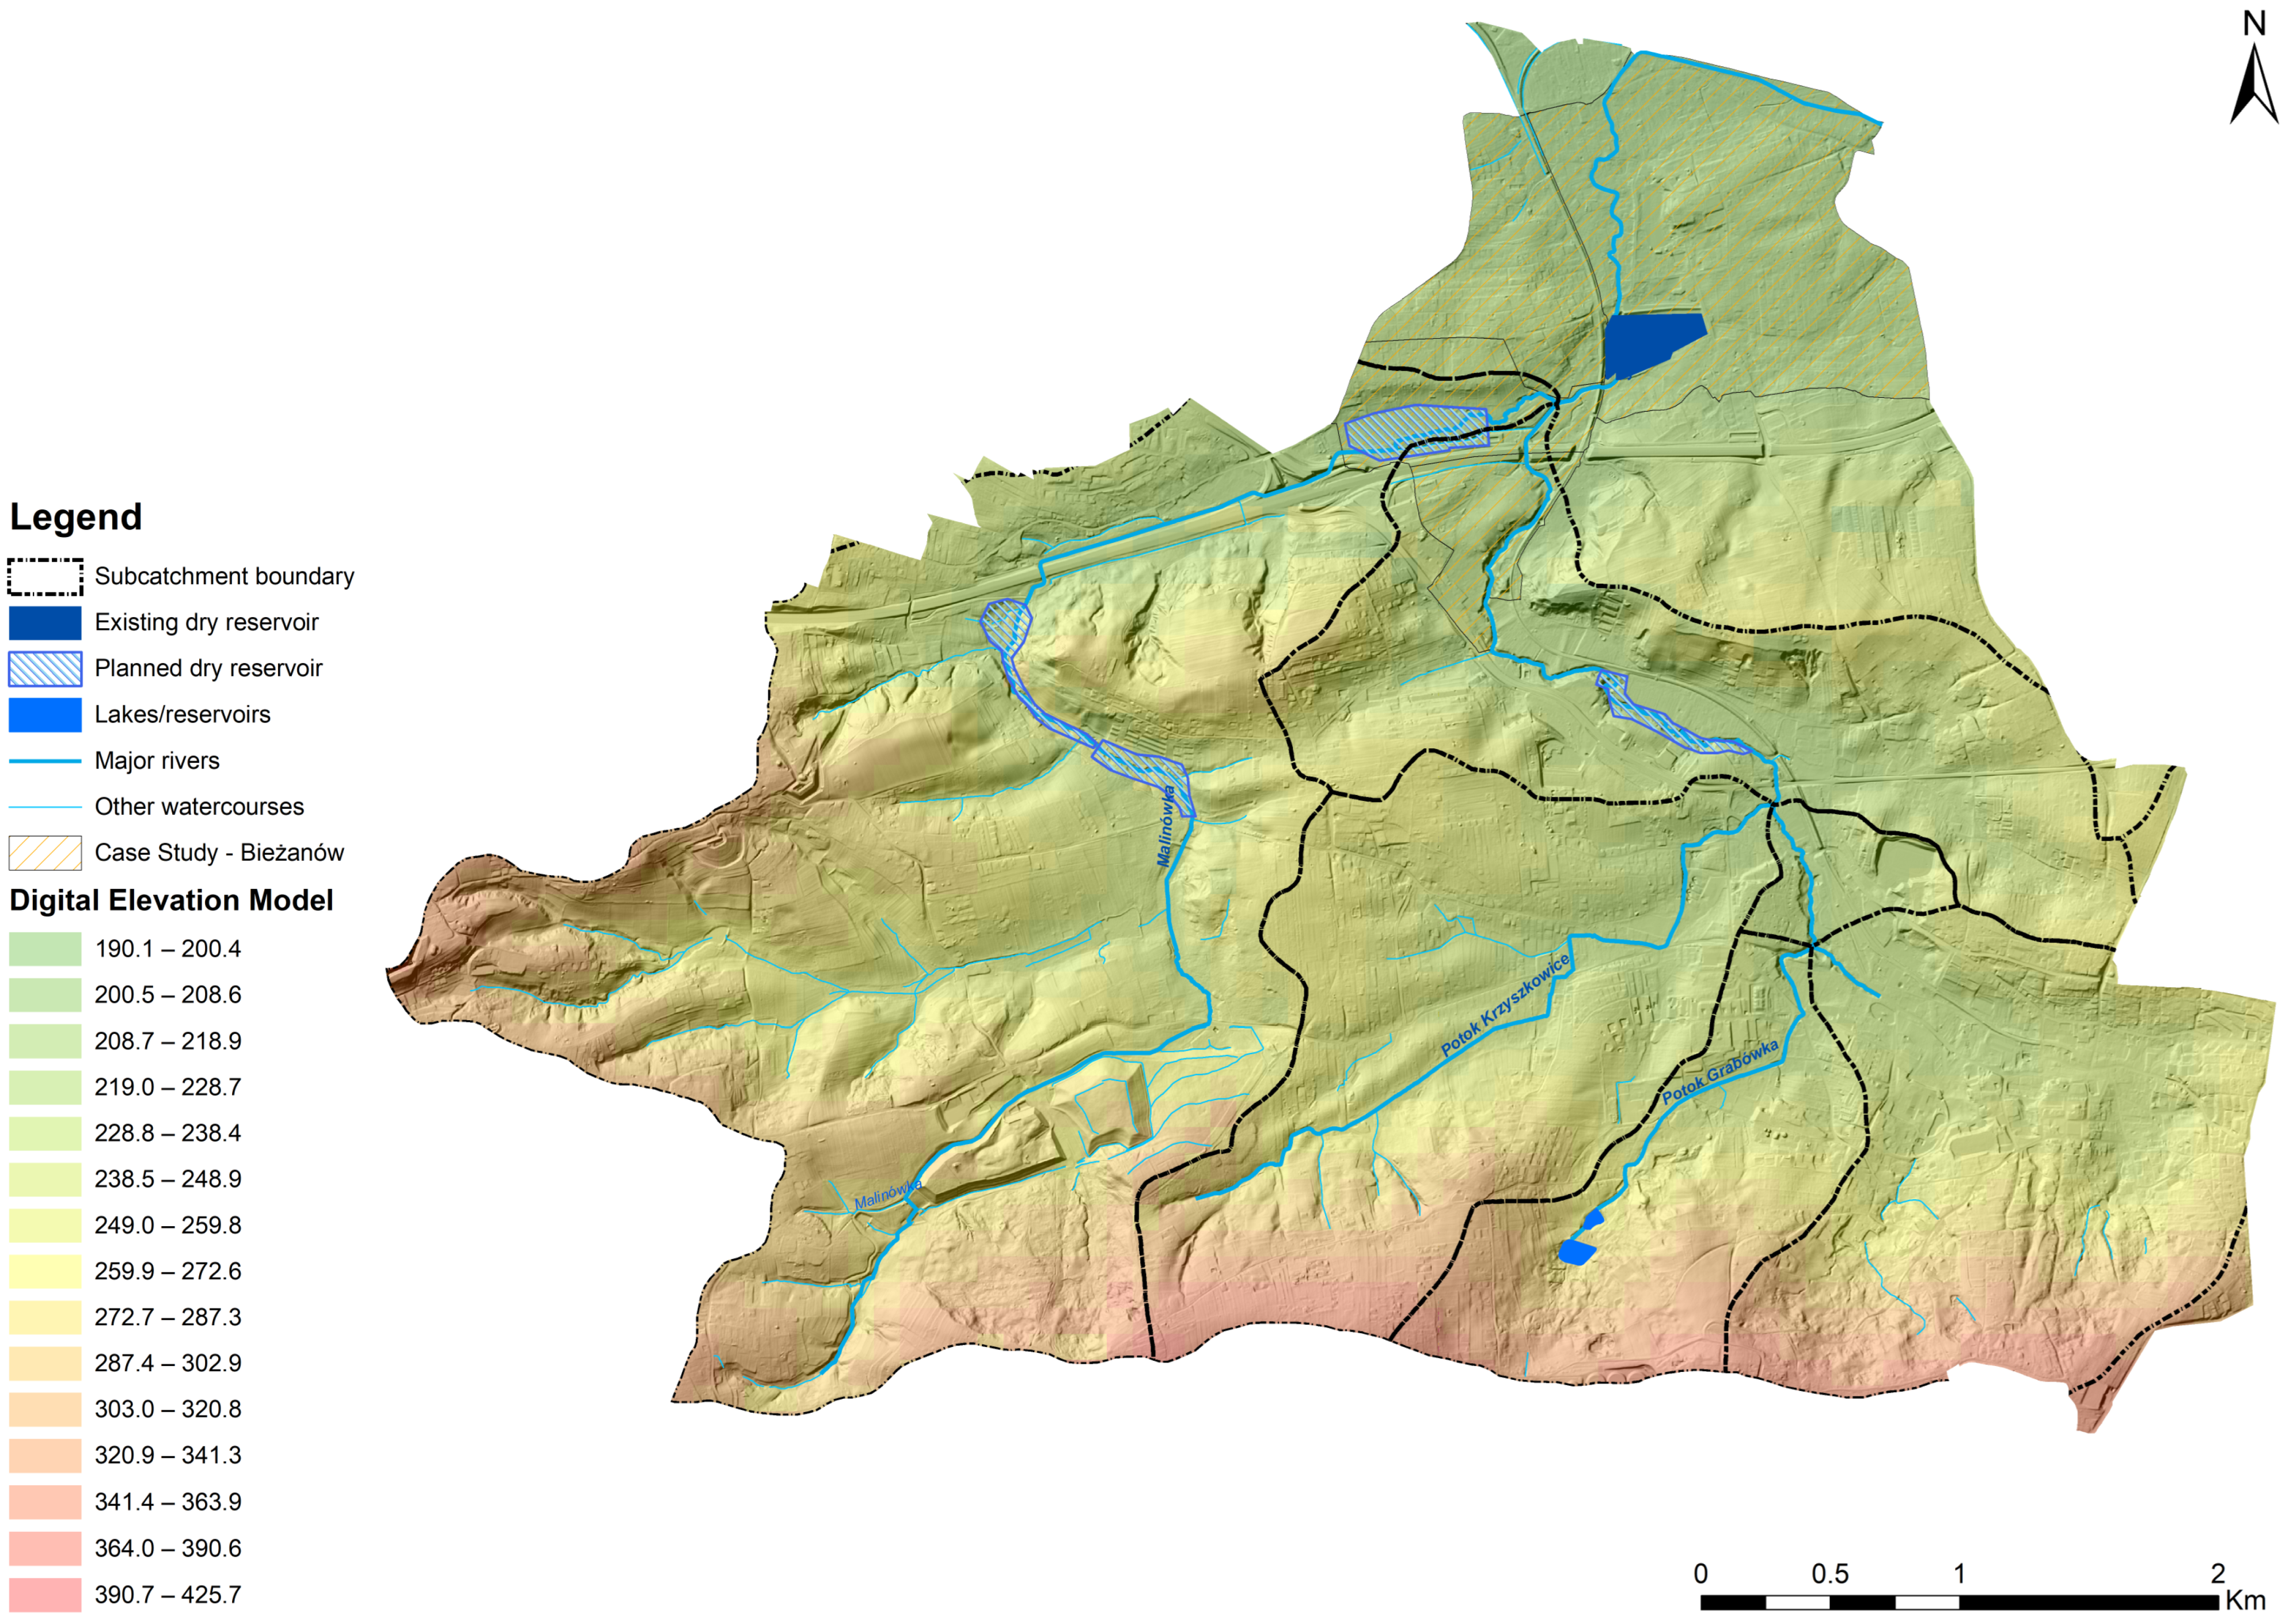
3.1. Study Area
3.2. Accumulated Runoff Analysis
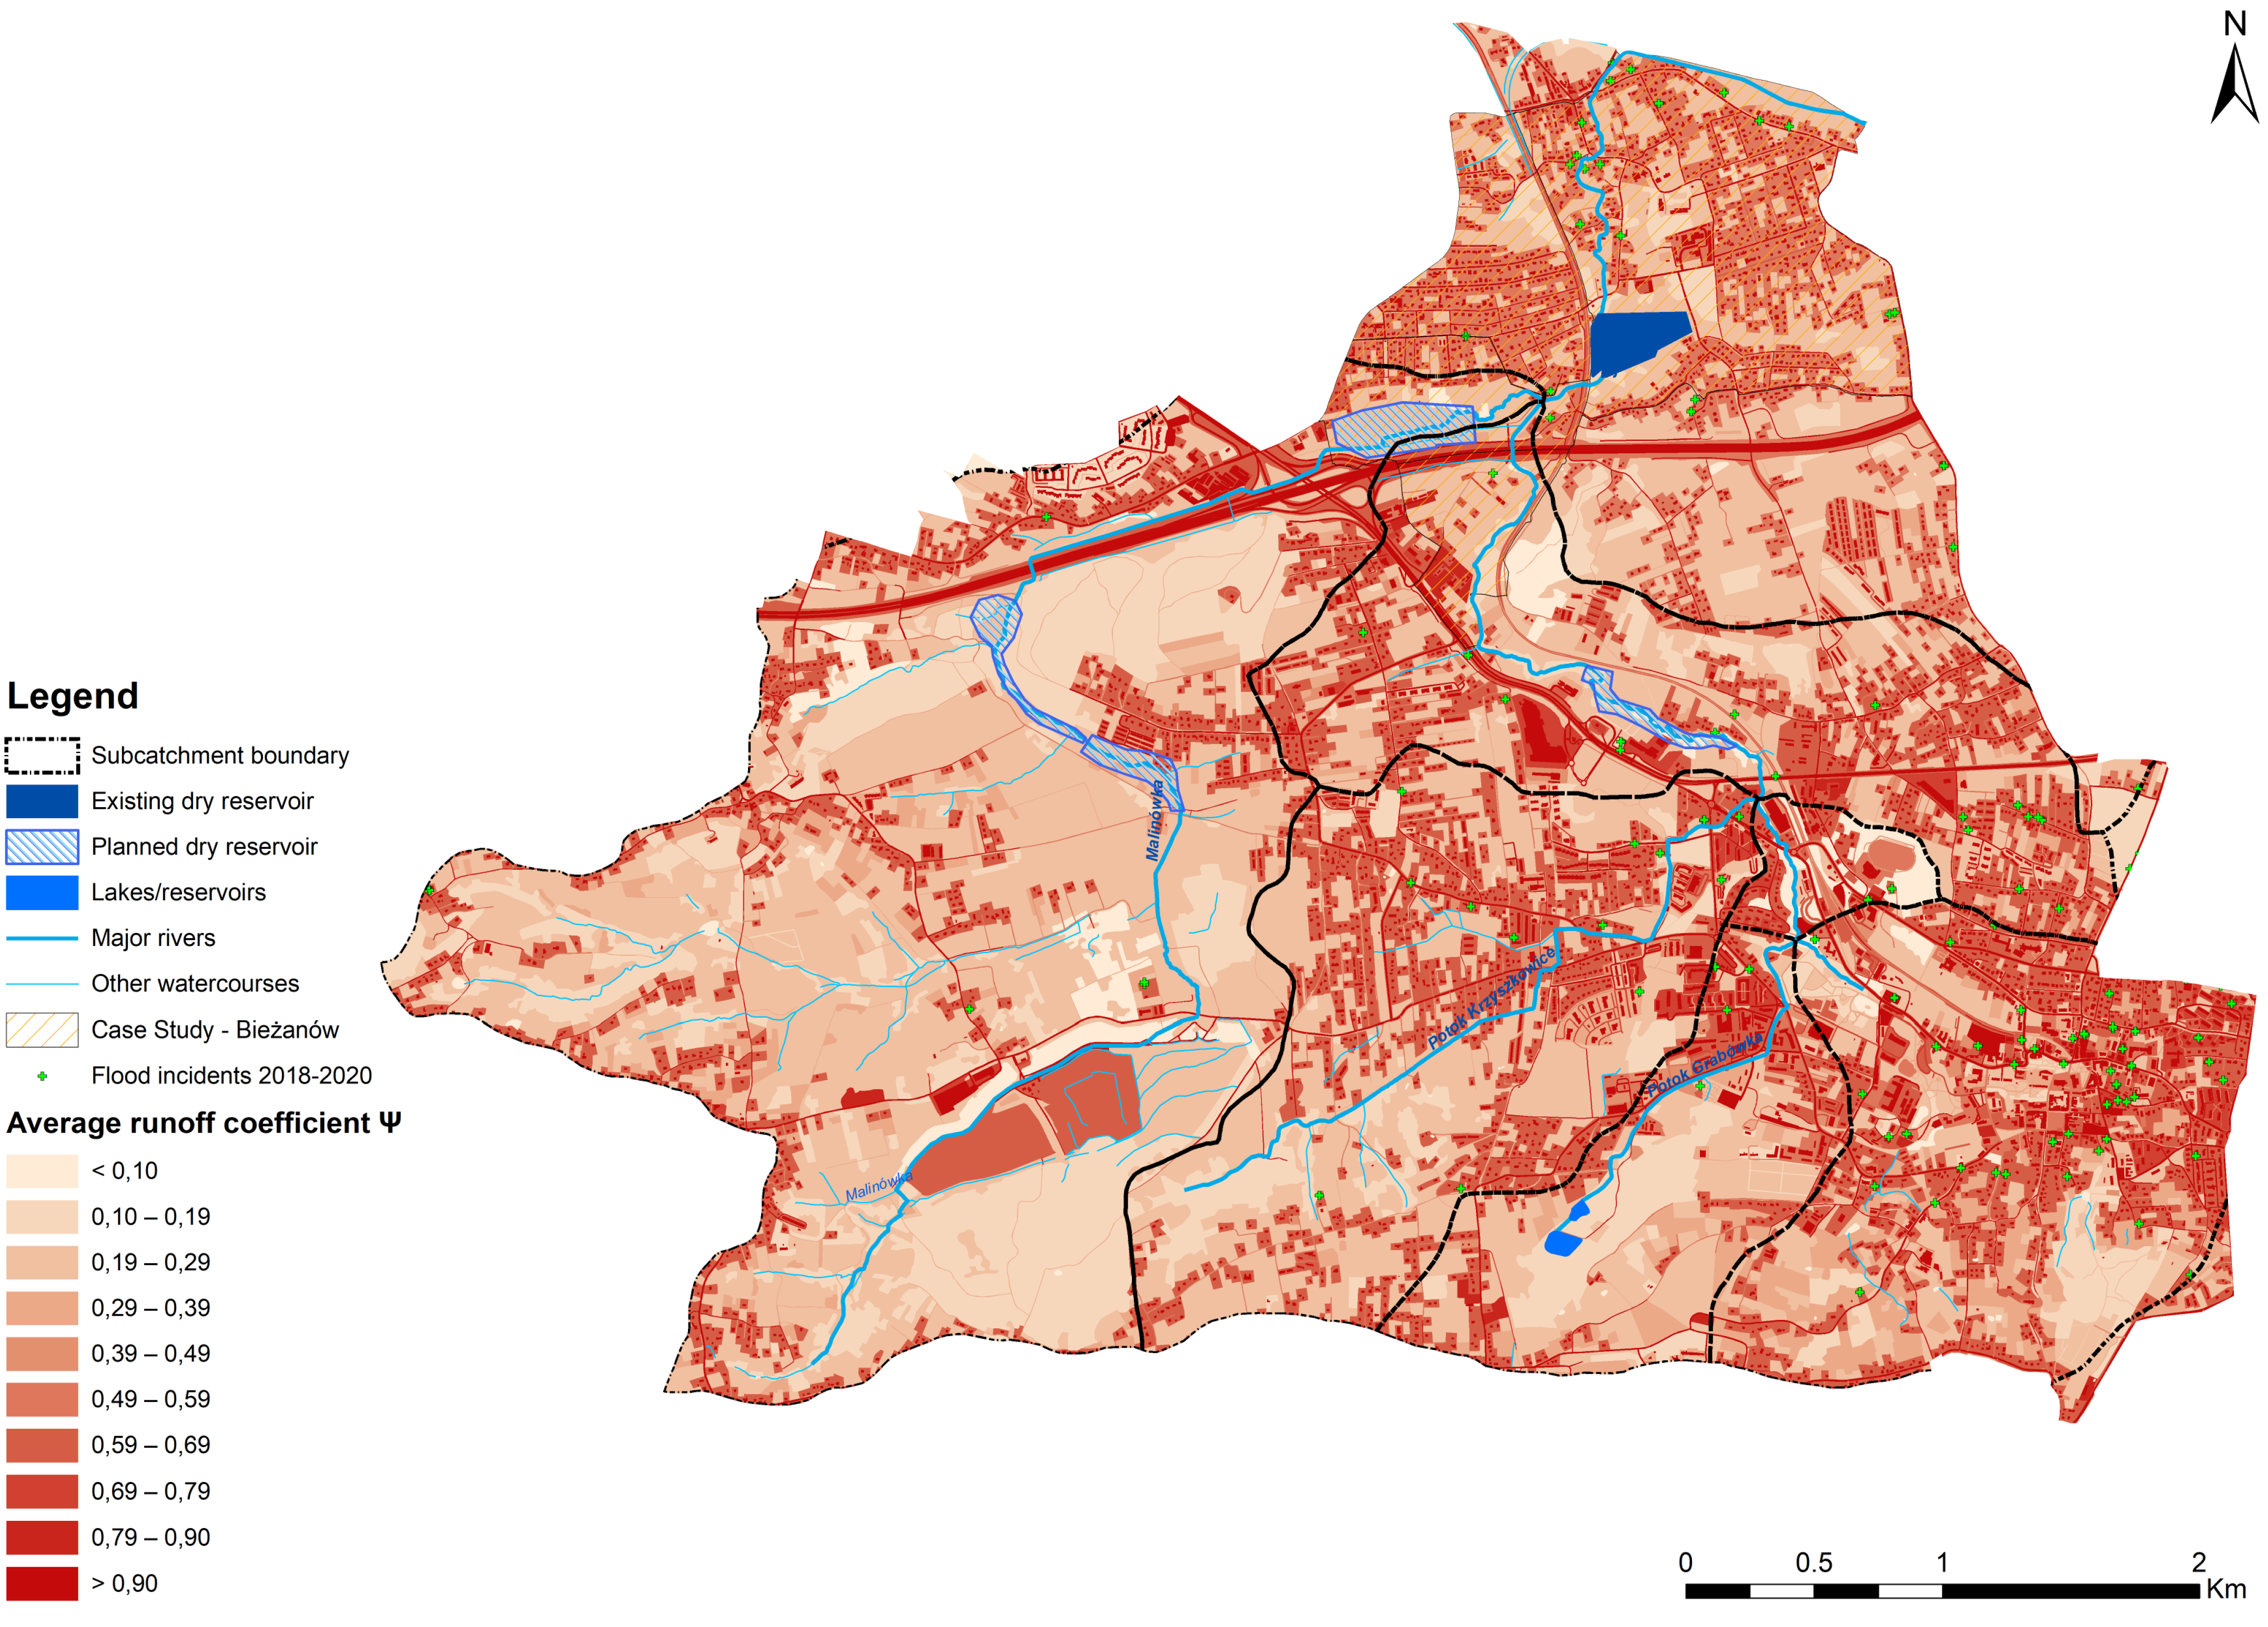
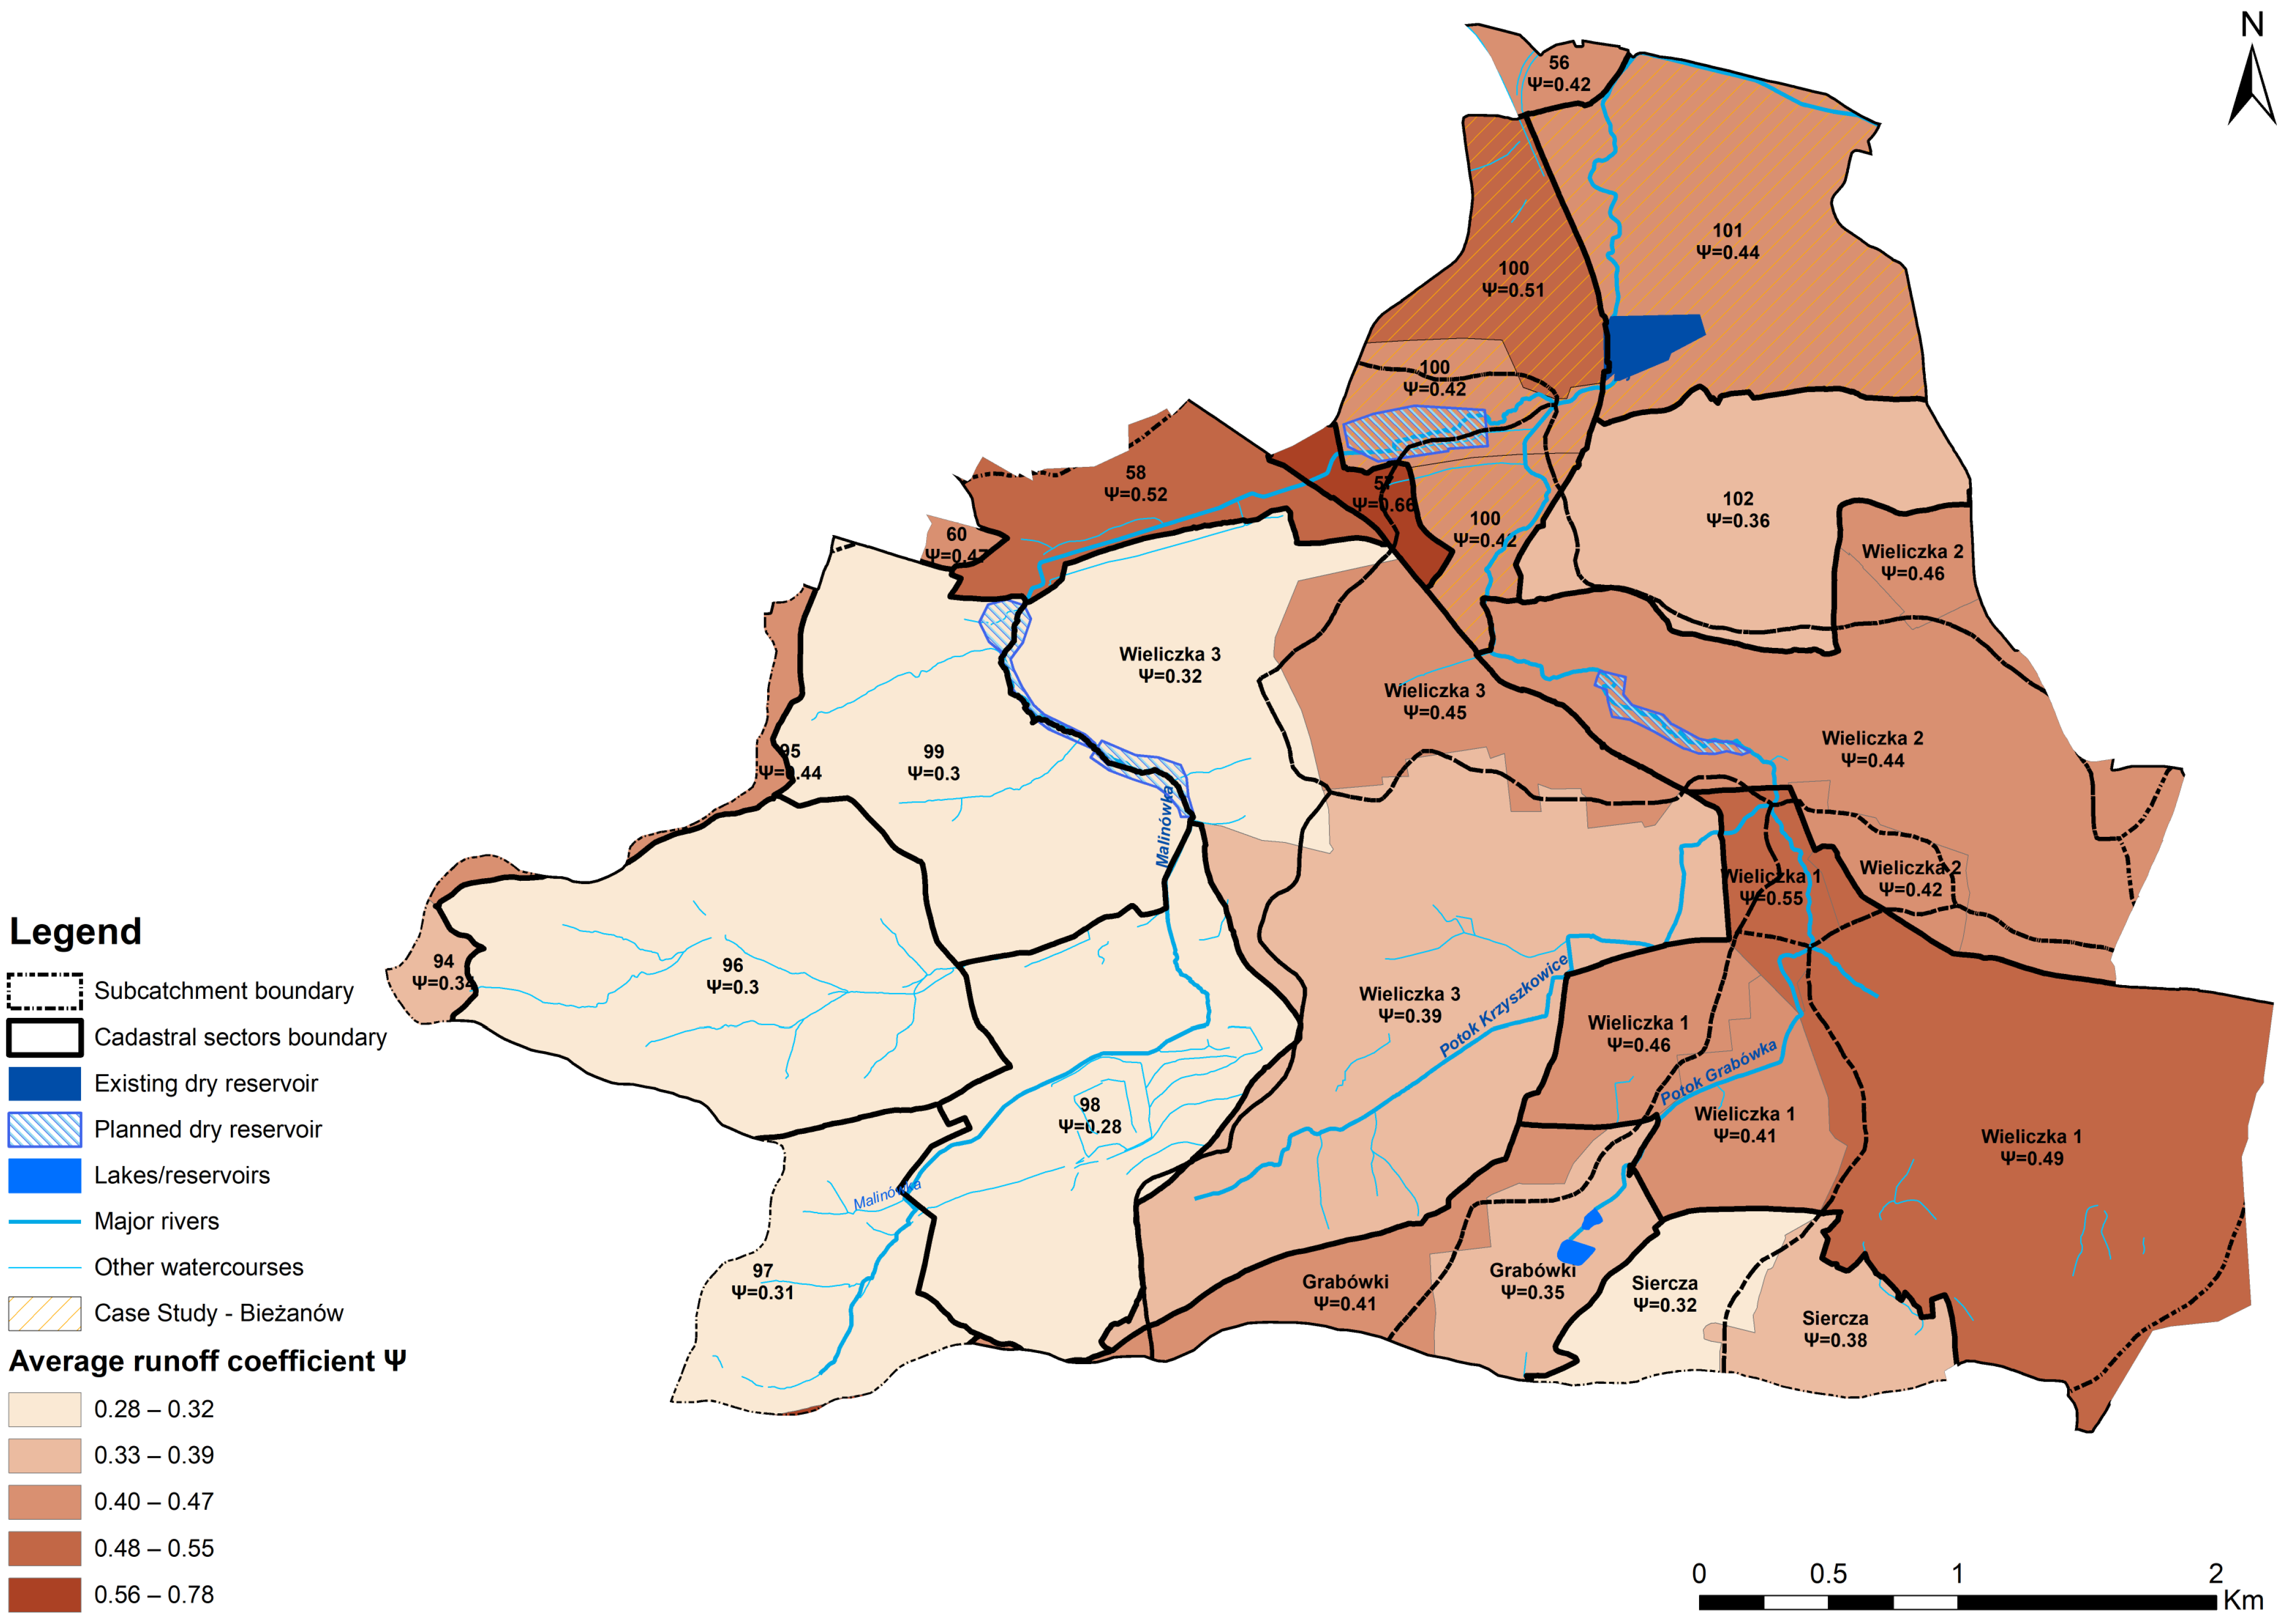
3.3. Accumulated Runoff Mapping Analysis as a Tool to Assess Urban Area Vulnerability
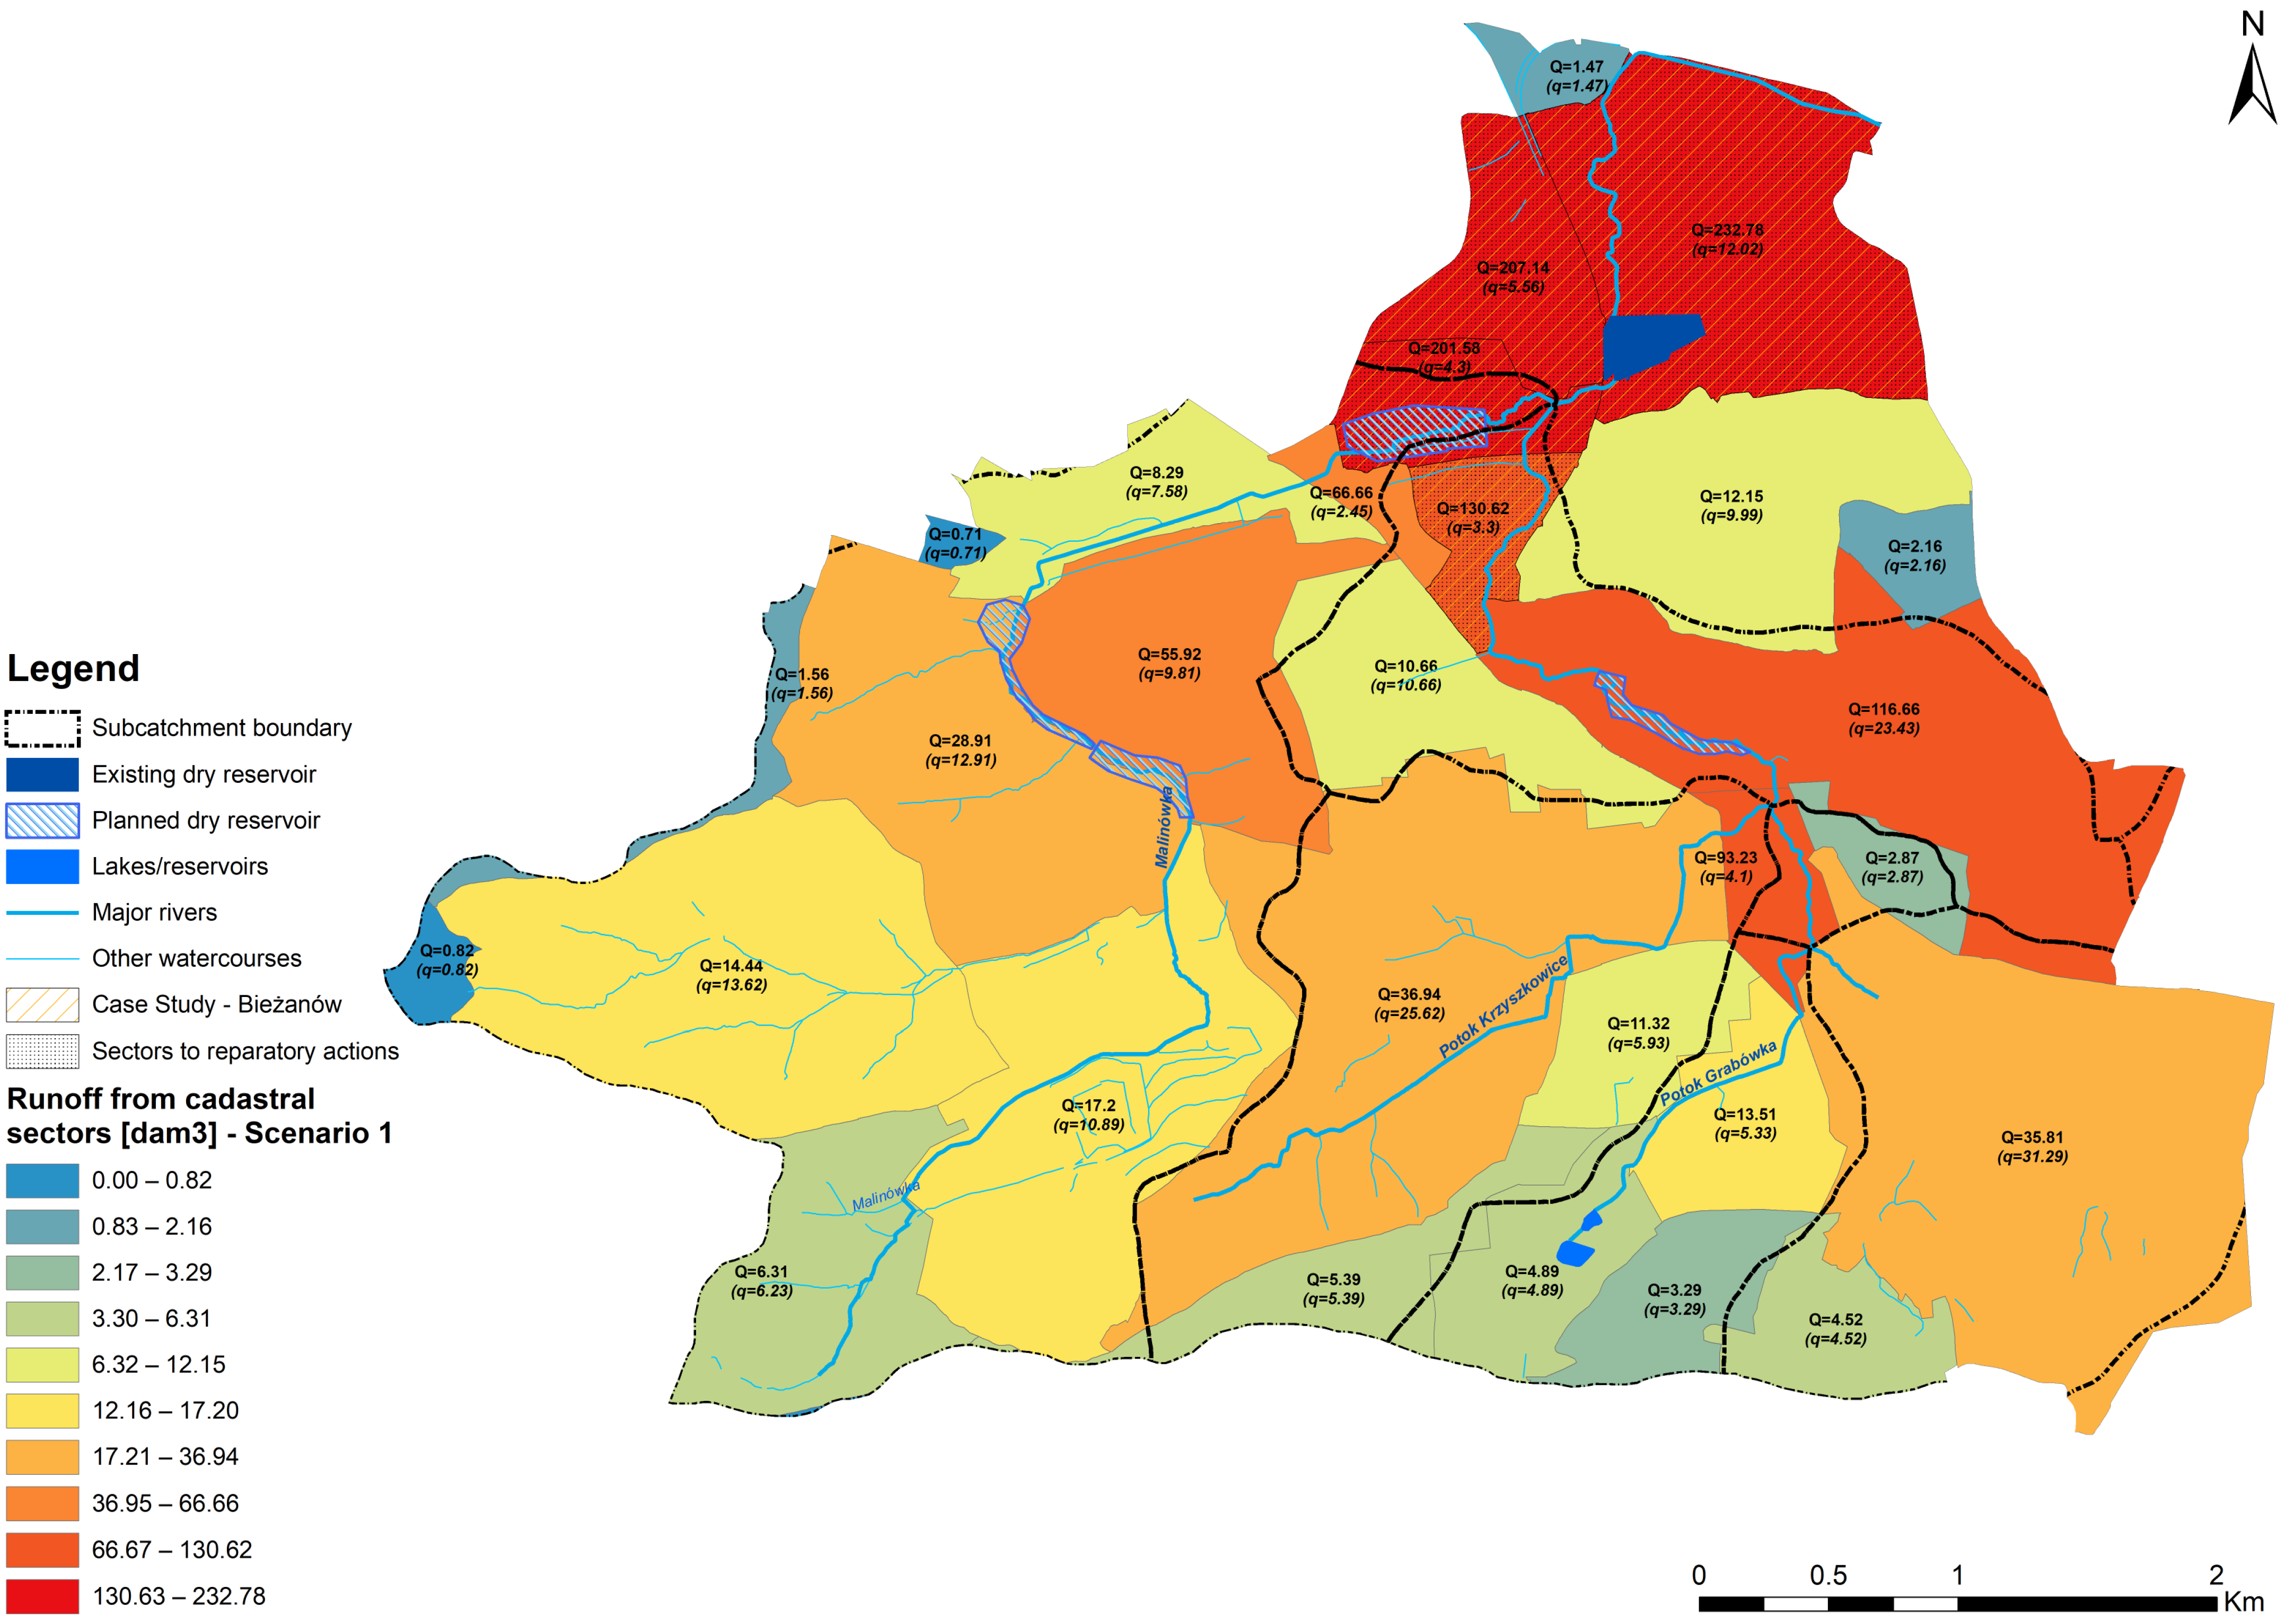
3.4. Local Protection Strategies and Reparatory Scenarios
- Scenario 1, presented in Figure 9, assumed that any measures would be confined to areas where flooding events were recorded (cadastral sectors 100 and 101).
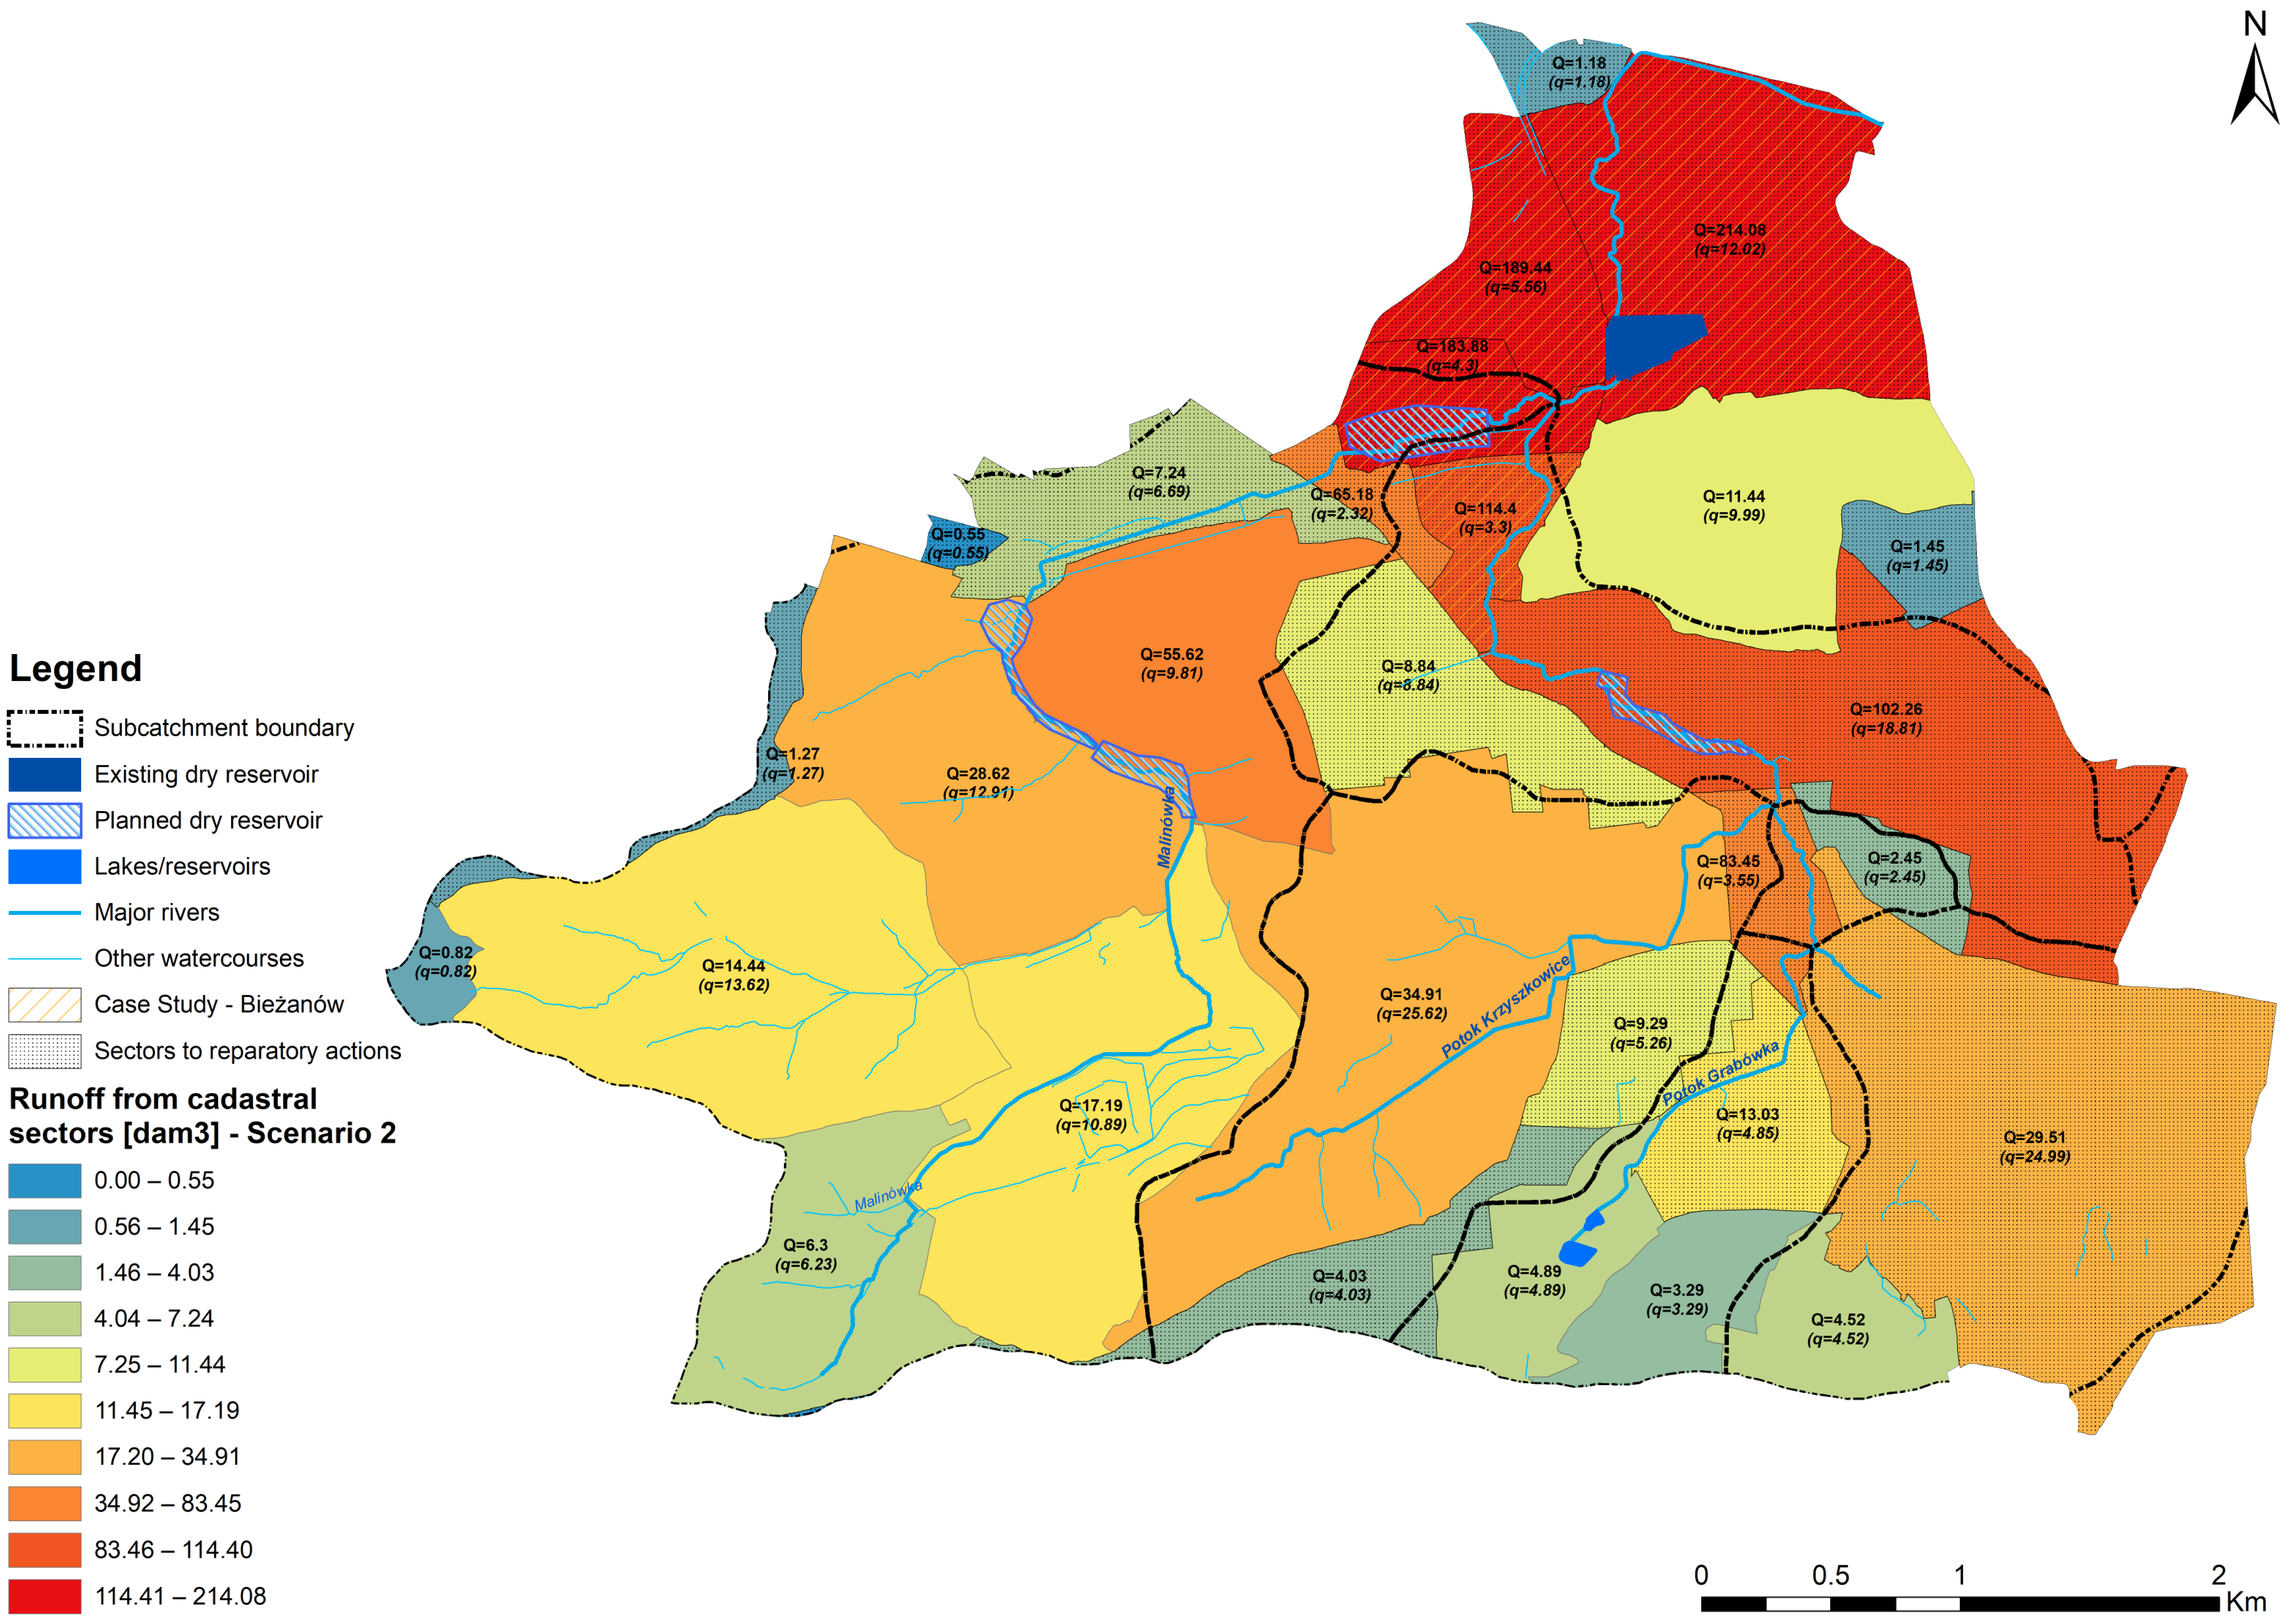
- Scenario 2, presented in Figure 10, encompassed measures in cadastral sectors located upstream, for which the runoff coefficient Ψ is at least 0.4, identified to have an impact on the hydrological situation in critical and highly vulnerable sectors.
- Simulated measures for both scenarios:
- Replaced 50% of footpaths (concrete, prefabricated pavers, bitumen mass, concrete slabs, or stone pavers) with modern mineral courses infiltrating into the ground;
- Replacement of 50% of the surfaces of squares and parking spaces with impervious surfaces from bitumen mass, concrete, concrete slabs, stone and prefabricated pavers, and polyurethane with modern mineral courses that allow water infiltration into the soil;
- Managed 50% of rainwater from local and access roadways with impervious surfaces from concrete, concrete slabs, and prefabricated and stone pavers via bioretention or infiltration measures or other green infrastructure measures;
- Increased by 20% the number of trees in current shrublands, orchards, and grasslands, as well as on private properties and fields, in the form of rain gardens, parks, and planting new trees;
- Implementation of runoff micro retention from existing single-family building roofs and the roofs of buildings with two residential units to rain barrels or tanks within the cadastral sector. The main scope of the micro retention is to apply minimum tank volumes, which are estimated at 3% of the annual rainfall and are equivalent to capturing a steady rainfall of 273.3 dm3/s*ha (p = 20%, t = 15 min) [65].
4. Discussion
- Characteristics of cadastral sectors in terms of development intensity by determining the runoff coefficients, which can identify sectors with a high degree of sealing, where remedial actions should be taken first;
- Estimation of the surface runoff for the selected precipitation, which allows, for example, to determine the estimated capacity of devices that can retain the runoff for the selected precipitation (or its part);
- Calculation of the cumulative surface runoff for the selected rainfall allows us to visualize approximately how the runoff increases along the river’s course and increases flood risk downriver;
- Information on sealing in individual cadastral units and runoff from their area allows us to select the location, type, and capacity of remedial actions both in the units at risk and in the units located above, which may actually be the source of existing threats;
- The possibility of simulating remedial actions can be a tool for formulating initial concepts of action programs, formulating appropriate recommendations, and provisions in local spatial development plans, obligations of investors and property owners in the field of stormwater management, the mandatory share of biologically active areas, location of city parks, and other urban planning recommendations.
5. Conclusions
Author Contributions
Funding
Institutional Review Board Statement
Informed Consent Statement
Data Availability Statement
Conflicts of Interest
References
- Pińskwar, I.; Choryński, A.; Graczyk, D.; Kundzewicz, Z.W. Observed changes in extreme precipitation in Poland: 1991–2015 versus 1961–1990. Theor. Appl. Climatol. 2019, 135, 773–787. [Google Scholar] [CrossRef]
- Climate Change 2021: The Physical Science Basis|Climate Change 2021: The Physical Science Basis. Available online: https://www.ipcc.ch/report/ar6/wg1/#SPM (accessed on 25 March 2023).
- Bosseler, B.; Salomon, M.; Schlüter, M.; Rubinato, M. Living with Urban Flooding: A Continuous Learning Process for Local Municipalities and Lessons Learnt from the 2021 Events in Germany. Water 2021, 13, 2769. [Google Scholar] [CrossRef]
- European Commission. European Commission Forging a Climate-Resilient Europe—The New EU Strategy on Adaptation to Climate Change 2021; COM/2021/82 final; European Commission: Brussels, Belgium, 2021.
- Barnaś, K.; Jeleński, T.; Nowak-Ocłoń, M.; Racoń-Leja, K.; Radziszewska-Zielina, E.; Szewczyk, B.; Śladowski, G.; Toś, C.; Varbanov, P.S. Algorithm for the comprehensive thermal retrofit of housing stock aided by renewable energy supply: A sustainable case for Kraków. Energy 2023, 263, 125774. [Google Scholar] [CrossRef]
- Flaga-Maryańczyk, A.; Ocłoń, P.; Müller, J.; Żmuda, I. Standard Klimatyczny dla Nowych i Istniejących Budynków Użyteczności Publicznej w Krakowie; Politechnika Krakowska: Kraków, Poland, 2022. [Google Scholar]
- Choi, W.; Nauth, K.; Choi, J.; Becker, S. Urbanization and Rainfall–Runoff Relationships in the Milwaukee River Basin. Prof. Geogr. 2016, 68, 14–25. [Google Scholar] [CrossRef]
- Guzha, A.C.; Rufino, M.C.; Okoth, S.; Jacobs, S.; Nóbrega, R.L.B. Impacts of land use and land cover change on surface runoff, discharge and low flows: Evidence from East Africa. J. Hydrol. Reg. Stud. 2018, 15, 49–67. [Google Scholar] [CrossRef]
- McGrane, S.J. Impacts of urbanisation on hydrological and water quality dynamics, and urban water management: A review. Hydrol. Sci. J. 2016, 61, 2295–2311. [Google Scholar] [CrossRef]
- O’Driscoll, M.; Clinton, S.; Jefferson, A.; Manda, A.; McMillan, S. Urbanization Effects on Watershed Hydrology and In-Stream Processes in the Southern United States. Water 2010, 2, 605–648. [Google Scholar] [CrossRef]
- Hu, S.; Fan, Y.; Zhang, T. Assessing the Effect of Land Use Change on Surface Runoff in a Rapidly Urbanized City: A Case Study of the Central Area of Beijing. Land 2020, 9, 17. [Google Scholar] [CrossRef]
- Manchado, C.; Roldán-Valcarce, A.; Jato-Espino, D.; Andrés-Doménech, I.; Moreno, G.; Isabel, M.; Rojas, R. ArcDrain: A GIS Add-In for Automated Determination of Surface Runoff in Urban Catchments. Int. J. Environ. Res. Public Health 2021, 18, 8802. [Google Scholar] [CrossRef]
- Kumar, A.; Kanga, S.; Taloor, A.K.; Singh, S.K.; Đurin, B. Surface runoff estimation of Sind river basin using integrated SCS-CN and GIS techniques. HydroResearch 2021, 4, 61–74. [Google Scholar] [CrossRef]
- Xu, C.; Rahman, M.; Haase, D.; Wu, Y.; Su, M.; Pauleit, S. Surface runoff in urban areas: The role of residential cover and urban growth form. J. Clean. Prod. 2020, 262, 121421. [Google Scholar] [CrossRef]
- Sjöman, J.D.; Gill, S.E. Residential runoff—The role of spatial density and surface cover, with a case study in the Höjeå river catchment, southern Sweden. Urban For. Urban Green. 2014, 13, 304–314. [Google Scholar] [CrossRef]
- Jahan, K.; Pradhanang, S.M.; Bhuiyan, M.A.E. Surface Runoff Responses to Suburban Growth: An Integration of Remote Sensing, GIS, and Curve Number. Land 2021, 10, 452. [Google Scholar] [CrossRef]
- Ponce, V.M.; Hawkins, R.H. Runoff Curve Number: Has It Reached Maturity? J. Hydrol. Eng. 1996, 1, 11–19. [Google Scholar] [CrossRef]
- Wałęga, A.; Amatya, D.M.; Caldwell, P.; Marion, D.; Panda, S. Assessment of storm direct runoff and peak flow rates using improved SCS-CN models for selected forested watersheds in the Southeastern United States. J. Hydrol. Reg. Stud. 2020, 27, 100645. [Google Scholar] [CrossRef]
- Mushtaha, A.M.; Van Camp, M.; Walraevens, K. Quantification of Recharge and Runoff from Rainfall Using New GIS Tool: Example of the Gaza Strip Aquifer. Water 2019, 11, 84. [Google Scholar] [CrossRef]
- Petroselli, A.; Wałęga, A.; Młyński, D.; Radecki-Pawlik, A.; Cupak, A.; Hathaway, J. Rainfall-runoff modeling: A modification of the EBA4SUB framework for ungauged and highly impervious urban catchments. J. Hydrol. 2022, 606, 127371. [Google Scholar] [CrossRef]
- Młyński, D.; Wałęga, A.; Książek, L.; Florek, J.; Petroselli, A. Possibility of Using Selected Rainfall-Runoff Models for Determining the Design Hydrograph in Mountainous Catchments: A Case Study in Poland. Water 2020, 12, 1450. [Google Scholar] [CrossRef]
- Engel, B.A.; Ahiablame, L.M.; Leroy, J.D. Modeling the impacts of urbanization on lake water level using L-THIA. Urban Clim. 2015, 14, 578–585. [Google Scholar] [CrossRef]
- Hernández-Guzmán, R.; Ruiz-Luna, A.; Mendoza, E. Sara4r: An R graphical user interface (GUI) to estimate watershed surface runoff applying the NRCS–Curve number method. J. Hydroinform. 2020, 23, 76–87. [Google Scholar] [CrossRef]
- Niyazi, B.A.; Masoud, M.H.; Ahmed, M.; Basahi, J.M.; Rashed, M.A. Runoff assessment and modeling in arid regions by integration of watershed and hydrologic models with GIS techniques. J. Afr. Earth Sci. 2020, 172, 103966. [Google Scholar] [CrossRef]
- Norbiato, D.; Borga, M.; Merz, R.; Blöschl, G.; Carton, A. Controls on event runoff coefficients in the eastern Italian Alps. J. Hydrol. 2009, 375, 312–325. [Google Scholar] [CrossRef]
- Psomiadis, E.; Soulis, K.X.; Efthimiou, N. Using SCS-CN and Earth Observation for the Comparative Assessment of the Hydrological Effect of Gradual and Abrupt Spatiotemporal Land Cover Changes. Water 2020, 12, 1386. [Google Scholar] [CrossRef]
- Wałęga, A.; Radecki Pawlik, A.; Cupak, A.; Hathaway, J.; Pukowiec, M. Influence of Changes of Catchment Permeability and Frequency of Rainfall on Critical Storm Duration in an Urbanized Catchment—A Case Study, Cracow, Poland. Water 2019, 11, 2557. [Google Scholar] [CrossRef]
- Dhakal, N.; Fang, X.; Cleveland, T.G.; Thompson, D.B.; Asquith, W.H.; Marzen, L.J. Estimation of Volumetric Runoff Coefficients for Texas Watersheds Using Land-Use and Rainfall-Runoff Data. J. Irrig. Drain. Eng. 2012, 138, 43–54. [Google Scholar] [CrossRef]
- Bai, T.; Borowiak, K.; Wu, Y.; Zhang, J. Highly Resolved Runoff Path Simulation Based on Urban Surface Landscape Layout for Sub-Catchment Scale. Water 2021, 13, 1345. [Google Scholar] [CrossRef]
- Liang, S.; Greene, R. A high-resolution global runoff estimate based on GIS and an empirical runoff coefficient. Hydrol. Res. 2020, 51, 1238–1260. [Google Scholar] [CrossRef]
- Dong, J.; Zuo, J.; Luo, J. Development of a Management Framework for Applying Green Roof Policy in Urban China: A Preliminary Study. Sustainability 2020, 12, 10364. [Google Scholar] [CrossRef]
- Patil, N.S.; Nataraja, M. Effect of land use land cover changes on runoff using hydrological model: A case study in Hiranyakeshi watershed. Model. Earth Syst. Environ. 2020, 6, 2345–2357. [Google Scholar] [CrossRef]
- Yan, B.; Fang, N.F.; Zhang, P.C.; Shi, Z.H. Impacts of land use change on watershed streamflow and sediment yield: An assessment using hydrologic modelling and partial least squares regression. J. Hydrol. 2013, 484, 26–37. [Google Scholar] [CrossRef]
- Hameed, H.M. Estimating the Effect of Urban Growth on Annual Runoff Volume Using GIS in the Erbil Sub-Basin of the Kurdistan Region of Iraq. Hydrology 2017, 4, 12. [Google Scholar] [CrossRef]
- Chang, H.S.; Su, Q. Exploring the coupling relationship of stormwater runoff distribution in watershed from the perspective of fairness. Urban Clim. 2021, 36, 100792. [Google Scholar] [CrossRef]
- Ghiglieri, G.; Carletti, A.; Pittalis, D. Runoff coefficient and average yearly natural aquifer recharge assessment by physiography-based indirect methods for the island of Sardinia (Italy) and its NW area (Nurra). J. Hydrol. 2014, 519, 1779–1791. [Google Scholar] [CrossRef]
- Pektaş, A.O.; Kerem Cigizoglu, H. ANN hybrid model versus ARIMA and ARIMAX models of runoff coefficient. J. Hydrol. 2013, 500, 21–36. [Google Scholar] [CrossRef]
- Sriwongsitanon, N.; Taesombat, W. Effects of land cover on runoff coefficient. J. Hydrol. 2011, 410, 226–238. [Google Scholar] [CrossRef]
- Yin, H.; Zhao, Z.; Wang, R.; Xu, Z.; Li, H. Determination of urban runoff coefficient using time series inverse modeling. J. Hydrodyn. 2017, 29, 898–901. [Google Scholar] [CrossRef]
- Yu, Y.; Yu, P.; Wang, Y.; Tu, X.; Zhang, X.; Zhang, S.; Xu, L.; Wang, X.; Liu, Z.; Wang, B. Dependence of annual runoff coefficients on basin size and other properties in a climate transition zone from semi-humid to arid and semi-arid on the Loess Plateau, China. J. Hydrol. 2020, 591, 125727. [Google Scholar] [CrossRef]
- Leta, M.K.; Demissie, T.A.; Tränckner, J. Hydrological Responses of Watershed to Historical and Future Land Use Land Cover Change Dynamics of Nashe Watershed, Ethiopia. Water 2021, 13, 2372. [Google Scholar] [CrossRef]
- Bai, X.; Wang, B.; Qi, Y. The Effect of Returning Farmland to Grassland and Coniferous Forest on Watershed Runoff—A Case Study of the Naoli River Basin in Heilongjiang Province, China. Sustainability 2021, 13, 6264. [Google Scholar] [CrossRef]
- Buendia, C.; Bussi, G.; Tuset, J.; Vericat, D.; Sabater, S.; Palau, A.; Batalla, R.J. Effects of afforestation on runoff and sediment load in an upland Mediterranean catchment. Sci. Total Environ. 2016, 540, 144–157. [Google Scholar] [CrossRef]
- Khand, K.; Senay, G.B. Runoff response to directional land cover change across reference basins in the conterminous United States. Adv. Water Resour. 2021, 153, 103940. [Google Scholar] [CrossRef]
- Zheng, H.; Miao, C.; Zhang, G.; Li, X.; Wang, S.; Wu, J.; Gou, J. Is the runoff coefficient increasing or decreasing after ecological restoration on China’s Loess Plateau? Int. Soil Water Conserv. Res. 2021, 9, 333–343. [Google Scholar] [CrossRef]
- Roy, S.; Bose, A.; Singha, N.; Basak, D.; Chowdhury, I.R. Urban waterlogging risk as an undervalued environmental challenge: An Integrated MCDA-GIS based modeling approach. Environ. Chall. 2021, 4, 100194. [Google Scholar] [CrossRef]
- Paul, P.; Sarkar, R. Flood susceptible surface detection using geospatial multi-criteria framework for management practices. Nat. Hazards 2022, 114, 3015–3041. [Google Scholar] [CrossRef]
- Duan, C.; Zhang, J.; Chen, Y.; Lang, Q.; Zhang, Y.; Wu, C.; Zhang, Z. Comprehensive Risk Assessment of Urban Waterlogging Disaster Based on MCDA-GIS Integration: The Case Study of Changchun, China. Remote Sens. 2022, 14, 3101. [Google Scholar] [CrossRef]
- Zhang, Z.; Zhang, J.; Zhang, Y.; Chen, Y.; Yan, J. Urban Flood Resilience Evaluation Based on GIS and Multi-Source Data: A Case Study of Changchun City. Remote Sens. 2023, 15, 1872. [Google Scholar] [CrossRef]
- Khosravi, K.; Shahabi, H.; Pham, B.T.; Adamowski, J.; Shirzadi, A.; Pradhan, B.; Dou, J.; Ly, H.B.; Gróf, G.; Ho, H.L.; et al. A comparative assessment of flood susceptibility modeling using Multi-Criteria Decision-Making Analysis and Machine Learning Methods. J. Hydrol. 2019, 573, 311–323. [Google Scholar] [CrossRef]
- Khoirunisa, N.; Ku, C.Y.; Liu, C.Y. A GIS-based artificial neural network model for flood susceptibility assessment. Int. J. Environ. Res. Public Health 2021, 18, 1072. [Google Scholar] [CrossRef]
- Souissi, D.; Souie, A.; Sebei, A.; Mahfoudhi, R.; Zghibi, A.; Zouhri, L.; Amiri, W.; Ghanmi, M. Flood hazard mapping and assessment using fuzzy analytic hierarchy process and GIS techniques in Takelsa, Northeast Tunisia. Arab. J. Geosci. 2022, 15, 1405. [Google Scholar] [CrossRef]
- Rudra, R.R.; Sarkar, S.K. Artificial neural network for flood susceptibility mapping in Bangladesh. Heliyon 2023, 9, e16459. [Google Scholar] [CrossRef]
- Lin, J.; He, P.; Yang, L.; He, X.; Lu, S.; Liu, D. Predicting future urban waterlogging-prone areas by coupling the maximum entropy and FLUS model. Sustain. Cities Soc. 2022, 80, 103812. [Google Scholar] [CrossRef]
- Siahkamari, S.; Haghizadeh, A.; Zeinivand, H.; Tahmasebipour, N.; Rahmati, O. Spatial prediction of flood-susceptible areas using frequency ratio and maximum entropy models. Geocarto Int. 2018, 33, 927–941. [Google Scholar] [CrossRef]
- Malekinezhad, H.; Sepehri, M.; Pham, Q.B.; Hosseini, S.Z.; Meshram, S.G.; Vojtek, M.; Vojteková, J. Application of entropy weighting method for urban flood hazard mapping. Acta Geophys. 2021, 69, 841–854. [Google Scholar] [CrossRef]
- Abedi, R.; Costache, R.; Shafizadeh-Moghadam, H.; Pham, Q.B. Flash-flood susceptibility mapping based on XGBoost, random forest and boosted regression trees. Geocarto Int. 2022, 37, 5479–5496. [Google Scholar] [CrossRef]
- Costache, R.; Arabameri, A.; Moayedi, H.; Pham, Q.B.; Santosh, M.; Nguyen, H.; Pandey, M.; Pham, B.T. Flash-flood potential index estimation using fuzzy logic combined with deep learning neural network, naïve Bayes, XGBoost and classification and regression tree. Geocarto Int. 2021, 37, 6780–6807. [Google Scholar] [CrossRef]
- Hosseini, F.S.; Choubin, B.; Mosavi, A.; Nabipour, N.; Shamshirband, S.; Darabi, H.; Haghighi, A.T. Flash-flood hazard assessment using ensembles and Bayesian-based machine learning models: Application of the simulated annealing feature selection method. Sci. Total Environ. 2020, 711, 135161. [Google Scholar] [CrossRef]
- Yang, K.; Hou, H.; Li, Y.; Chen, Y.; Wang, L.; Wang, P.; Hu, T. Future urban waterlogging simulation based on LULC forecast model: A case study in Haining City, China. Sustain. Cities Soc. 2022, 87, 104167. [Google Scholar] [CrossRef]
- Edel, R. Odwodnienie dróg; Wydanie 4.; Wydawnictwa Komunikacji i Łączności: Sulejówek, Poland, 2017; ISBN 978-83-206-1987-4. [Google Scholar]
- Kraków Waterworks: Wytyczne Eksploatacyjne w Zakresie Projektowania, Realizacji i Odbiorów Urządzeń i Przyłączy Wodociągowych i Kanalizacyjnych 2018. Available online: https://wodociagi.krakow.pl/admin/files/Files/dla_projektanta/WMK-Zal_nr_1_do_Zarzadzenia_nr_13_18.pdf (accessed on 31 March 2023).
- Mrowiec, M. Retencja Wód Opadowych w Obszarach Zurbanizowanych; Wydawnictwo Politechniki Częstochowskiej: Częstochowa, Poland, 2020; ISBN 9788371937545. [Google Scholar]
- Wytyczne dla Projektantów—Gdańskie Wody. Available online: https://www.gdmel.pl/dla-inwestorow/wytyczne-dla-projektantow (accessed on 31 March 2023).
- Godyń, I.; Muszyński, K.; Grela, A. Assessment of the Impact of Loss-of-Retention Fees on Green Infrastructure Investments. Water 2022, 14, 560. [Google Scholar] [CrossRef]
- Godyń, I.; Grela, A.; Stajno, D.; Tokarska, P. Sustainable Rainwater Management Concept in a Housing Estate with a Financial Feasibility Assessment and Motivational Rainwater Fee System Efficiency Analysis. Water 2020, 12, 151. [Google Scholar] [CrossRef]
- Radecki-Pawlik, A.; Wałęga, A.; Wojkowski, J.; Pijanowski, J. Runoff formation in terms of changes in land use—Msciwojów water reservoir area. J. Water Land Dev. 2014, 23, 3–10. [Google Scholar] [CrossRef]
- Liao, Y.; Zhao, H.; Jiang, Z.; Li, J.; Li, X. Identifying the risk of urban nonpoint source pollution using an index model based on impervious-pervious spatial pattern. J. Clean. Prod. 2021, 288, 125619. [Google Scholar] [CrossRef]
- Lejcuś, K.; Burszta-Adamiak, E.; Dąbrowska, J.; Wróblewska, K.; Orzeszyna, H.; Śpitalniak, M.; Misiewicz, J. Katalog Dobrych Praktyk—Zasady Zrównoważonego Gospodarowania Wodami Opadowymi Pochodzącymi z Nawierzchni Pasów Drogowych; Wydział Inżynierii Miejskiej: Wrocław, Poland, 2017. [Google Scholar]
- Municipality of Kraków. Kierunki Rozwoju i Zarządzania Terenami Zieleni w Krakowie na Lata 2019–2030; Załączniki Mapowe; Biuletyn Informacji Publicznej Miasta Krakowa—BIP MK.: Kraków, Poland, 2019; Available online: https://zzm.krakow.pl/kriztz.html (accessed on 28 April 2022).
- Państwowe Gospodarstwo Wodne Wody Polskie: Public Consultations|River Basin Management Plans. Available online: https://apgw.gov.pl/en/consultations (accessed on 28 April 2022).
- Państwowe Gospodarstwo Wodne Wody Polskie: Public Consultations|Flood Risk Management Plans. Available online: https://stoppowodzi.pl/en/category/publications/ (accessed on 28 April 2022).
- Porębska, A.; Godyń, I.; Radzicki, K.; Nachlik, E.; Rizzi, P. Built Heritage, Sustainable Development, and Natural Hazards: Flood Protection and UNESCO World Heritage Site Protection Strategies in Kraków, Poland. Sustainability 2019, 11, 4886. [Google Scholar] [CrossRef]
- MGGP & CERMED-BUD. Wielowariantowy Program Inwestycyjny wraz z Opracowaniem Strategicznej Oceny Oddziaływania na środowisko dla cieków Aglomeracji Krakowskiej z Wyłączeniem Rzeki Wisły, Kraków, Poland. 2015.
- Municipality of Kraków. Plan adaptacji Miasta Krakowa do Zmian Klimatu do Roku 2030 (MPA); Biuletyn Informacji Publicznej Miasta Krakowa—BIP MK: Kraków, Poland, 2018; Available online: https://www.bip.krakow.pl/?dok_id=114317 (accessed on 28 April 2022).
- Municipality of Kraków: Powiatowy Program Zwiększenia Lesistości Miasta Krakowa na Lata 2018–2040; Kraków, Poland. 2017. Available online: https://zzm.krakow.pl/nowe-lasy/713-przyjecie-powiatowego-programu-zwiekszenia-lesistosci-miasta-krakowa-na-lata-2018-2040.html (accessed on 28 April 2022).
- Head Office of Geodesy and Cartography(GUGiK)—Gov.pl Website. Available online: https://www.gov.pl/web/gugik-en (accessed on 29 April 2022).
- Matczak, P.; Lewandowski, J.; Choryński, A.; Szwed, M.; Kundzewicz, Z.W. Doing more while remaining the same? Flood risk governance in Poland. J. Flood Risk Manag. 2018, 11, 239–249. [Google Scholar] [CrossRef]
- Liefferink, D.; Wiering, M.; Crabbé, A.; Hegger, D. Explaining stability and change. Comparing flood risk governance in Belgium, France, the Netherlands, and Poland. J. Flood Risk Manag. 2018, 11, 281–290. [Google Scholar] [CrossRef]
- Matusik, A.; Racoń-Leja, K.; Gyurkovich, M.; Dudzic-Gyurkovich, K. Hydrourban spatial development model for a resilient inner-city: The example of Gdańsk. ACE Archit. City Environ. 2020, 15, 1–21. [Google Scholar] [CrossRef]
- WFD and FD Implementation Reports–Environment–European Commission. Available online: https://ec.europa.eu/environment/water/water-framework/impl_reports.htm (accessed on 29 April 2022).
- Muszyński, K.; Godyń, I.; Porębska, A.; Racoń-Leja, K. Koncepcja możliwości kształtowania bioretencji w zlewni Serafy z wykorzystaniem analiz przestrzennych naturalnych dróg spływu wód opadowych. Instal 2022, 7–8, 59–65. [Google Scholar] [CrossRef]


| Surface Type | Surface Incline [%] | |||||
|---|---|---|---|---|---|---|
| 0.5 | 1 | 2.5 | 5 | 7.5 | 10 | |
| Roofs | 0.85 | 0.9 | 0.96 | 0.98 | 0.99 | 1 |
| Impervious pavement | 0.7 | 0.72 | 0.75 | 0.8 | 0.85 | 0.9 |
| Typical pavement | 0.5 | 0.52 | 0.55 | 0.6 | 0.65 | 0.7 |
| Footpaths | 0.2 | 0.22 | 0.25 | 0.3 | 0.35 | 0.4 |
| Parks and gardens | 0.1 | 0.12 | 0.15 | 0.2 | 0.25 | 0.3 |
| Fields | 0.05 | 0.08 | 0.1 | 0.15 | 0.2 | 0.25 |
| Forests | 0.01 | 0.02 | 0.04 | 0.06 | 0.1 | 0.15 |
| Compact development | 0.8 | 0.82 | 0.85 | 0.9 | 0.95 | 1 |
| Loose development | 0.6 | 0.62 | 0.65 | 0.7 | 0.75 | 0.8 |
| Villa development | 0.4 | 0.42 | 0.45 | 0.5 | 0.55 | 0.6 |
Disclaimer/Publisher’s Note: The statements, opinions and data contained in all publications are solely those of the individual author(s) and contributor(s) and not of MDPI and/or the editor(s). MDPI and/or the editor(s) disclaim responsibility for any injury to people or property resulting from any ideas, methods, instructions or products referred to in the content. |
© 2023 by the authors. Licensee MDPI, Basel, Switzerland. This article is an open access article distributed under the terms and conditions of the Creative Commons Attribution (CC BY) license (https://creativecommons.org/licenses/by/4.0/).
Share and Cite
Porębska, A.; Muszyński, K.; Godyń, I.; Racoń-Leja, K. City and Water Risk: Accumulated Runoff Mapping Analysis as a Tool for Sustainable Land Use Planning. Land 2023, 12, 1345. https://doi.org/10.3390/land12071345
Porębska A, Muszyński K, Godyń I, Racoń-Leja K. City and Water Risk: Accumulated Runoff Mapping Analysis as a Tool for Sustainable Land Use Planning. Land. 2023; 12(7):1345. https://doi.org/10.3390/land12071345
Chicago/Turabian StylePorębska, Anna, Krzysztof Muszyński, Izabela Godyń, and Kinga Racoń-Leja. 2023. "City and Water Risk: Accumulated Runoff Mapping Analysis as a Tool for Sustainable Land Use Planning" Land 12, no. 7: 1345. https://doi.org/10.3390/land12071345
APA StylePorębska, A., Muszyński, K., Godyń, I., & Racoń-Leja, K. (2023). City and Water Risk: Accumulated Runoff Mapping Analysis as a Tool for Sustainable Land Use Planning. Land, 12(7), 1345. https://doi.org/10.3390/land12071345