Abstract
Nitrogen (N) is the prime essential nutrient for agricultural productivity, and its deficiency is overcome through the application of fertilizers. However, the rate of N mineralization from organic N sources is an important process to be monitored for efficient N use and sustainable agricultural management. Laboratory incubation studies were conducted for a period of 150 days to measure N mineralization (Nmin) from different organic amendments (OA) in texturally contrasting soils collected at three locations: SL1 (Bahawalpur, sandy loam), SL2 (Bahawalnagar, sandy loam), and SL3 (Rahim Yar Khan, sandy clay loam). A second study was also carried out for 25 days to monitor pH dynamics and ammonia volatilization from the same three OA-treated soils. The results showed that there was no significant difference in net Nmin between the soils for poultry manure (PMO) and feather meal (FMO), even if there was a substantial Nmin observed for PMC + FMO followed by poultry manure compost (PMC) at SL2 and SL3 soils. This might have happened due to higher microbial biomass carbon (257), nitrogen (61), fungal colonization (88 cfu g−1 soil) and enzyme activity (79) in SL3 soil receiving PMC + FMO after 150 days of incubation. However, the first-order kinetic model (R2 = 0.86–0.95) better explained the Nmin in all three soils amended with OA (PMC + FMO). The soil pH had more pronounced effects on Nmin in all three soils. A non-significant amount of ammonia volatilization was recorded regardless of the initial pH, buffering capacity, and texture variability of the soils. Further study on the particle size of OA and soil pH is warranted to determine the actual effect of OA on Nmin.
1. Introduction
Soil organic matter (SOM) represents the organic component of soil obtained from the residues of plants and animals converted by soil microorganisms through decomposition processes [1]. The SOM has direct benefits on agro-ecosystems due to the ability to affect nutrient cycling and their availability in soils, which are the most important soil characteristics to sustain crop growth and yield [2]. For these reasons, SOM is widely recognized as the core indicator of soil health that is able to promote soil fertility and quality [3]. In addition, soil organic matter represents the largest terrestrial carbon pool, and therefore, under agricultural lands, any approach oriented to improving the organic matter in the soil could be considered an environmentally-friendly strategy for limiting greenhouse gas emissions, especially carbon dioxide [4]. Under agricultural production systems, crops uptake approximately 65% of nitrogen (N), 80% of phosphorous (P), and 50% of potassium (K) from post-applied organic and inorganic sources [5,6,7]. Additionally, in all types of soils, inward flows of N and C to the soil reservoir potentially improve soil health [8]. Moreover, Nunes et al. [9] documented that soil health is a function of sink and source of C that when subjected to different cropping patterns (i.e., soil tillage, fertilization, irrigation), generate a variable C flow. Nowadays, industrialized farming systems characterized by intensive ploughing, lack of organic amendments, excessive and unbalanced use of reactive chemicals, and mineral fertilizers usually accelerate the loss of SOM [10,11]. Moreover, high soil pH associated with extremely low SOM content and insufficient soil fertility caused an undesired and significant decrease in crop productivity [12,13].
Although SOM is composed of a stable component resistant to breakdown, there are also different soil components more labile and easily subjected to the decomposition process that is available for soil microbes to consume and for plants to assimilate [14]. Based on these characteristics, it is a conceivable hypothesis that soil health must be shaped by integrating soil types and climate dynamics with agronomic management. From an agronomical view, an integrated nutrient management system (IPNMS) based on the combination of inorganic and organic sources is essential to improving nutrient availability, especially N. In addition, IPNMS improves and maintains soil health and crop productivity for the long-term period in agreement with the sustainability principles, especially in arid and semi-arid climates [15,16] where the SOM is subjected to fast mineralization compared with humid agro-environmental areas [17]. Recently, it has been reported that the application of organic amendments (OAs) in agricultural fields improved soil biodiversity, increased the availability of nutrients, and significantly reduced nutrient losses and CO2 emissions [18]. In addition, it has been noted that OAs are responsible for 78% of the variations in soil mineral N (Nmin) [17]. Although OAs could be a valuable source of N for agro-ecosystems, OAs are subjected to the decomposition process for releasing available nitrogen, and therefore a lack of available Nmin causing difficulties in the synchronization with the crop N demand could happen [19]. So, it is essential to accurately predict soil Nmin availability from the applied OAs to respond to the crop’s N needs [12]. Moreover, the mineralized SOM may be readily exported or transformed or immobilized depending upon the soil properties, type of OAs, soil initial N content, C:N ratio, soil aeration and temperatures, and soil pH and its buffering capacity [18,20,21,22]. In addition, the quality of OAs and their decomposition rate in the soil may affect the soil Nmin process and its consistency, which further may help us to predict N availability in crops [23,24]. In contrast, the difference in soil physico–chemical properties not only alters the activities of soil microbes and enzyme activities, necessary for soil Nmin, but also may affect the losses of N through different mechanisms including ammonia volatilization [25].
Currently, several previous studies have analyzed the factors and the dynamics that affect the decomposition process of OAs and their stabilization as soil organic C (Corg), even if these limiting factors have been studied separately [9], leaving a gap of knowledge between the decomposition of OAs and the pool up of Corg [8]. Therefore, combined investigations are required to understand how to manage OAs application and Corg in response to farming practices and climate change [26]. The theoretical and empirical formulas would help to bridge the gap between the decomposition rates of OAs and SOM formation associated with N availability [19]. Such an empirical conceptualization is important to determine the role of OAs in soil which is steadily stabilized in the Corg as microbial necromass (MN), i.e., in microbial biomass C (MBC), and availability of nutrients associated with the SOM [27]. Additionally, the MN is considered a significant proportion of SOC which has short- and long-term effects on SOC lability and stabilization [28].
The difference in soil texture could change the temporal availability of soil mineral N (NO3-N and NH4-N) regardless of the differences in soil physico–chemical conditions [24]. Indeed, it has also been observed reduced N volatilization in the sandy soils when compared to clay and silty soils, probably due to the greater soil macropores, typical of the sandy soil that favored the activities of aerobic micro-organisms that are generally associated with the mineralization of organic matter determining an increase of soil Nmin content in the sandy soils [29]. In addition, the degrees of SOM lability are more protected by the clays and polyvalent cations especially Ca during decomposition [17]. However, a strong correlation between the ammonia volatilization and the soil physico–chemical properties, i.e., initial pH, SBC, SOM, cation exchange capacity (CEC), and initial N availability was observed from N fertilization [12,18]. Moreover, the CEC and SOM contents may bind the excess NH4-N in the soils and thus reduce the losses [24] while the initial pH and SBC moderate the NO3-N and NH4-N equilibrium in the soil ecosystems [30]. It was observed that the process of ammonification was increased just after the addition of OAs through the consumption of more H+ resulted in higher soil pH, while in contrast, nitrification decreased the soil pH via the production of two H+ by the formation of each NO3-N mole [31]. Thus, it is necessary to determine the synchronization of mineralized N and N availability to crops in the soil solution. This study hypothesized that soil texture significantly affects the mineralization rate of N content in different organic amendments and its ammonia volatilization, therefore, we determine different levels of nitrogen availability during the crop growth stage. The main goals of this study were to: (1) estimate the Nmin from different OAs in texturally different soils, (2) determine the kinetics of mineralized N in different soils through a long-term incubation study, and (3) investigate the impact of soil pH on Nmin and the ammonia volatilization from OAs in a short-term incubation study.
2. Materials and Methods
2.1. Soil Sampling and Analysis
Texturally contrasting soils were collected at 0–20 cm from three locations: SL1 (Bahawalpur, sandy loam), SL2 (Bahawalnagar, sandy loam), and SL3 (Rahim Yar Khan, sandy clay loam) near the Cholistan desert (Pakistan). The soil characteristics at the beginning of the experiment are reported in Table 1. Historical climatic data based on the data of the last 50 years of the sites show a mean annual rainfall of 94.5, 96.4 and 97.2 mm in SL1, SL2 and SL3, respectively, maximum summer annual temperature was 34.5, 32.5 and 33.6 °C while minimum winter temperature was of 15.2, 14.1, and 14.5 °C in SL1, SL2 and SL3, respectively. The relative humidity data showed values of 45, 47, and 43% in SL1, SL2 and SL3, respectively.

Table 1.
Soil characteristics before the start of experiment.
Soil samples were randomly collected from each selected site under typically cultivated fields in order to be representative of the agricultural systems of the area based on poor nutrient management, especially for N. The collected soils were air-dried under shade at room temperature (~25 °C), then soil samples were ground with a porcelain mortar and pestle, 2-mm sieved, and stored in plastic jars until analysis. The soil texture was recorded by following the method of Gee and Bauder [32]. Soil particle size was determined by following the standard hydrometer method [32] and the pH (1:1) was measured using 0.01 M CaCl2 [33]. Soil organic C and N were determined by dry combustion analysis [34,35,36] while the total P and other nutrients were measured using a colorimeter and atomic absorption spectrophotometry after digestion with a mixture of 2:1 perchloric acid-nitric acid digestion. Soil pH buffering capacity was determined by titration [37].
2.2. Chemical Characteristics of Organic Fertilizers
Poultry manure (PM) was collected from a layered poultry farm typically used by the farmers of the area, while the poultry manure compost (PMC) was purchased from the local market. The organic fertilizers were analyzed for water contents, pH, elemental composition (P, K, Ca, Mg, Mn, Fe, Cu, Zn, B, S and Na), total N and C, inorganic N and water-soluble P by following the same method as was used for the soil analysis (Table 2). The gravimetric water contents of the fertilizers were measured by putting the organic fertilizers (OF) samples in a hot air oven at 65 °C for 48 h (4 replications per OF). For inorganic N analysis, N contents were measured through the KCl method (1 mol L−1 in a ratio of 1:200, 4 replications per OF). Shaking of the sample mixture was performed for 30 min and then centrifuged for 30 min. The mixture was filtered at 0.45 µm. The filtrate analysis for NO3-N and NH4-N was conducted [36,38].
Table 2.
Analysis of poultry manure (PM), poultry manure compost (PMC) and feather meal (FM).
2.3. Experimental Design
A 3 × 5 factorial incubation experiment was arranged in a completely randomized design. The treatments were comprised of control (CT; for soils only), poultry manure original (PMO), poultry manure compost (PMC), PMO + feather meal (10%; PMO + FMO), PMC + feather meal (10%; PMC + FMO) and feather meals only. The experimental treatments were replicated four times.
2.3.1. Long-Term Incubation Study-N Mineralization
A 150-day lab incubation experiment was carried out using the 900-mL plastic tubes to evaluate Nmin kinetics from the organic amendments and including the control soils. The soils were pre-incubated for 5 weeks and rewetted with 40% field moisture capacity (FC) based on soil textural variability to minimize the variability in the initial Nmin flush due to resettling and readjusting of microbial activity [39]. As per treatment combinations, a sample of 300 g soil was added to each tube and incorporated with OAs to provide the expected 250 mg kg−1 total N (considering 50% of total N is mineralization at the end of the experiment i.e., 150 days [40]. All tubes were opened twice weekly for aeration. To measure the Nmin, a 5-g soil sample was collected at 1, 5, 10, 20, 40, 80, and 150 days of incubation from each replication followed by extraction with 40 mL of 1 M KCl, filtered through Whatman filter paper (No. 42), and then processed for determination of NH4-N and NO3-N. The experiment was performed at room temperature.
Kinetics of N Mineralization
Cumulative N mineralization (Cum. Nmin.) from the control soils (unamended; unamd.) and OAs treatments were calculated by using the following equations:
It is denoted as sampling time (days) and inorganic N (t = 0) is represented as the inorganic N concentration in the soil at the start of the experiment [time (day) = 0]. Net N mineralization either in control soils or organic fertilizer treatments was shown by mass (mg N kg−1 soil, g N kg−1 OAs materials) or then expressed in percentage (%) of nitrogen applied with the fertilizer. However, net N mineralization from the unamended soils showed a linear relationship, so using the PROC REG (SAS, Cary, NC, USA, 2016) will fit the zero-order kinetics of the individual soils and the following model was used:
where, K(linear) (mg kg−1d−1) is the mineralization rate coefficient and t is the time (days). Cumulative net N mineralization from the OAs treatments followed the first-order kinetic model. By using the modified R2, goodness of fit is determined and important differences (p ≤ 0.05) between the fitted soil slopes and intercepts are estimated by using PROC GLM (SAS, 2016). The kinetics model of first order was matched with the cumulative net nitrogen mineralized from the fertilizers:
Here in Equation (4), N0 is denoted as the pool of mineralizable N in the applied organic fertilizers, t is the time (days) and k is denoted as the rate of constant mineralization (d−1). In SAS (SAS, 2016), the model PROC NLIN in SAS (SAS, 2016) was applied to calculate the individual N0 and k values of OM from each soil [41].
where Res. SS is the residual sum of the square, Cor. SS corrected the sum of square.
Microbial Biomass Carbon and Nitrogen
The microbial biomasses i.e., carbon (MBC) and nitrogen (MBN) was determined by following the fumigation extraction method by taking the soil samples after 10, 40 and 150-days of incubation [42,43]. The soil samples i.e., 5 g each for MBC and MBN was taken into perti plates after the three different time periods. These samples were placed into a vacuum desiccator after adding the ethyl chloride (CHCl3; 25 mL; 24 h; 25 °C) for the fumigation process. To remove the extra fumes, the soil samples were put into a hot water bath at 80 °C. Then the C and N contents were extracted with the help of the potassium sulphate solution (K2SO4; 20 mL; 0.5 M) from both the fumigated and non-fumigated soil samples. The extractant was shaken well on the shaker for 30 min and passed through the Whatman filter paper no 42. Both MBC and MBN was determined the following the given equation.
where TCfu and TCnfu indicated the total carbon (TC) in the fumigated and non-fumigated soil samples whereas TNfu and TNnfu were the total nitrogen (TN) in the fumigated and non-fumigated soil samples, respectively. KEC was the coefficient for the MBC (value of KEC is 0.45) determination [44] and KEN was the coefficient for the MBN (value of KEN is 0.54) measurement [45].
Fungal Colonization
The fungal spores were isolated from the soil samples after 10, 40, and 150 days of incubation by following the method of Gerdemann and Nicolson [46]. The colony-forming unit method (CFU) was used to determine the fungal colonization (MS medium) in the rhizosphere soil. The fungal colonization was determined by using the following formula:
Colony forming unit (cfu g−1 soil) = (No. of colonies × dilution factor)/Vol of inoculum
Enzyme Activities
The soil enzymes, i.e., leucine-aminopeptidase (LAP, N-acquiring enzyme) and N-Acetyl-glucosaminidase (NAG, N-acquiring enzyme) were measured by following the method of DeForest [47]. Generally, it has been considered that soil biological and soil microbial activities resulted in active enzyme activities and are indicators of the soil microbial nutrient intake [48]. To determine, the soil enzyme activities after the specific time periods i.e., 10, 40, and 150 days, the soil samples i.e., 1.0 g were added into sodium acetate buffer solution (50 mM; C2H3NaO2). The soil substrate was incubated in the dark for 4 h (25 °C). The microplate reader was used to determine the enzyme activities in the soil samples.
2.3.2. Short-Term Incubation Study-NH4+ Volatilization
A short-term incubation study of 25 days was performed to determine the NH4-N, NO3-N and soil pH changes in response to OAs. The experiment was set up similar to the long-term experiment as described above. All tubes were opened twice for aeration in a week while the water contents were maintained by weight. Volatile NH4+ from the treatments and soil was captured by placing 40 mL H2SO4 traps (0.05 mol L−1) placed in the tubes [39] and H2SO4 traps were replaced at 3, 10, 15, and 25 days to allow more NH4+-N accumulation. Moreover, to determine the inorganic N and pH of the OAs treated soils and control soil, a 5-g soil sample was taken from the soil of the jars during the NH4+-N trap change process. Briefly, the first inorganic N was determined by adding 10 mL of deionized H2O and 40 mL of 2 M KCl into the soil sample, and inorganic N was measured as discussed above [36,38]. For pH measurement, 10 mL of deionized water was added to the soil sample (1:2 soil/water) and then the pH was determined.
2.4. Statistical Analysis
The analysis of all OAs treatments was conducted by using the PROC MIXED in SAS (SAS, 2016) by keeping OAs as fixed effects, incubation time (days) as repeated measures and replications (3 or 4) as random effects. Moreover, Tukey’s HSD was used for multiple comparisons (p = 0.05) of inorganic N mineralization from the control soils (unamended) and different OAs at different extraction times (days). However, to determine the analysis of variance, incubation data of 150 days was analyzed with the help of PROC GLM, while the analysis of treatment means was conducted by using Fisher LSD (p ≤ 0.05).
3. Results
3.1. Net Nitrogen Mineralization
During the incubation period, the level of Nmin from different OAs showed a significant difference across the soils over the whole study time (Table 3; p < 0.001). In general, Figure 1 shows that the significant effect of soils as a factor changed after 5-d (Nmin and Norg, p > 0.05) as compared to soil amendments where it changed at a much faster rate (5 days of incubation). The values were at the peak between 34–40 days in the case of soil SL2 and SL3 and after 26 days in the case of SL1 and then started to decline (Figure 1). A sharp decline in net N mineralization was recorded in SL1 as compared to SL2 and SL3. A steep slope is observed in SL3 during the whole incubation period (Figure 1). Moreover, rapid and sustainable cumulative net N mineralization was noted in the PMC + FMO treatments was 50–62% of applied N in all three soils (Table 3 and Table S1). Although, the sole PM application provided the rapid N through mineralization among the OAs during the first two weeks then decreased significantly. On the other hand, FMO treatments showed the lowest net N mineralization among all-other treatments during the whole duration of incubation (Table S1). Surprisingly, it was observed during the study that PMC and PMO + FMO treatments were not significantly different from each other for the release of N from the OAs. In the control treatments, the net N mineralization ranged from 9.69 to 18.84 g kg−1 (p ≤ 0.001) (Table 3). In addition, the net N mineralization was maximum (up to 51–64%) of applied N in the first 40-d for all three soils then decreased (Figure 1). In FMO treatments, no significant difference at p > 0.05 was noted in the SL1 and SL2 soils in the 150 days incubation experiment with maximum N mineralization of 31.68 g N kg−1 (SL2; 62% of total N applied; Figure 1). Moreover, a delay in net N mineralization was observed in SL3 (Rahim Yar Khan Soils) from the start (0-d) of the experiment till 12-d incubation (Table 3 and Figure 1).
Table 3.
Cumulative net N mineralized after 150-d incubation under different treatments.
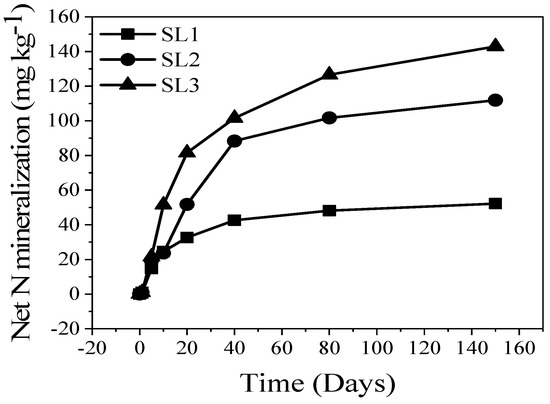
Figure 1.
Net nitrogen mineralization (mg kg−1 soil) from the three different soils incubated for 150-d. Abbreviations are SL1 (Bahawalpur soil), SL2 (Bahawalnagar), and SL3 (Rahim yar khan).
3.2. Kinetics of N Mineralization
The minimum concentration of cumulative net N mineralization after the 150-d incubation experiment ranged from 9.69 to 61.49 mg N kg−1 at SL1 (Bahawalpur) (p > 0.01) (Table 3). The location SL3 (Rahim Yar Khan) had the maximum concentration of cumulative N mineralization among the other two locations i.e., SL1 and SL2. Moreover, the linear model fits well to the data, indicating that it is fit well without intercept showing R2 greater than 0.95 for two soil locations (SL2 and SL3) except the SL1 which had R2 = 0.60 (p > 0.05) (Table 4). All slopes for different soil locations (linear/zero-order model constant) were statistically different among themselves (p > 0.05). The data reported in Figure 2A indicated that the rapid N mineralization was observed in the PMO that is statistically similar to FMO as compared to all other OAs i.e., PMC, PMO + FMO, and PMC + FMO during the first 36 days of incubation (Figure 2B–D). By day 36, the amount of N-mineralization ranged from 65–78%; 55–63%; 51–53%; 48–52%, and 42–45% of the applied N for FMO, PMO, PMC; PMO + FMO and PMC + FMO, respectively in all three soils. It is worth noting that application of FMO delayed the N mineralization in all three soils up to the first 12-d but somehow, that effect was reduced by the PMC amendments where the N mineralization was 35–43% in the first 25-d of incubation. Overall, the data showed that steadily N mineralization was noted in the PMC + FMO treatments in all three soils and as compared to all other organic amendments. Moreover, no significant difference was observed in the first 27-d of the study among all three soils with average net N mineralization of 96 g N kg−1 (45% of the applied N; Figure 2).
Table 4.
Fit individual treatments for net N mineralized from the control (unamended) soils and applied organic amendments.
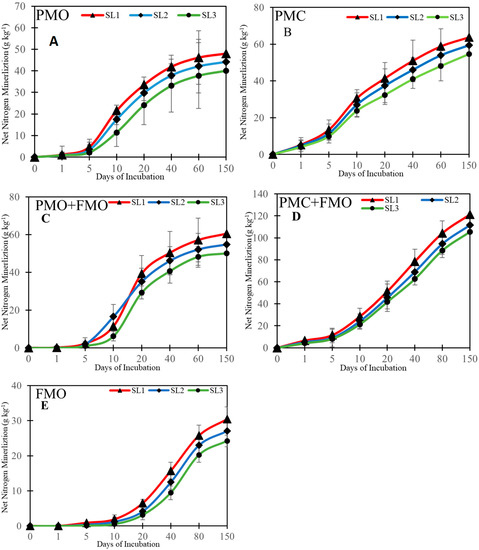
Figure 2.
Net nitrogen mineralization (g kg−1 material) from different organic amendments i.e., PMO (A); PMC (B); PMO + FMO (C); PMC + FMO (D) and FMO (E) after 150-d incubation in three different soils (SL1, Sl2 and SL3). Data in the graph is the first-order regression and error bars in the standard deviation. Abbreviations are SL1 (Bahawalpur soil), SL2 (Bahawalnagar), SL3 (Rahim yar khan), CT; control (unamended soil), PMO; poultry manure original, PMC; poultry manure compost, PMO + FMO; poultry manure original + feather meal original, PMC + FMO; poultry manure compost + feather meal original and FMO; feather meal original. Error bars indicated the standard deviation.
3.3. Soil Microbial Biomass Carbon and Nitrogen
The soil MBC and MBN contents varied significantly among the soils and organic amendments after incubation (Table 5). PMC + FMO amended soil exhibited the highest MBC content among the three soil types with 256.79 mg kg−1 in SL3 (Rahim Yar Khan soil), 218.43 mg kg−1 in SL2 (Bahawalnagar soil) and 201.23 mg kg−1 in SL1 (Bahawalpur soil) at 150 d incubation period. The contents of MBN showed a similar trend to that recorded for MBC (Table 6). Greater MBN was found in the SL3 (Rahim Yar Khan soil) with a value of 61.35 mg kg−1 followed by SL2 (Bahawalnagar soil) and SL1 (Bahawalpur soil) with values of 44.25 mg kg−1 and 31.78 mg kg−1, respectively, treated with PMC + FMO after 150 d of incubation.
Table 5.
Effect of organic amendments on soil microbial biomass carbon at 10-d, 40-d and 150-d of incubation study.
Table 6.
Effect of organic amendments on soil microbial biomass nitrogen at 10-d, 40-d and 150-d of incubation study.
3.4. Fungal Colonization and Enzyme Activities
Similar to the changes in MBC and MBN contents, fungal colonization and enzyme activities were larger and more heterogeneous in all the three amended soils than in the control over incubation period (Table 7 and Table 8). The fungal colonization was the largest in soil amended with PMC + FMO across all incubation periods. Maximum fungal colonization (88.98 cfu g−1 soil) was detected in SL3 (Rahim Yar Khan soil) followed by SL2 (Bahawalnagar soil) and SL1 (Bahawalpur soil) under an incubation period of 150 days (Table 7). Compared with the control treatment the enzyme activities were the highest of all other treatments in all three soils. Across all three soils the highest enzyme activities were detected in SL3 (Rahim Yar Khan soil) (79.35 nmol h−1g−1) followed by SL2 (Bahawalnagar soil; 38.66 nmol h−1g−1) and SL1 (Bahawalpur soil; 34.05 nmol h−1g−1) under incubation period of 150 days with application of PMC + FMO (Table 8).
Table 7.
Effect of organic amendments on fungal colonization at 10-d, 40-d and 150-d of incubation study.
Table 8.
Effect of organic amendments on soil enzyme activities at 10-d, 40-d, and 150-d of incubation study.
3.5. Ammonia Volatilization in Short-Term Incubation Experiment
Results indicated that a significant amount of ammonia losses (NH4-N) were recorded from all organic matter amendments or soils or their combinations in a short-term 24-day incubation experiment (Figure 3). It was noted that the NH4-N losses were dependent on the pH and the production of NO3-N. Significant NH4-N losses were noted coinciding with relatively high pH and NH4-N concentrations recorded in SL1 and SL2 soils. Overall, during the short-term incubation, soil pH was decreased with the increase in the production of NH4-N while the pH was increased with the increased production of NO3-N. Additionally, soil pH rapidly jumped to 8.94 in the SL1 with the amendment of FMO and resulting in the production of the NH4-N of 54.29 mg kg−1 of soil. The current study indicated that the rapid decrease in soil pH or soil pH buffering capacity of the SL1 was solely dependent on any change in the inorganic N speciation in the soil along with incubation duration. Moreover, the pH was increased in both FMO and PMO treatments, but the timing was quite different. In the case of FMO, the maximum pH was reached in 4-d, but it was 9-d in the case of PMO (Figure 3).
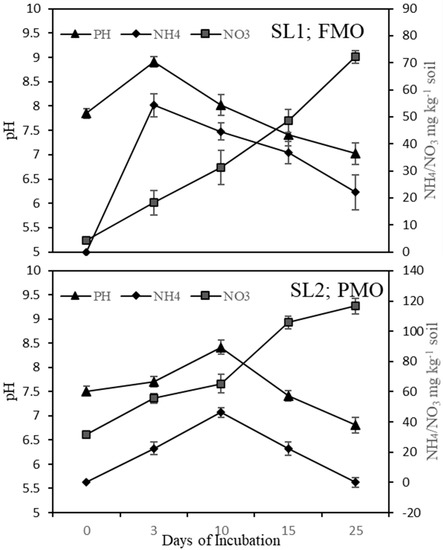
Figure 3.
Effect of organic amendments on the ammonia (NH4+-N), nitrate, and pH during the incubation study (250 d). Error bars indicated the standard deviation. Abbreviations are SL1 (Bahawalpur soil), SL2 (Bahawalnagar), PMO; poultry manure original, and FMO; feather meal original. Error bars indicated the standard deviation.
4. Discussion
4.1. Long-Term Incubation Study
The application of OAs significantly increased the Nmin (NH4-N and NO3-N), and that increase positively coincided with the increased Nmin, soil texture, and C/N ratios since the beginning of the incubation period. Three types of soils, used during the current study, significantly affected the rate of Nmin. The C/N ratios of the organic amendments played a vital role in N transformation. The results reinforced the role of C/N ratios that affected the metabolic activities of soil microbial and fungal communities in the all-soil texture towards the release of mineral forms of N [20], hence various concentrations of Nmin were observed during the incubation study [19]. The results are in agreement with the findings of Bonanomi et al. [31] that observed how organic amendment characterized by low C/N ratios resulted in easily accessible and highly available C to soil microbes. Therefore, the C/N ratios of organic materials could be a valuable indicator to predict soil N availability. Moreover, the current study also confirmed that the activities of soil biota were controlled by the water-holding capability of the soil. Specifically, the SL1 site had more sand particles and poor water holding capacity which is why it had a robust and short duration Nmin flush compared to the other soils from SL2 and SL3 sites, respectively. Similarly, Pinto et al. [49] reported that less moisture and early warmer temperature of soil enhanced the Nmin process. The peak of Nmin was achieved earlier in SL1 followed by SL2 and then in SL3. As far as OAs were concerned, the significant difference in N release (both Nmin and Norg) was recorded in 14–35 days of incubation (p < 0.05) and then progressively stabilize over the incubation duration. More sustainable Nmin was recorded in the PMC + FMO in all types of soils as the incubation days progressed [19]. It was also seen during the study that the level of organic Nitrogen (Norg) in the soil suppressed the growth of microbiomes and might also suppress the Nmin during the incubation duration (150-d) [12]. Furthermore, the results have shown soil texture (soil particles) and soil inorganic N modified the N release pattern (Nmin) from the different applied organic matter.
The slower/constant release of N (Nmin) from SL3 as compared to SL1 and SL2 observed in the current study could be due to the delayed growth of microbial biomass (MB). The growth of MB is usually considerably increased when the OAs are added to any kind of soil [24]. Although the SL1 had a robust increase in MB at the beginning of the incubation period, the MB population decreased consistently after 24-d to the basal level, probably due to limited soil conditions, i.e., soil moisture and C level that hindered the MB growth [27]. However, it is noted that the higher clay contents, as observed in the soil coming from the SL3 site, would be the possible reason for the slow and lower N transformation (Table 2 and Figure 2), but this slow release would not decrease the crop growth and development, resulting in N availability from mineralization aligned and N needs of the crop [50]. The current study results are in contrast with Li et al. [51], who experimented on the C-rich organic amendments in contrasting soil textures. They reported that MB was increased only in the organic amendments and not in the different soil textures. The fungal growth was also increased in the fine-textured soil over coarse textured soil (Table 7). Moreover, the soil enzyme activities were much higher in SL3, followed by SL2 and SL1 (Table 8), which is a better indication of microbial activation and healthy fungal activities in the fine textured soil. It would increase the Nmin and hence, the sustainable N release from the soil [52]. Better enzyme concentrations (Table 8) were noted in the SL3 than in the other soil indicating handsome microbial activities [53]. The PMC + FMO is noted as much more consistent with the fungal growth and microbial system that indicated that healthy soil microbiomes existed in the SL3 than in the other two soils.
The organic amendments behaved differently in all three soils during the incubation duration. The observed difference in Nmin from PMC + FMO to FMO or PMO in the SL3 or SL2 or SL1 might be due to the difference in the particle size of the OAs that ultimately resulted in less Nmin [20]. Moreover, the PMC and FMO had a particle size of around or less than 1 mm while the others, i.e., PMO had varying particle sizes between 2 to 5 mm. The clay particles offer physical protection in the soil through physico–chemical binding processes which allowed the clay particles (in SL3) to interact more precisely with OAs compared to large particle sizes as in SL1 or SL2. The measured Nmin data fit well with the kinetic model and the calculated parameters i.e., N0 and K. The values of calculated parameters in the current study were lower than the previous studies. Cassity-Duffey, Cabrera, Franklin, Gaskin and Kissel [19] reported that for feather meals, the N0 date indicated 31% of the applied organic N to the soils. However, in the case of our study, N0 represented 18% and 24% for fine and coarse texture soil respectively. That might be the due to difference in the prevailing soil and environmental conditions and initial Norg speciation.
4.2. Short-Term Incubation Study (25-d)
The present study results of the short-term incubation study (25-d) were directed by pH in all three soils i.e., SL1, SL2 and SL3. It was noted that the pH was increased as the production of NH4-N tends to rise, but in the case of NO3-N production, this phenomenon was reversed and resulted in a rapid decrease in pH (Figure 3). The NO3-N losses were expected from the organic amendments added to fine-textured soil (SL3) [22] whereases some anticipated losses from PMO addition to coarse-textured soil (SL1) that would be due to high sand contents, low pH buffering capacity, and low initial organic content [54]. Additionally, the significant speciation of Norg might also have contributed to the rapid changes in the soil pH [12]. However, it was seen that the addition of PMO to SL2 relatively delayed the ammonification as compared to other organic amendments while the levels of NO3-N remained stagnant until the pH increased to 7.3 at 12-d during the incubation periods [16]. The results of the short-term incubation study directed that the rate of Nmin from OAs was heavenly dependent on the dynamics of soil pH and ammonium/nitrate [20].
5. Conclusions
The Net Nmin from all OAs in all three soils ranged from 9 to 62 Ninorg kg−1 soil in 150-d incubation study which would be the larger part of plant-available N and it was dependent on the soil physico–chemical properties and N speciation. Moreover, a smaller portion of Nmin was observed in PMC + FMO in SL3 (21% clay) compared to the other two soils i.e., SL1 and SL2 (9–15% clay), such clay particle effect was not seen with PMO which had cooperatively larger particle size. Thus, the present study results suggest that further study is required on the effect of the particle sizes of OAs on the Nmin kinetics and further the protective role of clay particles over the N transformation (NH4-N and NO3-N). Our results about the dynamic Nmin suggest that the role of pH towards N dynamics in the soils was more dominant than the texture of the soil in all three soils used in the incubation study. Future research on the role of pH in the soil would be warranted, as the role of pH was dominant in the release of N in the soils.
Supplementary Materials
The following supporting information can be downloaded at: https://www.mdpi.com/article/10.3390/land12050989/s1, Table S1: Two-way ANOVA analysis with soil type and soil amendments and their interaction on net mineralization (Nmin) and percentage organic N mineralization (%Norg) during the incubation periods.
Author Contributions
Conceptualization, H.M.R.J. and M.A.; methodology, N.K.; software, H.M.R.J.; validation, I.A., A.J. and A.Z.; formal analysis, H.M.R.J.; investigation, H.M.R.J. and R.Q.; resources, H.A., data curation, R.J.; writing—original draft preparation, H.M.R.J.; writing—review and editing, I.A., A.J., E.R. and R.M.; visualization, E.R.; supervision, I.A.; project administration, I.A.; funding acquisition, E.R. and A.J. All authors have read and agreed to the published version of the manuscript.
Funding
This research received no external funding.
Data Availability Statement
Not applicable.
Acknowledgments
We want to thank the Higher Education Commission (HEC) for their research funding to conduct this study and analysis. We all also want to thank COMSATS University Islamabad, Vehari Campus, Vehari for its significant assistance in the conduction of experimentation and sample processing.
Conflicts of Interest
The authors declare no conflict of interest.
References
- Powlson, D.S.; Hirsch, P.R.; Brookes, P.C. The role of soil microorganisms in soil organic matter conservation in the tropics. Nutr. Cycl. Agroecosyst. 2001, 61, 41–51. [Google Scholar] [CrossRef]
- Lal, R. Challenges and opportunities in soil organic matter research. Eur. J. Soil Sci. 2009, 60, 158–169. [Google Scholar] [CrossRef]
- Veum, K.S.; Goyne, K.W.; Kremer, R.J.; Miles, R.J.; Sudduth, K.A. Biological indicators of soil quality and soil organic matter characteristics in an agricultural management continuum. Biogeochemistry 2014, 117, 81–99. [Google Scholar] [CrossRef]
- Scharlemann, J.P.; Tanner, E.V.; Hiederer, R.; Kapos, V. Global soil carbon: Understanding and managing the largest terrestrial carbon pool. Carbon Manag. 2014, 5, 81–91. [Google Scholar] [CrossRef]
- Bünemann, E.K.; Bongiorno, G.; Bai, Z.; Creamer, R.E.; De Deyn, G.; de Goede, R.; Fleskens, L.; Geissen, V.; Kuyper, T.W.; Mäder, P. Soil quality–A critical review. Soil Biol. Biochem. 2018, 120, 105–125. [Google Scholar] [CrossRef]
- Amsili, J.P.; Van Es, H.M.; Schindelbeck, R.R. Cropping system and soil texture shape soil health outcomes and scoring functions. Soil Secur. 2021, 4, 100012. [Google Scholar] [CrossRef]
- Magdoff, F.; Van Es, H. Building Soils for Better Crops; Sustainable Agriculture Network Beltsville: Beltsville, MD, USA, 2000. [Google Scholar]
- Liang, X.; He, J.; Zhang, F.; Shen, Q.; Wu, J.; Young, I.M.; O’donnell, A.G.; Wang, L.; Wang, E.; Hill, J. Healthy soils for sustainable food production and environmental quality. Front. Agric. Sci. Eng. 2020, 7, 347–355. [Google Scholar] [CrossRef]
- Nunes, M.R.; van Es, H.M.; Veum, K.S.; Amsili, J.P.; Karlen, D.L. Anthropogenic and inherent effects on soil organic carbon across the US. Sustainability 2020, 12, 5695. [Google Scholar] [CrossRef]
- Fahad, S.; Sönmez, O.; Saud, S.; Wang, D.; Wu, C.; Adnan, M.; Turan, V. (Eds.) Soil Biodiversity and Climate Change. In Sustainable Soil and Land Management and Climate Change, 1st ed.; CRC Press: Boca Raton, FL, USA, 2021; Volume 1, pp. 113–125. [Google Scholar]
- Javeed, H.M.R.; Iqbal, N.; Ali, M.; Masood, N. Agriculture Contribution toward Global Warming. In Climate Change and Plants: Biodiversity, Growth and Interactions; CRC Press: Boca Raton, FL, USA, 2021. [Google Scholar]
- Javeed, H.M.R.; Ali, M.; Qamar, R.; Shehzad, M.; Haseebur, R.; Nawaz, F.; Jamil, M.; Ahmad, A.; Farooq, A.; Masood, N.; et al. Effect of Date Biochar Pyrolyzed at Different Temperature on Physiochemical Properties of Sandy Soil and Wheat Crop Response. Commun. Soil Sci. Plant Anal. 2021, 52, 2110–2124. [Google Scholar] [CrossRef]
- Qamar, R.; Rehman, A.U.; Javeed, H.M.R.; REHMAN, A.; Safdar, M.E.; ALI, H.; Ahmad, S. Tillage Systems Affecting Rice-Wheat Cropping System (Sistem Pembajakan Mempengaruhi Sistem Tanaman Padi-Gandum). Sains Malays. 2021, 50, 1543–1562. [Google Scholar] [CrossRef]
- Cotrufo, M.F.; Lavallee, J.M. Soil organic matter formation, persistence, and functioning: A synthesis of current understanding to inform its conservation and regeneration. Adv. Agron. 2022, 172, 1–66. [Google Scholar]
- Oldfield, T.L.; Sikirica, N.; Mondini, C.; Lopez, G.; Kuikman, P.J.; Holden, N.M. Biochar, compost and biochar-compost blend as options to recover nutrients and sequester carbon. J. Environ. Manag. 2018, 218, 465–476. [Google Scholar] [CrossRef] [PubMed]
- Javeed, H.M.R.; Qamar, R.; Rehman, A.U.; Ali, M.; Rehman, A.; Farooq, M.; Zamir, S.I.; Nadeem, M.; Cheema, M.A.; Shehzad, M.; et al. Improvement in Soil Characteristics of Sandy Loam Soil and Grain Quality of Spring Maize by Using Phosphorus Solublizing Bacteria. Sustainability 2019, 11, 7049. [Google Scholar] [CrossRef]
- Soinne, H.; Keskinen, R.; Räty, M.; Kanerva, S.; Turtola, E.; Kaseva, J.; Nuutinen, V.; Simojoki, A.; Salo, T. Soil organic carbon and clay content as deciding factors for net nitrogen mineralization and cereal yields in boreal mineral soils. Eur. J. Soil Sci. 2021, 72, 1497–1512. [Google Scholar] [CrossRef]
- Amoakwah, E.; Arthur, E.; Frimpong, K.A.; Parikh, S.J.; Islam, R. Soil organic carbon storage and quality are impacted by corn cob biochar application on a tropical sandy loam. J. Soils Sediments 2020, 20, 1960–1969. [Google Scholar] [CrossRef]
- Cassity-Duffey, K.; Cabrera, M.; Franklin, D.; Gaskin, J.; Kissel, D. Effect of soil texture on nitrogen mineralization from organic fertilizers in four common southeastern soils. Soil Sci. Soc. Am. J. 2020, 84, 534–542. [Google Scholar] [CrossRef]
- Bonanomi, G.; De Filippis, F.; Zotti, M.; Idbella, M.; Cesarano, G.; Al-Rowaily, S.; Abd-ElGawad, A.J.A.S.E. Repeated applications of organic amendments promote beneficial microbiota, improve soil fertility and increase crop yield. Appl. Soil Ecol. 2020, 156, 103714. [Google Scholar] [CrossRef]
- DeLuca, T.H.; Gao, S. Use of Biochar in Organic Farming. In Organic Farming; Springer: Berlin/Heidelberg, Germany, 2019; pp. 25–49. [Google Scholar]
- Jien, S.H.; Chen, W.C.; Ok, Y.S.; Awad, Y.M.; Liao, C.S. Short-term biochar application induced variations in C and N mineralization in a compost-amended tropical soil. Environ. Sci. Pollut. Res. 2018, 25, 25715–25725. [Google Scholar] [CrossRef] [PubMed]
- Lamptey, S.; Xie, J.; Li, L.; Coulter, J.A.; Jagadabhi, P.S. Influence of Organic Amendment on Soil Respiration and Maize Productivity in a Semi-Arid Environment. Agronomy 2019, 9, 611. [Google Scholar] [CrossRef]
- Levavasseur, F.; Lashermes, G.; Mary, B.; Morvan, T.; Nicolardot, B.; Parnaudeau, V.; Thuriès, L.; Houot, S. Quantifying and simulating carbon and nitrogen mineralization from diverse exogenous organic matters. Soil Use Manag. 2021, 38, 411–425. [Google Scholar] [CrossRef]
- Yu, H.; Xie, B.; Khan, R.; Shen, G. The changes in carbon, nitrogen components and humic substances during organic-inorganic aerobic co-composting. Bioresour. Technol. 2019, 271, 228–235. [Google Scholar] [CrossRef]
- Kopittke, P.M.; Dalal, R.C.; Hoeschen, C.; Li, C.; Menzies, N.W.; Mueller, C.W. Soil organic matter is stabilized by organo-mineral associations through two key processes: The role of the carbon to nitrogen ratio. Geoderma 2020, 357, 113974. [Google Scholar] [CrossRef]
- Angst, G.; Mueller, K.E.; Nierop, K.G.; Simpson, M.J. Plant-or microbial-derived? A review on the molecular composition of stabilized soil organic matter. Soil Biol. Biochem. 2021, 156, 108189. [Google Scholar] [CrossRef]
- Kallenbach, C.M.; Frey, S.D.; Grandy, A.S. Direct evidence for microbial-derived soil organic matter formation and its ecophysiological controls. Nat. Commun. 2016, 7, 13630. [Google Scholar] [CrossRef]
- de Jesus Duarte, S.; Glaser, B.; Paiva de Lima, R.; Pelegrino Cerri, C. Chemical, Physical, and Hydraulic Properties as Affected by One Year of Miscanthus Biochar Interaction with Sandy and Loamy Tropical Soils. Soil Syst. 2019, 3, 24. [Google Scholar] [CrossRef]
- Gavili, E.; Moosavi, A.A.; Moradi Choghamarani, F. Cattle manure biochar potential for ameliorating soil physical characteristics and spinach response under drought. Arch. Agron. Soil Sci. 2018, 64, 1714–1727. [Google Scholar] [CrossRef]
- Bonanomi, G.; Sarker, T.C.; Zotti, M.; Cesarano, G.; Allevato, E.; Mazzoleni, S. Predicting nitrogen mineralization from organic amendments: Beyond C/N ratio by 13 C-CPMAS NMR approach. Plant Soil 2019, 441, 129–146. [Google Scholar] [CrossRef]
- Gee, G.W.; Bauder, J.W. Particle-size analysis, In Methods Soil Anal. Part 1, Physical and Mineralogical Methods, 2nd ed.; Klute, A., Ed.; John Wiley & Sons, Inc.: Hoboken, NJ, USA, 1986; pp. 383–411. [Google Scholar]
- Miller, R.O.; Kissel, D.E. Comparison of soil pH methods on soils of North America. Soil Sci. Soc. Am. J. 2010, 74, 310–316. [Google Scholar] [CrossRef]
- Nelson, D.W.; Sommers, L.E. Total carbon, organic carbon, and organic matter. In Methods of Soil Analysis. Part 3. Chemical Methods; Sparks, D.L., Ed.; SSSA and ASA: Madison, WI, USA, 1996. [Google Scholar]
- Mulvaney, R. Nitrogen—Inorganic forms. In Methods of Soil Analysis. Part 3. Chemical Methods; SSSA and ASA: Madison, WI, USA, 1996; Volume 5, pp. 1123–1184. [Google Scholar]
- Keeney, D.R.; Nelson, D.W. Nitrogen—Inorganic forms. In Methods of Soil Analysis, Part 2: Microbiological and Biochemical Properties; John Wiley & Sons, Inc.: Hoboken, NJ, USA, 1983; Volume 9, pp. 643–698. [Google Scholar]
- Kissel, D.; Sonon, L.; Cabrera, M. Rapid measurement of soil pH buffering capacity. Soil Sci. Soc. Am. J. 2012, 76, 694–699. [Google Scholar] [CrossRef]
- Crooke, W.; Simpson, W. Determination of ammonium in Kjeldahl digests of crops by an automated procedure. J. Sci. Food Agric. 1971, 22, 9–10. [Google Scholar] [CrossRef]
- Cabrera, M.; Chiang, S. Water content effect on denitrification and ammonia volatilization in poultry litter. Soil Sci. Soc. Am. J. 1994, 58, 811–816. [Google Scholar] [CrossRef]
- Gale, E.S.; Sullivan, D.M.; Cogger, C.G.; Bary, A.I.; Hemphill, D.D.; Myhre, E.A. Estimating plant-available nitrogen release from manures, composts, and specialty products. J. Environ. Qual. 2006, 35, 2321–2332. [Google Scholar] [CrossRef] [PubMed]
- Milliken, G.A.; Debruin, R.L. A procedure to test hypotheses for nonlinear models. Commun. Stat. Theory Methods 1978, 7, 65–79. [Google Scholar] [CrossRef]
- Brookes, P.; Landman, A.; Pruden, G.; Jenkinson, D. Chloroform fumigation and the release of soil nitrogen: A rapid direct extraction method to measure microbial biomass nitrogen in soil. Soil Biol. Biochem. 1985, 17, 837–842. [Google Scholar] [CrossRef]
- Vance, E.D.; Brookes, P.C.; Jenkinson, D.S. An extraction method for measuring soil microbial biomass C. Soil Biol. Biochem. 1987, 19, 703–707. [Google Scholar] [CrossRef]
- Jenkinson, D.S.; Brookes, P.C.; Powlson, D.S. Measuring soil microbial biomass. Soil Biol. Biochem. 2004, 1, 5–7. [Google Scholar] [CrossRef]
- Joergensen, R.G.; Mueller, T. The fumigation-extraction method to estimate soil microbial biomass: Calibration of the kEN value. Soil Biol. Biochem. 1996, 28, 33–37. [Google Scholar] [CrossRef]
- Gerdemann, J.; Nicolson, T.H. Spores of mycorrhizal Endogone species extracted from soil by wet sieving and decanting. Trans. Br. Mycol. Soc. 1963, 46, 235–244. [Google Scholar] [CrossRef]
- DeForest, J.L. The influence of time, storage temperature, and substrate age on potential soil enzyme activity in acidic forest soils using MUB-linked substrates and l-DOPA. Soil Biol. Biochem. 2009, 41, 1180–1186. [Google Scholar] [CrossRef]
- Peng, X.; Wang, W. Stoichiometry of soil extracellular enzyme activity along a climatic transect in temperate grasslands of northern China. Soil Biol. Biochem. 2016, 98, 74–84. [Google Scholar] [CrossRef]
- Pinto, R.; Brito, L.M.; Coutinho, J. Nitrogen Mineralization from Organic Amendments Predicted by Laboratory and Field Incubations. Commun. Soil Sci. Plant. Anal. 2020, 51, 515–526. [Google Scholar] [CrossRef]
- Sadet-Bourgeteau, S.; Houot, S.; Dequiedt, S.; Nowak, V.; Tardy, V.; Terrat, S.; Montenach, D.; Mercier, V.; Karimi, B.; Prévost-Bouré, N.C. Lasting effect of repeated application of organic waste products on microbial communities in arable soils. App. Soil Ecol. 2018, 125, 278–287. [Google Scholar] [CrossRef]
- Li, L.; Xu, M.; Eyakub Ali, M.; Zhang, W.; Duan, Y.; Li, D. Factors affecting soil microbial biomass and functional diversity with the application of organic amendments in three contrasting cropland soils during a field experiment. PLoS ONE 2018, 13, e0203812. [Google Scholar] [CrossRef] [PubMed]
- Shen, Y.; Zhu, B.J.G. Arbuscular mycorrhizal fungi reduce soil nitrous oxide emission. New Phytol. 2021, 402, 115179. [Google Scholar] [CrossRef]
- Zungu, N.S.; Egbewale, S.O.; Olaniran, A.O.; Pérez-Fernández, M.; Magadlela, A. Soil nutrition, microbial composition and associated soil enzyme activities in KwaZulu-Natal grasslands and savannah ecosystems soils. App. Soil Ecol. 2020, 155, 103663. [Google Scholar] [CrossRef]
- Alotaibi, K.D.; Schoenau, J.J. Addition of biochar to a sandy desert soil: Effect on crop growth, water retention and selected properties. Agronomy 2019, 9, 327. [Google Scholar] [CrossRef]
Disclaimer/Publisher’s Note: The statements, opinions and data contained in all publications are solely those of the individual author(s) and contributor(s) and not of MDPI and/or the editor(s). MDPI and/or the editor(s) disclaim responsibility for any injury to people or property resulting from any ideas, methods, instructions or products referred to in the content. |
© 2023 by the authors. Licensee MDPI, Basel, Switzerland. This article is an open access article distributed under the terms and conditions of the Creative Commons Attribution (CC BY) license (https://creativecommons.org/licenses/by/4.0/).