Article

Landscape Value in the Spanish Costa del Sol’s Real Estate Market: The Case of Marbella

by
Hugo Castro Noblejas
1,*,
Pierfrancesco De Paola
2,* and
Jesús Vías Martínez
1
1
Geography Department, University of Malaga, Avda. Cervantes, 2, 29071 Malaga, Spain
2
Department of Industrial Engineering, University of Naples Federico II, Vincenzo Tecchio Sq. 80, 80125 Naples, Italy
*
Authors to whom correspondence should be addressed.
Land 2023, 12(5), 987; https://doi.org/10.3390/land12050987
Submission received: 19 March 2023 / Revised: 24 April 2023 / Accepted: 27 April 2023 / Published: 29 April 2023
(This article belongs to the Special Issue Landscapes at Risk. Social Capital Asset in the COVID-Scape Climate)

Abstract

:
Housing prices are influenced by extrinsic and intrinsic factors. This study aims to highlight the economic impact of the perceived landscape on single-family houses prices in a Spanish Mediterranean urban area (Marbella). Considering the landscape an important added value in real estate markets, this study also explores the landscape elements that contribute the most to the value of housing. A particularly positive influence of mixed views (urban elements and Mediterranean scrub) and sea views is detected in the analysis. Sea views are highly requested in the local housing market, but due to the graded topographical layout of Marbella, it is not very difficult to have sea views for houses. The low importance of views on natural land areas is worth noting when one of the attractions of this municipality is that of a highly valued Mediterranean natural environment. Views on the old town centre are somewhere in between: although the old town centre is highly regarded, with a generally good state of preservation, the sampled properties have poorer quality perspectives, with reduced visual basins and views centred on the foreground, usually the houses opposite.

1. Introduction

Housing is one of the goods considered a right in the United Nations’ Universal Declaration of Human Rights [1]. However, this good not only fulfils the function of covering a basic human need, because it is usually commodified through trades and sale prices. Housing value in terms of use and exchange values implies several phenomena on its economic valuation, with real estate prices that increase in misalignment with its characteristics.
Property prices are influenced by extrinsic and intrinsic factors, such as, e.g., maintenance state and quality of materials [2], comfort [3], safety [4,5,6], energy efficiency [7,8,9,10,11,12], social status of its owner [13] and the surroundings [14,15,16,17], environmental, historical or architectural amenities [18]. In the same way, real estate market is also conditioned by contextual socioeconomic factors [19,20] and the variation in the mode of real estate goods appreciation [21,22]. These aspects favour the use of advanced hedonic pricing models based on the survey and statistical analysis of real estate market data.
The econometric analysis of real estate prices can be used for the landscape’s monetary valuation, considering that real estate prices are receptors of environmental externalities. In the same way as the position income is integrated into real estate prices, so the value of environmental externalities and landscape can be estimated measuring real estate price changes resulting from the environmental variation detected. This analysis type requests pluriparametric statistical models (e.g., multiple regression or semiparametric models) to express property prices through a complex function linked to real estate characteristics, including those relating to the environmental qualification or landscape.
Starting with these considerations, a geoadditive model was applied to measure the economic impact of the possible perceived landscapes on single-family houses prices in a Spanish Mediterranean urban area (Marbella). Geoadditive models (GM) are a variant of generalized additive models (GAM), the most common nonparametric multivariate regression technique used for these purposes because they have many advantages, mostly in small local real estate markets. They help to analyse price variations in the area of interest, predicting and quantifying in real time where and how prices vary in the urban context considered, with a possibility to correlate these variations with any phenomenon or economic effect. Moreover, if penalized splines are combined with techniques of spatial statistics (kriging), these models allow obtaining spatial maps with high reliability to support any decisions related to urban investments [23,24].

2. Literature Review

In international literature, many studies applied spatial nonparametric or semiparametric additive regressions to the formulation of housing market’s hedonic price models. Often, these models proved to be the best tools for property price forecasting because nonlinear models better fit the spatial heterogeneity of and nonlinear relationships between real estate characteristics and selling prices [23,24].
Mainly, these studies focused on generalized additive models and the so-called “backfitting algorithm” [25] as the main resolution tool of additive models based on the available statistical data [26].
With the objective to limit computational difficulties in estimating the individual functions of additive models, specific smoothing spline functions are placed and matched. Currently, smoothing spline functions are of particular interest when working with fuzzy databases, but also when applied in many scientific fields, e.g., chemistry, natural and physical sciences, medicine, economy [27]. Semiparametric models applied to real estate appraisals are currently a subject of specialized literature and, particularly, they focus on analysing real estate markets and marginal pricing of relevant real estate characteristics [28].
Specifically, in this study, a semiparametric model with geostatistical extension as used to discern the value of landscape qualities in a local real estate market.
As van der Heide and Heijman pointed out, until the 1970s, landscape was not considered a relevant economic variable in Western Europe and because of that, it was not studied in depth by economists [29].
In recent decades, there has been a growing interest in the extrinsic factors influencing real estate prices or the effects of environmental variables on surrounding areas, albeit in a disaggregated way: the studies have aimed to isolate specific elements of the environment, such as the presence of green spaces [30,31], water bodies [32,33,34,35] or air quality [36,37,38]. These variables may reflect the landscape value, but the mentioned studies focus their analysis considering other aspects such as accessibility or the simple positive or negative connotation of their proximity. However, the consideration of landscape in an integral way, especially in the dimension with the greatest impact on the human being, the visual, is still in the incipient phase due to the complexity of measuring and separating it from other housing features.
Most relevant studies with this scope have begun to be carried out both on the regional scale in 2021, such as in the Tuscany region in Italy [39], as well as on the intraurban scale, in cities like Hong Kong in 2009 and 2011 [40,41], New York in 2021 [42] or Geneva in 2011 [43]. Although quantitative studies are more frequent, because they are more easily replicable in other territorial units and allow larger statistical samples, there are also studies that apply qualitative methods such as those by Damigos and Anyfantis conducted in 2011 [44], by Castro, Vías and Mérida in 2022 [45] or by Vizzari in 2011 [46].
More precisely, qualities of neighbourhoods and their surroundings were studied by Kiel and Zabel in 2008 [47], but the location qualities value is very difficult to express, as D’Acci affirmed in 2014 [48]. The issue of location quality valuation in monetary terms usually concerns the relationship between real estate prices and the distance to characteristic places with the necessary support services and structures: see the studies of Chiang et al. conducted in 2015 [49] or of Jang and Kang in 2015 [50]. Since hedonic models are the preferred tools for expressing the relationship between housing prices and location qualities, it is worth noting that they often include structural factors that may introduce noise effects (such as building age, area, etc.): e.g., see the studies of Hui et al. conducted in 2007 [51], Jim and Chen in 2010 [52], Xiao et al. in 2017 [53]. A wide literature review about hedonic models is reported in the work of Malpezzi et al. published in 2002 [54]; however, the analysed studies showed that the real estate characteristics weight varies in significance and dimension, confirming that every study is specific and valid only for the real estate market to which it refers. Sirmans et al. also arrived to this conclusion in 2005 [55].
Other recent studies have focused on more specific social aspects of landscape value. Cellmer in 2023 dealt with the issue of urban landscape value considering it as one among many “points of interest” (POI), taking into account the number and density of POIs in the surrounding territory (in Poland), thus reflecting, among other things, the effect of the degree of urbanization and the city’s spatial structure [56]. Grundel et al. explored in 2022 a collaborative process for Sweden, namely landscape resource analysis, as a tool to identify a variety of values and sometimes conflicting interests and to improve communication about these among different stakeholders by using maps and GIS [57]. In 2022, Martin and Yepes applied an analytic multicriteria valuation method to estimate the landscape’s economic contribution [58]. In 2013, Tagliafierro et al. proposed a multidisciplinary approach integrating landscape ecology, landscape preference studies and environmental economics to assess the economic value that people attach to different landscape attributes [59].

3. Materials and Methods
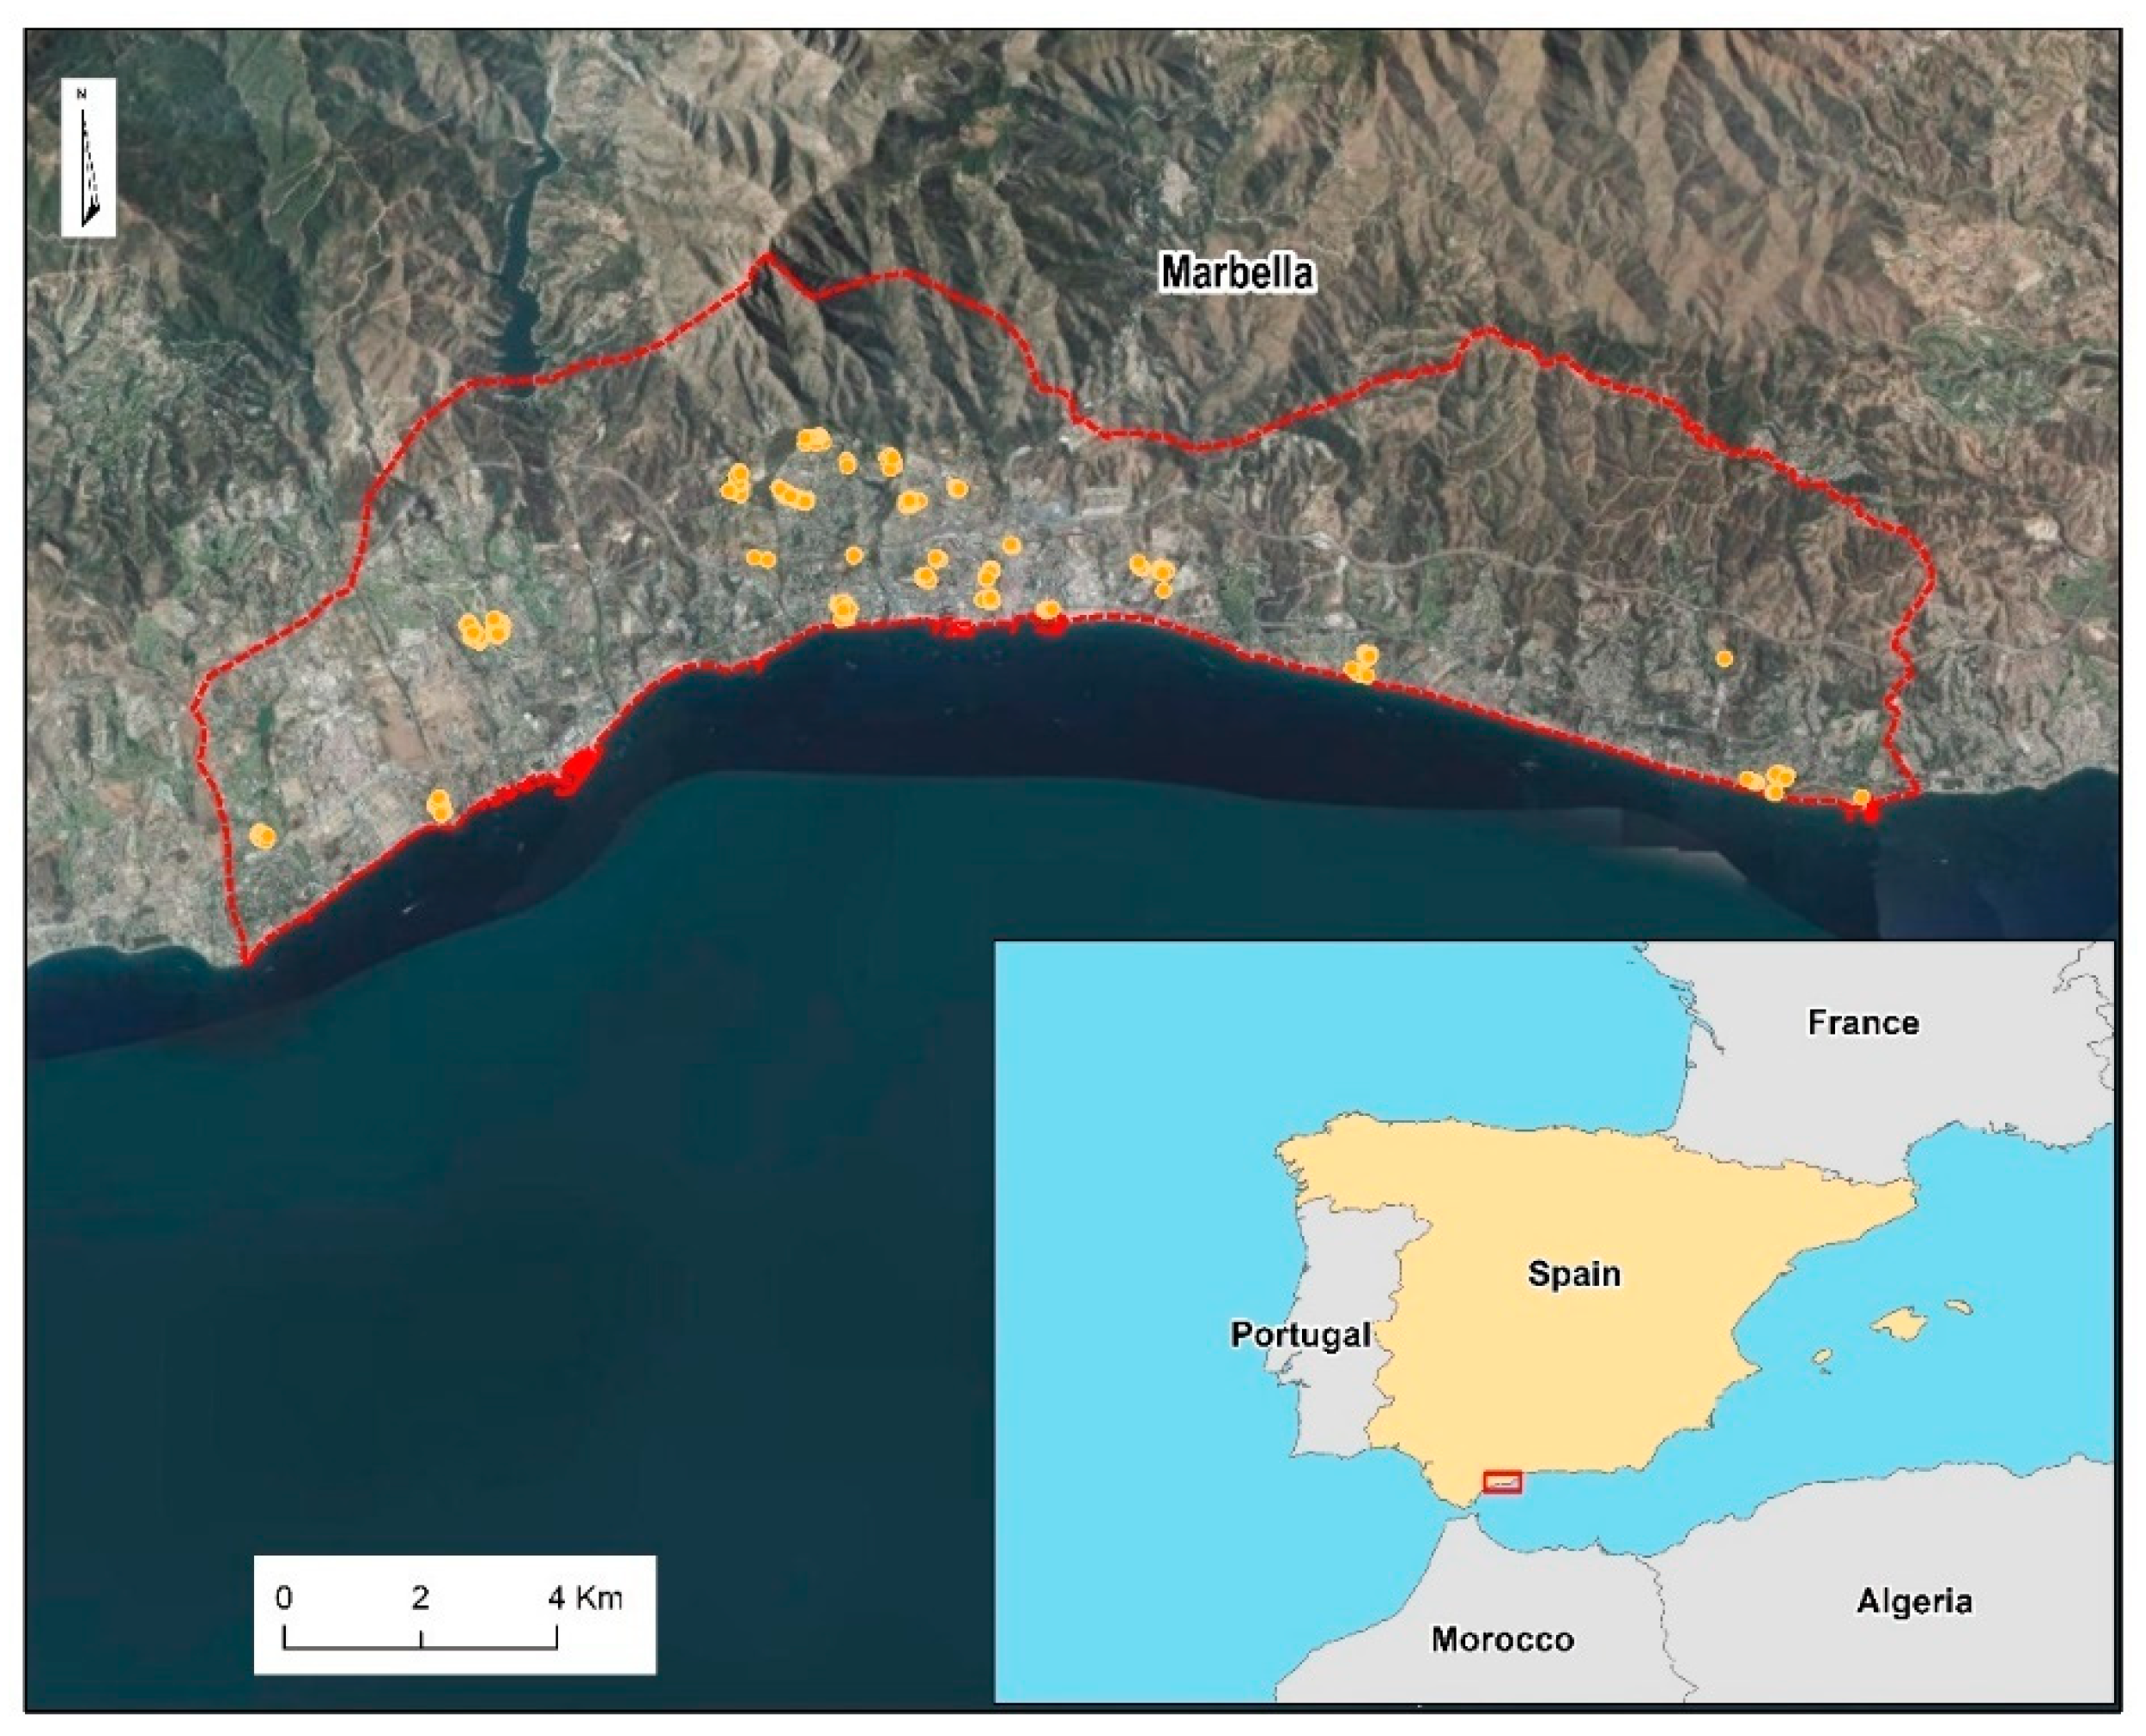
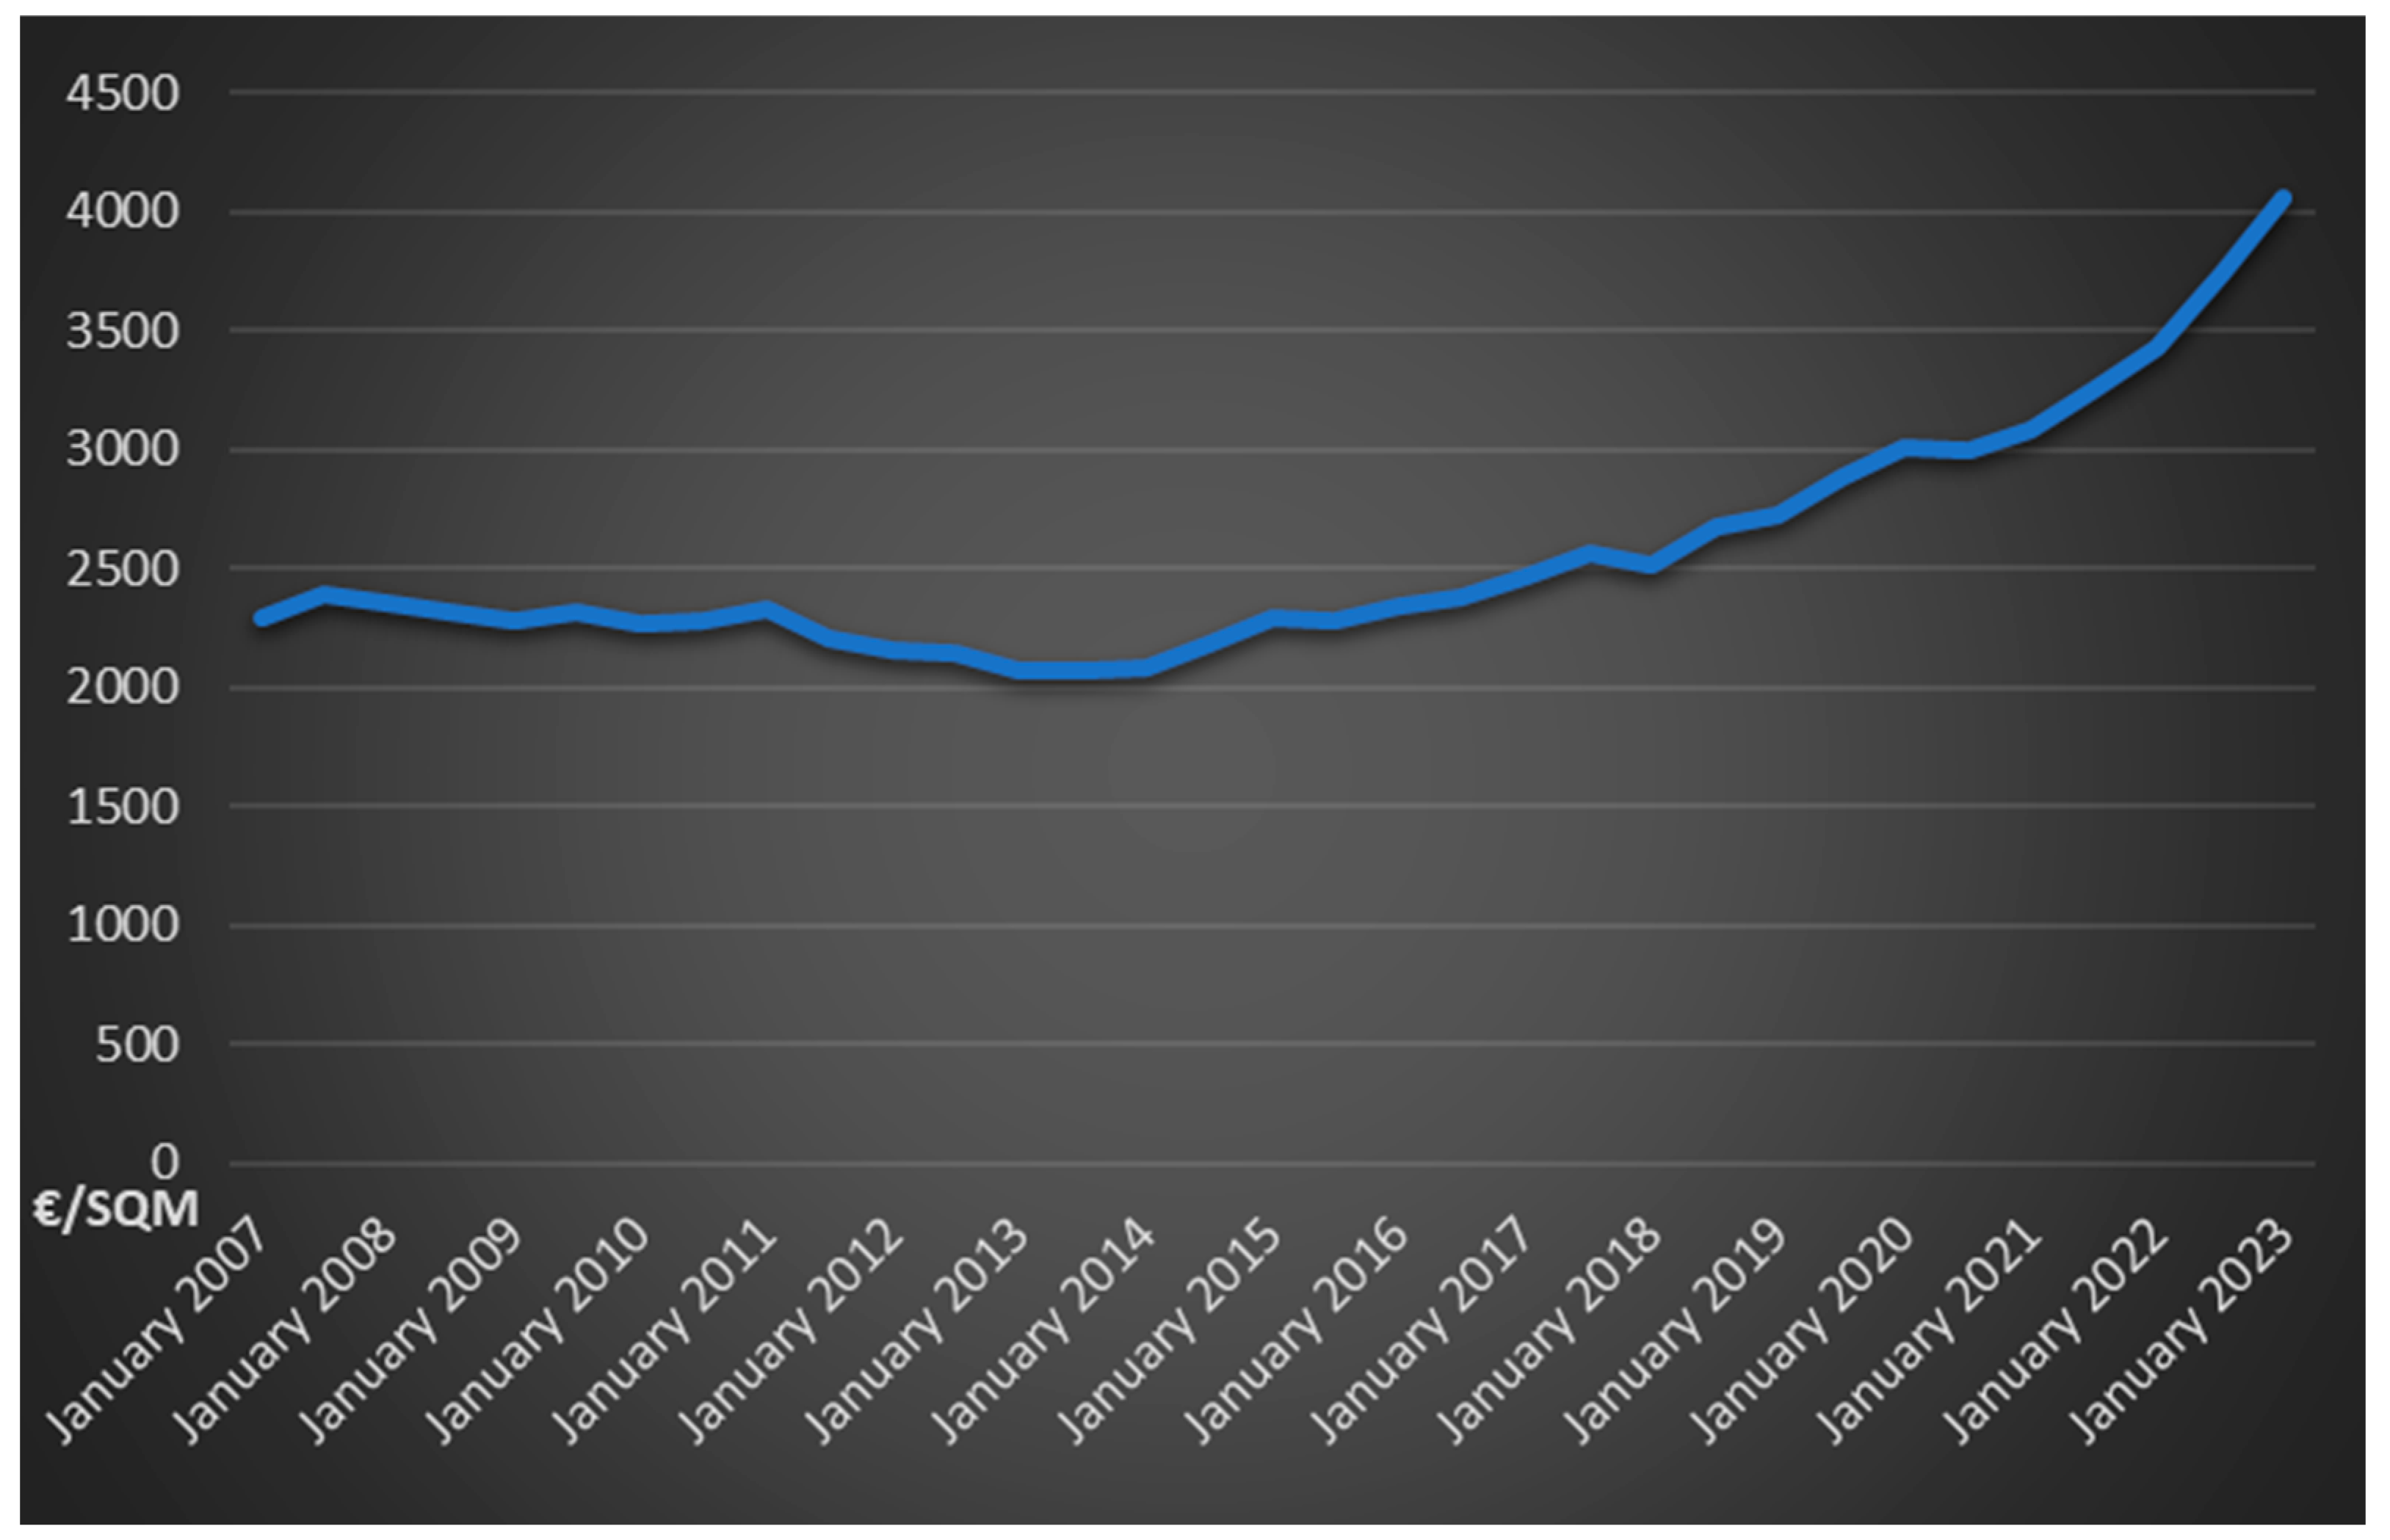
3.1. Study Area

The real estate data sample consisted of 403 single-family houses offered for sale in 2022 and located in the municipality of Marbella (a Spanish Mediterranean town of western Costa del Sol, see Figure 1).
Marbella features a particular topographical connotation. The town is located between the coastline and a mountain range, which favours the possibility of having wide panoramic views from numerous urban spaces. If a mild Mediterranean climate and urban development without traces of industrial use are added to these aspects, the result is a residential tourism destination in which the views from houses are a particularly appreciated characteristic.

3.2. Variables

The variables listed in Table 1 were selected to analyse the Marbella real estate market and highlight the economic impact of landscape on real estate values.
The values of the AREA and TYPE variables were normalised in order to improve the performance of the mathematical model. These variables were grouped into three categories considering the specific characteristics of the Costa del Sol real estate market.

3.2.1. Housing Sales Price (PRICE, UPRICE)

Due to the geographical and topographical connotations of Marbella, the average price per square meter is considerably higher than the average unit price in the rest of the western Costa del Sol region: the average unit price per square meter in Costa del Sol is about 2600 euros; in Marbella, it reaches a value higher by 30–35% (about 3400 euros).
The housing prices in the municipality went from about 2300 euros in 2007 to about 4000 euros per square meter in January 2023, recording an increase of about 77% (see Figure 2). Some intermediate periods after the real estate bubble in 2006 and the world financial crisis of 2008 must be highlighted in this real estate dynamic, where the prices dropped to a minimum of about 2050 euros per square meter (November 2013). Thus, from January 2013 to 2023 the housing prices increased by up to 96% in about ten years, with an average increase of ca. 0.8% per month [61].
Considering each real estate market segment since July 2011, we can detect uneven variations for the houses sampled in this study. For the luxury segment, the price increase rate was ca. 57%, for the upper-middle segment, it was ca. 90%, and for the more affordable segment, it was ca. 70%. The data sample considered, consisting of 403 single-family houses extracted from the Idealista Maps website, is distributed across different town areas (urban centre to periphery). The sample was composed of the real estate listings available for 2022. Some scientific studies have considered heterogeneous residential spaces, while others have tried to select units of specific types [62]; in our case, only single-family houses were sampled to avoid possible biases in the statistical analysis.
The UNI 11612:2015 standard (Italy) introduces the possibility to use asking prices for real estate appraisal purposes. In particular, when insufficient, undetectable and/or unreliable real estate trades have occurred in the reference market segment in a recent period, price requests for similar properties offered for sale can be considered (asking price).

3.2.2. Commercial Area (AREA)

The property’s commercial area is one of the variables that influences the selling price the most, and it has been included into the analysis. The different weighting between the internal surface and other secondary surfaces (gardens, garage, cellars, etc.) has been considered on the basis of the guidelines provided by the European Valuation Standards [63].

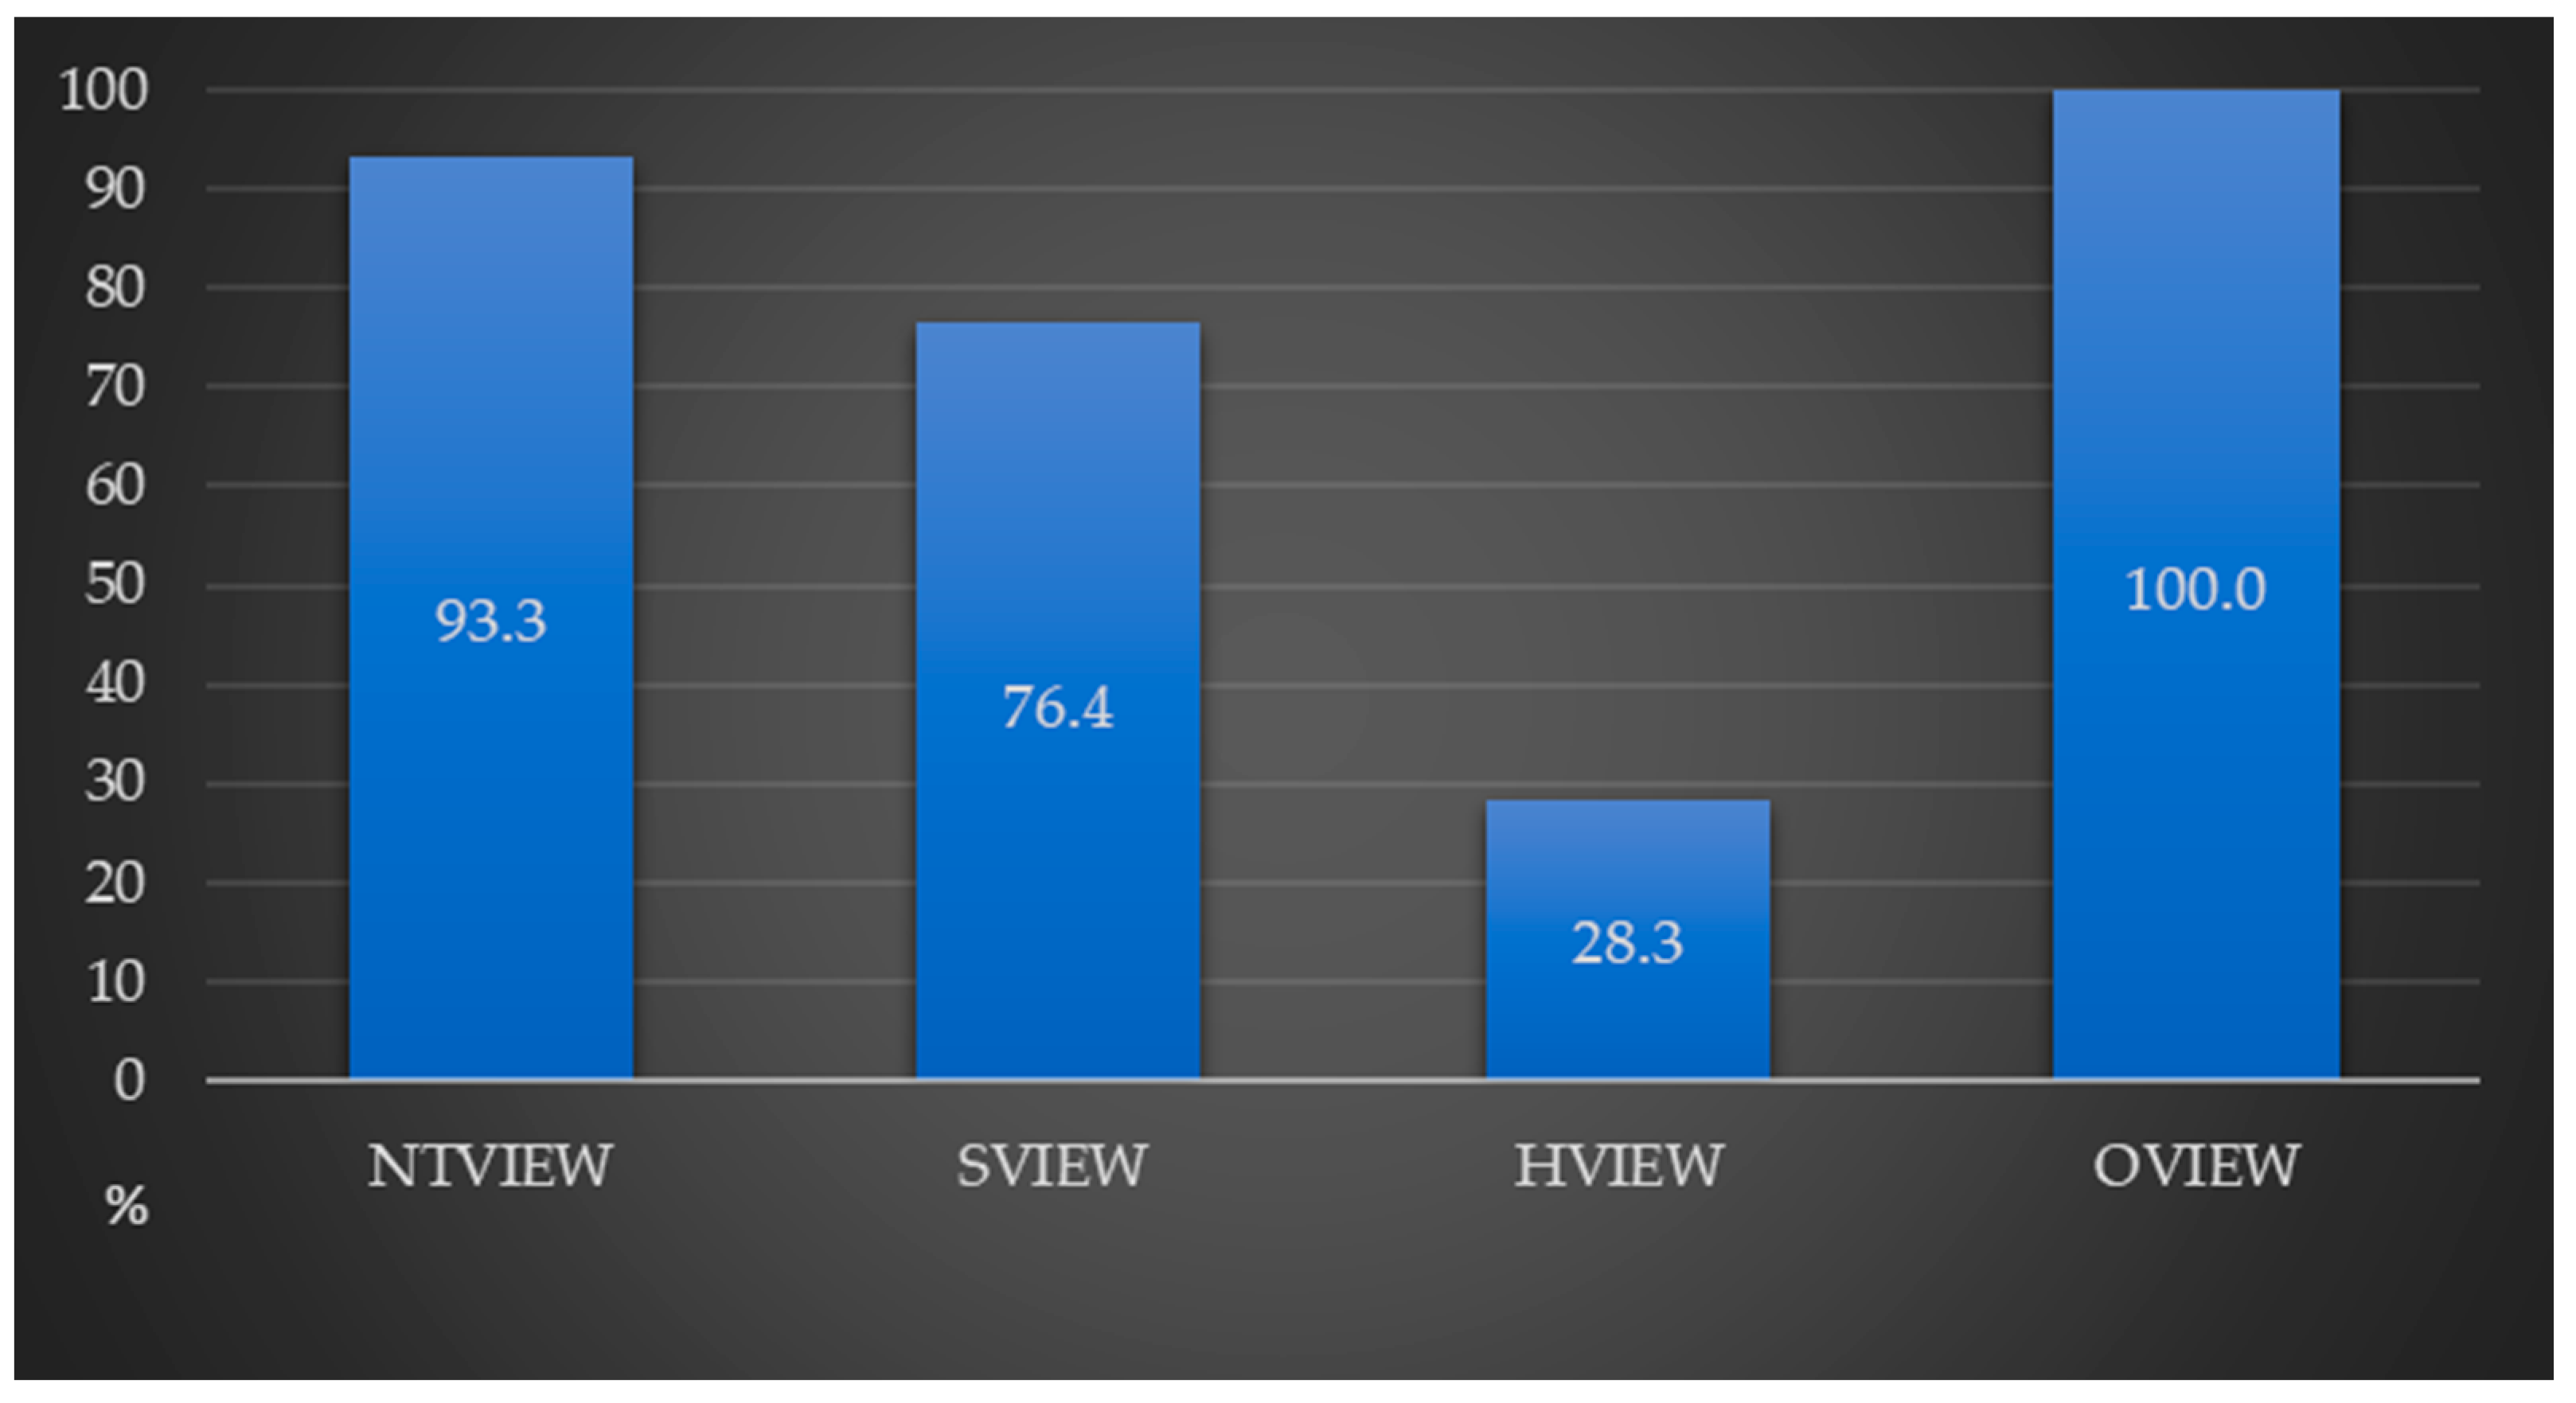
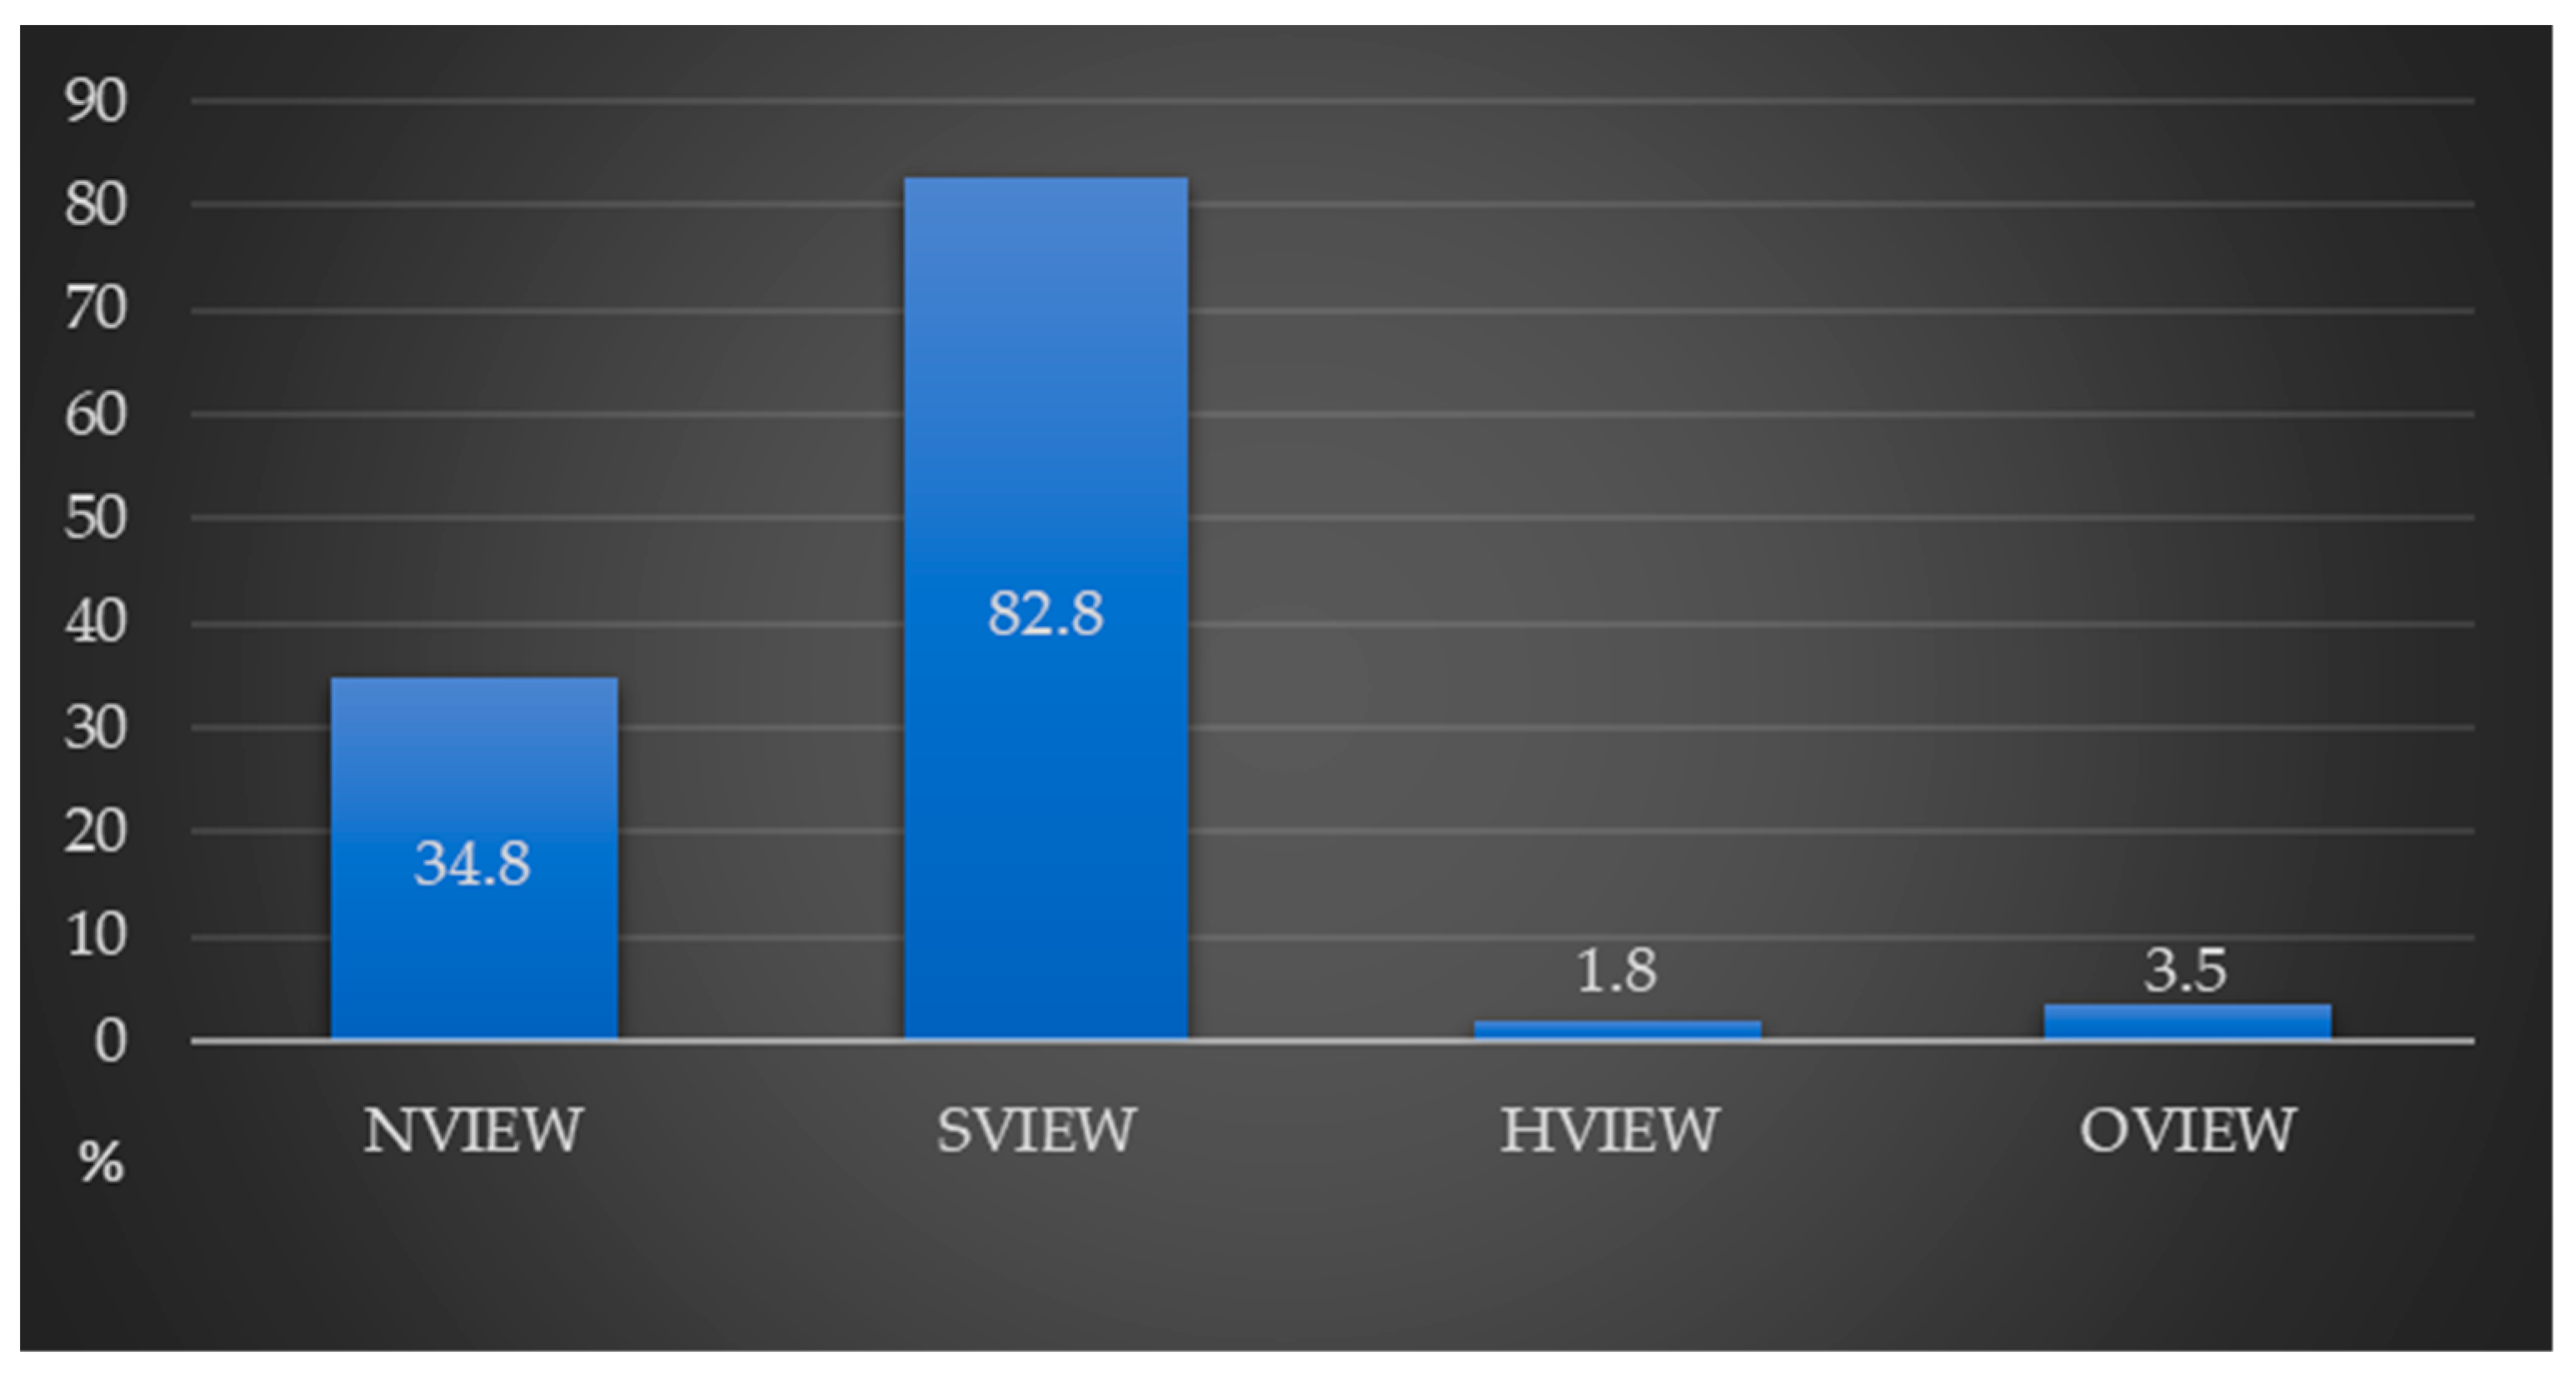
3.2.3. Landscape View of the House (VIEW)

According to the European Landscape Convention of the Council of Europe [64], landscape valorisation has been subject to a growing sensitivity towards less tangible aspects of landscape experience [65,66,67,68]. Due to the combination of its physical characteristics and cultural relevance, landscape is considered to have a direct impact on the quality of life of those who experience it. However, this concept involves consideration of a qualitative distinction from similar places, because they may generate more biases rather than a clarification of the processes behind real estate prices. The views of houses can have a varied composition, combining more or less desirable landscape elements arranged on different levels, so each view can have a different appreciation. For this reason, a disaggregation of views into four landscape types was chosen in this study. The views were limited to three areas with a theoretical positive connotation: natural elements of the sea or mountains, urban elements of the historic centre, all remaining views with attribution of the same landscape classification.

3.2.4. Qualitative Segment of the Real Estate Market (TYPE)

A classification into three categories (luxury, upper-middle and lower-middle segments) was made for the single-family houses sampled. The differentiation criterion was based on the architectural features of the house, and fieldwork was carried out to evaluate them. The architectural style, the height–width ratio, the window–wall ratio, as well as the surrounding buildings are the aspects that were evaluated as priorities in previous studies and were taken into account [69].

3.2.5. Euclidean Distance to the Sea (DIST)

In tourist locations, the proximity of a house to the sea can be as decisive element for its price due to its visual perception [70]. Among other reasons, this is due to the perception of the sea as a natural recreational resource where such activities as swimming, nautical sports, sunbathing, etc. can be carried out [71] or the climate-regulating function it exerts on the nearby environmental and human resources. For all this, the straight-line distance (Euclidean distance) from the sampled houses to the sea was measured and considered in this work.

3.3. Dataset Preparation

With the exception of the georeferenced real estate values, all the other data analysed in this study were generated using a geographic information system through the QGIS 3.28.5 ‘Firenze’ software [71].
The first step consisted in the definition of the landscape information layer characterized by four general landscape levels: three levels with an added value for observers (mountain, sea, old town) and another level for all the remaining views. This layer had a five-kilometre extension over the limits of the Marbella municipality for two reasons: on the one hand, to include the perception of the nearby landscape background; on the other hand, the houses located in areas near the municipal limits have similar views to the more central areas.
The second step regarded the definition of the variables related to coastal landscape, such as proximity and distance to the sea. This was calculated in two different ways: by measuring the Euclidean distance from the nearest point of the coast to each house using the ArcMap tool [72] or by analysing the road network by means of a layer obtained from Open StreetMap [73]. After a preliminary process of shapefile conditioning, an isochronous map was created based on the traffic speed in each section.
After discovering that the architectural type variable generated noise in the spatial logic of equation results, a coefficient was applied to the prices according to the architectural type and finally omitting this variable. A different coefficient was applied to the houses sampled based on their type.
The last step elaborated the visual basin of each house using a digital surface model (DSM) with a pixel resolution of five meters provided by the National Geographic Institute of Spain [74]; the four stages of this process were as follows:
  • A viewpoints layer was created for each house sampled in the study area. To do this, the polygons layer representing the plots of different urban buildings was transformed into a points layer by calculating the centroid of each polygon (in this case, the layer had 403 observation points). To this points layer, an attribute referring to the observer’s standard height (1.65 m) and visibility radius (five kilometres) was applied.
  • After configuring the observation points, the visual basins were calculated with the viewshed algorithm based on the DSM, assuming the default values provided by the tool in terms of Earth sphericity and the atmospheric refractive index. This calculation process was performed 403 times, once for each observation point, obtaining a raster layer with binary values: 0 (not visible) and 1 (visible areas).
  • Finally, the visible area value in square meters was calculated for each of the 403 visual basins. The visible surface was the result of multiplying the number of pixels with value 1 by the surface of each pixel (25 square meters in this case study).
  • The perceived surface characteristics were classified by cross-referencing the information of the landscape units that cover the entire study area.

3.4. Model Specification: Penalized Spline Additive Models and Geostatistical Extension

The complexity of the relationship between real estate prices and explanatory variables was applied to the implementation of a geoadditive model.
Typically, geoadditive models are composed using a semiparametric additive component, which serves to express the relationship between the model’s nonlinear response and explanatory variables and a model with linear mixed effects that expresses the spatial correlation of the observed values [75].
The first component involves a low-rank mixed model representation of additive models. To summarize the process, the case of two additive components is presented. Suppose that (si, ti, yi), 1 ≤ i ≤ n, represent measurements using two predictors s and t for the response variable y; in this case, the additive model is as follows:
y i = β 0 + f s i + g t i + ε i
where f and g are unspecified smooth functions of s and t, respectively. Therefore, if u+ is defined to be equal to u for u > 0 and 0 otherwise, a penalized spline version of model (1) involves the following functional form [26]:
y i = β 0 + β s s i + k = 1 K s u k s ( s i κ k s ) + + β t t i + k = 1 K t u k t ( t i κ k t ) + + ε i
In Equation (2), there is penalization of the knot coefficients uks and ukt, where κ1s, ...., κkss and κ1t, ...., κktt are knots in the s and t directions, respectively. The penalization of uks and ukt is equivalent to treating them as random effects in a mixed model [75].
Setting β = (β0, βs, βt)T, u = (u1s, ....., ukss, u1t, ....., uktt)T, X = (1 si ti) with 1 ≤ in, Z = (ZsZt) using the following equations:
Zs = [(siκks)+]1≤i≤n, 1≤k≤Ks , Zt = [(tiκkt)+]1≤i≤n, 1≤k≤Kt
the penalized least squares value is equivalent to the best linear unbiased prediction in a mixed model:
y = X β + Z u + ε   ;   E u ε = 0   ;   cov u ε = σ 2 s I 0 0 0 σ 2 x I 0 0 0 σ 2 ε I
Model (4) is a variance components model since the covariance matrix of (uTεT)T is diagonal. The variance ratio σε2/σs2 acts as a smoothing parameter in the s direction. Penalized spline additive models are based on low-rank smoothers as defined by Hastie [76], considering that linear terms are easily incorporated into the model through the component.
At this point, a geographical component can be incorporated by expressing kriging as a linear mixed model and merging it with an additive model such as model (4) to obtain a single mixed model (defined as a geoadditive model).
The universal kriging model for (xi, yi), 1 ≤ i ≤ n (yi is scalar and xi represents the geographical location included in the R2 domain) is as follows [75]:
y i = β 0 + β 1 T x i + S x i + ε i
where S(x) is a stationary zero-mean stochastic process and εi is assumed to be an independent zero-mean random variable with common variance σε2 and distributed independently of S. Prediction at an arbitrary location x0 is performed using the following expression:
y x 0 = β 0 + β 1 T x 0 + S x 0
Then, for a known covariance structure of S, the resulting equation is as follows:
y x 0 = β 0 + β 1 T x 0 + c 0 T C + σ ε 2 I 1 y β 0 β 1 T x
where:
C = cov S x i , S x j 1 i , j n c 0 T = cov S x 0 , S x i 1 i n
For the implementation of Equation (6), we can use the following equation:
cov = s ( x ) , S ( x ) = C θ x x
where v = √(vTv) and Cθ is a term of the Matérn covariance function. The complete formulation of the Cθ term corresponds to the following:
C θ r = σ 2 x 1 + r / ρ exp r / ρ
Equation (8) is the simplest member of the Matérn family and the ρ term can be chosen with the following rule to ensure scale invariance and numerical stability [76]:
ρ = max 1 i , j n x i x j
For all the aspects and issues previously reported, a geoadditive model can be described, essentially, as a single linear mixed model as follows:
y i = β 0 + f s i + g ( t i ) + β T 1 x i + S x i + ε i
It we take X = (1 si ti xiT) with 1 ≤ i ≤ n and Z = (ZsZtZx), where Zs and Zt are defined by Equation (3) and Zx = ZΩ−1/2 with the following equations:
X = (1 xiT)1 ≤ in
Z = C 0 x i κ k 1 k K / ρ 1 i n Ω = C 0 κ k κ k 1 k , k K / ρ C 0 ( r ) = 1 + r exp r
The model has the following representation:
y = X β + Z u + ε
where
E u s u t u ~ = 0 ;   cov u ε = σ s 2 I 0 0 0 0 σ t 2 I 0 0 0 0 σ x 2 I 0 0 0 0 σ ε 2 I
Model (10) can be extended to incorporate linear covariates through the term. The extension to more than two additive components is straightforward.

4. Results

4.1. Results of View Estimation Calculations

The GIS elaboration of the views perceived by the single-family houses sampled allows estimating their presence and how they may affect sale prices.
Figure 3 shows that a large proportion of the properties analysed have views on natural landscape elements with a recognised positive effect on prices, being 94.3% for the “views on natural land areas” (NTVIEW) and 76.4% for the “views on the sea” (SVIEW). The value is considerably reduced for the “views on the historic centre” (HVIEW) since the old town of Marbella has undergone an intense process of urban expansion in the recent decades; besides many of the buildings surrounding the old town block it from the outside due to their larger dimensions. The “other views” variable (OVIEW) includes mixed views on built urban elements, open spaces and undeveloped areas without a special natural attraction; a catch-all that covers an important part of this case study, because some of these views can always be perceived from all the houses sampled.
Filtering the importance of the different view types, the situation changes considerably. As can be seen in Figure 4, while almost 83% of the houses with sea views have this element as the predominant one in their views, for houses with views on natural land areas, only 34.8% enjoy views in which it is the most representative element. For views on the old town, this situation is generated in very few cases since there are no houses within this area while the other visible elements, although present in all the houses analysed, only predominate in 3.5% of cases.

4.2. Results of the Geoadditive Model

In this section, the results of the semiparametric model described in the previous section as applied to the real estate sample considered are presented.
For each property of the sample, the asking price and the amounts of some relevant property characteristics are known, as shown in Table 2. The statistical description of the variables is reported in Table 3.
Based on the real estate data, the following semiparametric model was implemented:
UPRICE = f(XCOORD, YCOORD) + f(DIST) + NTVIEW + SVIEW + HVIEW + OVIEW
where XCOORD and YCOORD are the geographical coordinates; DIST is the distance from the property to the coastline; NTVIEW is the area of mountain views; SVIEW is the area of sea views; HVIEW is the area of views on the old town; OVIEW is the extent of views on other landscape elements.
In the absence of multicollinearity phenomena, given the low correlation between the explanatory variables, the main verification indices of the model are shown in Table 3.
Determination of the knots for the model’s spatial component and its geographical coordinates were performed using the space-filling algorithm implemented in the default.knots.2D function library of the R software [77]. The model was therefore estimated by the Re.M.L. method using the spm library of the R software.
The nonlinear effects of the model are significant based on the values obtained for the freedom degrees (df) and smoothing parameters (spar). The values of the obtained predictions are consistent with the observed data; analysis of the residuals did not show any abnormality in their structure as well. In the examined area, the spatial distribution of the real estate unit prices clearly shows how the geographical component affected the prices of the sampled properties.
The main result of the model is a graphic interpolation or a thematic map depicting the real estate unit values in the urban context considered, in which blue and red colours represent the lowest and highest unit values, respectively (see Figure 5 and Figure 6).

4.3. Discussion of the Results

The results obtained demonstrate that landscape is an important added value in the local real estate market of Marbella, especially in the higher-priced housing segments. In this way, the study explored the landscape elements that contributed most to the housing values.
A particularly positive influence of “other views” was detected in the analysis, followed by “sea views”. The importance of “other views” is striking since this element is characterized by mixed urban elements and natural ground with no notable wooded areas. A possible explanation for this positive contribution is exactly a more varied and complex composition of views, which is more attractive than simpler perspectives (with the exception of fully sea views, a very rare condition, especially for single-family houses).
Sea views are highly sought, but due to the graduated topographical and geomorphological layouts of Marbella, it is not very difficult to have sea views for houses (about 83% of the sample have about 50% of the views towards the sea).
On the other hand, it is worth noting the low importance of views on natural land areas when one of the most relevant attractions of Marbella’s territory is a highly valued Mediterranean natural environment.
The views on the old town centre are less appreciated than all the other types of views. Although the old town centre is highly regarded, with a generally good state of preservation, the model results can be partially explained by the fact that the houses sampled are located in its immediate surroundings, albeit outside this specific area. In addition, due to the circumstances of this case study, the old town views have poorer quality perspectives, with reduced visual basins and views centred on the foreground, usually on the buildings opposite.
Conclusively, a summary of qualitative and quantitative rankings relating to the different types of landscape views for Marbella can be expressed.
From a merely qualitative point of view, the most valuable landscape view is the mixed type, followed by the sea view, the views on natural land areas and lastly the views on the old town.
The interpretation of the results from a quantitative point of view appears to be more complex. Indeed, the relevance of each landscape element with respect to the others varies in relation to the specific element considered. This is why, in Table 4, the quantitative relevance attributable to each landscape element with respect to the others is reported to have a general indication of the phenomenon.
In absolute terms, the greatest economic impact occurs for old town views (1.136 × 10⁻²), followed by other views (8.084 × 10⁻⁵), natural land views (7.583 × 10⁻⁵) and sea views (2.470 × 10⁻⁶). The impact of each element must be read in reciprocal terms between the different types of views, with respect to the amounts and signs that distinguish them (see Table 4).

5. Conclusions

In this study, the economic impact of the perceived landscape on single-family house prices in a Spanish Mediterranean urban area (Marbella) was analysed. Considering the landscape an important added value in real estate markets, this study also explored the landscape elements that contribute the most to the value of housing.
From a methodological point of view, the versatility of semiparametric models applied to real estate valuations and the possibilities to measure the influence on real estate prices of property characteristics were verified, proving their usefulness with an environmental variable of intangible nature such as landscape. Moreover, the real estate isovalues map obtained makes possible to have immediate evidence and identify exactly where the houses have the greatest commercial attractiveness, adequately weighing all the real estate characteristics. Due to the diffuse opacity of real estate markets, geoadditive models can help to better interpret the different segments of local real estate markets or even in the prediction and interpretation of the phenomena related to the genesis of rewards of position with reference to the problems of transformation and investments in urban areas affected by projects or plans and to optimize the choices of the use of goods and resources.
With regard to the social and economic impacts, the current concepts of landscape value and its protection need to know the economic impacts that this environmental and cultural resource confers on private economic assets as well as on the community. The importance of landscape value assessment results does not lie so much in their specific entity but rather in their potential to provide a reference point for economic operators and decision-makers called to make choices [78,79,80]. In the complex issue of landscape protection and management, the economic dimension is gaining much more relevance. Landscape is increasingly considered a social element, and therefore an expression of widespread, common, individual perceptions and value judgments of various kinds, including those of economic nature whose measurement requires operating principles and schemes not yet consolidated.
The landscape is a public territorial resource, the value of which is not directly detectable by real estate markets. Knowing the economic impacts of landscape is useful not only for investment choices, but also because it would allow economic justification for building interventions, for which sometimes only the indirect and direct costs associated with the constraints and prohibitions imposed by traditional regulatory tools based on the protective actions imposed are known.
In perspective, the conclusions drawn from this type of research can have a wide range of applications: from an increase in the consideration of landscape in territorial planning for areas with attractive landscapes, hierarchizing the protection of specific territorial units with landscape value, to more accurate real estate valuation models.

Author Contributions

H.C.N. designed the conceptual approach, analysed the data with GIS tools, interpreted the results and was involved in writing the manuscript. P.D.P. and H.C.N. were involved in the methodology design. P.D.P. was involved in developing the methodology, writing the manuscript, supervising, reviewing and approving the final version of the manuscript. P.D.P. analysed the data in the geoadditive model. J.V.M. was involved in the development of the methodological procedure, preparation of the database and revised and approved the final version of the manuscript. All authors have read and agreed to the published version of the manuscript.

Funding

This research received no external funding.

Data Availability Statement

The data are the authors’ own elaboration.

Conflicts of Interest

The authors declare no conflict of interest.

References

  1. United Nations. Available online: http://www.un.org (accessed on 1 February 2023).
  2. Del Giudice, V.; De Paola, P.; Morano, P.; Tajani, F.; Del Giudice, F.P.; Anelli, D. Depreciation of Residential Buildings and Maintenance Strategies in Urban Multicultural Contexts. In Values, Cities and Migrations; Napoli, G., Mondini, G., Oppio, A., Rosato, P., Barbaro, S., Eds.; Green Energy and Technology; Springer: Cham, Switzerland, 2023. [Google Scholar] [CrossRef]
  3. Racz, I. Art and the Home: Comfort, Alienation and the Everyday; Bloomsbury Publishing: London, UK, 2015; ISBN 978-1780762005. [Google Scholar]
  4. Vetter, D.M.; Beltrão, K.I.; Massena, R. The Impact of the Sense of Security from Crime on Residential Property Values in Brazilian Metropolitan Areas; Banco Interamericano de Desarrollo: Washington, DC, USA, 2013; Available online: http://services.iadb.org/wmsfiles/products/Publications/37857917.pdf (accessed on 13 December 2022).
  5. Manganelli, B.; Vona, M.; De Paola, P. Evaluating the cost and benefits of earthquake protection of buildings. J. Eur. Real Estate Res. 2018, 11, 263–278. [Google Scholar] [CrossRef]
  6. Acampa, G.; Forte, F.; De Paola, P. BIM Models and Evaluations. In Values and Functions for Future Cities; Mondini, G., Oppio, A., Stanghellini, S., Bottero, M., Abastante, F., Eds.; Green Energy and Technology; Springer: Cham, Switzerland, 2020. [Google Scholar] [CrossRef]
  7. Popescu, D.; Bienert, S.; Schutzenhofer, C.; Bozau, R. Impact of energy efficiency measures on the economic value of buildings. Appl. Energy 2012, 89, 454–463. [Google Scholar] [CrossRef]
  8. De Paola, P.; Del Giudice, V.; Massimo, D.E.; Del Giudice, F.P.; Musolino, M.; Malerba, A. Green Building Market Premium. In New Metropolitan Perspectives—Knowledge Dynamics and Innovation-Driven Policies towards Urban and Regional Transition; Bevilacqua, C., Calabrò, F., Della Spina, L., Eds.; Springer: Cham, Switzerland; Berlin, Germany, 2021; Volume 178, pp. 1413–1422. ISBN 978-3-030-48278-7. [Google Scholar]
  9. Del Giudice, V.; Massimo, D.E.; De Paola, P.; Del Giudice, F.P.; Musolino, M. Green Buildings for Post Carbon City. In New Metropolitan Perspectives—Knowledge Dynamics and Innovation-Driven Policies Towards Urban and Regional Transition; Bevilacqua, C., Calabrò, F., Della Spina, L., Eds.; Springer: Cham, Switzerland; Berlin, Germany, 2021; Volume 178, pp. 1227–1236. ISBN 978-3-030-48278-7. [Google Scholar]
  10. Del Giudice, V.; Massimo, D.E.; Salvo, F.; De Paola, P.; De Ruggiero, M.; Musolino, M. Market Price Premium for Green Buildings. In New Metropolitan Perspectives—Knowledge Dynamics and Innovation-Driven Policies Towards Urban and Regional Transition; Bevilacqua, C., Calabrò, F., Della Spina, L., Eds.; Springer: Cham, Switzerland; Berlin, Germany, 2021; Volume 178, pp. 1237–1247. ISBN 978-3-030-48278-7. [Google Scholar]
  11. Massimo, D.E.; Del Giudice, V.; Malerba, A.; Bernardo, C.; Musolino, M.; De Paola, P. Valuation of Ecological Retrofitting Technology in Existing Buildings: A Real-World Case Study. Sustainability 2021, 13, 7001. [Google Scholar] [CrossRef]
  12. Massimo, D.E.; De Paola, P.; Musolino, M.; Malerba, A.; Del Giudice, F.P. Green and Gold Buildings? Detecting Real Estate Market Premium for Green Buildings through Evolutionary Polynomial Regression. Buildings 2022, 12, 621. [Google Scholar] [CrossRef]
  13. Rachmawati, D.; Shukri, S.; Azam, S.; Khatibi, A. Factors influencing customers’ purchase decision of residential property in Selangor, Malaysia. Manag. Sci. Lett. 2019, 9, 1341–1348. [Google Scholar] [CrossRef]
  14. Szopinska, K.; Krajewska, M. Methods of Assessing Noise Nuisance of Real Estate Surroundings. Real Estate Manag. Valuat. 2016, 24, 19–30. [Google Scholar] [CrossRef]
  15. De Nadai, M.; Lepri, B. The economic value of neighborhoods: Predicting real estate prices from the urban environment. In Proceedings of the 2018 IEEE 5th International Conference on Data Science and Advanced Analytics (DSAA), Turin, Italy, 1–3 October 2018. [Google Scholar]
  16. Morano, P.; Tajani, F.; Di Liddo, F.; Darò, M. Economic evaluation of the indoor environmental quality of buildings: The noise pollution effects on housing prices in the city of Bari (Italy). Buildings 2021, 11, 213. [Google Scholar] [CrossRef]
  17. Carmona, M. Place value: Place quality and its impact on health, social, economic and environmental outcomes. J. Urban Des. 2019, 24, 1–48. [Google Scholar] [CrossRef]
  18. Del Giudice, V.; De Paola, P.; Morano, P.; Tajani, F.; Del Giudice, F.P. A Multidimensional Evaluation Approach for the Natural Parks Design. Appl. Sci. 2021, 11, 1767. [Google Scholar] [CrossRef]
  19. Costa, R.; De Valk, H.A. Ethnic and socioeconomic segregation in Belgium: A multiscalar approach using individualised neighbourhoods. Eur. J. Popul. 2018, 34, 225–250. [Google Scholar] [CrossRef]
  20. Forte, F.; Antoniucci, V.; De Paola, P. Immigration and the Housing Market: The Case of Castel Volturno, in Campania Region, Italy. Sustainability 2018, 10, 343. [Google Scholar] [CrossRef]
  21. Kazak, J.; van Hoof, J.; Świąder, M.; Szewrański, S. Real estate for the ageing society—The perspective of a new market. Real Estate Manag. Valuat. 2017, 25, 13–24. [Google Scholar] [CrossRef]
  22. Del Giudice, V.; De Paola, P.; Del Giudice, F.P. COVID-19 Infects Real Estate Markets: Short and Mid-Run Effects on Housing Prices in Campania Region (Italy). Soc. Sci. 2020, 9, 114. [Google Scholar] [CrossRef]
  23. Montero, J.M.; Minguez, R.; Fernandez, A.; Fernandez-Aviles, G. Housing price prediction: Parametric versus semi-parametric spatial hedonic models. J. Geogr. Syst. 2018, 20, 27–55. [Google Scholar] [CrossRef]
  24. Del Giudice, V.; Massimo, D.E.; De Paola, P.; Forte, F.; Musolino, M.; Malerba, A. Post Carbon City and Real Estate Market: Testing the Dataset of Reggio Calabria Market Using Spline Smoothing Semiparametric Method. In New Metropolitan Perspectives. ISHT 2018. Smart Innovation, Systems and Technologies; Calabrò, F., Della Spina, L., Bevilacqua, C., Eds.; Springer: Cham, Switzerland, 2019; pp. 206–214. [Google Scholar]
  25. Opsomer, J.D.; Claeskens, G.; Ranalli, M.G.; Kauermann, G.; Breidt, F.J. Non-parametric small area estimation using penalized spline regression. J. R. Stat. Soc. 2008, 70, 265–286. [Google Scholar] [CrossRef]
  26. Ruppert, D.; Wand, M.P.; Carroll, R.J. Semiparametric Regression; Cambridge Series in Statistical and Probabilistic Mathematics; Cambridge University Press: Cambridge, UK, 2003; ISBN 9780511755453. [Google Scholar] [CrossRef]
  27. Wang, Y. Smoothing Splines: Methods and Applications; Chapman and Hall/CRC: Boca Raton, FL, USA, 2019. [Google Scholar] [CrossRef]
  28. Del Giudice, V.; Manganelli, B.; De Paola, P. Hedonic analysis of housing sales prices with semiparametric methods. Int. J. Agric. Environ. Inf. Syst. 2017, 8, 65–77. [Google Scholar] [CrossRef]
  29. Van der Heide, C.M.; Heijman, W.J. Landscape and economics: Perceptions and perspectives. In The Economic Value of Landscapes; Van der Heide, C.M., Heijman, W., Eds.; Routledge: New York, NY, USA, 2013; pp. 25–44. [Google Scholar]
  30. Trojanek, R.; Gluszak, M.; Tanas, J. The effect of urban green spaces on house prices in Warsaw. Int. J. Strat. Prop. Manag. 2018, 22, 358–371. [Google Scholar] [CrossRef]
  31. Liebelt, V.; Bartke, S.; Schwarz, N. Urban Green Spaces and Housing Prices: An Alternative Perspective. Sustainability 2019, 11, 3707. [Google Scholar] [CrossRef]
  32. Sirmans, G.S.; MacDonald, L.; Macpherson, D.A.; Zietz, E.N. The value of housing characteristics: A meta analysis. J. Real Estate Financ. Econ. 2006, 33, 215–240. [Google Scholar] [CrossRef]
  33. Wyman, D.; Hutchison, N.; Tiwari, P. Testing the waters: A spatial econometric pricing model of different waterfront views. J. Real Estate Res. 2014, 36, 363–382. [Google Scholar] [CrossRef]
  34. Dumm, R.E.; Sirmans, G.S.; Smersh, G.T. Price variation in waterfront properties over the economic cycle. J. Real Estate Res. 2016, 38, 1–26. [Google Scholar] [CrossRef]
  35. Dahal, R.P.; Grala, R.K.; Gordon, J.S.; Munn, I.A.; Petrolia, D.R.; Cummings, J.R. A hedonic pricing method to estimate the value of waterfronts in the Gulf of Mexico. Urban For. Urban Green. 2019, 41, 185–194. [Google Scholar] [CrossRef]
  36. Kim, C.W.; Phipps, T.T.; Anselin, L. Measuring the Benefits of Air Quality Improvement: A Spatial Hedonic Approach. J. Environ. Econ. Manag. 2003, 45, 24–39. [Google Scholar] [CrossRef]
  37. Anselin, L.; Le Gallo, J. Interpolation of air quality measures in hedonic house price models: Spatial aspects. Spat. Econ. Anal. 2006, 1, 31–52. [Google Scholar] [CrossRef]
  38. Del Giudice, V.; De Paola, P.; Manganelli, B.; Forte, F. The Monetary Valuation of Environmental Externalities through the Analysis of Real Estate Prices. Sustainability 2017, 9, 229. [Google Scholar] [CrossRef]
  39. Riccioli, F.; Fratini, R.; Boncinelli, F. The impacts in real estate of landscape values: Evidence from Tuscany (Italy). Sustainability 2021, 13, 2236. [Google Scholar] [CrossRef]
  40. Jim, C.Y.; Chen, W.Y. Value of scenic views: Hedonic assessment of private housing in Hong Kong. Landsc. Urban Plan. 2009, 91, 226–234. [Google Scholar] [CrossRef]
  41. Hui, E.C.M.; Zhong, J.W.; Yu, K.H. The impact of landscape views and storey levels on property prices. Landsc. Urban Plan. 2011, 105, 86–93. [Google Scholar] [CrossRef]
  42. Turan, I.; Chegut, A.; Fink, D.; Reinhart, C. Development of view potential metrics and the financial impact of views on office rents. Landsc. Urban Plan. 2021, 215, 104193. [Google Scholar] [CrossRef]
  43. Baranzini, A.; Schaerer, C. A sight for sore eyes: Assessing the value of view and land use in the housing market. J. Hous. Econ. 2011, 20, 191–199. [Google Scholar] [CrossRef]
  44. Damigos, D.; Anyfantis, F. The value of view through the eyes of real estate experts: A Fuzzy Delphi Approach. Landsc. Urban Plan. 2011, 101, 171–178. [Google Scholar] [CrossRef]
  45. Castro Noblejas, H.; Vías Martínez, J.; Mérida Rodríguez, M.F. Relation between the Views and the Real Estate Application to a Mediterranean Coastal Area. ISPRS Int. J. Geo-Inf. 2022, 11, 365. [Google Scholar] [CrossRef]
  46. Vizzari, M. Spatial Modelling of Potential Landscape Quality. Appl. Geogr. 2011, 31, 108–118. [Google Scholar] [CrossRef]
  47. Kiel, K.A.; Zabel, J.E. Location, location, location: The 3L Approach to house price determination. J. Hous. Econ. 2008, 17, 175–190. [Google Scholar] [CrossRef]
  48. D’Acci, L. Monetary, subjective and quantitative approaches to assess urban quality of life and pleasantness in cities (Hedonic Price, Willingness-to-Pay, Positional Value, Life Satisfaction, Isobenefit Lines). Soc. Indic. Res. 2014, 115, 531–559. [Google Scholar] [CrossRef]
  49. Chiang, Y.H.; Peng, T.C.; Chang, C.O. The nonlinear effect of convenience stores on residential property prices: A case study of Taipei, Taiwan. Habitat Int. 2015, 46, 82–90. [Google Scholar] [CrossRef]
  50. Jang, M.; Kang, C.D. Retail accessibility and proximity effects on housing prices in Seoul, Korea: A retail type and housing submarket approach. Habitat Int. 2015, 49, 516–528. [Google Scholar] [CrossRef]
  51. Hui, E.C.M.; Chau, C.K.; Pun, L.; Law, M.Y. Measuring the neighboring and environmental effects on residential property value: Using spatial weighting matrix. Build. Environ. 2007, 42, 2333–2343. [Google Scholar] [CrossRef]
  52. Jim, C.Y.; Chen, W.Y. External effects of neighborhood parks and landscape elements on high-rise residential value. Land Use Policy 2010, 27, 662–670. [Google Scholar] [CrossRef]
  53. Xiao, Y.; Chen, X.; Li, Q.; Yu, X.; Chen, J.; Guo, J. Exploring determinants of housing prices in Beijing: An enhanced hedonic regression with open access POI Data. ISPRS Int. J. Geo-Inf. 2017, 6, 358. [Google Scholar] [CrossRef]
  54. Malpezzi, S.; Gibb, K.; O’Sullivan, A. Hedonic Pricing Models: A Selective and Applied Review; Blackwell Science: Oxford, UK, 2002. [Google Scholar] [CrossRef]
  55. Sirmans, S.; Macpherson, D.; Zietz, E. The Composition of Hedonic Pricing Models. J. Real Estate Lit. 2005, 13, 1–44. [Google Scholar] [CrossRef]
  56. Cellmer, R. Points of Interest and Housing Prices. Real Estate Manag. Valuat. 2023, 31, 69–77. [Google Scholar] [CrossRef]
  57. Grundel, I.; Christenson, N.; Dahlström, M. Identifying interests and values in forest areas through collaborative processes and landscape resource analysis. For. Policy Econ. 2022, 142, 102801. [Google Scholar] [CrossRef]
  58. Martín, R.; Yepes, V. Economic Valuation of Landscape in Marinas: Application to a Marina in Spanish Southern Mediterranean Coast (Granada, Spain). Land 2022, 11, 1400. [Google Scholar] [CrossRef]
  59. Tagliafierro, C.; Longo, A.; Van Eetvelde, V.; Antrop, M.; Hutchinson, W.G. Landscape economic valuation by integrating landscape ecology into landscape economics. Environ. Sci. Policy 2013, 32, 26–36. [Google Scholar] [CrossRef]
  60. Andalusian Institute of Statistics and Cartography. Available online: https://www.juntadeandalucia.es (accessed on 10 March 2023).
  61. Idealista, S.A. Available online: http://www.idealista.es (accessed on 10 April 2023).
  62. European Valuation Standards (EVS). Available online: http://www.tegova.org (accessed on 1 October 2022).
  63. Council of Europe. European Landscape Convention; Council of Europe: Florence, Italy, 2000; Available online: https://www.coe.int/en/web/landscape/text-of-the-european-landscape-convention (accessed on 1 February 2023).
  64. Jones, C.D.; Patterson, M.E.; Hammitt, W.E. Evaluating the construct validity of sense of belonging as a measure of landscape perception. J. Leis. Res. 2000, 32, 383–395. [Google Scholar] [CrossRef]
  65. Antrop, M. Why landscapes of the past are important for the future. Landsc. Urban Plan. 2005, 70, 21–34. [Google Scholar] [CrossRef]
  66. Jones, P.; Isakjee, A.; Jam, C.; Lorne, C.; Warren, S. Urban landscapes and the atmosphere of place: Exploring subjective experience in the study of urban form. Urban Morphol. 2017, 21, 29–40. Available online: http://www.urbanform.org/online_unlimited/pdf2017/201721_29.pdf (accessed on 23 January 2023). [CrossRef]
  67. Swanwick, C. Society’s attitudes to and preferences for land and landscape. Land Use Policy 2009, 26, S62–S75. [Google Scholar] [CrossRef]
  68. Zhen, Z.; Ma, M.; Shao, Z.; Han, C.; Bu, X. A study of demographic difference in external visual preference evaluation of Chinese detached house. J. Asian Archit. Build. Eng. 2020, 19, 151–165. [Google Scholar] [CrossRef]
  69. Conroy, S.J.; Milosch, J.L. An estimation of the coastal premium for residential housing prices in San Diego County. J. Real Estate Financ. Econ. 2011, 42, 211–228. [Google Scholar] [CrossRef]
  70. Major, C.; Lusht, K. Beach Proximity and the Distribution of Property Values in Shore Communities. Apprais. J. 2004, 72, 333. [Google Scholar]
  71. QGIS 3.28.5 ‘Firenze’ Software. Available online: http://www.qgis.org (accessed on 1 November 2022).
  72. ArcMap Software. Available online: https://desktop.arcgis.com (accessed on 1 November 2022).
  73. OpenStreetMap Software. Available online: https://openstreetmap.org (accessed on 1 November 2022).
  74. Digital Surface Model of Spain. Available online: https://datos.gob.es (accessed on 1 November 2022).
  75. Kammann, E.; Wand, M. Geoadditive models. J. R. Stat. Soc. Ser. C (Appl. Stat.) 2003, 52, 1–18. [Google Scholar] [CrossRef]
  76. Hastie, T. Pseudosplines. J. R. Stat. Soc. Ser. B (Methodol.) 1996, 58, 379–396. [Google Scholar] [CrossRef]
  77. R Software. Available online: https://www.r-project.org (accessed on 1 December 2022).
  78. De Paola, P.; Del Giudice, V.; Massimo, D.E.; Forte, F.; Musolino, M.; Malerba, A. Isovalore Maps for the Spatial Analysis of Real Estate Market: A Case Study for a Central Urban Area of Reggio Calabria, Italy. In New Metropolitan Perspectives ISHT 2018. Smart Innovation, Systems and Technologies; Calabrò, F., Della Spina, L., Bevilacqua, C., Eds.; Springer: Cham, Switzerland, 2019; Volume 100. [Google Scholar] [CrossRef]
  79. De Paola, P.; Del Giudice, V.; Massimo, D.E.; Del Giudice, F.P.; Musolino, M.; Malerba, A. Green Building Market Premium: Detection Through Spatial Analysis of Real Estate Values. A Case Study. In New Metropolitan Perspectives. NMP 2020. Smart Innovation, Systems and Technologies; Bevilacqua, C., Calabrò, F., Della Spina, L., Eds.; Springer: Cham, Switzerland, 2021; Volume 178. [Google Scholar] [CrossRef]
  80. Robert, S. Assessing the visual landscape potential of coastal territories for spatial planning. A case study in the French Mediterranean. Land Use Policy 2018, 72, 138–151. [Google Scholar] [CrossRef]
Figure 1. Properties sampled in Marbella and highlighted with orange dots (source: authors’ elaboration based on the cartography provided by Andalusian Institute of Statistics and Cartography [60]).
Land 12 00987 g001
Figure 2. Evolution of the average housing unit prices in Marbella [61].
Land 12 00987 g002
Figure 3. Percentage of the houses with a landscape view, with an indication of landscape components (source: authors’ elaboration).
Land 12 00987 g003
Figure 4. Percentage of the houses with views exceeding 50% of each view type (source: authors’ elaboration).
Land 12 00987 g004
Figure 5. Spatial distribution of the knots placement and locations of the sampled houses (source: authors’ elaboration).
Land 12 00987 g005
Figure 6. Map of the real estate isovalues (source: authors’ elaboration).
Land 12 00987 g006
Table 1. Variables description.
VariableDescription
Housing sales price (PRICE)Expressed in euros
Commercial area, the sum of the internal area and other virtualized secondary surfaces (AREA)Expressed in square meters
Housing unit sales price (UPRICE)Expressed in euros
per square meter
(UPRICE = PRICE/AREA)
Landscape views (VIEW)Expressed in square meters for each view (natural environment, sea, old town, other)
Qualitative segment of the real estate market (TYPE)Three levels: lower-middle, upper-middle, luxury
Euclidian distance to the sea (DIST)Expressed in meters
Source: authors’ elaboration.
Table 2. Statistical description of the variables.
IndexUPRICEXCOORDYCOORDDISTNTVIEWSVIEWHVIEWOVIEW
Mean 3639.818332.9545024.04206881137.0673,008,938.235,686,5761755.7692608,186.41
Std. error52.9019560.02426877.549 × 10−543.180856123,399.032,347,550.5213.0625860,654.215
Median3676.789332.9769174.0421237892,640,52512,581,4500169 075
Std. deviation1061.99940.48719150.0015155866.849642,477,218.347,126,7474277.20141,217,624.9
Kurtosis0.758461.09352510.082315−1.40456710.12561480.6170695.748699916.900864
Asymmetry−0.36995970.6049463−0.78667550.34754250.71223251.33607712.60721923.8223405
Range6954.34282.3520830.005938276412,782,600165,089,80022,6508,091,100
Minimum178.4115832.0479474.03859136000175
Maximum7132.754434.400034.044529280012,782,600165,089,80022,6508,091,275
Confidence interval (95.0%)103.999040.04770950.000148484.888496242,588.024,615,008.8418.85603119,239.07
Table 3. The model’s main results with the estimation of fixed effects for the linear and nonlinear model components.
VariableCoefficientSERatiop-Value
Intercept5.375 × 1055.402 × 1060.099510.9207
NTVIEW−7.583 × 10−52.270 × 10−5−3.341000.0009
SVIEW2.470 × 10−61.846 × 10−61.338000.1811
HVIEW−1.136 × 10−21.617 × 10−2−0.702400.4826
OVIEW8.084 × 10−58.555 × 10−50.945000.3448
VariabledfsparKnots
f (XCOORD, YCOORD)12.68264.800034
f (DIST)18.120.1086100
Table 4. Quantitative relevance attributable to each landscape element with respect to the others.
Other ViewsSea ViewsNatural Land ViewsOld Town Views
Other views1.00 32.73−1.07−0.01
Sea views0.031.00 −0.030.00
Natural land views−0.94−30.701.00 0.01
Old town views−140.52−4599.19149.811.00
Disclaimer/Publisher’s Note: The statements, opinions and data contained in all publications are solely those of the individual author(s) and contributor(s) and not of MDPI and/or the editor(s). MDPI and/or the editor(s) disclaim responsibility for any injury to people or property resulting from any ideas, methods, instructions or products referred to in the content.

