Abstract
With climate change, Nitrogen deposition (ND) and carbon dioxide (CO2) have increased significantly, but the effects of ND and CO2 fertilization on carbon-use efficiency (CUE) and water-use efficiency (WUE) are still unclear. Therefore, the effects of ND and CO2 on CUE and WUE are studied by means of trend analysis and partial derivatives. The results show the following: (1) From 2000 to 2020, the mean CUE in China was 0.533, and the WUE was 1.235 g C kg−1 H2O. (2) In the study area, a 53.8% CUE and 61.8% WUE showed an upward trend, and ND enhanced the positive contribution of CO2 to CUE and WUE by 15.9% and 19.3%, respectively. (3) ND explained 48.1% and 56% of the increase in CUE and WUE, respectively, and CO2 explained 45.8% and 50.1% of the increases in CUE and WUE, respectively. (4) The areas dominated by ND and CO2 accounted for 43.9% and 12.7% of the total area, respectively, highlighting the importance of ND in the driving mechanism of CUE and WUE. The research results are helpful to further research in CUE and WUE.
1. Introduction
Vegetation carbon-use efficiency (CUE) and water-use efficiency (WUE) are useful indicators for assessing carbon-sequestration and plant water-use patterns, which are important parameters for forming ecosystem carbon and water storage [1,2]. The value of CUE is the ratio of net primary productivity (NPP) to total primary productivity (GPP) [3]. WUE connects the cycles of water and carbon, which is a key parameter for understanding the two [4,5]. Water resources are regarded as the biggest obstacle to regional high-quality development, and improving the utilization efficiency of water resources is an effective way to deal with the increasingly serious water shortage [6].
In recent years, the increase of CO2 concentration, temperature [7,8], drought, and other climate changes have seriously affected the carbon and water exchange of terrestrial ecosystems [9]. CO2 fertilization can regulate the carbon allocation of the biomass of each component of the vegetation and change the demand for autotrophic respiration (Ra) of the vegetation, thereby increasing the CUE [10,11]. In addition, nitrogen deposition (ND) also affects the CUE [12,13]. More and more studies show that CUE changes with the changes of vegetation type, climate, nitrogen deposition, and other factors [14,15]. The eco-physiological characteristics of leaves show that WUE increases with an increase in atmospheric CO2 concentration, which is called the “CO2 fertilizer effect” [16,17]. Increasing the CO2 concentration increases WUE by decreasing transpiration rate [18]. On the leaf scale, WUE depends on the supply of water and nitrogen in addition to the CO2 in the atmosphere [19]. ND is an important factor in promoting WUE [20,21]. An increase in ND decreases stomatal conductance, leading to reduced transpiration, and its influence on the total primary productivity (GPP) determines the change in WUE [22,23,24]. ND and CO2 have an important influence on CUE and WUE, however, it is still unclear how much of an impact they have on CUE and WUE. Therefore, it is necessary to quantitatively evaluate the impact of ND and CO2 fertilization on CUE and WUE.
The purpose of this study aims to investigate the responses of CUE and WUE in China to ND and CO2 from 2000 to 2020. The specific objectives are as follows: (1) Analyze the spatial-distribution and temporal-trend characteristics of CUE and WUE in China. (2) Elucidate the effects of ND and CO2 on CUE and WUE. (3) Reveal the dominant areas and contribution rate of ND and CO2 and the residual factors for CUE and WUE. This study is of great significance for enriching the relevant research on CUE and WUE.
2. Data and Methods
2.1. Study Area
Based on the characteristics of geographic location, physical geography, and human geography, the research area was divided into four regions: the southern region, Qinghai–Tibet region, northern region, and northwestern region (Figure 1). The Qinling Mountains and the Huaihe River are the dividing line between the northern and southern regions, whereas the Daxinganling-Yinshan-Helan Mountain is the dividing line between the northern region and the northwestern region. The four Qinghai–Tibet, northwest, north, and south areas of the study area are roughly divided by the first and second ladders. The northern region is the northern part of China’s monsoon climate zone, while the southern region is the southern part of the monsoon climate zone. Northwest China is a non-monsoon region, located west of the 400 mm annual isoprecipitation line, and the Qinghai–Tibet region is a unique geographical unit with a high altitude and cold climate.
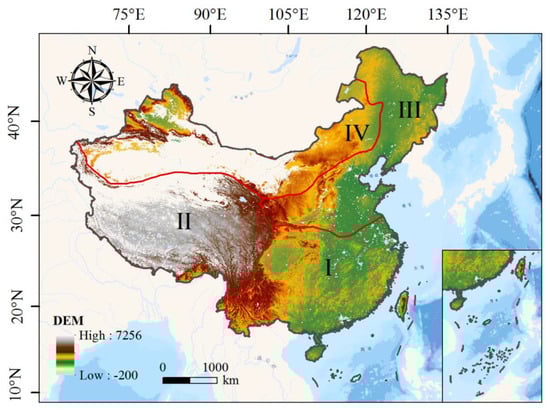
Figure 1.
Spatial distribution of DEM elevation maps in China. I, II, III, and IV represent the southern region, the Qinghai–Tibet region, the northern region, and the northwestern region, respectively.
2.2. CUE and WUE Calculations
Vegetation CUE describe the relationship between photosynthesis and respiration [25,26]. WUE refers to the carbon assimilation rate per unit water loss [27]. The calculation formulas for both are as follows:
where CUE (dimensionless) is carbon-use efficiency, and WUE (g C kg−1 H2O) is water-use efficiency. GPP (g C m−2), NPP (g C m−2), and ET (kg−1 H2O m−2) are gross primary productivity, net primary productivity, and evapotranspiration, respectively.
2.3. Data Sources
The 2000–2020 GPP and NPP data were obtained from MOD17A3 with a resolution of 1 km, an interval of 8 days, and a scale factor of 0.1 (Figure S1), with data from NASA (https://search.earthdata.nasa.gov/search, accessed on 12 October 2021). MODIS data are widely used in studies related to gross primary productivity and net primary productivity [28,29]. NPP site data were compiled by the Global Primary Production Data Initiative (GPPDI) from the website: https://daac.ornl.gov/cgi-bin/, (accessed on 21 August 2021). GPP site data come from the website: https://fluxnet.fluxdata.org/, (accessed on 5 August 2021), and the eddy covariance measurements at the basis of this product were collected and harmonized in the LaThuile FLUX NETwork (FLUXNET) synthesis database. Evapotranspiration data were collected from the monthly evapotranspiration dataset at 0.25° resolution from the GLDAS Noah 2.1 dataset of the Goddard Geoscience Data and Information Service (GES DISC) (https://disc.gsfc.nasa.gov/datasets, accessed on 5 January 2022). GLDAS data combine satellite and ground observations to provide multiple types of high-quality datasets using land-surface models (LSM) and data-assimilation techniques [30].
Nitrogen dioxide (NO2) column concentration is based on satellite observations using differential optical-absorption spectroscopy technology, and the Royal Netherlands Meteorological Institute combined modeling, retrieval, assimilation methods data from three sensors: GOME (Global Ozone Monitoring Experiment), SCIAMAHY (Scanning Imaging Absorption Spectrometer for Atmospheric Mapping), and GOME-2 (METOP-A) (Global Ozone Monitoring Experiment-2) (http://www.temis.nl/airpollution/no2.html, accessed on 20 January 2022). The CO2 concentration comes from the Copernicus Atmosphere Monitoring Service (CAMS) global inversion-optimised greenhouse-gas fluxes and concentrations (https://ads.atmosphere.copernicus.eu/cdsapp#!/dataset/cams-global-greenhouse-gas-inversion?tab=overview, accessed on 11 December 2021). DEM elevation data were calculated using a digital elevation model (https://topex.ucsd.edu, accessed on 10 February 2022) (Figure 1), the spatial resolution is 1000 m × 1000 m.
2.4. Methods
2.4.1. Nitrogen Deposition Model
We referred to the model of Lu et al. [31] and established a pixel-by-pixel spatial linear-regression model based on the existing ND data and NO2 column concentration, precipitation, temperature, relative humidity, wind speed, etc. The reference formula is as follows:
where Ndep is nitrogen deposition, a0, a1, a2, a3, a4, b are the regression coefficients of the linear equation; T is the surface temperature; P is precipitation; H is relative humidity; W is wind speed; and C is the concentration of NO2 column.
2.4.2. Trend Analysis
We used ordinary least-squares regression for each cell to determine the slope value: linear-trend estimation was used to analyze the time dynamics of CUE, WUE, and various factors, and the statistical test of the correlation coefficient was used to evaluate the significant-change trend [32,33]. Its linear-trend value was estimated using the least-squares method.
where n is the time span of 21 years from 2000 to 2020, is the CUE value of year i, i = 2000, 2001, …, 2020. At the same time, we used the same method to analyze the changing trend of factors such as , , , etc. If the correlation coefficient of the regression equation passed a significant confidence level of 0.05 (p < 0.05), it falls or increases to a significantly very important level.
2.4.3. Partial Derivatives of ND and CO2 Effects on CUE and WUE
The 2000–2020 CUE and WUE responses to Nitrogen deposition (ND), carbon dioxide (CO2), and Residual factor (Resi) were preliminarily calculated. They were expressed as the partial derivative of multiple linear regression [34,35].
where is the , , and Resicon, respectively, represent the contribution of ND, CO2, and Resi to the change of CUE. Derived from Equation (5), the changes in ND, CO2, and Resi factors related to the long-term change of CUE can be expressed by the following formula:
Among them, represents the linear trends of nitrogen deposition [36] and represents the impact of ND on CUE from 2000 to 2020. To compare the impact of other drivers on CUE, Equation (6) was also applied to the sensitivity and long-term trend estimates of annual mean ND, CO2, and Resi. Therefore, Formula (6) can be further rewritten as [37]:
Here is the contribution of ND on CUE, is the contribution of CO2 on CUE, and is the contribution of the residual factors to CUE. The influence of other factors on WUE was calculated in the same way, with (5) quantizing each pixel on a 1 km × 1 km spatial window. Therefore, in this study, we mainly considered the contributions of ND and CO2 to CUE and WUE, and all other factors that would affect CUE and WUE were classified as residual factors.
2.4.4. Analysis of CO2 Enhancement by Nitrogen Deposition
We calculated the area proportion of net ND enhanced CO2 to CUE (SNC). That is, ND (positive contribution) enhances the contribution of CO2 (positive contribution) to the change in CUE [38]. The same approach was used for the contribution of ND enhanced CO2 to WUE, calculated as follows:
where SNC is the proportion of ND enhanced CO2 contribution to CUE, is the contribution area of ND to CUE, is the contribution area of CO2 to CUE, is the positive contribution area of ND to CUE change, is the positive contribution area of CO2 to CUE, is the negative contribution area of ND on CUE, and is the negative contribution area of CO2 impact on CUE.
2.4.5. Assessing the Relative Contributions of ND and CO2
is the contribution rate of ND to CUE, is the contribution rate of CO2 to CUE, and , , and represent the contributions of ND, CO2, and Resi to CUE, respectively. The same method was used to calculate the contribution rate of each factor to WUE. In addition to ND and CO2 affecting CUE and WUE, factors such as climatic factors, human activities, and extreme weather all affect CUE and WUE. Therefore, in this study, all other influencing factors were classified as residual factors [39].
3. Results and Analysis
3.1. Spatial and Temporal Distribution Characteristics
From a spatial point of view, the average CUE in China from 2000 to 2020 is 0.533, which is high in the west and low in the east, and the high-value area is distributed in the Qinghai–Tibet region at 0.62 (Figure 2a). Mainly because the environment in the Qinghai–Tibet Plateau is relatively cold and dry, plants in this environment have a strong carbon-storage capacity, and energy consumption for plant growth is low [40]. In addition, the vegetation types in the Qinghai–Tibet Plateau mainly consist of alpine meadows, alpine grasslands, alpine shrubs, etc. Generally, the CUE of shrub and herb ecosystems is higher than that of forests, so the CUE of this region is higher than that of other regions [41]. The average value of WUE in China is 1.235 g C kg−1 H2O, which is low in the west and high in the east, and the low-value area is mainly distributed in the Qinghai–Tibet region of 0.656 g C kg−1 H2O (Figure 2b). Low CO2 partial pressure, low air temperature, and a high altitude-limited plant growth lead to lower WUE [42]. The high-value area of WUE is mainly distributed in the southern area of 1.714 g C kg−1 H2O, because the vegetation in this area is relatively lush, which can intercept more solar radiation and utilize more soil, thereby, promoting plant growth [43]. It is worth noting that the high-value area of CUE is exactly the low-value area of WUE. From the perspective of latitude, the high-value areas of CUE are mainly distributed in the mid-latitude areas, and the low-value areas of WUE are mainly located in the mid-latitude areas, mainly because the Qinghai–Tibet region is located in the mid-latitude areas, resulting in higher CUE and lower WUE (Figure 2c,d).
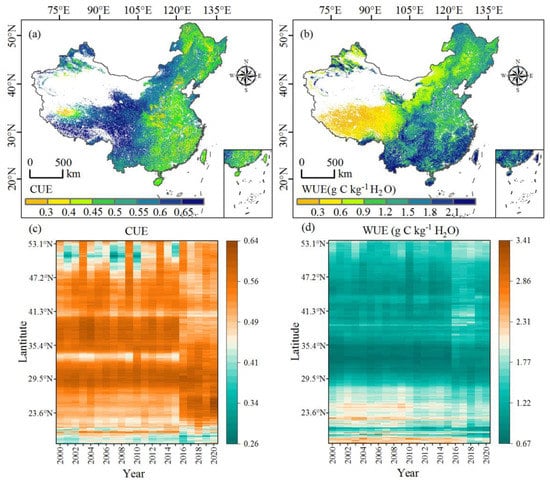
Figure 2.
Spatial–distribution and latitudinal-variation characteristics of CUE and WUE in China from 2000 to 2020. (a,b) Spatial–distribution characteristics of CUE and WUE, (c,d) Latitudinal-variation characteristics of CUE and WUE.
During the study period, the CUE in China showed an increasing trend of 0.2 × 10⁻³ yr−1 (Figure 3a), and the most obvious increase trend was 1.5 × 10⁻³ yr−1 in the southern region, which was nearly 7 times the growth trend of the entire study area (Table S1). A total of 56.9% of the regions of CUE passed the significance test (Figure 3c). The CUE of 53.8% showed an increasing trend, and the CUE of 46.2% showed a decreasing trend. China’s WUE showed an increasing trend of 3.3 × 10⁻³ g C kg−1 H2O yr−1 (Figure 3b), north (12 × 10−3 g C kg−1 H2O yr−1) and northwest (13 × 10−3 g C kg−1 H2O yr−1) showed an increasing trend, which was nearly 4 times that of China (Table S1). Fifty-four-point-two percent of WUE passed the significance test (Figure 3d). The WUE of 61.8% showed an increasing trend, and the WUE of 38.2% showed a decreasing trend (Table 1). Significant increases in WUE in temperate and boreal forests in the northern hemisphere followed past increases in atmospheric-carbon-dioxide concentrations [5]. Elevated CO2 concentration increases plant water-use efficiency by reducing transpiration rate [18].
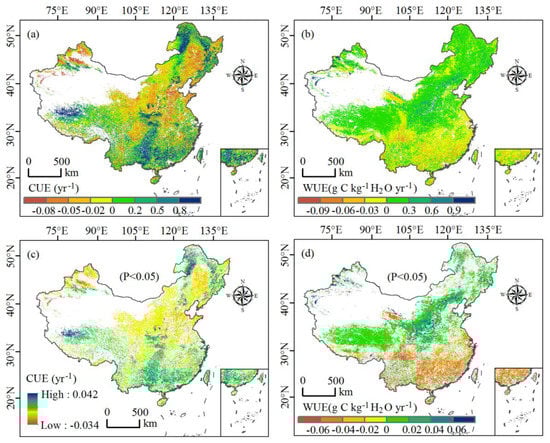
Figure 3.
The g trend of CUE and WUE in China and the layers passing the significance test. (a,b) is the trend of CUE and WUE, (c,d) is the trend chart of CUE and WUE passing the significance test.

Table 1.
CUE and WUE trends in different areas. Qinghai–Tibet Plateau: QT; South area: SA; North area: NA; Northwest area: NW.
3.2. Effects of ND and CO2 on CUE and WUE
Here, we analyzed the correlations of ND and CO2 with CUE and WUE (Figure 4). Fifty-two percent of ND was positively correlated with CUE, while 56% of ND was positively correlated with WUE, and the regions with positive correlation between the two were mainly distributed in the northern region (Figure 4a,b). ND in eastern China has a great impact on CUE and WUE, which is consistent with previous studies [44]. Temperate forests are generally considered nitrogen-limited, and nitrogen additions can significantly increase productivity [45]. A Nitrogen increase is the main reason for the obvious impact on CUE and WUE in areas with high nitrogen demand [46]. Fifty-four-point-two percent of CO2 is positively correlated with CUE and mainly distributed in the southern region. Fifty-point-one percent of CO2 was positively correlated with WUE and mainly distributed in northern and Qinghai–Tibet regions. Increases in atmospheric CO2 have strong effects on ecosystem processes in temperate forests [5]. Although CO2 in the northern region was negatively correlated with CUE, ND complemented the negatively correlated region, making the ND in the northern region positively correlate with CUE. CO2 was negatively correlated with WUE in most of the southern regions, but ND also complemented the negatively correlated regions, making ND positively correlated with WUE.
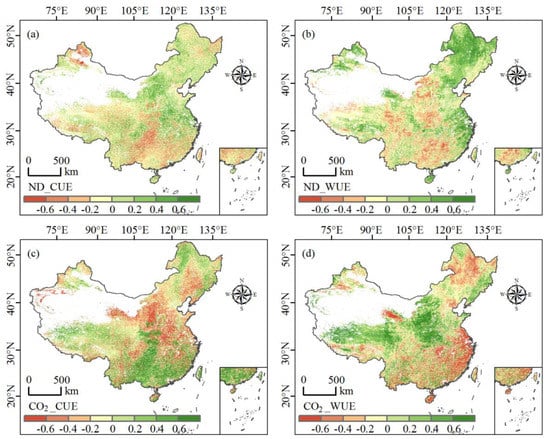
Figure 4.
Effects of ND and CO2 on CUE and WUE. (a,b) The effects of ND on CUE and WUE, and (c,d) the effects of CO2 on CUE and WUE.
3.3. ND and CO2 for CUE and WUE Main Control Area
Contributions of ND and CO2 to CUE and WUE show significant spatial differences (Figure 5). The positive contribution of ND to CUE accounted for 48.1% of the total area, mainly in the northern region, and the positive contribution of CO2 to CUE accounted for 45.8% of the total area, mainly in the southern region. Fifty-six percent of the total area of the region where ND contributed positively to WUE was mainly distributed in the northern region, and the region with a positive contribution of CO2 to WUE accounted for 50.1% of the total area, mainly in the Qinghai–Tibet and northern regions.
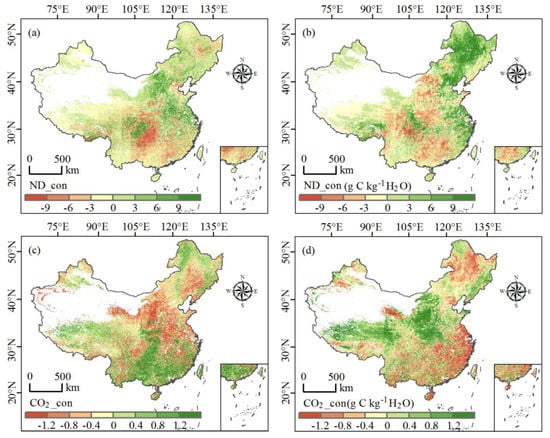
Figure 5.
Contribution of ND and CO2 to CUE and WUE. (a,b) Contribution of ND to CUE and WUE, (c,d) Contribution of CO2 to CUE and WUE.
To determine the main factors controlling the variation of CUE and WUE in China, here, we considered the effect of the residual factors on CUE and WUE. As shown in Figure 6, among the effects of the three factors on CUE, the areas dominated by ND_con, CO2_con, and Resi_con accounted for 43.9%, 12.7%, and 43.4% of the total area, respectively (Table 2). It shows that ND is the main factor affecting the change of CUE; ND mainly controls the CUE in the north and northwest regions. In addition, the influence of CO2 on the CUE in the Qinghai–Tibet region is very important. As far as WUE is concerned, the areas dominated by ND_con, CO2_con, and Resi_con account for 50.9%, 14.1%, and 35% of the total area, respectively (Table 2). ND has the largest control area of WUE in the entire region, and CO2 controls WUE mainly in the Qinghai–Tibet region.
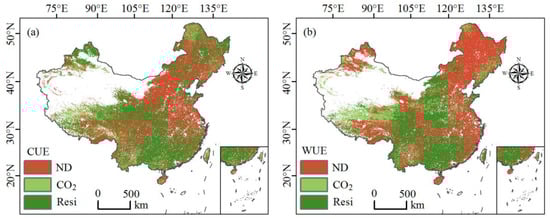
Figure 6.
ND and CO2 and residual factors for the main control area of CUE and WUE. (a) ND and CO2 and residual factors for the main control area of CUE, (b) ND and CO2 and residual factors for the main control area of WUE.
Table 2.
Main control area and the rate of contribution of ND, CO2, and Resi in different areas to CUE and WUE. Qinghai–Tibet Plateau: QT; South area: SA; North area: NA; Northwest area: NW.
3.4. Contribution of Rates ND, CO2, and Residual Factors to CUE and WUE
The contribution rate of ND to CUE and WUE is 43.7% and 44.05%, respectively; the contribution rate of CO2 to CUE and WUE is relatively small, 17.1% and 16.04%, respectively; the contribution rate of the remaining factors to CUE and WUE also accounts for a large proportion of 39.2% and 39.9%, respectively (Table 2). The contribution rates of ND and residual factors to CUE and WUE have the same distribution trend; while contribution rates in the whole region are relatively high, the contribution rates in Qinghai–Tibet and a small part of the south are relatively low. The contribution rate of CO2 in the whole region is relatively low, but the contribution rate is relatively high in Qinghai–Tibet and a small part of the south (Figure 7). We found that the high-value area of ND contribution to CUE and WUE is exactly the low-value area of CO2 contribution to CUE and WUE. The increase in CUE caused by ND enhanced the area of the CO2-driven increase by 15.9% over the same period (Figure 7g). In addition, ND enhanced the proportion of CO2 contribution to WUE by 19.3% (Figure 7h). From the above analysis, it can be concluded that ND and CO2 have a complementary relationship in many regions, that is, the region where ND contributes more to CUE has a smaller contribution rate of CO2 to it.
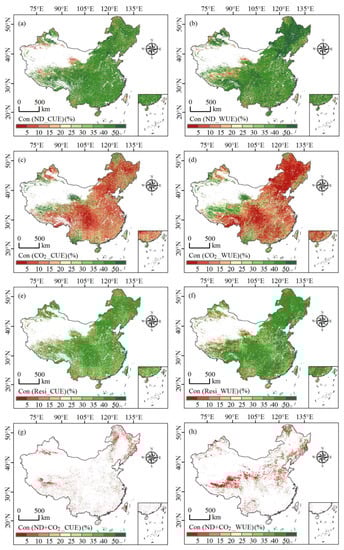
Figure 7.
Contribution rates of ND, CO2, and residual factors to CUE and WUE. (a,c,e) Contribution of rates of ND, CO2, and residual factors to CUE, (b,d,f) Contribution of rates of ND, CO2, and residual factors to WUE, (g) ND enhances the contribution rate of CO2 to CUE, (h) ND enhances the contribution rate of CO2 to WUE.
4. Discussion
4.1. Comparison with Other Related Research
To enhance the reliability of the results, we compared the findings of this study with other results (Table 3 and Table 4). CUE and WUE in most areas of China showed an upward trend, indicating that the carbon-sequestration capacity of terrestrial ecosystems has increased over the past 21 years. The average vegetation CUE is 0.846, indicating that the vegetation in the western Sichuan Plateau grows well and the carbon-sequestration efficiency is high [47]. In addition, we also found that the value of CUE increases with increasing altitude [48]. The eastern margin of the Qinghai–Tibet Plateau and the Qilian Mountains have the largest CUE, indicating that the horizontal and vertical zonality of CUE and the geographical distribution of latitude, longitude, and altitude are highly correlative. Climate warming and drying changes may contribute to an increase in the CUE of the Qinghai–Tibet Plateau [49], which is similar to the findings of this study; the CUE of the Qinghai–Tibet region is higher than that of other regions. The WUE in China is 1.227 g C kg−1 H2O [50], which is similar to the findings of this study (1.235 g C kg−1 H2O). The mean WUE in the Qinghai-Tibet Plateau region was 1.17 g C kg−1 H2O, the lowest among all regions [51]; the Qinghai-Tibet region also had the lowest WUE value among the four subregions in this study.
Table 3.
Mean values and trends of CUE by region.
Table 4.
Mean values and trends of CUE by region.
From the scatter plots of the NPP, GPP, CUE, and WUE site and raster data, it can be seen that the distribution of the two datasets at the same longitude are consistent (Figure 8). The correlation coefficients between the measured data at NPP and GPP sites and the MODIS raster data are 0.757 and 0.879, respectively, (Figure 8a,b), which pass the 95% significance test. The results show that the measured data and raster data have good correlation (Figure S3). In addition, we used NPP and GPP site and raster data to calculate the correlation coefficients of CUE and WUE as 0.773 and 0.838, respectively (Figure 8c,d).
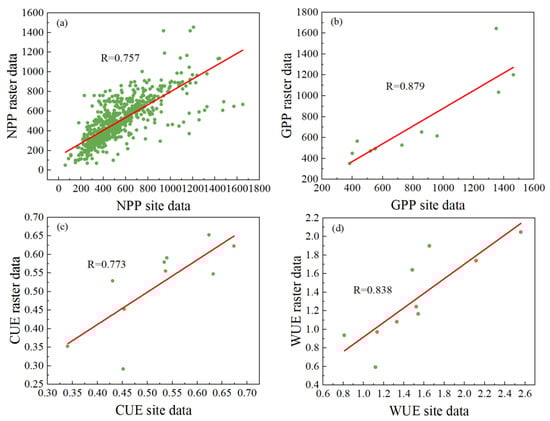
Figure 8.
Scatter plots of the NPP, GPP, CUE, and WUE site data and MODIS raster data. (a) is the scatter plots diagram of NPP site data and raster data; (b) is the scatter plots diagram of GPP site data and raster data; (c) the scatter plots diagram of CUE is calculated from the site data and raster data; (d) scatter plots of WUE calculated from site data and grid data raster data.
4.2. Interactive Effects of ND and CO2 on CUE and WUE
In all categories, the areas where ND increases CUE and WUE while CO2 reduces CUE and WUE are mainly distributed in the northern region, accounting for the largest proportion at 41.65% (Figure 9). For areas where ND has a positive effect on CUE and WUE, the CO2 shows a negative effect on CUE and WUE. As soil-nutrient concentrations increase due to ND, transpiration decreases to match the effectiveness of nutrient mass flow caused by reduced stomatal conductance [22]. The areas where ND and CO2 have a positive impact on WUE is larger than the area where both of them have a positive impact on CUE (Figure 10). ND induced increases in LAI increases canopy transpiration, resulting in decreased soil evaporation [57]. Therefore, the effect of ND on GPP is greater than that of ET, which is consistent with the finding that the combined effect of CO2 fertilization and N addition on WUE is greater than the effect of CO2 alone [23,24,25,26,27,28,29,30,31,32,33,34,35,36,37,38,39,40,41,42,43,44,45,46,47,48,49,50,51,52,53,54,55,56,57,58]. The areas where ND reduces CUE and WUE while CO2 increases CUE and WUE are mainly distributed in Qinghai–Tibet and southern regions, accounting for 35.33% (Figure 9). In areas where ND has a negative effect on CUE and WUE, the CO2 shows a positive effect on CUE and WUE. It shows that ND and CO2 have an interactive relationship, and the affected area accounts for 76.98% of the total area.
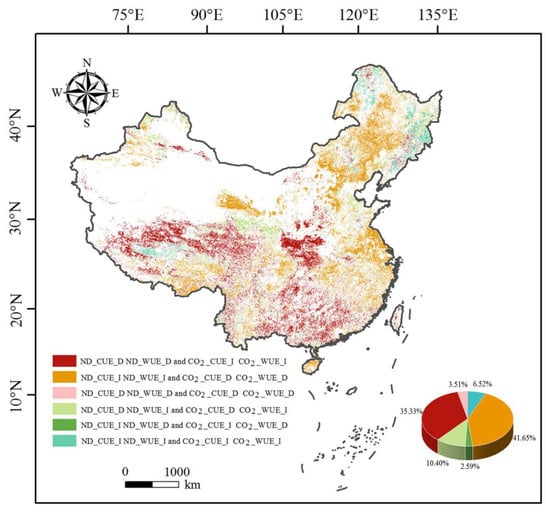
Figure 9.
Interactive effects of ND and CO2 on CUE and WUE. ND_CUE_D means ND decreases CUE, ND_WUE_D means ND decreases WUE, CO2_CUE_I means ND increases CUE, CO2_WUE_I means ND increases WUE.
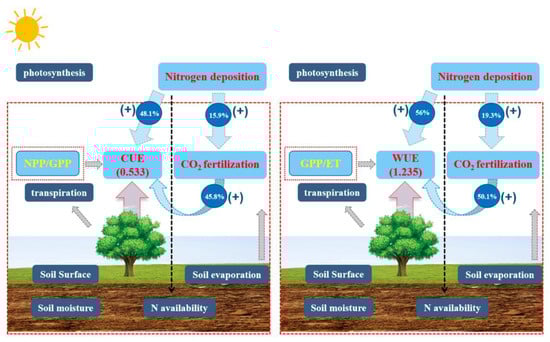
Figure 10.
Mechanistic diagram of the effect of ND and CO2 on CUE and WUE.
4.3. Effect of Residual Factors on CUE and WUE
From 2000 to 2020, ND (15.24 mg N m−2 yr−1) and CO2 (2.21 ppm yr−1) showed an increasing trend, which promoted CUE and WUE. Besides ND and CO2 (Figure S2), various other factors also have profound effects on CUE and WUE at different temporal and spatial scales. The temperature and precipitation factors also showed an upward trend; rising air temperature decreased the CUE ratio, and increased precipitation led to an increase in the CUE ratio [52,53,54,55,56,57,58,59]. In environmental conditions, temperature, precipitation, solar radiation, etc, are all key climate-change factors that affect the WUE of ecosystems [60]. Photosynthetically active radiation, soil nutrition, etc, also affect CUE and WUE [61]. In cold regions at high latitudes or across the Tibetan Plateau, this limitation will be removed to some extent with increasing precipitation and temperature, which may stimulate more carbon sequestration [62]. High altitude and extreme drought conditions limit plant growth and lead to a decrease in the ratio between T and ET, which explains why the lowest value of WUE occurs in the Qinghai–Tibet region [63,64]. Vapor-pressure deficit (VPD) is the most important environmental factor affecting WUE, and many studies at the ecosystem level have found that VPD is significantly negatively correlated with WUE [65]. Increased humidity in the air promotes plant WUE [43]. At the individual ecosystem level, mild water-stress increases WUE, while extreme water-stress decreases WUE [66,67].
In addition, land-use change can have an impact on CUE and WUE [1,68,69]. There are also studies showing that CUE and WUE vary with vegetation type [15,70]. At the same time, vegetation functional types and soil-nutrient content are also important factors affecting the changes of CUE and WUE [14,41]. WUE continued to rise for all plant types in the presence of increased aerosol loads [44]. Healthy ecosystems enhance ecosystem services, contributing to CUE and WUE [57].
4.4. Uncertainty and Future Outlook
This paper studies the temporal and spatial pattern of CUE and WUE in China and the impact of ND and CO2 on CUE and WUE, which effectively improves the understanding of vegetation CUE and WUE. However, our study still has some uncertainties and limitations. Firstly, in terms of remote-sensing data of GPP and NPP, we did not select more remote-sensing data for comparative analysis, and this uncertainty affects the comprehensive understanding of CUE and WUE to a certain extent. The change of GPP data makes the calculated NPP change, which affects the value of CUE and also increases the uncertainty of research. Secondly, the data accuracy of ND and CO2 also has certain deficiencies. In terms of content, our study mainly analyzed the responses of CUE and WUE to ND and CO2. The study found that the residual factors still accounted for a large proportion of the changes in CUE and WUE, and we classified all other influencing factors as residual factors but did not quantitatively analyze the impact of the residual factors (climate factors, human activities, and extreme climate conditions). In future research, the impact of other factors on CUE and WUE should be thoroughly analyzed to enrich the understanding of CUE and WUE.
5. Conclusions
In this study, the method of trend analysis and partial derivatives was used, revealing the effects of ND and CO2 on vegetation CUE and WUE. We clarified the main control areas of ND, CO2, and residual factors for CUE and WUE, quantitative analyzed the different proportions of ND interacting with CO2 contributing to CUE and WUE. The main results are as follows:
- (1)
- From 2000 to 2020, 53.8% of China’s CUE showed an upward trend of 0.2 × 10⁻³ yr−1, with the most obvious increase in trend in the southern region (1.5 × 10⁻³ yr−1); 61.8% WUE showed an upward trend of 3.3 × 10⁻³ g C kg−1 H2O yr−1, and the most obvious increase in trend was 13 × 10−3 g C kg−1 H2O yr−1 in the northwest region.
- (2)
- Approximately 48.1% and 56% of ND were positively correlated with CUE and WUE, and the proportions of CO2 positively correlated with CUE and WUE were 45.8% and 50.1%, respectively.
- (3)
- Approximately 52% and 56% of ND with CUE and WUE were positive contributions, and the proportion of CO2 that contributes positively to CUE and WUE were 54.2% and 50.1%, respectively.
- (4)
- The proportions of ND, CO2, and residual factors to the main control area of CUE were 43.9%, 12.7%, and 43.4% respectively, and proportion of the main control area of WUE were 50.9%, 14.1%, and 35% respectively.
- (5)
- ND enhances the contribution of CO2 to CUE by 15.9%, ND enhances the contribution of CO2 to WUE by 19.3%.
Supplementary Materials
The following supporting information can be downloaded at: https://www.mdpi.com/article/10.3390/land12020413/s1, Table S1: Mean and trend values of CUE and WUE for the four major subregions in China. Qinghai Tibet Plateau: QT; South area: SA; North area: NA; North-west area: NW. Figure S1. Multi-year GPP, NPP, ET, CO2, ND values and interannual variation characteristics of China based on spatial pixels. (a–e) Chinese GPP, NPP, ET, CO2, ND average, (f) changes in GPP, NPP, ET, CO2, ND from 2000 to 2020. Figure S2. Percentage of GPP, NPP, ET, CO2, ND trends and increasing or decreasing trends based on spatial pixels. (a–e) Variation trends of GPP, NPP, ET, CO2, and ND in China, (f) Percentage of increasing or decreasing trends in GPP, NPP, ET, CO2, ND during the study period. Figure S3. Distribution of NPP and GPP sites.
Author Contributions
Conceptualization, X.B. and B.X.; methodology, L.W.; software, C.L.; validation, B.X., Q.T. and Y.L.; formal analysis, C.Z.; investigation, G.L.; resources, F.C.; data curation, C.R.; writing—original draft preparation, B.X.; writing—review and editing, X.B.; visualization, H.X. and F.S.; supervision, S.Z. and L.X.; project administration, M.L. and C.D.; funding acquisition, X.B. All authors have read and agreed to the published version of the manuscript.
Funding
This research work was supported jointly by Joint Funds of the National Natural Science Foundation of China (No.U22A20619), the Western Light Cross-team Program of Chinese Academy of Sciences (No. xbzg-zdsys-202101), National Natural Science Foundation of China (No. 42077455 & No.42167032), Strategic Priority Research Program of the Chinese Academy of Sciences (No. XDB40000000 & No. XDA23060100), Guizhou Provincial Science and Technology Projects (No. Qiankehe Support [2022] General 198), High-level innovative talents in Guizhou Province (No. GCC [2022]015-1 & No. 2016-5648), Guizhou Provincial 2020 Science and Technology Subsidies (No. GZ2020SIG), Opening Fund of the State Key Laboratory of Environmental Geochemistry (No. SKLEG2022206 & No. SKLEG2022208), Central government leading local science and technology development (QianKeZhongYinDi [2021]4028).
Institutional Review Board Statement
Not applicable.
Informed Consent Statement
Not applicable.
Data Availability Statement
The fundamental data used in our study are available in the public, and their websites are provided in the “2. Data and methods” section and other data are available from the corresponding author upon reasonable request.
Acknowledgments
We would like to thank all the authors and reviewers for their great guidance and help in writing this manuscript.
Conflicts of Interest
The authors declare that they have no known competing financial interest or personal relationships that could have appeared to influence the work reported in this article.
References
- Khalifa, M.; Elagib, N.A.; Ribbe, L.; Schneider, K. Spatio-temporal variations in climate, primary productivity and efficiency of water and carbon use of the land cover types in Sudan and Ethiopia. Sci. Total Environ. 2018, 624, 790–806. [Google Scholar] [CrossRef] [PubMed]
- Piao, S.; Luyssaert, S.; Ciais, P.; Janssens, I.A.; Chen, A.; Cao, C.; Fang, J.; Friedlingstein, P.; Luo, Y.; Wang, S. Forest annual carbon cost: A global-scale analysis of autotrophic respiration. Ecology 2010, 91, 652–661. [Google Scholar] [CrossRef] [PubMed]
- DeLUCIA, E.H.; Drake, J.E.; Thomas, R.B.; Gonzalez-Meler, M. Forest carbon use efficiency: Is respiration a constant fraction of gross primary production? Glob. Chang. Biol. 2007, 13, 1157–1167. [Google Scholar] [CrossRef]
- Du, X.; Zhao, X.; Zhou, T.; Jiang, B.; Xu, P.; Wu, D.; Tang, B. Effects of Climate Factors and Human Activities on the Ecosystem Water Use Efficiency throughout Northern China. Remote Sens. 2019, 11, 2766. [Google Scholar] [CrossRef]
- Keenan, T.F.; Hollinger, D.Y.; Bohrer, G.; Dragoni, D.; Munger, J.W.; Schmid, H.P.; Richardson, A.D. Increase in forest water-use efficiency as atmospheric carbon dioxide concentrations rise. Nature 2013, 499, 324–327. [Google Scholar] [CrossRef] [PubMed]
- Deng, X.J.; Zhang, L. Spatio-temporal disparity of water use efficiency and its influencing factors in energy production in China. Ecol. Inf. 2022, 71, 101779. [Google Scholar] [CrossRef]
- Forzieri, G.; Miralles, D.G.; Ciais, P.; Alkama, R.; Ryu, Y.; Duveiller, G.; Zhang, K.; Robertson, E.; Kautz, M.; Martens, B.; et al. Increased control of vegetation on global terrestrial energy fluxes. Nat. Clim. Chang. 2020, 10, 356. [Google Scholar] [CrossRef]
- Kumar, S.; Sharma, L.K. Assessment of water and carbon use efficiency in the SAARC region for ecological resilience under changing climate. J. Environ. Manag. 2023, 326, 116–812. [Google Scholar] [CrossRef]
- An, X. Responses of Water Use Efficiency to climate change in evapotranspiration and transpiration ecosystems. Ecol. Indic. 2022, 141, 109–157. [Google Scholar] [CrossRef]
- Bai, X.Y.; Zhang, S.R.; Li, C.J.; Xiong, L.; Song, F.J.; Du, C.C.; Li, M.H.; Luo, Q.; Xue, Y.Y.; Wang, S.J. Spatial patterns of ecological organic and inorganic carbon sinks and their contributions to carbon neutrality in Guizhou, China. Environ. Sci. Ecotechnol. 2023, 100–237. [Google Scholar]
- De Kauwe, M.G.; Medlyn, B.E.; Zaehle, S.; Walker, A.P.; Dietze, M.C.; Wang, Y.P.; Luo, Y.; Jain, A.K.; El-Masri, B.; Hickler, T.; et al. Where does the carbon go? A model-data intercomparison of vegetation carbon allocation and turnover processes at two temperate forest free-air CO2 enrichment sites. New Phytol. 2014, 203, 883–899. [Google Scholar] [CrossRef]
- Cui, E.; Huang, K.; Arain, M.A.; Fisher, J.B.; Huntzinger, D.N.; Ito, A.; Luo, Y.; Jain, A.K.; Mao, J.; Michalak, A.M.; et al. Vegetation Functional Properties Determine Uncertainty of Simulated Ecosystem Productivity: A Traceability Analysis in the East Asian Monsoon Region. Glob. Biogeochem. Cycles 2019, 33, 668–689. [Google Scholar] [CrossRef]
- Xia, J.; McGuire, A.D.; Lawrence, D.; Burke, E.; Chen, G.; Chen, X.; Delire, C.; Koven, C.; MacDougall, A.; Peng, S.; et al. Terrestrial ecosystem model performance in simulating productivity and its vulnerability to climate change in the northern permafrost region. J. Geophys. Res.-Biogeosci. 2017, 122, 430–446. [Google Scholar] [CrossRef]
- Maseyk, K.; Grünzweig, J.M.; Rotenberg, E.; Yakir, D.A.N. Respiration acclimation contributes to high carbon-use efficiency in a seasonally dry pine forest. Glob. Chang. Biol. 2008, 14, 1553–1567. [Google Scholar] [CrossRef]
- Zhang, Y.; Huang, K.; Zhang, T.; Zhu, J.; Di, Y. Soil nutrient availability regulated global carbon use efficiency. Glob. Planet Chang. 2019, 173, 47–52. [Google Scholar] [CrossRef]
- El Masri, B.; Schwalm, C.; Huntzinger, D.N.; Mao, J.; Shi, X.; Peng, C.; Fisher, J.B.; Jain, A.K.; Tian, H.; Poulter, B.; et al. Carbon and Water Use Efficiencies: A Comparative Analysis of Ten Terrestrial Ecosystem Models under Changing Climate. Sci. Rep. 2019, 9, 14680. [Google Scholar] [CrossRef]
- Zhang, S.; Bai, X.; Zhao, C.; Tan, Q.; Luo, G.; Cao, Y.; Deng, Y.; Li, Q.; Li, C.; Wu, L.; et al. Limitations of soil moisture and formation rate on vegetation growth in karst areas. Sci. Total Environ. 2022, 810, 151209. [Google Scholar] [CrossRef]
- Farquhar, G.D. Carbon dioxide and vegetation. Science 1997, 278, 1411. [Google Scholar] [CrossRef]
- Adams, M.A.; Buckley, T.N.; Binkley, D.; Neumann, M.; Turnbull, T.L. CO2, nitrogen deposition and a discontinuous climate response drive water use efficiency in global forests. Nat. Commun. 2021, 12, 5194. [Google Scholar] [CrossRef]
- Mao, J.; Fu, W.; Shi, X.; Ricciuto, D.; Fisher, J.; E Dickinson, R.; Wei, Y.; Shem, W.; Piao, S.; Wang, K.; et al. Disentangling climatic and anthropogenic controls on global terrestrial evapotranspiration trends. Environ. Res. Lett. 2015, 10, 1748–9326. [Google Scholar] [CrossRef]
- Zhou, S.; Yu, B.; Schwalm, C.R.; Ciais, P.; Zhang, Y.; Fisher, J.B.; Michalak, A.M.; Wang, W.; Poulter, B.; Huntzinger, D.N.; et al. Response of Water Use Efficiency to Global Environmental Change Based on Output From Terrestrial Biosphere Models. Glob. Biogeochem. Cycles 2017, 31, 1639–1655. [Google Scholar] [CrossRef]
- Cramer, M.D.; Hawkins, H.-J.; Verboom, G.A. The importance of nutritional regulation of plant water flux. Oecologia 2009, 161, 15–24. [Google Scholar] [CrossRef] [PubMed]
- Köhler, I.H.; Macdonald, A.; Schnyder, H. Nutrient supply enhanced the increase in intrinsic water-use efficiency of a temperate seminatural grassland in the last century. Glob. Chang. Biol. 2012, 18, 3367–3376. [Google Scholar] [CrossRef]
- Yan, J.; Zhang, D.; Liu, J.; Zhou, G. Interactions between CO2 enhancement and N addition on net primary productivity and water-use efficiency in a mesocosm with multiple subtropical tree species. Glob. Chang. Biol. 2014, 20, 2230–2239. [Google Scholar] [CrossRef] [PubMed]
- Scurlock, J.M.O.; Hall, D.O. The global carbon sink: A grassland perspective. Glob. Chang. Biol. 1998, 4, 229–233. [Google Scholar] [CrossRef]
- Xiao, B.; Bai, X.; Zhao, C.; Tan, Q.; Li, Y.; Luo, G.; Wu, L.; Chen, F.; Li, C.; Ran, C.; et al. Responses of carbon and water use efficiencies to climate and land use changes in China’s karst areas. J. Hydrol. 2023, 617, 128–968. [Google Scholar] [CrossRef]
- Jin, J.; Wang, Y.; Zhang, Z.; Magliulo, V.; Jiang, H.; Cheng, M. Phenology Plays an Important Role in the Regulation of Terrestrial Ecosystem Water-Use Efficiency in the Northern Hemisphere. Remote Sens. 2017, 9, 664. [Google Scholar] [CrossRef]
- Zhang, S.; Bai, X.; Zhao, C.; Tan, Q.; Luo, G.; Wu, L.; Xi, H.; Li, C.; Chen, F.; Ran, C.; et al. China’s carbon budget inventory from 1997 to 2017 and its challenges to achieving carbon neutral strategies. J. Clean. Prod. 2022, 347, 130966. [Google Scholar] [CrossRef]
- Zhu, Z.; Piao, S.; Myneni, R.B.; Huang, M.; Zeng, Z.; Canadell, J.G.; Ciais, P.; Sitch, S.; Friedlingstein, P.; Arneth, A.; et al. Greening of the Earth and its drivers. Nat. Clim. Chang. 2016, 6, 791. [Google Scholar] [CrossRef]
- Gong, S.; Wang, S.; Bai, X.; Luo, G.; Wu, L.; Chen, F.; Qian, Q.; Xiao, J.; Zeng, C. Response of the weathering carbon sink in terrestrial rocks to climate variables and ecological restoration in China. Sci. Total Environ. 2021, 750, 141–525. [Google Scholar] [CrossRef]
- Lu, X.H.; Jiang, H.; Zhang, X.Y.; Liu, J.X.; Zhang, Z.; Jin, J.X.; Wang, Y.; Xu, J.H.; Cheng, M.M. Estimated global nitrogen deposition using NO2 column density. Int. J. Remote Sens. 2013, 34, 8893–8906. [Google Scholar] [CrossRef]
- Li, C.; Bai, X.; Tan, Q.; Luo, G.; Wu, L.; Chen, F.; Xi, H.; Luo, X.; Ran, C.; Chen, H.; et al. High-resolution mapping of the global silicate weathering carbon sink and its long-term changes. Glob. Chang. Biol. 2022, 28, 4377–4394. [Google Scholar] [CrossRef]
- Song, F.; Wang, S.; Bai, X.; Wu, L.; Wang, J.; Li, C.; Chen, H.; Luo, X.; Xi, H.; Zhang, S.; et al. A New Indicator for Global Food Security Assessment: Harvested Area Rather Than Cropland Area. Chin. Geogr. Sci. 2022, 32, 204–217. [Google Scholar] [CrossRef]
- Roderick, M.L.; Rotstayn, L.D.; Farquhar, G.D.; Hobbins, M.T. On the attribution of changing pan evaporation. Geophys. Res. Lett. 2007, 34, L17403. [Google Scholar] [CrossRef]
- You, G.; Zhang, Y.; Liu, Y.; Song, Q.; Lu, Z.; Tan, Z.; Xie, Y. On the attribution of changing pan evaporation in a nature reserve in SW China. Hydrol. Process. 2013, 27, 2676–2682. [Google Scholar] [CrossRef]
- Xiong, L.; Bai, X.; Zhao, C.; Li, Y.; Tan, Q.; Luo, G.; Wu, L.; Chen, F.; Li, C.; Ran, C.; et al. High-resolution datasets for global carbonate and silicate rock weathering carbon sinks and their change trends. Earth’s Future 2022, 10, e2022EF002746. [Google Scholar] [CrossRef]
- Wu, L.; Wang, S.; Bai, X.; Tian, Y.; Luo, G.; Wang, J.; Li, Q.; Chen, F.; Deng, Y.; Yang, Y.; et al. Climate change weakens the positive effect of human activities on karst vegetation productivity restoration in southern China. Ecol. Indic. 2020, 115, 106–392. [Google Scholar] [CrossRef]
- Chen, H.; Bai, X.; Li, Y.; Li, Q.; Wu, L.; Chen, F.; Li, C.; Deng, Y.; Xi, H.; Ran, C.; et al. Soil drying weakens the positive effect of climate factors on global gross primary production. Ecol. Indic. 2021, 129, 107–953. [Google Scholar] [CrossRef]
- Wu, S.; Zhou, S.; Chen, D.; Wei, Z.; Dai, L.; Li, X. Determining the contributions of urbanisation and climate change to NPP variations over the last decade in the Yangtze River Delta, China. Sci. Total Environ. 2014, 472, 397–406. [Google Scholar] [CrossRef]
- Kim, D.; Lee, M.-I.; Jeong, S.-J.; Im, J.; Cha, D.H.; Lee, S. Intercomparison of Terrestrial Carbon Fluxes and Carbon Use Efficiency Simulated by CMIP5 Earth System Models. Asia-Pac. J. Atmos. Sci. 2018, 54, 145–163. [Google Scholar] [CrossRef]
- Zhang, Y.; Xu, M.; Chen, H.; Adams, J. Global pattern of NPP to GPP ratio derived from MODIS data: Effects of ecosystem type, geographical location and climate. Glob. Ecol. Biogeogr. 2009, 18, 280–290. [Google Scholar] [CrossRef]
- Zheng, H.; Lin, H.; Zhou, W.-J.; Bao, H.; Zhu, X.J.; Jin, Z.; Song, Y.; Wang, Y.Q.; Liu, W.Z.; Tang, Y.K. Revegetation has increased ecosystem water-use efficiency during 2000–2014 in the Chinese Loess Plateau: Evidence from satellite data. Ecol. Indic. 2019, 102, 507–518. [Google Scholar] [CrossRef]
- Niu, S.; Xing, X.; Zhang, Z.; Xia, J.; Zhou, X.; Song, B.; Li, L.; Wan, S. Water-use efficiency in response to climate change: From leaf to ecosystem in a temperate steppe. Glob. Chang. Biol. 2011, 17, 1073–1082. [Google Scholar] [CrossRef]
- Lu, X.; Ju, W.; Jiang, H.; Zhang, X.; Liu, J.; Sherba, J.; Wang, S. Effects of nitrogen deposition on water use efficiency of global terrestrial ecosystems simulated using the IBIS model. Ecol. Indic. 2019, 101, 954–962. [Google Scholar] [CrossRef]
- Finzi, A.C.; Norby, R.J.; Calfapietra, C.; Gallet-Budynek, A.; Gielen, B.; Holmes, W.E.; Hoosbeek, M.R.; Iversen, C.M.; Jackson, R.B.; Kubiske, M.E.; et al. Increases in nitrogen uptake rather than nitrogen-use efficiency support higher rates of temperate forest productivity under elevated CO2. Proc. Natl. Acad. Sci. USA 2007, 104, 14014–14019. [Google Scholar] [CrossRef]
- Tang, Z.; Xu, W.; Zhou, G.; Bai, Y.; Li, J.; Tang, X.; Chen, D.; Liu, Q.; Ma, W.; Xiong, G.; et al. Patterns of plant carbon, nitrogen, and phosphorus concentration in relation to productivity in China’s terrestrial ecosystems. Proc. Natl. Acad. Sci. USA 2018, 115, 4033–4038. [Google Scholar] [CrossRef]
- Lu, H.; Yi, G.; Zhang, T.; Li, J.; Wang, G.; Qin, Y.; Wen, B. Variations in vegetation CUE with climate change and human activity during growing seasons in the Western Sichuan Plateau. China Remote Sens. Lett. 2021, 12, 419–428. [Google Scholar] [CrossRef]
- Luo, X.; Jia, B.H.; Lai, X. Quantitative analysis of the contributions of land use change and CO2 fertilization to carbon use efficiency on the Tibetan Plateau. Sci. Total Environ. 2020, 728, 0048–9697. [Google Scholar] [CrossRef]
- Fu, G.; Li, S.W.; Sun, W.; Shen, Z.X. Relationships Between Vegetation Carbon Use Efficiency and Climatic Factors on the Tibetan Plateau. Can. J. Remote Sens. 2016, 42, 16–26. [Google Scholar] [CrossRef]
- Zhao, A.; Zhang, A.; Cao, S.; Feng, L.; Pei, T. Spatiotemporal patterns of water use efficiency in China and responses to multi-scale drought. Theor. Appl. Clim. 2020, 140, 559–570. [Google Scholar] [CrossRef]
- Cui, X.L.; He, Y.L.; Li, Z.S. Temporal and Spatial Variation of Vegetation Water Use Efficiency on the Qinghai-Tibet Plateau and Its Relationship with Climate Factors. Chin. J. Appl. Ecol. 2022, 33, 1525–1532. [Google Scholar]
- Zhang, Y.; Yu, G.; Yang, J.; Wimberly, M.; Zhang, X.; Tao, J.; Jiang, Y.; Zhu, J. Climate-driven global changes in carbon use efficiency. Glob. Ecol. Biogeogr. 2014, 23, 144–155. [Google Scholar] [CrossRef]
- Chuai, X.; Guo, X.; Zhang, M.; Yuan, Y.; Li, J.; Zhao, R.; Yang, W.; Li, J. Vegetation and climate zones based carbon use efficiency variation and the main determinants analysis in China. Ecol. Indic. 2020, 111, 105–967. [Google Scholar] [CrossRef]
- Chen, Z.; Yu, G. Spatial variations and controls of carbon use efficiency in China’s terrestrial ecosystems. Sci. Rep. 2019, 9, 19516. [Google Scholar] [CrossRef]
- Li, B.; Huang, F.; Chang, S.; Sun, N. The Variations of Satellite-Based Ecosystem Water Use and Carbon Use Efficiency and Their Linkages with Climate and Human Drivers in the Songnen Plain, China. Adv. Meteorol. 2019, 2019, 8659138. [Google Scholar] [CrossRef]
- Sun, S.; Song, Z.; Wu, X.; Wang, T.; Wu, Y.; Du, W.; Che, T.; Huang, C.; Zhang, X.; Ping, B.; et al. Spatio-temporal variations in water use efficiency and its drivers in China over the last three decades. Ecol. Indic. 2018, 94, 292–304. [Google Scholar] [CrossRef]
- Piao, S.; Yin, G.; Tan, J.; Cheng, L.; Huang, M.; Li, Y.; Liu, R.; Mao, J.; Myneni, R.B.; Peng, S.; et al. Detection and attribution of vegetation greening trend in China over the last 30 years. Glob. Chang. Biol. 2015, 21, 1601–1609. [Google Scholar] [CrossRef]
- Yan, Y.; Zhao, C.; Wang, C.; Shan, P.; Zhang, Y.; Wu, G. Ecosystem health assessment of the Liao River Basin upstream region based on ecosystem services. Acta Ecol. Sin. 2016, 36, 294–300. [Google Scholar] [CrossRef]
- Yang, Y.; Wang, Z.; Li, J.; Gang, C.; Zhang, Y.; Odeh, I.; Qi, J. Assessing the spatiotemporal dynamic of global grassland carbon use efficiency in response to climate change from 2000 to 2013. Acta Oecol. 2017, 81, 22–31. [Google Scholar] [CrossRef]
- Li, M.; Yang, Y.; Zhu, Q.; Chen, H.; Peng, C. Evaluating water use efficiency patterns of Qinling Mountains under climate change. Acta Ecol. Sin. 2016, 36, 936–945. [Google Scholar]
- Zhu, W.-Z. Advances in the carbon use efficiency of forest. Chin. J. Plant Ecol. 2014, 37, 1043–1058. [Google Scholar] [CrossRef]
- Zhu, Q.; Jiang, H.; Peng, C.; Liu, J.; Wei, X.; Fang, X.; Liu, S.; Zhou, G.; Yu, S. Evaluating the effects of future climate change and elevated CO2 on the water use efficiency in terrestrial ecosystems of China. Ecol Model. 2011, 222, 2414–2429. [Google Scholar] [CrossRef]
- Gao, Y.; Zhu, X.; Yu, G.; He, N.; Wang, Q.; Tian, J. Water use efficiency threshold for terrestrial ecosystem carbon sequestration in China under afforestation. Agric. For. Meteorol. 2014, 195, 32–37. [Google Scholar] [CrossRef]
- Wei, X.; Wang, X.; Ma, T.; Huang, L.; Pu, Q.; Hao, M.; Zhang, X. Distribution and mineralization of organic carbon and nitrogen in forest soils of the southern Tibetan Plateau. Catena 2017, 156, 298–304. [Google Scholar] [CrossRef]
- Scanlon, T.M.; Albertson, J.D. Canopy scale measurements of CO2 and water vapor exchange along a precipitation gradient in southern Africa. Glob. Chang. Biol. 2004, 10, 329–341. [Google Scholar] [CrossRef]
- Reichstein, M.; Tenhunen, J.D.; Roupsard, O.; Ourcival, J.M.; Rambal, S.; Miglietta, F.; Peressotti, A.; Pecchiari, M.; Tirone, G.; Valentini, R. Severe drought effects on ecosystem CO2 and H2O fluxes at three mediterranean evergreen sites: Revision of current hypotheses? Glob. Chang. Biol. 2013, 8, 999–1017. [Google Scholar] [CrossRef]
- Yu, G.; Song, X.; Wang, Q.; Liu, Y.; Guan, D.; Yan, J.; Sun, X.; Zhang, L.; Wen, X. Water-use efficiency of forest ecosystems in eastern China and its relations to climatic variables. New Phytol. 2008, 177, 927–937. [Google Scholar] [CrossRef]
- Jia, B.; Luo, X.; Cai, X.; Jain, A.; Huntzinger, D.N.; Xie, Z.; Zeng, N.; Mao, J.; Shi, X.; Ito, A.; et al. Impacts of land use change and elevated CO2 on the interannual variations and seasonal cycles of gross primary productivity in China. Earth Syst. Dyn. 2020, 11, 235–249. [Google Scholar] [CrossRef]
- Li, Z.; Xu, X.; Yu, B.; Xu, C.; Liu, M.; Wang, K. Quantifying the impacts of climate and human activities on water and sediment discharge in a karst region of southwest China. J. Hydrol. 2016, 542, 836–849. [Google Scholar] [CrossRef]
- Jiang, Y.J.; Wu, Y.X.; Yuan, D.X. Human Impacts on Karst Groundwater Contamination Deduced by Coupled Nitrogen with Strontium Isotopes in the Nandong Underground River System in Yunan, China. Environ. Sci. Technol. 2009, 43, 7676–7683. [Google Scholar] [CrossRef]
Disclaimer/Publisher’s Note: The statements, opinions and data contained in all publications are solely those of the individual author(s) and contributor(s) and not of MDPI and/or the editor(s). MDPI and/or the editor(s) disclaim responsibility for any injury to people or property resulting from any ideas, methods, instructions or products referred to in the content. |
© 2023 by the authors. Licensee MDPI, Basel, Switzerland. This article is an open access article distributed under the terms and conditions of the Creative Commons Attribution (CC BY) license (https://creativecommons.org/licenses/by/4.0/).