Article

Measuring Sediment Transport Capacity of Concentrated Flow with Erosion Feeding Method

1
State Key Laboratory of Simulation and Regulation of Water Cycle in River Basin, China Institute of Water Resources and Hydropower Research, Beijing 100048, China
2
College of Water Resources and Civil Engineering, China Agricultural University, Beijing 100083, China
3
College of Water Conservancy and Civil Engineering, Shandong Agricultural University, Taian 271018, China
4
Department of Natural Resources and the Environment, University of Connecticut, Storrs, CT 06279, USA
*
Authors to whom correspondence should be addressed.
Land 2023, 12(2), 411; https://doi.org/10.3390/land12020411
Submission received: 6 December 2022 / Revised: 29 January 2023 / Accepted: 1 February 2023 / Published: 3 February 2023

Abstract

:
Sediment transport capacity in rills is an important parameter for erosion modeling on hillslopes. It is difficult to measure, especially at gentle slopes with limited rill length. In this study, a special flume with variable slope gradients in upper and lower sections was implemented to measure the sediment transport capacity. The upper flume section with a higher slope gradient generates faster water flow that could scout more sediment to feed the water flow in the rill. The rest of the flume is set at the designated slopes to measure the transport capacity in different slope and runoff conditions. A series of flume experiments were conducted with silt-loam soil to verify the method. The sediment transport capacity was measured under slope gradients of 5°, 10°, 15°, 20°, and 25° and a flow rate of 2, 4, 8, and 16 L min−1. The measured sediment transport capacity values were compared with reference measurements from other rill erosion experiments with similar materials and setups. At high slope gradients of 15°, 20°, and 25°, the newly suggested method produced almost the same transport capacity values. Under the low slope gradients of 5° and 10°, the maximum sediment concentrations from the 8 m long flume with the uniform gradients in the previous experiments, rill erosion with an 8 m long flume produced were about 36% lower than the values measured with the new method, which is insufficient to make the flow reach sediment transport capacity. The sediment transport capacities at lower slopes measured with the new method followed the same trend as those at higher slopes. The new method can supply enough sediments to ensure the flow approach transport capacity measurement and, therefore, provides a feasible approach for estimating sediment transport capacity for conditions with relatively gentle slopes.

1. Introduction

Rill formation is commonly found in hillslope soil erosion. The tillage of farmland has long been used to loosen the topsoil layer while forming a hardpan layer underneath the cultivated upper layer. This configuration of the topsoil layers of farmland makes the farm field more susceptible to rill erosion to produce more soil loss from farmland [1,2,3,4].
Rill erosion is the process of removal, transport, or deposition of soil particles under the impacts of concentrated flow running along small streamlets on the soil surface. Sediment transport capacity is defined as the maximum sediment concentration in which the sediment carried can be transported by the water flow under a defined hydrodynamic condition. In other words, transport capacity is the equilibrium sediment concentration approached at an infinite downslope distance given that hydraulic conditions (discharge, channel roughness, slope) do not change. Detachment (or erosion) in a rill occurs when the flow energy is higher than that required keep the soil particles adhered on the surface, while deposition occurs when the sediment concentration in the flow is higher than the amount that can be transported by water flow. In other words, the sediments carried by the flow begin to deposit when the flow energy is not enough to deliver that quantity of sediments. For a sediment-laden flow below sediment transport capacity, the concentration keeps increasing until the maximum is reached at transport capacity. For a flow with sediment concentration above sediment transport capacity, the concentration continues to decrease along an eroding rill until it reaches the lowest sediment load at the water flow capacity.
This not only determines the rate of soil detachment at different rill locations, but also specifies the removal amounts of sediments from different rill segments. Sediment transport capacity is a critical parameter for many physically based soil erosion models such as WEPP (Water Erosion Predict Project) [5,6] and EUROSEM (European Soil Erosion Model) [7]. For WEPP [6], the sediment transport capacity is used to determine whether the sediment transport process dominates or if detachment processes control shallow overland or concentrated water flows [8,9,10,11]. Conceptually, the detachment rate in the WEPP model is recognized to be proportional to the sediment deficit to sediment transport capacity. Soil detachment ceases when the sediment concentration is greater than that at transport capacity [1,6,12]. As the detachment ceases, sediments contained in the water flow start to deposit. The determination of sediment transport capacity is of great significance for process-based soil erosion model development. However, the direct determination of sediment transport capacity remains an issue to be solved.
Sediment transport capacity is very important in the soil erosion process in the hillslope and essential for quantifying soil erosion. It aims to develop widely and commonly accepted methods for determining sediment transport capacity. Alonso et al. [13] recommended empirical equations for this purpose by applying Yalin’s equation [14] to fit experimental data. Based on a dimensional analysis, Julien and Simons [8] recommended a power function of slope gradient, flow rate, shear stress, and rainfall intensity to compute transport capacity. Nearing et al. [2] related their laboratory rill erosion experimental data to stream power, which was believed to be able to predict sediment transport capacity. Lei et al. [1] used this method in their simulation study on the dynamic rill erosion process, in which they found that the estimated transport capacity was significantly lower than the should-be values. To match the simulated data with the experimental data, they introduced a proportional coefficient of 3 to the simulated result. The stream power was adopted in the GUEST (Griffith University Erosion System Template) model to estimate the sediment transport capacity [15]. Lei et al. [12] also used stream power to estimate this parameter.
Sediment transport capacity is also strongly influenced by the nature of the sediment, such as particle size, density, shape, etc. [16,17,18]. Everaert [19] and Govers [17] tried to relate sediment transport capacity to grain size and density. Govers [17] found that under some circumstances, there was a good linear correlation between sediment transport capacity and unit stream power. Guy et al. [20] found that sediment transport capacity was closely related to slope gradient and unit width flow rate. Field conditions are much more complicated than those in laboratory circumstances. Under field conditions, factors including sediment particle distribution aggregate stabilization and sizes can strongly affect the sediment transport capacity [21,22,23,24]. Shih and Yang [25] also supported that sediment transport capacity could be well related to unit stream power. Under given soil conditions, the sizes of soil particles and aggregates are pre-determined and sediment transport capacity is primarily determined by the hydraulics of water flow, as defined by flow rate and slope gradient [1,8,12,20,26,27].
Numerous reports declared that sediment transport on steep slopes, with complicated hydrodynamics, is quite different from that on gentle slopes [27,28,29].
Govers [10,17] proposed using hydraulic variables to quantify the effect of bed roughness on sediment transport capacity. He suggested that unit stream power suggested by Yang [30] and effective flow power introduced by Govers [10] could be used to present sediment transport capacity. EUROSEM [7] and LISEM [5] used Govers’ equation to quantify sediment transport capacity.
Chen et al. [31] conducted a series of laboratory experiments to study rill erosion processes with loess and purple soil materials, with a flume of 12 m, under different slope gradients and flow rates. In their study, sediment concentration processes under gentle slope gradients of 5° and 10° were still increasing 12 m down the slopes for both types of soils. This means that the sediment concentrations in the eroding rills for both soils did not reach sediment transport capacity. Lei et al.’s [12] experimental data of loess rill erosion with a 8 m long flume encountered the same challenge for determining sediment transport capacity under relatively gentle slope gradients of 5° and 10°.
Dong et al. [32] made a series of flume experiments to quantify the ephemeral gully erosion process of loess soil with the volume replacement method. Their results indicated that, for gully erosion, the sediment concentration at even a gully length of 12 m and a slope gradient of 20° did not reach the maximum, and is far from that at transport capacity. This should be related to the higher sediment transport capacity of a gully flow than that of a rill flow as well as the much higher sediment loading capacity for the much higher gully flow.
Zhang et al. [3] suggested a method to directly measure sediment transport capacity. The method used two sediment feeding sources in their flume experiments to ensure that sufficient sediments were supplied for the water flow to reach transport capacity [27,33]. The first source was a sediment supplier at the top end of the flume. The second sediment feeding device was a slot across the flume bed at a 0.5 m distance from the lower end of the flume. The slot was filled with wetted sediments to supply additional sediments into the water flow if its transport capacity was not reached. The sediment feeding rate was adjusted until the fed sediments could not be delivered when the deposition was observed near the sediment feeder. The method was claimed with sediment transport capacity reached. However, there were difficulties ensuring that the fed dry sediments were readily picked up by the water flow.
The objectives of this study were (1) to propose an approach to measure sediment transport capacity by feeding sediments into the water flow through natural rill erosion to generate sufficient sediments; (2) to verify the method for sediment transport capacity determination by comparing the results with previously reported measurements.

2. Materials and Methods

2.1. Mathematical Expression of the Erosion Process in Rill

In most process-based erosion models, such as LISEM (Lisem Integrated Spatial Earth Modeller) [5], WEPP [6], and EUROSEM [7], sediment transport capacity is commonly used as an independent parameter to present feedback of deficit in sediment concentration on soil detachment [13]. In WEPP, this feedback of transport capacity on soil detachment/erosion term (detachment rate, kg s−1 m−2) is defined as:
D r = K r τ τ c 1 q c T c
where Kr is the rill erodibility of the soil (s/m); τ is the shear stress of water flow, and τc is the critical shear stress of soil, Pa; Tc is the sediment transport capacity of the water flow, kg m−1 s; c is sediment concentration, kg m−3; and q is unit width flow rate (m3 s m). The Equation (1) can be written into a common conceptional model for the rill detachment as a first-order differential model [14,15,34,35].
d c d x = α 1 q c T c
where x is the distance along the rill bed, m.
For the case of steady-state, uniform flow, the solution for Equation (2) could be obtained:
c = A 1 e B x
where c is the sediment concentration as a function of rill length, kg m−3; A = Tc/q is the maximum sediment concentration at transport capacity, kg m−3, which can also be seen as the transport capacity of the flow expressed as concentration [15], B is a coefficient to indicate the increase rate of sediment concentration, m−1.
The maximum sediment concentration is at sediment transport capacity. Therefore, in the procedure reported by Lei et al. [12], the transport capacity is estimated by:
T c = A q
This relationship is often applied to estimate the Tc by the fitting curve of sediment concentration along the rills that were usually measured in laboratory constructed rills [12,31].

2.2. Experimental Facilities

The experiments were conducted at China Agricultural University, College of Water Resources and Civil Engineering. The experimental platform is 8 m long and 3 m wide. An experimental flume (Figure 1) for measuring sediment transport capacity was designed and constructed which is capable of being raised to the desired slope gradient at which the sediment transport capacity is to be measured.
Under a given discharge rate of water flow, more detachment from the rill bed occurs from a steep slope than from a gentle slope. This indicates that sediments can be fed with a rill under a higher slope gradient through the natural erosion process. We propose a new method to measure transport capacity by overland flow using two eroding flumes connected. The eroding sediment from the steep flume was fed to the next one, which was further changed by erosion or deposition in the second eroding flume.
As Figure 1 illustrates, the flume is partitioned into five major parts with distinguishing functions: section (a) for stable water supply that can be controlled with a peristaltic pump; section (b) is a 2 m long sediment feeding section that was raised to a slope of 10° as relative to the platform bottom, which was used for intensive soil erosion to supply a sufficient amount of sediments into the water flow; section (c) is the experimental section, which is for supplemental sediment supply by erosion or excessive sediment deposition, and also functions for stabilizing water flow and sediment transport; and section (d) is the sampling section for taking sediment-laden water samples at the transport capacity.
Water flow supplied from the water tank is introduced into the part for sediment supply at the uppermost section. Whatever the slope the platform is raised to, denoted as s°, the sediment feeding section [section (b)] is raised to a slope of (s + 10)°, relative to the horizontal level. In this arrangement, even at the lowest experimental slope of 5°, the section for sediment supply reaches a slope of 15°. Therefore, this part can, through natural erosion, feed a great number of sediments into the rill water flow so that sediment transport capacity can be reached or approached.
Section (c) is used for additional sediment supply or sediment deposition. When the sediment-laden water flow reaches the section, the flow further scours sediments from the rill bed only if the sediment concentration is lower than that at the transport capacity. Water flow continues eroding the rill bed at this section to increase sediment concentration until it reaches the sediment transport capacity. Otherwise, sediment deposition occurs when the sediment concentration in the flow is higher than that at sediment transport capacity. In other words, excess sediments start to deposit onto the rill bed with the advance of water flow. This causes a decrease in sediment concentration until sediment concentration equals that of sediment transport capacity. On the entire flow way, the state of water flow tends to be steady, and the sediment concentration becomes stable, which approaches that of sediment transport capacity when the flow reaches the outlet of the flume [section (d)].
There are 10 flumes aligned parallelly and each flume is 10 cm wide and 35 cm deep.

2.3. Soil Preparation

The soil materials used for sediment transport capacity measurement in this study were collected from Beijing City of China. The soil is loess soil with 9.38% clay particles (<0.002 mm), 17.22% silt particles (0.002–0.02 mm), and 73.40% sand (0.02–2.0 mm), which are classified as sandy loam soil according to the soil texture classification of the ISSS (International Soil Science Society) [36]. The soil materials were air-dried and crushed with a machine before passing through a 1 cm mesh. The prepared soil materials as sediment-feeding sources were packed into the setup flume. The downslope flume section that is 6 m long at the lower part was packed with a layer of sand at the bottom for a thickness of 5 cm before a gauze sheet was placed onto it. The prepared loess soil materials were then put on top of the sand layer surface to a bulk density of approximately 1.2 g cm−3, to a depth of about 20 cm. The bulk density and the depth of the soil layer should not have much impact on the hydrodynamics and sediment transport capacity of the water flow. The soil materials near the flume walls were packed slightly higher to avoid water flow getting in contact and being influenced by the walls.
The uppermost part of the flume, with a length of 2 m, is used for sediment feeding was loosely filled with soil materials to a depth of about 5 cm lower than the upper brim of the flume walls. The depth of the soil layer was about 30 cm.

2.4. Experimental Design and Measurement Methods

The experiments involved four flow rates of 2, 4, 8, and 16 L min−1 and 5 slope gradients of 5°, 10°, 15°, 20°, and 25°. There were two replicates for each run, and five sediment samples were taken during each experimental run. For enough sediment supply, the water flow was accelerated in the relatively steep slope 50 cm long flume that was attached to the upper end of the sediment supply flume. At the lowest end of the flume, a V-shaped flume section was used to drain water flow for a convenient sampling of runoff for sediment concentration measurement. To ensure enough sediment supply, sediments were refilled into the upper 2 m long flume, and the rill surface in the downslope rill section of the 6 m long flume before each experimental run. When the outflow in the lower part of the flume approached stable, we took samples with a certain volume, which was about 1 L, controlled by the sampling container and weighed it quickly. When the weight of the tentative samples stopped increasing, we assume that sediment concentration approached the maximum and began to take actual samples for sediment concentration determination. The samples were weighted right after being taken with each experimental run. The samples were then kept still for the suspended sediments to settle down. Water was decanted before the samples were put into an oven at a temperature of 105 °C for 24 h.
The sediment transport capacity is the sediment delivery rate at the maximum sediment concentration, which is given as:
T c = c max q
where Tc is the sediment transport capacity, kg m−1 s−1; cmax is the maximum possible sediment concentration, kg m−3, which is the maximum value of sediment concentration and represents the sediment load corresponding to transport capacity [12]; and q is the unit width flow rate, m3 s−1 m−1 (m2 s−1). When sediment loaden flow reaches the maximum possible sediment concentration, the net detachment rate is zero. In this experiment, the maximum possible sediment concentration was determined by the average value of the three highest samples out of the 10 samples for the two replicates.
The sediment transport capacity of overland flow is directly related to the conditions of the soil surface, e.g., random roughness. Erosion or deposition that occurred in the constructed rills in the flume will change the conditions of the soil surface, the surface of the rill was therefore restructured for every experiment setting.
After each run of the experiment, we checked the soil surface of the constructed rills in the flume. The original soil was used to fill the eroded areas. Water was sprayed to saturate the newly filled soil. Then, the flume had been settled for a couple of hours, and the surface of the rill was checked again, with soil added again as necessary. The process was usually repeated two to three times until the newly added soil settled well and kept a continuous surface in the rills.

3. Results

The sediment transport capacities measured with the method suggested in this study are given in Table 1.
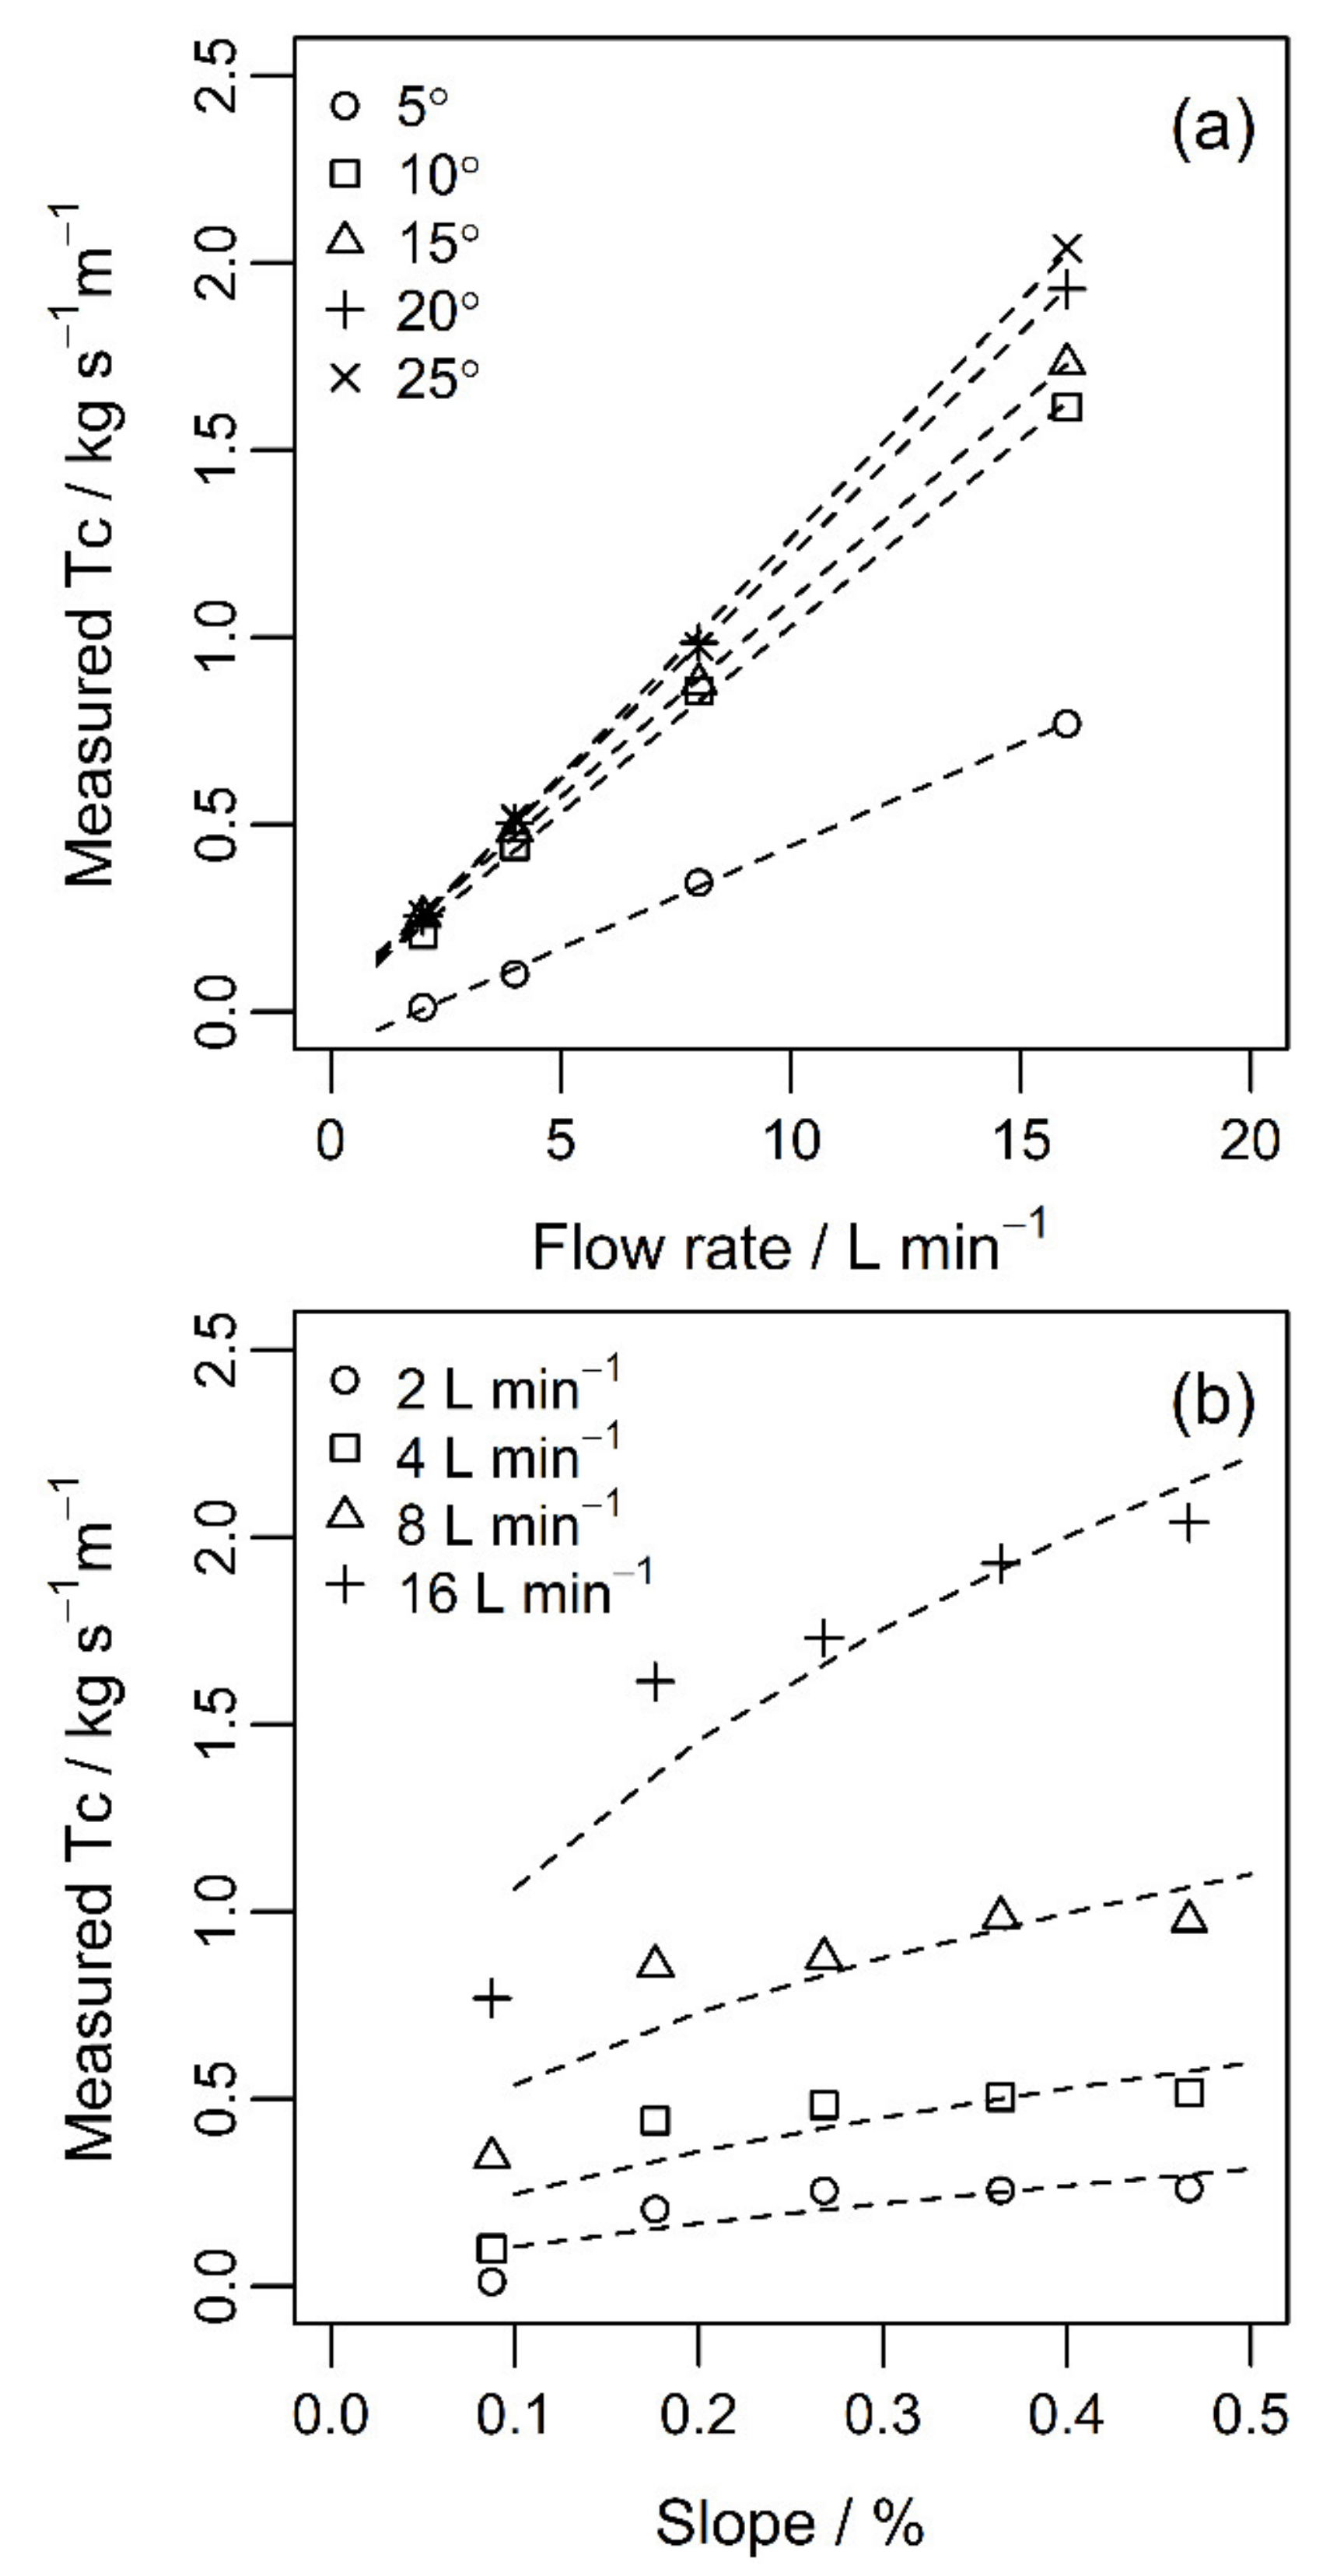
The measured transport capacities under different slopes and flow rates are shown in Figure 2. From the figure, as the slope and flow rate increase, the transport capacity increases. Apparently, the increase in slope and inflow rate induces higher transport capacity. The relationship between measured transport capacity and flow rate shows an almost linear increase, and nonlinear relationships are shown between measured transport capacity and slope. The transport capacity tends to approach a stable level with an increasing slope.
To check the influence of slope and flow on transport capacity, the measured Tc was fitted to slope grade and flow rate with the following simple equation:
T C = a + b S + c q
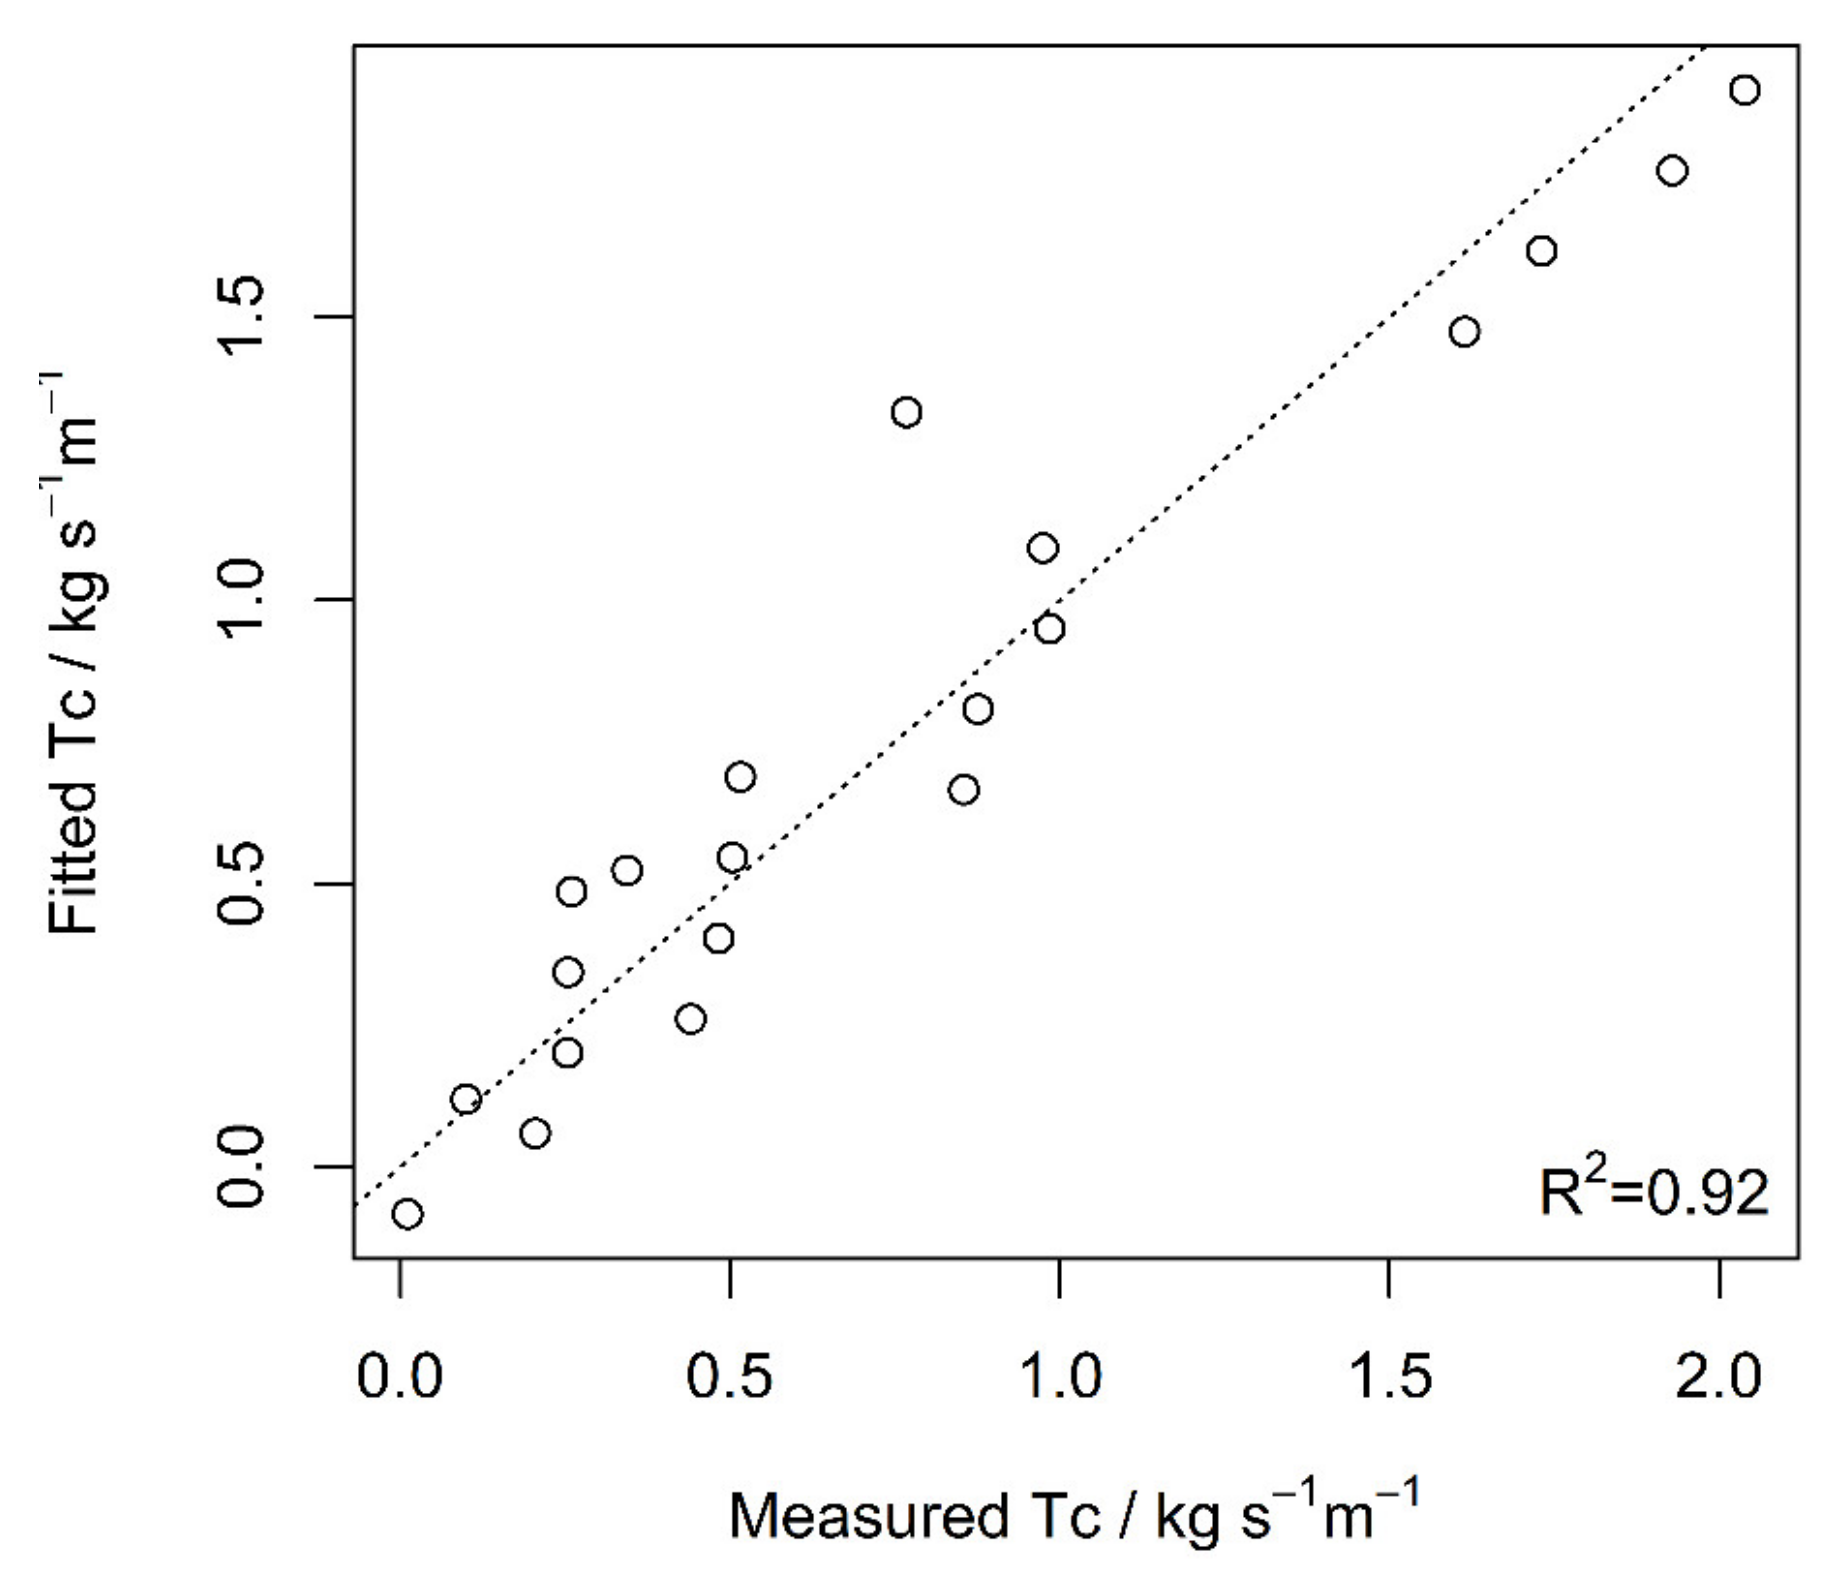
where a, b, and c were regression coefficients, q is the flow rate, S is slope grade. The result of the regression is shown in Table 2, and the experimental measured Tc was compared with those from the regressed values in Figure 3. Equation (6) provided a portable solution of parameterization in possess-based modeling of soil erosion on hillslopes with the formation of rills.

4. Discussion

4.1. Required Rill Length for Sediment Transport Capacity Measurement and the Equivalent Rill Length for the Proposed Facility

Sediment feeding is needed to measure sediment transport capacity, especially under lower slope gradients, which is also a key point of equipment design. The estimated number of supplied/added sediments from the 2 m long slope and at a relative slope gradient of 10° was computed and listed in Table 3, according to the experiment in the previous study [12], in which the experiment condition is compatible with the feeding section in this study.
The flow rate of 4 L min−1, for example, when the slope gradient was set at 5°, and the slope of the sediment feeding part was increased from 5° to 15°, the sediment concentration was increased from 147 kg m−3, the number in the brackets in Table 1, to about 308 kg m−3 from the 2 m long rill, which is close to the sediment concentration at the transport capacity. The setting up of the 2 m long flume in our study makes the sediment concentration reach the transport capacity easier than the uniform sloped flume usually used.
A rill at lower slope gradients of 5° and 10°, or even 15°, needs a relatively and considerably longer rill than those at higher slope gradients for the sediment concentration to reach that at transport capacity.
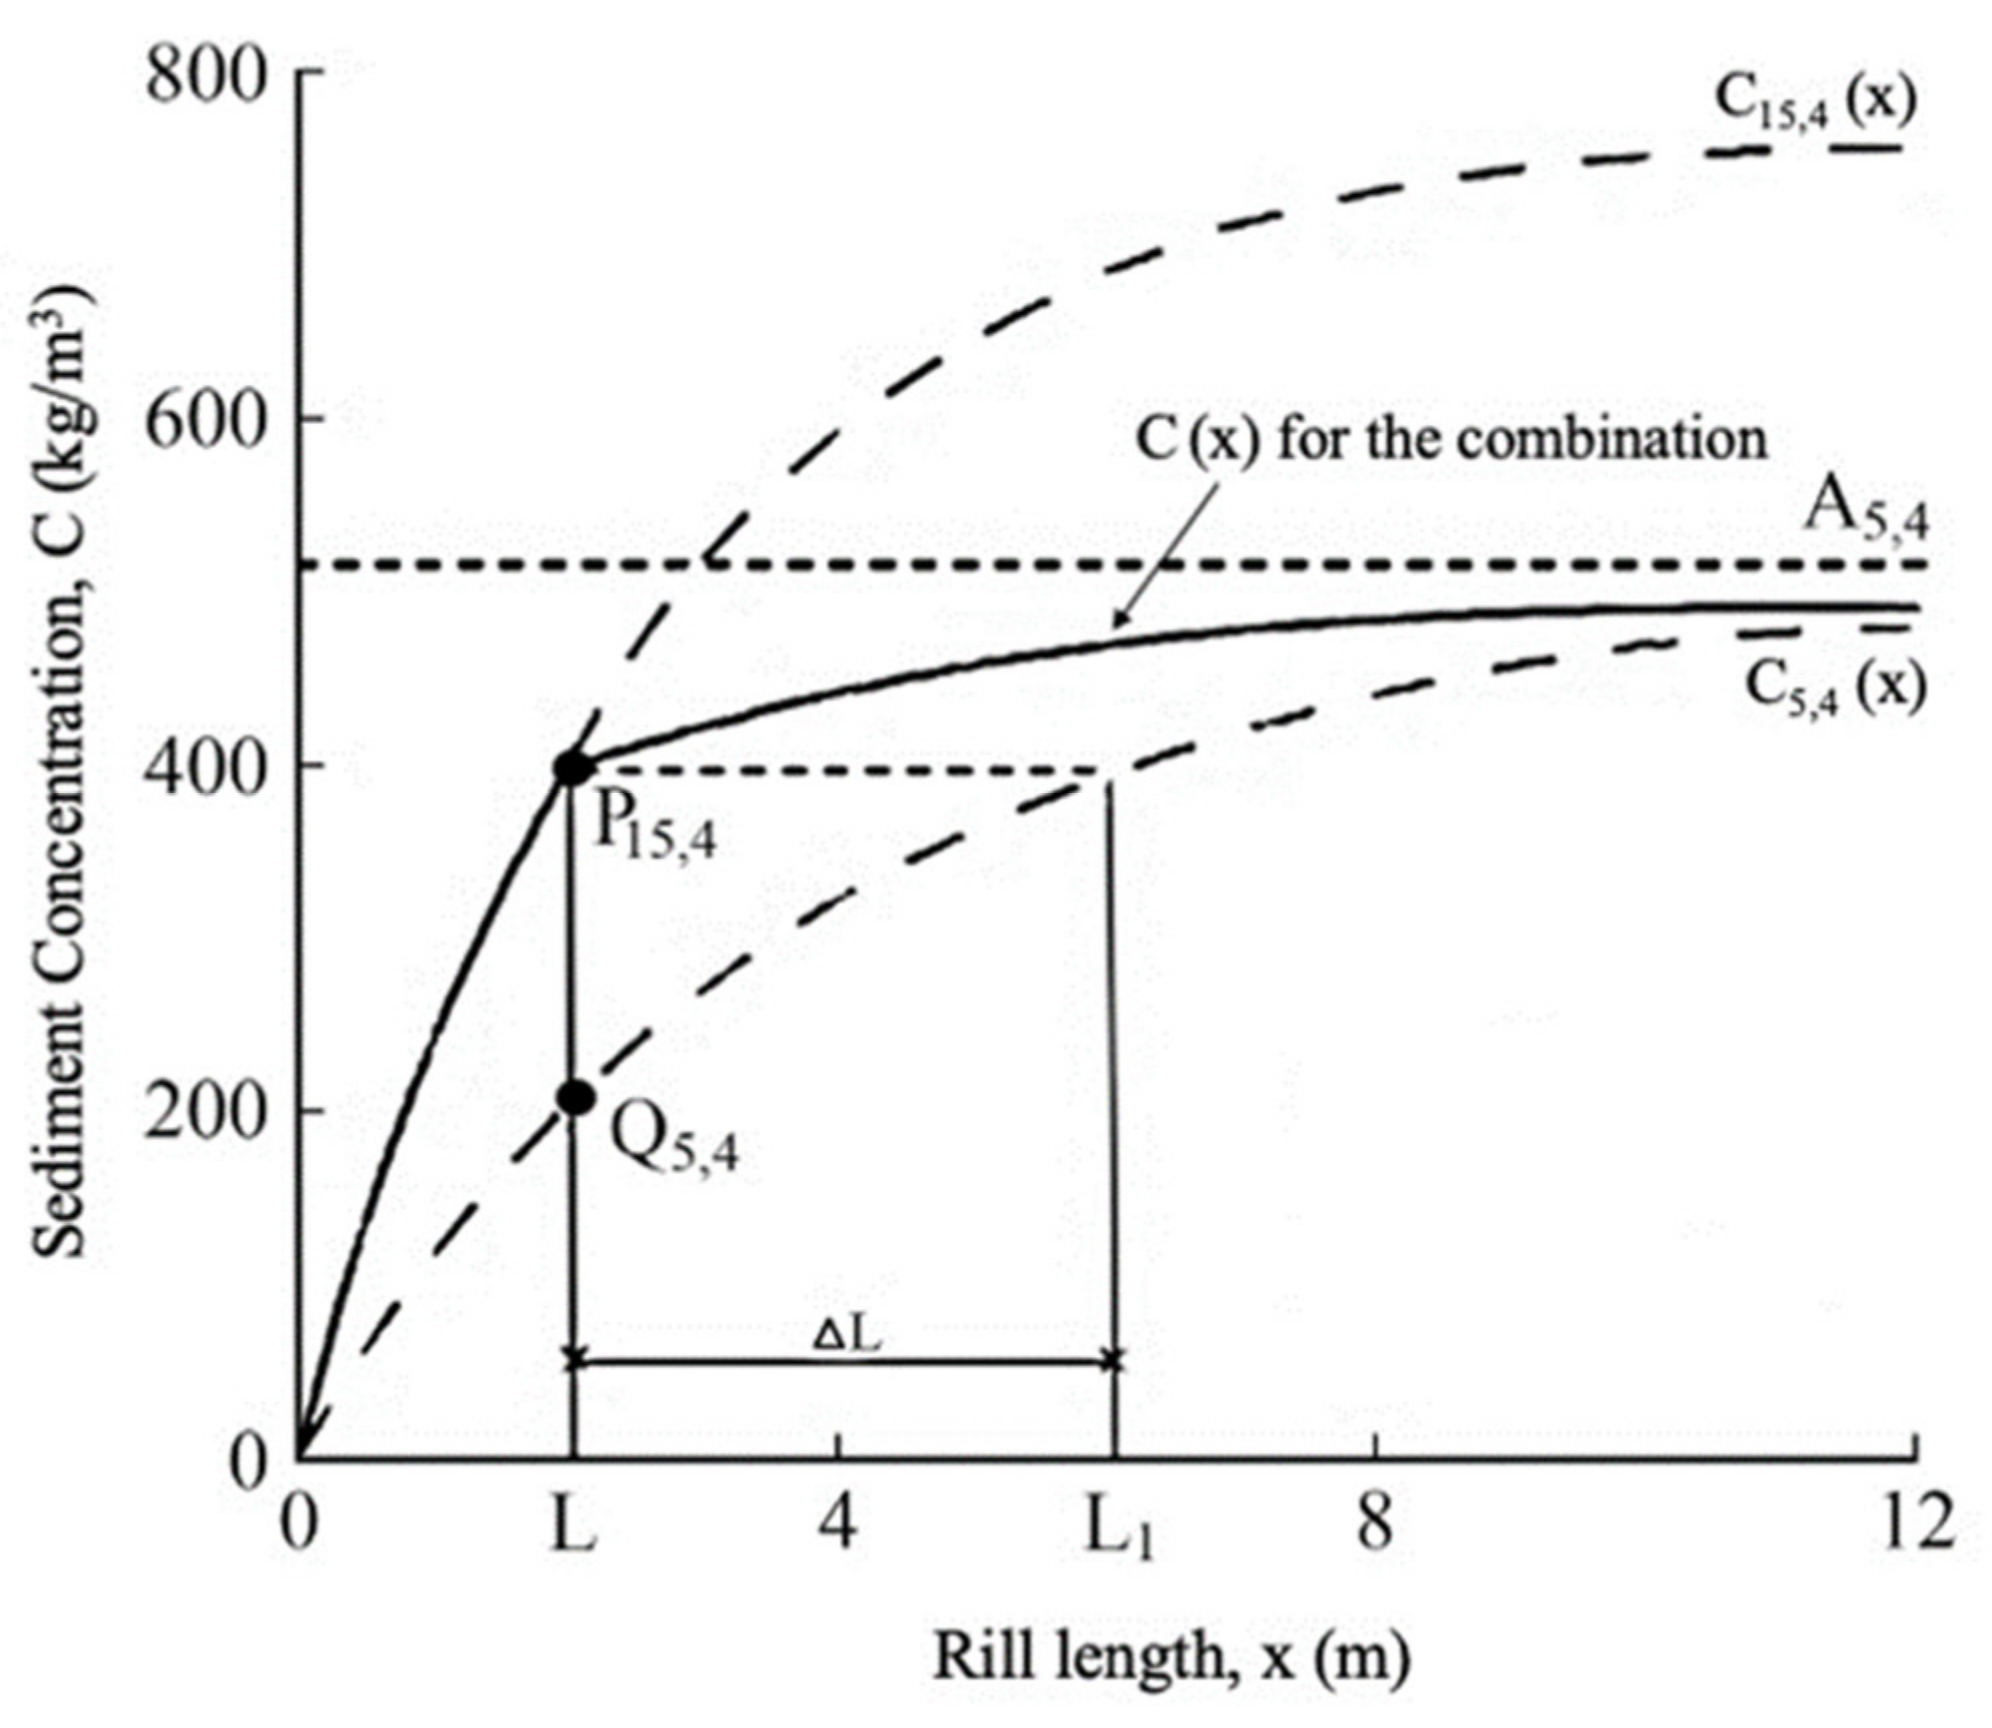
Figure 4 conceptually illustrates the sediment delivery processes under a slope gradient of 5° and 15° with the same flow rate of 4 L min−1. The square symbols, named curve C(5, 4), indicate the process under the slope gradient of 15°, and the triangular symbols, named curve C(15, 4), reveal the process of 15° slope. The curves C(5, 4) and C(15, 4) present the sediment concentration distributions along the eroding loess rills, while the demonstration is based on measurements by [12].
In Figure 4, L is the length of the rill section for the sediment supply section in the design for this study; Ls is the equivalent rill length; L   is the equivalent increased rill length; P15,4 and Q5,4 are the sediment concentrations under slope gradient 15° and 5° with the flow rate being 4 L min−1 at the slope length of L.
The sediment concentration is most likely far from that at the sediment transport capacity when the water flow reaches the rill outlet of an 8 m long flume when the slope is at 5° or 10°. If the uppermost rill section is increased by an additional slope gradient of 10°, it will be able to supply enough sediment for measuring the sediment transport capacity of a rill at a slope gradient of 5°. In this case, the slope gradient for the sediment supply section reaches 15° as relevant to the horizontal level. Under this slope gradient, the process of sediment concentration along with rill length for a slope gradient of 15°, as presented by the solid curve in Figure 4, follows the mathematical expressions according to Equation (3):
C 5 , 4 = A 5 , 4 1 e B 5 , 4 x
C 15 , 4 = A 15 , 4 1 e B 15 , 4 x
where C5,4 and C15,4 is the functional sediment delivery process along the eroding rill under slope gradient of 5° and 15° with a flow rate of 4 L min−1, respectively, kg m−3; A5,4 and A15,4 are the maximum possible sediment concentrations that the rill flow can reach under slope gradient of 5° and 15° at the given flow rate condition, respectively, kg m−3; B5,4 and B15,4 are the parameters representing the reduction rate of sediment increase along the eroding rill under slope gradient of 5° and 15°, respectively, 1/m; x is the rill length, m.
When concentrated flows to the end of the erosion-sediment feeding section, sediment concentration on curve C15,4 reaches P15,4, which is considerably higher than that on curve C5,4, as the point Q5,4. In this case, there are more sediments added into the concentrated flow that make the sediment concentration keep increasing to approach the sediment transport capacity of the flow. At this point, the sediment concentration in the concentrated flow can be possibly higher than or still lower than that at the sediment transport capacity (equal to C5,4max), at the designated slope gradient of 5°. When the sediment concentration is higher than the value at transport capacity (C15,4 > C5,4max) sediment starts to deposit until the sediment concentration approaches the sediment transport capacity. When C15,4 < C5,4max, there are more sediments picked up from erosion of the rill on the section.
As presented in Figure 4, sediment concentration C15,4 reaches a level equivalent to the sediment produced by a rill length of L1 under slope gradient 5°, as given by:
C 15 , 4 L = C 5 , 4 L 1 = A 5 , 4 1 e B 5 , 4 L 1
From Equation (8), the sediment feed from a rill of L m long at a 15° slope produces a sediment concentration equivalent to that from a rill of L1 m long at a 5° slope:
L 1 = 1 B 5 , 4 l n 1 C 15 , 4 A 5 , 4  
Due to sediment feeding by the slope of L m long at 15° slope, the equivalent rill length at 5° slope gradient is increased by:
L = L 1 L
Therefore, using an 8 m long can measure the sediment yielded from a rill of 8 + L m long. In this way, sediment transport capacity under lower slopes can be measured through sediment feeding by the increased slope gradient section.
The general expression to compute the equivalent rill length is given as:
L s = 1 B s , q ln 1 C s + 10 , q A s , q
where Ls is the equivalent of slope gradient s° when sediments are fed by a slope of L m long and a relative slope gradient of 10° to produce a sediment concentration of C s + 10 , q ; B s , q   is the coefficient representing the decrease in sediment increase, and A s , q   is the maximum sediment concentration under slope gradient s and flow rate q.
The increased sediments by the supply section of L (m) long produce a sediment concentration similar to that produced by equivalent increased rill length of L m long under a slope gradient of s° and flow rate of q (L min−1):
L = L s L
The increased equivalent rill length for loess soil under different flow rates and slope gradients are computed with Equations (12) and (13) and listed in Table 4.
According to Equation (3)
lim c T c c x = lim x A 1 e B x = A
If taking sediment concentration less than 5% from the maximum value as that at transport capacity, then based on Equation (3), the required rill length for sediment capacity measurement can be estimated as:
lim c 95 % T c c = A 1 e BL req
A 1 e BL req 95 % A
Equation (15) produces:
L req 3 / B
The rill length (L0) plus the increased equivalent rill length L defines the equivalent rill length:
L eq = L 0 + L s L
The L req and L eq were estimated with the experimental data from loess rills listed in Table 5.
In Table 5, all the values of Leq are greater than those of Lreq, which indicates the arrangement supplying sufficient sediment for transport capacity measurement.
The error in the measured sediment transport capacity when using a uniform-sloped 8 m long rill is estimated in the following equation:
E 8 = T c T c 1 e 8 B T c × 100 % = e 8 B × 100 %
where E8 is the error in estimated sediment transport capacity when using a rill of 8 m long.
The error in estimating the transport capacity of the loess soil when using an 8 m long flume of the uniform slope is shown in Table 4, in the column of E8.
Table 5 indicates that when the slope gradient is lower than 15°, an 8 m long rill of the uniform slope may not be long enough to measure sediment transport capacity, since almost all the required rill lengths are bigger than 8 m. The resulting measurement error in transport capacity can reach 15 to 25%. Table 4 also shows that all the equivalent rill lengths are greater than the values of the required rill lengths, Lreq, which means that the equivalent rill lengths are all sufficient to measure sediment transport capacity under slope gradients of 5°, 10°, and 15°.

4.2. Comparisons with Previous Studies on the Similarly Constructed Rills

Lei et al. [12] and Chen et al. [31] made a series of rill erosion experiments on uniform slope flumes with artificial rills, which are similar to the setting of our study but on different soils. We, therefore, chose their Tc values as the comparative set to assess our method and Tc measurements. Their experiments both involved 5 slope gradients of 5°, 10°, 15°, 20°, and 25° and 3 inflow rates of 2, 4, and 8 L min−1. Some basic information about the material for the comparative data set is shown in Table 5.
In their study, the sediment concentrations measured from different rill lengths were regressed according to Equation (3) and the regression parameter A were used to calculated Tc was by Equation (4).
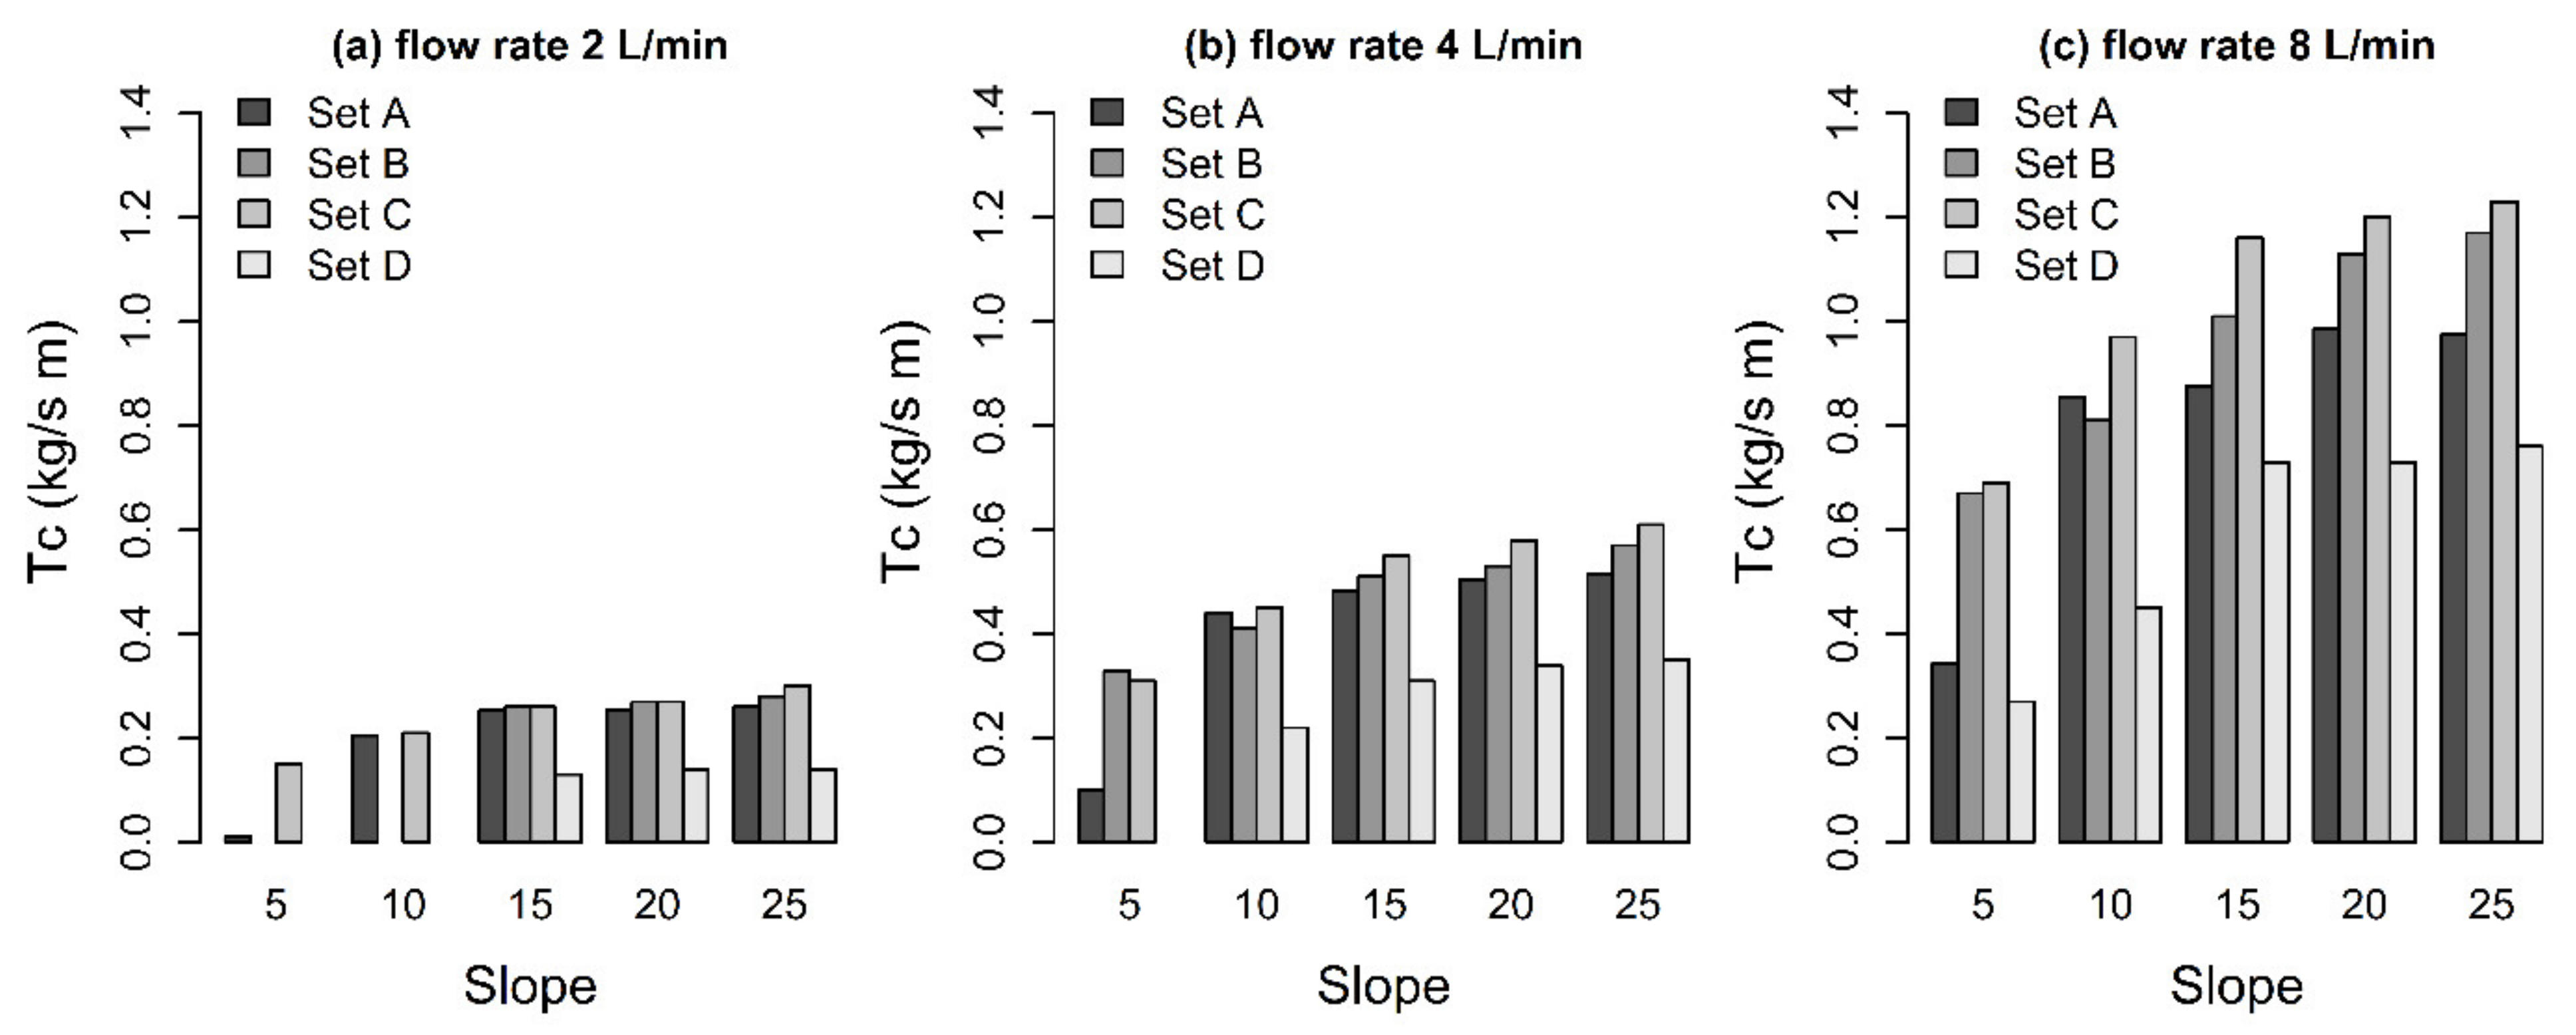
Comparisons of measured Tc in the current study and estimations for Loess Soil by Lei et al. (2001) [12] (Set B), and measured Tc in for Loess Soil (Set C) and Purple soil (Set D) by Chen et al. (2015) [31] are shown in Figure 5. There are several interesting findings: (1) For the lowest slope of 5°, the lowest flow rate of 2 L min−1, the uniformly-slope flume used in Lei et al. [12] is not adequate to obtain valid estimates through the exponential model for computing sediment transport capacity. That is a defect of this method, but the newly suggested procedure here overcomes this challenge well, and provides a feasible option for obtaining Tc values for small flow on a gentle slope. (2) For comparison for slope above 10°, it is obvious that the lower the flow rate is, the better the consistency between the two methods. Furthermore, the result of Set B seems to overestimate Tc compared to measurements of Set A. (3) The result of Set B seems to overestimate Tc than measurements of Set A except for the result for the slope of 10°. The last two results indicated above were probably from the exponential model that was based on to estimate. The procedure used for Set B is based on the exponential fitting of Equation (3) by using the concentration measurements from the uniformly sloped 8 m long flume.

5. Conclusions

To overcome the difficulties of measuring sediment transport capacity with limited rill length, especially under low slope gradients and flow rates, a special water flume with variable slope gradients in different sections was suggested to feed and transport sediments. The flume has an upper section set at 10° steeper than the lower part of the flume. This part, with a higher slope gradient, produces faster water to produce faster concentrated flow velocity and more sediments to the concentrated flow. The next part of the flume is used to further supply sediments to the concentrated flow through sediment detachment or to deposit excessively supplied sediment at the upper part of the flume. The third section of the flume is used to deliver sediments to the flume outlet at the sediment transport capacity level. The measured sediment transport capacity values were compared with those from other rill erosion experiments. At higher slope gradients of 15°, 20°, and 25°, the newly suggested method produced almost the same transport capacity values as measured through rill erosion process data. Under the lower slope gradients, limited rill length was not capable of producing sufficient sediments to measure sediment transport capacity. Data analysis indicates an 8 m long flume produced maximum sediment concentrations about 40% lower than the values measured with the new method. The new method is demonstrated as being capable of supplying sufficient sediment for transport capacity measurement. The method proposed in the study can supply a feasible approach for the research of sediment transport capacity of different soils and can supply important model parameters for soil erosion prediction.

Author Contributions

Conceptualization, T.L., L.Q. and X.Y.; methodology, C.Z. and L.Q.; investigation, C.Z.; writing—original draft preparation, T.L. and L.Q.; writing—review and editing, L.Q. and X.Y. All authors have read and agreed to the published version of the manuscript.

Funding

This research was supported by the National Natural Science Foundation of China under project No. U2243213 and the National Key Research and Development Program of China (No. 2016YFC0501602).

Conflicts of Interest

The authors declare no conflict of interest.

References

  1. Lei, T.; Nearing, M.A.; Haghighi, K.; Bralts, V.F. Rill Erosion and Morphological Evolution: A Simulation Model. Water Resour. Res. 1998, 34, 3157–3168. [Google Scholar] [CrossRef]
  2. Nearing, M.; Norton, L.; Bulgakov, D.; Larionov, G.; West, L.; Dontsova, K. Hydraulics and Erosion in Eroding Rills. Water Resour. Res. 1997, 33, 865–876. [Google Scholar] [CrossRef]
  3. Zhang, G.; Wang, L.; Li, G.; Tang, K.; Cao, Y. Relationship between Sediment Particle Size and Transport Coefficient on Steep Slopes. Trans. ASABE 2011, 54, 869–874. [Google Scholar] [CrossRef]
  4. Zhang, G.; Shen, R.; Luo, R.; Cao, Y.; Zhang, X. Effects of Sediment Load on Hydraulics of Overland Flow on Steep Slopes. Earth Surf. Process. Landf. 2010, 35, 1811–1819. [Google Scholar] [CrossRef]
  5. Roo, A.P.J.D.; Wesseling, C.G.; Ritsema, C.J. LISEM: A Single-Event Physically Based Hydrological and Soil Erosion Model for Drainage Basins. I: Theory, Input and Output. Hydrol. Process. 1996, 10, 1107–1117. [Google Scholar] [CrossRef]
  6. Nearing, M.; Foster, G.; Lane, L.; Finkner, S. A Process-Based Soil Erosion Model for USDA-Water Erosion Prediction Project Technology. Trans. ASAE 1989, 32, 1587–1593. [Google Scholar] [CrossRef]
  7. Morgan, R.; Quinton, J.; Smith, R.; Govers, G.; Poesen, J.; Auerswald, K.; Chisci, G.; Torri, D.; Styczen, M. The European Soil Erosion Model (EUROSEM): A Dynamic Approach for Predicting Sediment Transport from Fields and Small Catchments. Earth Surf. Process. Landf. 1998, 23, 527–544. [Google Scholar] [CrossRef]
  8. Julien, P.; Simons, D. Sediment Transport Capacity of Overland Flow. Trans. ASAE 1985, 28, 755–762. [Google Scholar] [CrossRef]
  9. Finkner, S.; Nearing, M.; Foster, G.; Gilley, J. A Simplified Equation for Modeling Sediment Transport Capacity. Trans. ASAE 1989, 32, 1545–1550. [Google Scholar] [CrossRef]
  10. Govers, G. Empirical Relationships for Transport Capacity of Overland Flow; IAHS Press: Wallingford, UK, 1990. [Google Scholar]
  11. Ferro, V. Evaluating Overland Flow Sediment Transport Capacity. Hydrol. Process. 1998, 12, 1895–1910. [Google Scholar] [CrossRef]
  12. Lei, T.; Zhang, Q.; Zhao, J.; Tang, Z. A Laboratory Study of Sediment Transport Capacity in the Dynamic Process of Rill Erosion. Trans. ASAE 2001, 44, 1537. [Google Scholar] [CrossRef]
  13. Alonso, C.; Neibling, W.; Foster, G. Estimating Sediment Transport Capacity in Watershed Modeling. Trans. ASAE 1981, 24, 1211–1220. [Google Scholar] [CrossRef]
  14. Yalin, M.S. An Expression for Bed-Load Transportation. J. Hydraul. Div. 1963, 89, 221–250. [Google Scholar] [CrossRef]
  15. Yu, B.; Rose, C.; Ciesiolka, C.; Coughlan, K.; Fentie, B. Toward a Framework for Runoff and Soil Loss Prediction Using GUEST Technology. Soil Res. 1997, 35, 1191–1212. [Google Scholar] [CrossRef]
  16. Guy, B.T.; Dickenson, T.W.; Sohrabi, T.M.; Rudra, R.P. Development of an Empirical Model for Calculating Sediment-Transport Capacity in Shallow Overland Flows: Model Calibration. Biosyst. Eng. 2009, 103, 245–255. [Google Scholar] [CrossRef]
  17. Govers, G. Evaluation of Transporting Capacity Formulae for Overland Flow; University College London Press: London, UK, 1992. [Google Scholar]
  18. Nord, G.; Esteves, M.; Lapetite, J.; Hauet, A. Effect of Particle Density and Inflow Concentration of Suspended Sediment on Bedload Transport in Rill Flow. Earth Surf. Process. Landf. 2009, 34, 253–263. [Google Scholar] [CrossRef]
  19. Everaert, W. Empirical Relations for the Sediment Transport Capacity of Interrill Flow. Earth Surf. Process. Landf. 1991, 16, 513–532. [Google Scholar] [CrossRef]
  20. Guy, B.T.; Rudra, R.P.; Dickenson, T.W.; Sohrabi, T.M. Empirical Model for Calculating Sediment-Transport Capacity in Shallow Overland Flows: Model Development. Biosyst. Eng. 2009, 103, 105–115. [Google Scholar] [CrossRef]
  21. Poesen, J.; Savat, J. Particle-Size Separation during Erosion by Splash and Runoff; Wiley: Chichester, UK, 1980. [Google Scholar]
  22. Ghadiri, H.; Rose, C. Sorbed Chemical Transport in Overland Flow: II. Enrichment Ratio Variation with Erosion Processes. J. Environ. Qual. 1991, 20, 634. [Google Scholar] [CrossRef]
  23. Farenhorst, A.; Bryan, R.B. Particle Size Distribution of Sediment Transported by Shallow Flow. CATENA 1995, 25, 47–62. [Google Scholar] [CrossRef]
  24. Issa, O.M.; Bissonnais, Y.L.; Planchon, O.; Favis-Mortlock, D.; Silvera, N.; Wainwright, J. Soil Detachment and Transport on Field- and Laboratory-scale Interrill Areas: Erosion Processes and the Size-selectivity of Eroded Sediment. Earth Surf. Process. Landf. 2006, 31, 929–939. [Google Scholar] [CrossRef]
  25. Shih, H.-M.; Yang, C. Estimating Overland Flow Erosion Capacity Using Unit Stream Power. Int. J. Sediment Res. 2009, 24, 46–62. [Google Scholar] [CrossRef]
  26. Prosser, I.P.; Rustomji, P. Sediment Transport Capacity Relations for Overland Flow. Prog. Phys. Geogr. 2000, 24, 179–193. [Google Scholar] [CrossRef]
  27. Zhang, G.; Liu, Y.; Han, Y.; Zhang, X. Sediment Transport and Soil Detachment on Steep Slopes: I. Transport Capacity Estimation. Soil Sci. Soc. Am. J. 2009, 73, 1291. [Google Scholar] [CrossRef]
  28. Nearing, M.; Simanton, J.; Norton, L.; Bulygin, S.; Stone, J. Soil Erosion by Surface Water Flow on a Stony, Semiarid Hillslope. Earth Surf. Process. Landf. 1999, 24, 677–686. [Google Scholar] [CrossRef]
  29. Liu, B.; Nearing, M.; Shi, P.; Jia, Z. Slope Length Effects on Soil Loss for Steep Slopes. Soil Sci. Soc. Am. J. 2000, 64, 1759. [Google Scholar] [CrossRef]
  30. Yang, C.T. Unit Stream Power and Sediment Transport. J. Hydraul. Eng. 1972, 98, 1805–1826. [Google Scholar] [CrossRef]
  31. Chen, X.; Huang, Y.; Zhao, Y.; Mo, B.; Mi, H. Comparison of Loess and Purple Rill Erosions Measured with Volume Replacement Method. J. Hydrol. 2015, 530, 476–483. [Google Scholar] [CrossRef]
  32. Dong, Y.; Li, F.; Zhang, Q.; Lei, T. Determining Ephemeral Gully Erosion Process with the Volume Replacement Method. CATENA 2015, 131, 119–124. [Google Scholar] [CrossRef]
  33. Zhang, G.; Liu, B.; Zhang, X. Applicability of WEPP Sediment Transport Equation to Steep Slopes. Trans. ASABE 2008, 51, 1675–1681. [Google Scholar] [CrossRef]
  34. Nearing, M.A.; Lane, L.J.; Alberts, E.E.; Laflen, J.M. Prediction Technology for Soil Erosion by Water: Status and Research Needs. Soil. Sci. Soc. Am. J. 1990, 54, 1702–1711. [Google Scholar] [CrossRef]
  35. Polyakov, V.O.; Nearing, M.A. Sediment Transport in Rill Flow under Deposition and Detachment Conditions. Catena 2003, 51, 33–43. [Google Scholar] [CrossRef] [Green Version]
  36. Hillel, D. Environmental Soil Physics; Academic Press: San Diego, CA, USA, 1998; pp. 61–65. [Google Scholar]
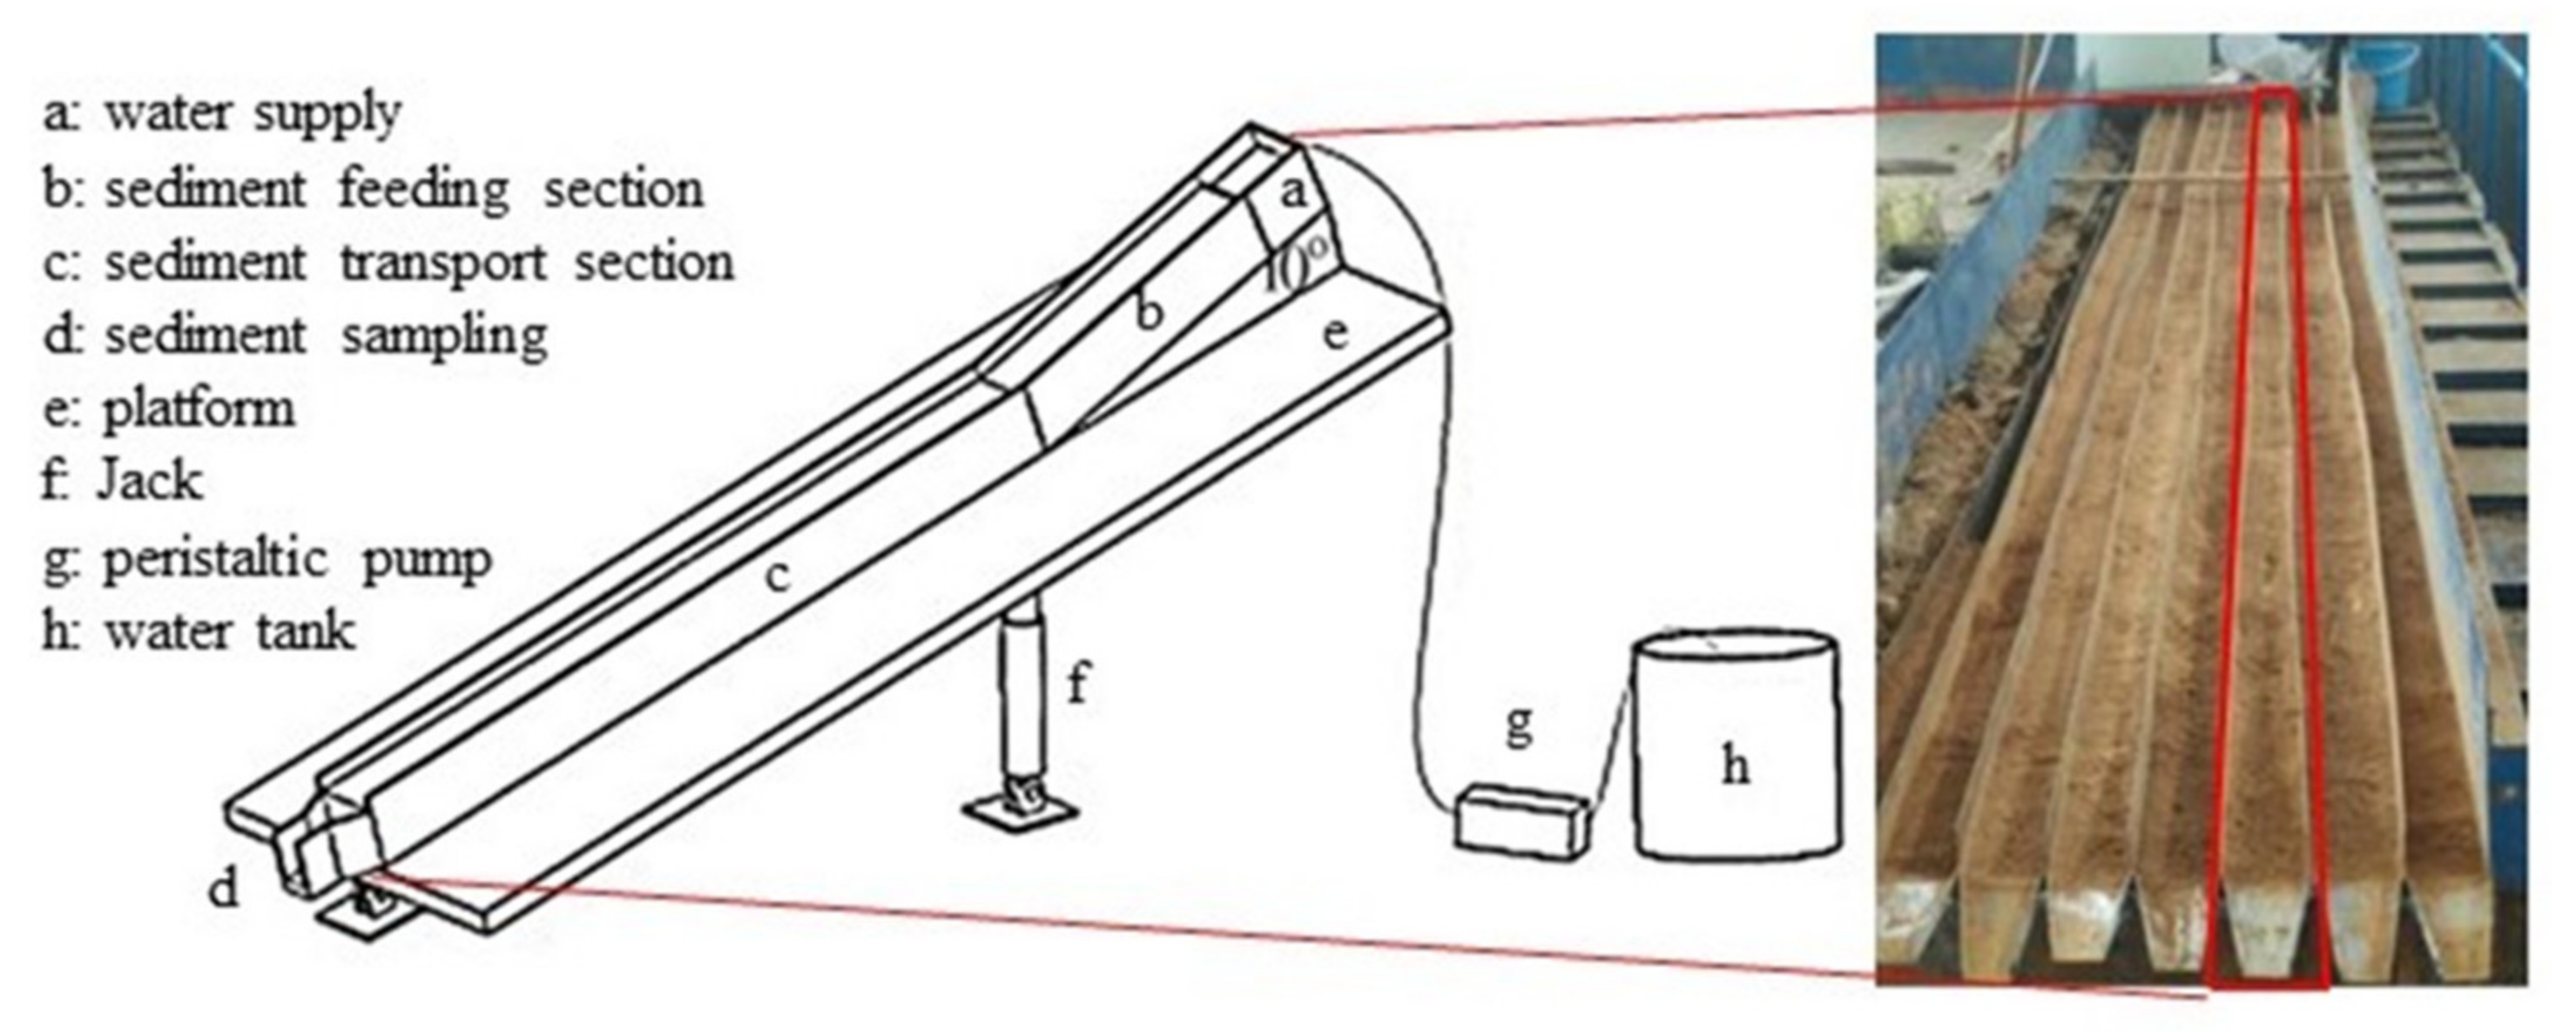
Figure 1. Principle diagram of the device for sediment transport capacity measurement.
Land 12 00411 g001
Figure 2. Relationship between measured transport capacity (Tc) and flow rate/slope, (a) relationship between transport capacity and flow rate, and (b) relationship between transport capacity and slope.
Land 12 00411 g002
Figure 3. Comparison of measured Tc and those fitted with slope and flow rate.
Land 12 00411 g003
Figure 4. Sediment increase process under different slope gradients and a flow rate of 4 L min−1.
Land 12 00411 g004
Figure 5. Sediment transport capacity values of Beijing soil measured in this study (Set A), those of loess soil by Lei et al. [12] (Set B), measured Tc in for Loess Soil (Set C) and Purple soil (Set D) by Chen et al. [31], (a) sediment transport capacity for flow rate being 2 L/min, (b) sediment transport capacity for flow rate being 4 L/min and (c) sediment transport capacity for flow rate being 8 L/min.
Land 12 00411 g005
Table 1. Measured sediment transport capacity (Tc, kg m−1 s−1) of concentrated flow with the erosion feeding method.
SlopeFlow Rate (L min−1)
24816
TcStdTcStdTcStdTcStd
5° (9%)0.0110.00050.1000.00180.3440.02450.7680.0082
10° (18%)0.2050.00230.4410.01550.8550.00401.6140.0142
15° (27%)0.2540.00320.4830.00170.8760.00721.7310.0396
20° (36%)0.2550.00800.5040.01530.9850.02351.9290.0391
25° (47%)0.2600.00120.5160.00420.9750.00822.0390.0086
Std: standard deviation.
Table 2. Parameters for Tc regressed to different slope and flow rate.
EstimatesStdErrort ValuePr (>|t|)
a−0.4279260.119260−3.5880.0022660.01
b0.0284600.0061774.6050.0002510.001
c0.1011030.00814512.4125.99 × 10−100.001
Std: standard deviation.
Table 3. Supplied sediment concentration of a loess rill of 2 m long (kg m−3).
Slope
(Measuring Flume)
Slope
(Feeding Flume)
Flow Rates (L min−1)
248
5° (9%)15° (27%)278 (-)308 (147)395 (190)
10° (18%)20° (36%)442 (-)530 (242)501 (208)
15° (27%)25° (47%)497 (278)543 (308)507 (395)
Notes: The numbers in the brackets are the sediment concentrations from the rill of 2 m long under the slope gradient of the measuring flume. Calculations are based on equations and parameters in Lei et al. (2001) [12], where c = A 1 e β x B , c is sediment load, g mL−1; β is reduction coefficient (also a regression coefficient); x is the slope length, m; A and B are regression coefficients.
Table 4. Required rill length and the equivalent rill length and error estimation for sediment transport capacity measurement of the loess slope with 8 m long flume.
Slopeq
L min−1
ΔL 1
m
Lreq 2
m
Leq 3
m
E8 4
%
2 ---
44.6012.5012.6024.67
89.6311.5414.9322.45
10°2 ---
43.368.8211.3616.59
84.528.8212.5216.59
15°20.737.508.73-
41.398.119.3916.18
81.216.679.21-
1 increased equivalent length. 2 required rill length = 3/B. 3 equivalent rill length = 8 + ΔL. 4 the error in estimated sediment transport capacity when using a rill of 8 m long.
Table 5. Properties of soils in the current study and comparative studies.
Data SetSoil TextureBulk DensityFlume Length
Clay%Silt%Sand%g cm−3m
Current study14.244.940.91.28
Loess Soil (Lei et al. 2001) [12]15.963.920.21.2–1.38
Loess Soil (Chen et al. 2015) [31]15.9263.9020.181.212
Purple Soil (Chen et al. 2015) [31]38.6535.7425.611.212
Note: Clay (>0.05 mm), Silt (0.005–0.05 mm), Sand (>0.05 mm) according to the USPRA (U.S. Public Roads Administration) soil texture classification system [36].
Disclaimer/Publisher’s Note: The statements, opinions and data contained in all publications are solely those of the individual author(s) and contributor(s) and not of MDPI and/or the editor(s). MDPI and/or the editor(s) disclaim responsibility for any injury to people or property resulting from any ideas, methods, instructions or products referred to in the content.