Abstract
The ecological compensation of cultivated land could also be called paying for the ecological service of cultivated land. It means that based on comprehensive consideration of the cost of the protection of the cultivated land and the value of the ecological service, the benefited area would implement the ecological compensation to the damaged area to motivate the actors of the protection behavior to protect the cultivated land better. A fair and reasonable cultivated land ecological compensation mechanism is critical in motivating cultivated land protection subjects’ active participation in cultivated land protection. However, most of the currently measured cultivated land ecological compensation standards are only determined from the perspective of a single interest, ignoring the participation and negotiation of cultivated land protection stakeholders, resulting in insufficient pertinence, low compensation standards, and low compensation efficiency. Therefore, by introducing a market mechanism, this study constructs a non-cooperative bargaining model and solves three stages of the game equilibrium solution under the condition of comprehensive consideration of interests of farmland ecosystem service providers and consumers. In this study, the Yangtze River Economic Belt is taken as the research area to provide empirical analysis of a cultivated land ecological game compensation standard between the subject and object of cultivated land ecological compensation in the area. The study found that, under the ecological compensation standard for cultivated land determined by the bargaining game, the cultivated land ecological compensation subject and object in the area meets the “KaldorHicks” resource allocation criterion, and the standard can take into account the interests of both parties. Meanwhile, the river basin horizontal ecological compensation quota determined by the game standard will neither cause a financial dilemma in the payment area due to the excessive compensation quota, nor financial “windfall gain” in the compensated area due to ecological finance transfer of cultivated land. The cultivated land ecological compensation standard based on the game between the two parties is reasonable and accurate for the cultivated land ecological compensation object, which not only functions as an economic incentive, but maintains long-term effectiveness of policy. Therefore, it is necessary to actively promote the determination of ecological compensation standards based on negotiation means, and to establish a sustainable ecological protection compensation mechanism involving government predomination, social engagement, and market-oriented operations, to drive marketization of cultivated land ecological compensation.
1. Introduction
As one of the essential elements of agricultural production, cultivated land has social and economic services such as producing food to ensure food security and maintaining the livelihood of regional farmers in the region, as well as ecological services such as conserving water and soil resources, regulating climate, and protecting biodiversity [1,2,3]. With improved social and economic development and higher living standards, cultivated land’s ecological service function value plays a more prominent role [4]. Therefore, various cultivated land protection policies have been implemented in different regions of the world to reduce the loss of cultivated land and maintain the multifunctional value of cultivated land. For example, the United States protects cultivated land through the planning method of delimiting boundaries, urban construction areas, and agricultural areas, which prohibits agricultural land in agricultural areas from being used for nonagricultural purposes [5]; Germany protects the quantity and quality of cultivated land by delimiting cultivated land protection areas and formulating special agricultural plans for soil conservation and cultivated land consolidation [6]; Japan has divided agricultural land into agricultural land outside the urbanization adjustment area and agricultural land within the area, within which the former land is divided into three categories: agricultural land in an agriculture protection area, in regions that have potential for future urbanization development, and in an urban construction area, to regulate urban area’s encroachment onto agricultural land [7]; Israel controls the process of agricultural land use conversion through an approval system to achieve the goal of stabilizing the amount of cultivated land [8]. The Chinese government has also implemented a series of cultivated land protection policies since the founding of the PRC. The main objectives of the cultivated land protection policies implemented in each period can be roughly divided into four stages. (1) From 1949 to 1978, during China’s socialist revolution and construction, the “grain as the key link” policy of arable land utilization was implemented. This stage was mainly used to develop agricultural production as soon as possible, increase grain output, increase farmers’ income, and stabilize the rural economy [9]. (2) From 1978 to 2004, in the early stage of China’s reform and opening up, the policy of “protection of cultivated land quantity” was implemented to deal with the dilemma of a sharp decrease in cultivated land quantity from four aspects: establishment of land survey and statistics system, basic farmland protection system, land use planning system, and illegal farmland occupation system [10]. (3) From 2004 to 2012, during the deepening period of China’s reform and opening up, the policy of “quantity and quality of cultivated land” protection was implemented. The most stringent cultivated land protection system was implemented in five aspects, including defining the red line of 1.8 billion mu of cultivated land, strengthening the balance of cultivated land occupation and compensation, strengthening the basic farmland protection system, strengthening the supervision and management of cultivated land, strengthening the economic means of cultivated land protection and utilization, and deepening the policy system of cultivated land quality protection [11]. (4) From 2012 to 2022, in the new era of China, the cultivated land protection policy of “cultivated land quantity and quality and ecology” was implemented. The cultivated land protection system was strengthened from four aspects: improving the legal system, strengthening the construction of high-standard basic farmland, strengthening the balance of cultivated land occupation and compensation, and implementing the rotation and fallow of cultivated land [12]. The farmland protection policy has curbed the decrease in farmland to a certain extent. However, it has brought some adverse effects, which are mainly manifested in the following two aspects: First, due to the delimitation of cultivated land protection areas and agricultural planting areas, or the implementation of land use control systems, these areas are overprotected and develop in a restricted way, which inhibits regional economic development and intensifies the imbalance of inter-regional development [13,14]. In addition, driven by substantial economic benefits, local governments have a strong motivation to occupy cultivated land, especially when there is no supervision mechanism for these governments by the central government, and when local governments are more likely to become the main driving force for the nonagriculturalization of cultivated land, which will increase the reduction risk of cultivated land [15,16]. Second, as the main body of arable land utilization, farmers expect to obtain more income through arable land utilization, which will drive them to increase the use of pesticides, fertilizers, and other chemical products to obtain a greater agricultural output value. However, external input exceeding the environmental capacity and less environmentally friendly farming methods will result in the loss of the value of cultivated lands’ ecosystem services [17]. Moreover, the lack of government supervision and policy advocacy will aggravate farmers’ disorderly use of farmland and farmland pollution [18]. At the same time, the low comparative advantage of arable land utilization will lead to farmers’ choosing nonagricultural work, resulting in a large amount of abandoned and idle arable land, and endangering food security [19]. One of the reasons for this phenomenon is that the attribute of public products of cultivated land resources makes the marginal private benefits deviate from the marginal social benefits, which brings challenges in motivating the principal part of cultivated land protection to strengthen cultivated land protection [20,21]. There is a lack of economic compensation policies for the stakeholders of cultivated land protection, and it is hard to best take effect only by relying on institutional cultivated land protection policies [22], especially in developing countries, which have been proven to be ineffective or inefficient. In response to this problem, Pigou assumes that it can be solved by taxation and subsidies. Implementing taxation and subsidy policies can internalize the external effects of cultivated land protection and achieve optimization between the individual and society. Therefore, the protection of cultivated land relies on the government’s administrative approaches, as well as compensation and economic incentive policy of cultivated land protection, to maximize the effect of cultivated land protection. Ecological compensation is, as one of the significant economic incentive policies, not only conducive to alleviating the unbalanced development of the cultivated land protection area caused by taking the responsibility of overprotecting the land, but also conducive to encouraging a cultivated land protection subject to protect cultivated land and improve the ecological environment of cultivated land [23,24]. Therefore, some countries have implemented ecological compensation policies for cultivated land, such as the agricultural land ecological environment payment policy in the United States, the ESA project in the United Kingdom, and the ECA project in Switzerland. In 2020, China promulgated the “Regulations on Ecological Protection Compensation (Draft for Comment)”, which also clearly proposed that cultivated land should be listed as one of the main types of ecological protection compensation. Scientific and reasonable evaluation of cultivated land ecological compensation standards is the key to the implementation of cultivated land ecological compensation policy, which is related to the establishment of the cultivated land ecological compensation mechanism and the efficiency of implementing compensation [25]. Based on those, this study attempts to introduce the market mechanism and explore the core issues of determining the ecological compensation standard for cultivated land based on the game analysis mechanism.
Farmland ecological compensation is an economic incentive measure that effectively balances the contradiction between farmland protection and economic development. The essence of compensation is a process of internalizing externalities. The current academic research on the ecological compensation mechanism of cultivated land mainly focuses on the theoretical basis of the compensation mechanism [26], the division of the compensation area [27], the calculation of the compensation standard, and the analysis of the compensation effect [25,28]. Among them, the research on cultivated land ecological compensation standards are mainly based on the micro- and macroscales. On the microscale, the Conditional Value Method and Selection Experiment Method are mainly used to investigate farmers’ willingness to receive compensation and urban residents’ willingness to pay, which determine the cultivated land ecological compensation standards [29]; the Conditional Value Method is a method of measuring the value of goods or services by directly examining the economic behavior of respondents in a hypothetical market through a questionnaire survey to obtain consumers’ willingness to pay [30]. The Selection Experiment Method is to construct an imaginary market to provide respondents with a selection set of different attribute levels of resource and environmental products and services and to indirectly obtain the economic value of the resource and environmental products and services according to the respondents’ preference information [31]. Since these two methods determine the compensation standard based on the wishes of the respondents, the measured results are highly subjective, not comparable, and difficult to measure on a large scale. on the macroscale, the two perspectives of ecosystem service value theory and cost–benefit are exerted to quantify the ecological services value and the income loss caused by cultivated land protection. Based on the perspective of ecosystem service value, methods such as the Equivalent Factor Method and the Functional Value Method are mainly used to estimate the cultivated land ecosystem service value brought by regional cultivated land protection to determine the ecological compensation standards of cultivated land protection [32,33]. The Equivalent Factor Method is a method for evaluating the value of ecosystem services proposed by Chinese scholar Xie Gaodi based on the classification of ecosystem services by Costanza et al. [34]. This method constructs a standard and objective equivalent factor table, which has been widely used in the assessment of ecosystem service value at different regional scales [35,36]. Its advantages are it is intuitive and easy to use, does not require too much complicated data, and is very suitable for evaluating the value of ecosystem services at regional and national scales. The Functional Value Method obtains its value according to the amount and unit price of ecosystem services and simulates regional ecosystem services by establishing a production equation between a single service and local ecological environment variables, which has a more complicated calculation process and many parameters, and it is difficult to unify the value evaluation method and index system for each service [37]. While from the cost–benefit perspective, the cultivated land ecological compensation standards are determined by quantifying the cost and lost opportunity cost of ecosystem services provided by cultivated land protection [38,39]. The ecological compensation standard quantified by this method only considers the loss caused by cultivated land protection and does not include the ecological effect caused by cultivated land protection in the compensation standard, resulting in a low quantified compensation standard and insufficient incentives. The current related research provides a reference for implementing ecological compensation standards for cultivated land. However, the measure of the cultivated land ecological compensation standards are primarily based on the related theory and method of single quantitative, and the standards are determined only from the perspective of single benefits, ignoring the participation and negotiation of stakeholders in farmland protection, which has led to insufficient pertinence, low compensation standards, and low compensation efficiency of the measured farmland ecological compensation standards and results in limited incentives for farmland ecological compensation [24,40]. Nevertheless, if based on market means, qualifying ecological compensation standards through respective negotiation and game of relevant stakeholders can fully consider the compensation and willingness to pay of the relevant stakeholders, which is helpful to the implementation of ecological protection compensation for cultivated land [41,42]. Pagiola and Platais found that the introduction of a market mechanism makes the suppliers and consumers of ecosystem services know more information about the value of ecosystem services, which encourages them to have strong motivation to promote the effective operation of ecological compensation projects, namely, because the market transaction mode brings higher efficiency to ecological compensation [43].
Based on this, this study attempts to introduce the game mechanism into the process of determining the ecological compensation standard for cultivated land in the Yangtze River Economic Belt. The so-called game mechanism is a way to use the thinking of game theory to analyze the respective interests of both sides of the game and to build a game model to solve the game equilibrium solution to maximize the interests of both sides of the game [44]. The Yangtze River Economic Belt, as an inland heartland spanning eastern, central, and western China, is a crucial development axis for China’s territorial space development and economic layout, as well as the ecological–economic system of the largest river basin in China. Discussing the ecological compensation standards for cultivated land within the region has important practical significance for protection and inter-regional development balance, and it can also provide reference for other regions to explore ecological compensation for cultivated land.
2. Game Mechanism Elements in the Quantification of Ecological Compensation Standards for Cultivated Land
2.1. Formation of Ecological Compensation Game Environment of Cultivated Land
In response to the lack of policy in the ecological protection of cultivated land, various regions have issued a series of administrative regulations to promote the establishment of ecological compensation system for cultivated land. In 1985, the United States formulated the “Conservation Reserve Program”, which proposed actively combining the market and the government to improve the ecological environment of cultivated land [45]. In the program, farmers can freely apply to participate in the plan, and local governments can verify the ecological compensation standards for cultivated land based on the applied land standards and local economic level. In addition, the “Agricultural Law” promulgated in 2002 and the “Food, Rural Areas and Employment Act” promulgated in 2014 both require protecting the rights and interests of farmers and expanding farmers’ participation in the process of formulating compensation policies for farmland protection to easily obtain farmers’ support for the protection system. In the 1990s, Canada shifted the focus of compensation for farmland protection from individual commodity compensation to the “whole farm plan”, effectively linking up with the “WTO Agriculture Agreement”, which requires that agricultural land compensation should not only focus on the quantity of agricultural products, but also the quality of agricultural products, protecting the balance of agricultural land’s ecological system, and implementing a voluntary agricultural land environmental plan, which allows farmers to decide whether to participate in the plan or not and to choose the types of projects they participate in [46]. In 1976, Germany enacted the first law on ecological compensation: “Germany Federal Nature Conversation Act”, and subsequently enacted some legal systems such as the “Seed Law” and the “Ecological Agriculture Law”, requiring the implementation of an ecological compensation system at the national level. Some states of Germany formulated the “Ecological Compensation Regulations” according to their socio-economic development. These measures decided that the German agricultural ecological compensation operates in a compound compensation mechanism, with government compensation as the mainstay and market compensation as a supplement, including various forms of compensation, such as financial horizontal transfer payment, limited trade, direct payment, and direct trade [47]. Apart from that, the Organic Farming Act was promulgated following EU regulations in 2002, and the 2014–2020 EU Common Agricultural Policy was adjusted and improved in 2013, which increased the ecological fiscal quota of the horizontal transfer from the wealthier regional governments to the poorer regional governments and increased the green subsidies for farmers [48]. The Chinese government started the ecological compensation system relatively late, but it has issued a series of administrative regulations on ecological compensation for cultivated land. The “Recommendations on Formulating the Eleventh Five-Year Plan for National Economic and Social Development” is the earliest policy document that clearly defined the principles of ecological compensation, which proposed that an ecological compensation mechanism should be established according to the principle of “people who develop should protect, and who get benefits will compensate”. Subsequently, the “Action Plan for Establishing a Market-oriented and Diversified Ecological Protection and Compensation Mechanism” and the “Ecological Comprehensive Compensation Pilot Program” were issued in 2018 and 2019 to further improve the ecological compensation mechanism, requiring the establishment of a sustainable ecological protection compensation mechanism led by the government, participated by enterprises and society, and operated in a market-oriented manner. Furthermore, the “Regulations on Ecological Protection Compensation (Draft for Comment)” was promulgated in 2020, which proposed classifying cultivated land into main types of ecological protection compensation. All regions mentioned that the ecological compensation system established should consider the willingness of farmland protection subjects, maximize the role of market mechanism in ecological compensation, and ensure that the interests of farmland protection subjects are not damaged in their respective laws, regulations, and policy documents. To a certain extent, this institutional environment maintains the voice of the subject of farmland protection in formulating farmland ecological compensation standards, gives more freedom to their choices, and promotes the marketization of ecological compensation. Therefore, this study considers use the institutional environment as a benchmark to explore the bargaining game between the subject and object of cultivated land ecological compensation in the process of cultivated land protection.
2.2. Definition of the Subject and Object of Cultivated Land Ecological Compensation
Cultivated land, as a scarce resource with a public product attribute, will impact stakeholders in various natures and degrees in its protection and utilization. Regional externalities will occur when such impact is not fully included in the price of cultivated land and grain market transactions [49]. With improved social living standards, social entities’ demands for ecological products have gradually increased, followed by the gradual prominence of ecological benefit value of cultivated land and strong externalities of the land. Therefore, under the current policy background of the delimitation of cultivated land protection areas, agricultural planting areas, or land use control systems, the relevant interest groups of cultivated land protection ecological compensation mainly involve farmers and citizens at the microlevel and local governments at the macrolevel [50]. Farmers, as the principal part of cultivated land use and protection, are providers of cultivated land ecological services, while urban residents are consumers of cultivated land ecosystem services; local governments at all levels have different interests due to their responsibilities of farmland protection [51]. Undertaking too much responsibility for the protection of cultivated land will inhibit the transformation of the regional industrial structure and development, resulting in “wipeout loss”. In contrast, those that bear less responsibility for cultivating land protection will have more development opportunities, resulting in a “windfall gain” of interests [52]. However, due to the openness of social and economic development and the spread of environmental protection benefits, the service value of cultivated land ecosystem generated by the regions with excessive cultivated land protection responsibility will cause spillover. Therefore, the regions with excessive cultivated land protection responsibility should receive the cultivated land ecological compensation of the regions with less responsibility. This study takes the Yangtze River Economic Zone as the research object to discuss its cultivated land ecological compensation standards, which aims to establish a horizontal ecological compensation mechanism between the river basins. Hence, the study only discusses the cultivated land ecological compensation standards at the macrolevel.
Judging the “burden area” is the core task of defining the subject and object of compensation at the macrolevel. This study intends to judge the beneficiaries and the losers by supply and demand balance of ecological footprint and ecological carrying capacity of regional cultivated land use. If the ecological footprint of cultivated land use in the region is larger than its ecological carrying capacity, it means that the ecological service value of cultivated land in the region makes it difficult to meet the needs of the local population for the value, and it is a cultivated land ecological deficit area with spatial dependence; while if not, it indicates that the regional population’s demand for cultivated land ecology is less than the regional supply of cultivated land ecology, which is called the surplus area of cultivated land ecology with a spatial spillover of ecological benefits. Therefore, at the macrolevel, this study defines the ecological deficit area of cultivated land as the cultivated land ecological compensation subject and the ecological surplus area of cultivated land as the object. The definition of the subject and object of cultivated land ecological compensation is the fundamental prerequisite for establishing the game mechanism and the market regulation that the mechanism embodies.
2.3. Definition of Compensation Standards
The definition of ecological compensation standards is the core issue of ecological compensation for cultivated land. In order to be fair and market-oriented, this study adopts the market game mechanism to define the compensation standards for the subject and object of compensation. Therefore, the first things to be clarified are the upper and lower limits of the compensation standards.
In the cultivated land protection and utilization, the game’s focus between the cultivated land ecological deficit area and the surplus area is the ecological compensation of cultivated land use. For farmland ecological deficit areas, as the economy develops, residents’ attention to the regional ecological environment gradually increases, and they have a demand for ecological products and services provided by farmland [51]. Since cultivated land is a scarce product resource, ecological products and services cannot be replaced in the market. Therefore, there is only one strategy when it plays the game with the ecological surplus area: the compensation strategy, which is to obtain the cultivated land ecosystem services spillover from the ecological surplus area. The highest standard of ecological compensation in the deficit area should be the ecological services and product value provided by surplus area, because if the compensation standard exceeds the value of the cultivated land ecological service provided by the surplus area, it will lead to lack of compensation payment motivation and low compensation efficiency, which quickly leads to the failure of the game. Therefore, the upper limit of the compensation standard of the game between the two parties is the cultivated land ecosystem service value, , that spills over from the cultivated land ecological surplus area to the deficit area. As for ecological surplus zones, James M. Buchanan considers that they have “internality”, i.e., public organizations, especially government departments and their officials, tend to pursue their interests or goals rather than public interests or social welfare in the policymaking process [53]. For local governments with such behaviors, they are inevitably inclined to pursue the maximization of economic benefits and often negatively implement cultivated land protection policies, and even take an attitude of not stopping the illegal occupation of cultivated land in the face of the substantial comparative benefits generated by the conversion of cultivated land and the high cost of the loss of cultivated land protection. (Although the central government supervises the local government’s responsibility of farmland protection, but is limited by the huge cost of supervision and the low cost of violations by local governments, local governments can easily use various methods to circumvent the supervision of the central government. According to statistics, from 1999 to 2015, the average annual number of land violation cases in China reached 77,500, with an area of 29,600 hectares involved. Local governments are still the protagonists of land violation cases.) Therefore, based on satisfying the ecological balance of cultivated land within the area, the ecological surplus area has two strategies for the rest of cultivated land: protecting cultivated land and not protecting cultivated land. When it chooses to protect cultivated land, it can obtain the economic effect u1 brought by cultivated land planting and obtain the ecological value of compensation u2 from the ecological deficit area. When it chooses not to protect cultivated land, which means it implements the nonagriculturalization of cultivated land, it can gain economic benefit E. If u1 + u2 ≥ E, the best strategy chosen by the region is to protect cultivated land to provide ecological service value of cultivated land for other regions; otherwise, the best strategy is choosing to transfer the function of cultivated land. Therefore, the key to determining whether to protect the remaining cultivated land or not in cultivated land surplus area is the numerical value of u1 + u2 and E. For the surplus area, the income E from the conversion purposes of cultivated land and the economic effect u1 of cultivated land planting are certain. Therefore, in the game process of the ecological compensation standards for cultivated land, the ecological surplus area of cultivated land will bargain with the deficit area at the price it is willing to pay, , to maximize its interests. That is, is the lower limit of the protected cultivated land, and if the compensation standard of the ecological deficit area to the ecological surplus area is lower than this standard, the game’s failure will be caused.
It can be seen that only when the compensation standard for ecological protection of cultivated land is between and , the ecological deficit area of cultivated land and the ecological surplus area can reach an agreement through negotiation to establish a horizontal ecological compensation mechanism in river basins.
Negotiating and resolving divergences in compensation standards is not aimless. Establishing ecological compensation standards for cultivated land based on a bargaining game mechanism can provide a series of established rules for the cultivated land ecological deficit area and the surplus area and promote the marketization of cultivated land ecological compensation. Therefore, this study starts from the vital interests of the ecological deficit area of cultivated land use and the surplus area and quantifies the ecological spillover service value of cultivated land use and the benefits of agricultural and nonagricultural land as much as possible and uses the bargaining game model to reach a consensus on the ecological compensation standards for cultivated land.
3. Construction of a Game Model of Cultivated Land Ecological Compensation
Rubinstein proposed the bargaining game model in 1982 and constructed the indefinite bargaining game model based on the dynamic game model and the introduction of time discounting. In the game process, the contradiction between the interests of both parties resulted in the non-cooperation of both parties, which belongs to the “two-player non-cooperative game” [54]. In the current implementation of the ecological compensation policy of cultivated land, the ecological deficit area and ecological surplus area of cultivated land have their pursuit of interests, in which the ecological deficit area expects to obtain the maximum value of cultivated land ecosystem services at the lowest compensation price, while the ecological surplus area hopes that it can obtain the most compensation for its responsibility for protecting cultivated land. The contradiction of economic interests has caused the two parties to be antagonistic and non-cooperative in distributing ecological compensation benefits of cultivated land. Therefore, the game between the two parties can be regarded as a “two-player non-cooperative game”. Consequently, this study builds this model based on constructing a bargaining game model of cultivated land ecological deficit area and ecological surplus area to analyze the game of cultivated land ecological compensation distribution between the two stakeholders.
3.1. Assumptions of the Model
To facilitate the analysis of the bargaining game between the cultivated land ecological deficit area and the cultivated land ecological surplus area, the study proposes the following assumptions:
(1) Both the cultivated land ecological deficit area and the cultivated land ecological surplus area are filled with rational economic people whose primary goal is to maximize their interests. Those in the cultivated land ecological deficit area hope to obtain most cultivated land ecosystem services and value with least ecological compensation. In contrast, those in the cultivated land ecological surplus area hope that the spillover cultivated land ecosystem services can maximize their ecological compensation. Therefore, those in the cultivated land ecological surplus area are unwilling to accept the compensation value less than or equal to , while those in the deficit area are also unwilling to pay more than the overflowing compensation value of the cultivated land ecological value . Hence, it requires a game of bargaining.
(2) Regarding the cultivated land area, in order to safeguard their interests, those in the ecological surplus area will take the initiative to negotiate with those in the cultivated land ecological deficit area, and those in the deficit area are willing to assume the responsibilities and disclose the compensation information for the surplus area so as to promote the interregional compensation policy established by the central government. Therefore, it is assumed that those in the ecological deficit area of cultivated land give the first bid in the game at the beginning.
(3) During the bargaining game between the deficit area and the surplus area, a certain time cost is required. Time has value, and the longer the game between the two parties, the bigger the loss of both parties. In this game, the time discount factor (0 < < 1) was introduced based on the bargaining game model, and the discount factors of the deficit area and the surplus area were assumed to be and , respectively. The discount factor on the value can be regarded as the discount rate. However, its significance in the bargaining game is different from the meaning on finance; its value depends on the degree of “patience” on both sides in the game. The degree of “patience”, in essence, reflects the psychological endurance and economic capacity of both sides in the game; if one party has stronger capacities, it will have more patience and can take more risks with a bigger discount factor [55].
(4) The cost of loss in the ecological surplus area is a bargaining game with incomplete information. Although the cultivated land ecological deficit area is not clear about the minimum compensation required by the surplus area, it is estimated that the compensation for the surplus area follows a specific density function on [m, ] (m is the minimum compensation standard that the deficit area considers the ecological surplus area is willing to accept, and is the highest compensation standard that the deficit area is willing to pay). Since the probability of each value in the interval is equal in the bargaining game, the density function is assumed to follow a uniform distribution.
(5) The Yangtze River Economic Belt involves 11 provinces (cities), and there are multiple provinces (cities) in the ecological deficit area and the ecological surplus area. Therefore, to facilitate the analysis, it is assumed that the provinces (cities) in the deficit area and the surplus area unite as independent alliances when playing the game toward the external, and the alliance groups are used to play the game, while the internal interests of the alliance are the same.
3.2. Model Construction and Solution
In this study, represents the minimum compensation standard that the cultivated land ecological surplus area is willing to accept, and represents the highest compensation standard that the cultivated land ecological deficit area is willing to pay; and , respectively, represent the charging and bidding in the game between the ecological surplus area and the ecological deficit area, and , ; , and , respectively, represent the discount factors of the ecological deficit area and the ecological surplus area; and represent the charging probability of the surplus area that the deficit area accepts and rejects in the i stage of the game; and , respectively, represent the bidding probability of the deficit area that the surplus accepts and rejects in the i stage of the game.
Taking into account the time value and related fixed costs in the bargaining process between the two parties, and in order to simplify the analysis process and increase the practical operability, this study adopts a three-stage bargaining method to analyze the game: the ecological surplus area of cultivated land and the ecological deficit area can reach an agreement only by gaming three times.
The first stage: the cultivated land ecological deficit area bids . Furthermore, for the ecological surplus area, the strategy is either accepted or rejected. If the acceptance strategy is chosen, the game ends, the benefits of the cultivated land ecological deficit area are , and the benefits of the surplus area are . If the ecological surplus area rejects, the game will enter the second stage.
The second stage: the cultivated land ecological surplus area charges . The ecological deficit area of cultivated land can choose to reject or accept. If the deficit area chooses to accept, the game ends, and the benefits of the deficit area and the surplus area are and ; if the deficit area refuses, the game will enter the third stage.
The third stage: the deficit area bids. Since this is the game’s final stage, the surplus area has to accept the allocation plan; otherwise, both sides can receive no benefits. At this stage, the benefits of both sides are and . The three stages mentioned above can be represented in the game tree (Figure 1).
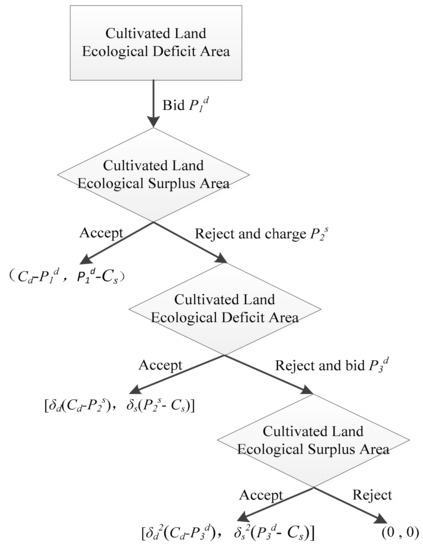
Figure 1.
Three-stage bargaining game tree of ecological compensation for cultivated land.
The three-stage bargaining game model can be solved by the backward induction method. The specific solution process is as follows:
- (1)
- The rational strategy for both parties at the third stage
At this stage, the arable land ecological deficit area bids , and the arable land ecological surplus area has to accept the allocation plan because if it does not accept the plan at this stage, the game will end and both parties will not obtain their interests. Thus, as long as > 0, i.e., < . The deficit area is clear about the selection of the ecological surplus area at this stage, and can maximize its benefits, i.e.:
where and . Take the derivative of and set . Obtain:
Therefore, the optimal bid for the ecological deficit area in the third stage is . At this stage, the benefits of the ecological surplus area are , and the benefits of the ecological deficit area are .
- (2)
- The rational strategy of both parties at the second stage
At this stage, if the ecological surplus area charges, the ecological deficit area will not agree, and the game must enter the third stage; while at the third stage of the game, it must accept the allocation plan proposed by the ecological deficit area. Therefore, in order to maximize its interests, the surplus area’s charge must be acceptable to the ecological deficit area at this stage, which means that the ecological deficit area accepts the charge of the ecological surplus area at this stage under the condition that the benefits at this stage are greater than or equal to the income of the third stage:
Meanwhile, under the constraints of Formula (3), the cultivated land ecological surplus area maximizes its interests, i.e.:
Simplify Formula (3) to obtain , if , the optimal charge of the ecological surplus area is , the benefits of the ecological surplus area are , and the benefits of the ecological deficit area are . It can be seen that the benefits of the ecological deficit area at this stage are equal to the income of the third stage, and 0 < < 1: . It shows that the benefits of the ecological surplus area at the second stage are huger than the benefits at the third stage, improving the efficiency. However, if , in order to satisfy the condition of Formula (4), which is to maximize its own interests, , but the constraint condition (3) is not established at this time, the ecological deficit area will reject it, and the game will enter the third stage.
- (3)
- The rational strategy of both parties at the first stage
At this stage, the arable land ecological deficit area bids, and the surplus accepts the bid under the condition that its benefits at this stage should not be less than the benefits at the second stage, i.e., meeting the following conditions:
The ecological deficit area is clear about the decision-making method of the ecological surplus area at each game stage. Therefore, to maximize its benefits at this game stage, its bid at this stage needs to meet the maximum expected benefits:
Since it is at the second stage of the game between the two parties, the benefits of the ecological deficit area at this stage are equal to those of the third stage. Hence, as a rational economic entity, the ecological deficit area will accept the charge of the ecological surplus area at the second stage, i.e., = 1, = 0, and :
Put , , , and into Equation (6), take the derivative of , set , and obtain: . At this time, the benefits of the ecological surplus area are , and the benefits of the ecological deficit area are .
Based on the above analysis, at the initial stage of the game, the ecological deficit area bids , and if the benefits of the ecological surplus area are not less than the benefits obtained at the second stage of the game, i.e., , the ecological surplus area will accept its bid, and the game will end; otherwise, the surplus area will charge at the second stage of the game. At the second stage of the game, in order to maximize its interests, the ecological surplus area will require . If is satisfied, the optimal charge of the ecological surplus area at this stage is . If the ecological deficit area accepts the charge, the negotiation will end; if it refuses, the two sides will enter the third stage of the game, at which the ecological deficit area bids. At the third stage of the game, the ecological deficit area bids , and if , the ecological surplus area will accept the bid, and the game will end. Otherwise, the game will also end, but both parties lose the game without any benefit.
4. Empirical Analysis of Cultivated Land Ecological Compensation Game in the Yangtze River Economic Belt
4.1. Research Area and Data Sources
4.1.1. Study Area
The Yangtze River Economic Belt is a national strategy as important as the “Belt and Road”, the “Coordinated Development of Beijing-Tianjin-Hebei”, and the “Construction of the Guangdong-Hong Kong-Macao Greater Bay Area”, which covers 11 provinces (cities), including Chongqing, Sichuan, Yunnan, Guizhou, Jiangxi, Hubei, Hunan, Jiangsu, Zhejiang, Anhui, and Shanghai (Figure 2). As of 2018, the cultivated land area of the Yangtze River Economic Belt was 44.99 million hm2, accounting for 33.33% of the total cultivated land area of China, and the total agricultural output value reached CNY 2487.39 billion, accounting for 40.48% of total agricultural output in China, and is one of the fastest-developing regions in China. However, its rapid development is also accompanied by decreased cultivated land quantity and the deterioration of cultivated land quality, which lead to the degradation of the regional ecological environment. In 2016, the Outline of the Yangtze River Economic Belt Development Plan issued by the Central Committee of the Communist Party of China clearly stated that the Yangtze River Economic Belt should be built as a pioneering demonstration belt, an innovation driving belt, and a coordinated developing belt for the construction of China’s ecological civilization. Therefore, in the context of constructing ecological civilization, improving the regional ecological environment, coordinating economic development, protecting arable land resources, and ensuring China’s food and ecological security have become the primary issues of the Yangtze River Economic Belt. This study takes the Yangtze River Economic Belt as the research area and discusses the ecological compensation standards for cultivated land within the region, which has important practical significance for cultivated land protection in the region and the balance of inter-regional development. Meanwhile, the Yangtze River Economic Belt is the ecological economic system of the largest river basin in China. Discussing the ecological compensation standards for cultivated land in the region can also provide a reference for other river basins to explore ecological compensation for cultivated land.
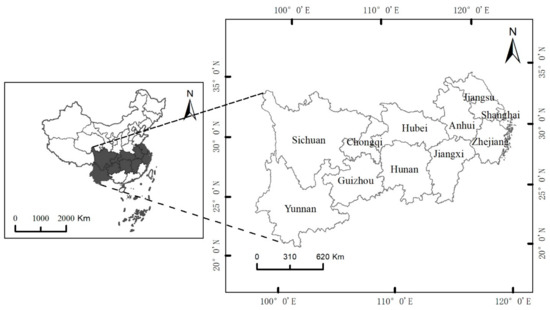
Figure 2.
Location map of the Yangtze River Economic Belt.
4.1.2. Data Sources
The cultivated land use area and various production and consumption data of various provinces (cities) come from the China Statistical Yearbook and China Rural Statistical Yearbook; cultivated land quality data comes from Main Data Results of National Cultivated Land Quality Grade Update Evaluation; the prices of various food crops and the unit prices of pesticides and fertilizers are derived from the Compilation of National Agricultural Product Costs and Benefits; the unit of calorific values of relevant items comes from Agricultural Technology and Economics Manual (Revised Edition); the socio-economic development data of all provinces (cities) come from the China Statistical Yearbook and historical statistical yearbooks of provinces and cities; the national comprehensive land price index and total land price are mainly derived from the China Urban Land Price Monitoring Network.
4.2. Definition of the Subject and Object of Ecological Compensation for Cultivated Land in the Yangtze River Economic Belt
In order to accurately quantify the balance between supply and demand of the ecological footprint of cultivated land use and the ecological carrying capacity of cultivated land in the Yangtze River Economic Belt, and to define the subject and object of the cultivated land ecological compensation in the Yangtze River Economic Belt basin, this study is based on the extended three-dimensional ecological footprint model and improved it by constructing a food consumption flow coefficient and carbon footprint accounting model to reflect, in the open environment, residents’ occupation of the biological resources in this region and to characterize the arable land resources that ecological damage account for to make up for the defect of neglecting the “unexpected output” in the utilization of arable land in the original model. The extended three-dimensional ecological footprint model develops from the three-dimensional ecological footprint model proposed by Niccolucci et al. The extended model uses the depth of the footprint to characterize the regional ecological profit and loss, which can be explicitly divided into ecological deficit-consuming stock resources and ecological surplus-consuming flow resources [56].
4.2.1. Ecological Footprint Accounting of Cultivated Land
- (1)
- Biologically productive footprint accounting
- (2)
- Revising the bio-productive footprint based on the flow of food
The setting is crucial for the correction of cultivated land’s biologically productive footprint. In the existing studies, there are few statistics on the consumption data of all cultivated land products in the region, especially the per capita consumption of all kinds of consumer goods produced by cultivated land. Therefore, when applying the ecological footprint model to calculate ecological occupation, many scholars often substitute the production of the i-th consumer goods in the region for its consumption. Such “habitual” operation tends to lead to a larger per capita ecological footprint in grain-exporting provinces and a smaller per capita ecological footprint in grain-importing provinces than the actual level, so that it is impossible to measure the actual resource occupation of the research area [57]. Therefore, this study introduces the correction coefficient of grain consumption flow to revise the biologically productive footprint of cultivated land calculated by Formula (8), and the calculation formula is as follows:
where is the correction coefficient of grain consumption flow in region i; and represent the grain supply and demand of region i respectively; , and represent the per unit area yield of grain, multiple cropping index and cultivated land area of region i respectively; represents the per capita food consumption of region i, which is 450 kg according to the standard set by the Food and Agriculture Organization of the United Nations; represents the regional self-sufficiency rate of grain, which is taken as 95% according to the Outline of National Food Security Mid- and Long-term Planning; is the total population of region i.
- (3)
- Carbon footprint accounting
In order to meet their continuous demand for food, human beings need to occupy a large amount of cultivated land space that can provide food production and have biological production capacity, which is a critical item to calculate the cultivated land ecological footprint. However, when humans use cultivated land to obtain food, they will have a negative impact on the ecological environment of cultivated land, such as through the excessive use of chemical fertilizers, pesticides, agricultural films, and agricultural machinery, which will cause damage to the cultivated land ecosystem, resulting in a decline in the quality of cultivated land and an imbalance in the ecological environment [58]. In essence, the destructive occupation of cultivated land should be included in the ecological footprint accounting project of cultivated land utilization [57]. The carbon footprint model has been widely used in footprint accounting of farmland ecosystems, which derives from the ecological footprint, and the accounting results can be represented by area [59,60]. Therefore, this study builds a carbon footprint model to convert humans’ “unexpected output” in arable land utilization into the area of ecological arable land that needs to be consumed. The calculation formula is:
where is the carbon footprint of arable land use; is the total carbon emission of arable land use; is the input of chemical fertilizer, pesticide, agricultural film, agricultural machinery, machine farming, and mechanical irrigation in the process of arable land utilization; is the carbon emission coefficient of fertilizer, pesticide, and other inputs, which refer to the research results of West and Li et al. [61,62]. is the carbon sequestration capacity of arable land, i.e., the total amount of carbon that a unit of arable land (crops) can absorb in one year; is the total amount of carbon absorption of cultivated land resources; and , , , and represent the carbon absorption rate, economic yield, economic coefficient, and moisture content of economic yield of the i-th crop, respectively, which can be seen in the research results of Wang and Li [63,64]. is the sown area of crops.
- (4)
- Total accounting of cultivated land ecological footprint
Based on the above analysis, the total ecological footprint of cultivated land is the sum of cultivated land’s biologically productive footprint and carbon footprint. The calculation formula is:
where is the ecological footprint of cultivated land; and are the biologically productive footprint and carbon footprint of cultivated land calculated above; is the correction coefficient of grain consumption flow in each region.
4.2.2. Ecological Carrying Capacity Accounting of Cultivated Land
Cultivated land ecological carrying capacity refers to the maximum endurance that the regional cultivated land ecosystem can provide to the disturbance of human activities, which is characterized by the area of cultivated land that has biological production capacity in the region [65]. The calculation formula is as follows:
where is the ecological carrying capacity of arable land in the region; is the total population; is the per capita area of biologically productive arable land; is the regional arable land balance factor; is the regional arable land yield factor, which uses the average production capacity of arable land in China as the standard to calculate the arable land yield factor of each province in each year, according to the calculation principle of NFA2006; and are the production capacity of the j-th product in cultivated land of each province and the average production capacity of China, respectively; and is the proportion of the sown area to the total sown area of the j-th product. According to the United Nations World Commission on Environment and Development, at least 12% of the biologically productive area should be set aside for the protection of biodiversity in the area.
4.2.3. Calculation and Expression of Three-Dimensional Ecological Footprint
The extended three-dimensional ecological footprint model adopts the depth of footprint to characterize the regional ecological surplus, and its calculation formula is as follows:
where is the footprint depth, which represents the occupation degree of the regional population to the flow and stock of cultivated land resources in the region; when ∈ (0, 1), it indicates that the area is an ecological surplus area of cultivated land, and the regional population does not occupy the stock of cultivated land resources with a surplus of flow resources; when > 1, it indicates that the area is an ecological deficit area of cultivated land, and the regional population has not only exhausted the stock of cultivated land resources, but also occupied the flow of cultivated land resources; and are the cultivated land ecological footprint and cultivated land ecological carrying capacity calculated above.
4.2.4. Determining the Subject and Object of Ecological Profit and Loss of Cultivated Land in the Yangtze River Economic Belt
Comparing the ecological footprint and carrying capacity of cultivated land in provinces (cities) of the Yangtze River Economic Belt can effectively identify the subject and object of the ecological profit and loss of cultivated land. According to Formulas (8)–(14), it is easy to estimate the ecological profit and loss of cultivated land of provinces (cities) in the Yangtze River Economic Belt from 2000 to 2018 (Table 1). From 2000 to 2018, the depth of cultivated land ecological footprint in the Yangtze River Economic Belt fluctuated around 0.60, indicating that the Yangtze River Economic Belt has always been in the condition of ecological surplus of cultivated land at the national level. By 2018, the total ecological carrying capacity of cultivated land in the Yangtze River Economic Belt reached 126.90 million hectares, the total ecological footprint of cultivated land was 79.51 million hectares, the depth of ecological footprint was 0.63, and the ecological surplus of cultivated land reached 47.39 million hectares. Within the basin, the depths of cultivated land ecological footprint of Shanghai and Zhejiang were greater than one from 2000 to 2018, indicating that the ecological demand of cultivated land in Shanghai and Zhejiang is always more significant than the ecological supply of cultivated land. Hence, the two places are the cultivated land ecological deficit area, and Shanghai has a more significant deficit status. However, the depths of the ecological footprint of cultivated land in nine provinces (cities), including Jiangsu, Anhui, and Jiangxi, etc., were less than one from 2000 to 2018, indicating that the ecological demand for cultivated land in these areas is less than the ecological supply of cultivated land. Therefore, these provinces and cities are the cultivated land ecological surplus areas. The depths of the ecological footprint of cultivated land in Sichuan, Guizhou, and Yunnan were always below 0.50 during the study period, which are the most stable ecological surplus areas of cultivated land in the basin. Therefore, at the internal level of the basin, this study defines Shanghai and Zhejiang as arable land ecological deficit regions, while nine provinces (cities), including Jiangsu, Anhui, and Jiangxi, etc., are arable land ecological surplus regions. Namely, the Shanghai and Zhejiang unit comprise the alliance to pay while the other nine provinces make up the alliance to accept compensation in the game.

Table 1.
Ecological profit and loss of cultivated land in the Yangtze River Economic Belt from 2000 to 2018.
4.3. Quantification of Cultivated Land Ecological Compensation Standard in the Yangtze River Economic Belt
4.3.1. Quantification of the Upper-Limit of Compensation
Based on the above game mechanism analysis, it can be seen that the highest compensation standard that the cultivated land ecological deficit region can bear is the cultivated land ecological service value that spills from the cultivated land ecological surplus region to the deficit region. Therefore, this study takes the spillover of the cultivated land ecosystem service value as the upper limit of the regional cultivated land ecological compensation standard. Cultivated land ecosystem service value evaluation is the key to determining the upper limit of cultivated land ecological compensation. The current methods for quantifying the value of ecosystem services are mainly the equivalent factor method, the functional value method, and the willingness survey method. Among them, the equivalent factor method is the most suitable method to evaluate the value of ecosystem services in China put forward by Chinese scholar Xie Gaodi who studies based on Costanza’s global ecosystem services classification. The method is simple and easy to use, and the quantified results are relatively objective and accurate [34]. It has been widely used to evaluate the value of ecosystem services at different regional scales. This study also uses this method to quantify the positive value of cultivated land ecosystem services. At the same time, due to the excessive use of fertilizers, pesticides, and agricultural film in cultivated land use, it will bring negative ecological externalities of cultivated land use, which affects the positive output of cultivated land ecosystem services. Therefore, environmental cost and substitution methods are adopted to further quantify the negative value of cultivated land ecosystem services. Based on the positive and negative values of cultivated land ecosystem services, the net value of cultivated land ecosystem services in provinces (cities) is calculated.
- (1)
- Calculation of the positive value of ecosystem services per unit of cultivated land
The China Ecosystem Service Value Equivalent Factor Table proposed by Scholar Xie Gaodi can calculate the equivalent factor value of arable land per unit area of provinces (cities) in the Yangtze River Economic Belt. Considering the difference in cultivated land quality, the cultivated land with higher quality can provide a greater value of ecological services such as purifying soil, protecting biodiversity, and regulating climate. Therefore, this study uses regional cultivated land quality level to correct the positive value of cultivated land ecosystem services. The calculation formula is:
where is the positive value of cultivated land ecosystem per unit in the region i; is the biological equivalent factor of arable land per unit, after excluding the market value brought by the production of food and raw materials, and the value is 6.51 [34]; is the correction coefficient of the regional multiple cropping index, which modifies the equivalent factor proposed by Xie Gaodi, represented by the ratio of the regional multiple cropping index to the national multiple cropping index. is the value of biological equivalent factor per unit, where n is the type of food crops in region, mainly including four types, namely, rice, wheat, corn, and soybeans; is the sown area of the k-th crop; is the national average price of the k-th crop; is the per unit yield of the k-th crop; is the sown area of n-types crops; 1/7 is the ratio of the value of the per-unit biologically equivalent factor to the national average market value of the per unit yield of grain; is the quality level of cultivated land in area i, where is the area of cultivated land in the j-th class of area i; is the score of the j-th grade, assuming that the score of the best land is 100 and the score of the worst land is 0, which adopts the equidistant method to determine the degree of cultivated land. Investigation and Assessment of Cultivated Land Quality Grade in China ranked China’s cultivated land into 15 grades, with the highest quality of cultivated land in Grade 1 and the worst cultivated land in Grade 15; is the national cultivated land quality level.
- (2)
- Estimation of the negative value of ecosystem services per unit of cultivated land
The negative value of cultivated land ecosystem services mainly includes environmental pollution caused by excessive use of pesticides, chemical fertilizers, and agricultural film, such as water eutrophication, excessive nitrate content, and soil compaction. According to the calculation, the amount of CO2 emitted during the utilization of cultivated land is far less than the amount of CO2 absorbed by crop photosynthesis. Therefore, this study ignores the negative value of cultivated land ecosystem services caused by CO2 emissions. The calculation formula is:
where is the total negative value of cultivated land ecosystem services in region i; , , and represent the negative value of cultivated land ecosystem services caused by the use of pesticides, chemical fertilizers, and agricultural film, respectively; , , and represent the reduction amount of chemical fertilizer application, pesticide application amount, and agricultural plastic film coverage area in the region, respectively. , , and represent fertilizer utilization, pesticide utilization, and plastic film residue area, respectively. According to the study of Qi and Sun et al., the values are 34.17%, 35%, and 41.7%, respectively [66,67]; , , and represent pesticide price, fertilizer price, and average market price of grain in region, respectively; is the per unit yield of grain in the region; is the area of cultivated land in the region.
- (3)
- Net ecosystem service value per unit of cultivated land:
From the above analysis of the game mechanism, it can be seen that the highest compensation standard that the cultivated land ecological deficit area can bear is the cultivated land ecosystem service value spilled from the cultivated land ecological surplus area to the deficit area. Therefore, one must first quantify the average value of net ecosystem services per unit of cultivated land in the ecological surplus area of cultivated land so as to be used as the upper limit of unit compensation for the game between the two groups. As seen from Table 2, from 2000 to 2018, the average value of net ecosystem services per unit of cultivated land in the ecological surplus area of the Yangtze River Economic Belt increased significantly, from CNY 11,847.21/hm2 in 2000 to CNY 31,200.43/hm2 in 2018. The results showed that the net ecosystem service value per unit of cultivated land spilling over from the ecological surplus area to the ecological deficit area increased significantly, i.e., the upper limit per unit of compensation standard of the game increased gradually.
Table 2.
The net value of ecosystem service of cultivated land in the Yangtze River Economic Belt from 2000 to 2018 (CNY/hm2).
4.3.2. Quantization of Lower-Limit of Compensation
Based on the above analysis of the game mechanism, it can be seen that the minimum compensation standard acceptable to the ecological surplus area of cultivated land is the difference between the economic benefits that can be obtained from the implementation of cultivated land’s nonagriculturalization and the economic benefit of cultivated land planting, i.e., . According to the calculation, the average economic benefit u1 brought by cultivated land plantations in the Yangtze River Economic Belt ranged from CNY 300/hm2 to CNY 500/hm2 from 2000 to 2018, which was negligible compared with the cultivated land ecosystem service value and the benefits of nonagriculturalization. Therefore, this study takes the income E from the nonagriculturalization of cultivated land as the lower limit of the ecological compensation standard for cultivated land. The current land-use conversion market has the highest income for converting cultivated land to nonagricultural construction land. Therefore, the income from the conversion is regarded as nonagriculturalization income E.
- (1)
- Calculation of income from nonagriculturalization of cultivated land
When cultivated land is converted into nonagricultural construction land, local governments can obtain land income by transferring land-use rights. The income from land transfer meets the spatial evolution of land prices, with the central city as the core, distributing outward in am attenuating and circling way, which has a significant negative correlation with distance [68]. The interaction zone between urban and rural areas has the most intensive flow of urban and rural resource elements with most frequent conversion of cultivated land use. Therefore, based on the hypothesis of land homogeneity, the nonagricultural benefits of cultivated land can equal approximately half of the net income of urban construction land transfer [69]. The calculation formula is:
where is the nonagricultural income of cultivated land per hectare; is the transfer income of construction land, which mainly includes three parts: the average net income from the land transfer (), deed tax (), and farmland occupation tax (); is the land restoration interest rate, usually referring to the sum of the safe interest rate and risk adjustment numerical value. The safe interest rate is based on the annual interest rate of the People’s Bank of China for one-year time deposits, and the risk adjustment value is determined by the growth rate of the regional consumer price index over the years; n is the useful life of the land transfer, and this study selects the comprehensive land transfer life, i.e., n = 50; is the average net income of land transfer, which is mainly based on the average net income standard of 15 grades of land transfer in the Administrative Measures on Land Transfer Fund Income for Agricultural Land Development issued by the former Ministry of Land and Resources in 2004. By using the weighted-average method to calculate the average net income of national land transfer in 2004 and the national comprehensive land price index, the national average net income of land transfer in each year can be obtained.
Due to the lack of comprehensive land price index data in various provinces (cities), this study uses the ratio coefficient of the per capita GDP of each province (city) to the national per capita GDP to revise the national comprehensive land price index, and calculates the average net income of land transfer of each province (city) in each year. Assuming that the net income from land transfer accounts for the same proportion of the total land transfer price in each year and that the quality of cultivated land is stable, the calculation formula is as follows:
where represents the average net income of national land transfers in year X; represents the average net income of national land transfers in 2004; and , respectively, represent the national comprehensive land price index in year X and the national comprehensive land price index in 2004; represents the per capita GDP of the region in year X; represents the per capita GDP of the country in year X.
Based on the Interim Regulations on Deed Tax of the People’s Republic of China, the value of can be obtained. The transfer of land-use rights shall be subject to a deed tax of 3% of the total transaction price. At the same time, the land price of the built-up town is used as the average land price of construction land in the rural–urban fringe. The average land price level is about 1/9 of the urban land price [70]; therefore, the deed tax = regional comprehensive land price × 1/9 × 3%. Cultivated land occupation tax can be obtained following the Implementation Rules of the Interim Regulations of the People’s Republic of China on Cultivated Land Occupation Tax.
- (2)
- Calculation results of nonagricultural benefits of cultivated land per unit
Formulas (18) and (19) are used to measure the value of nonagricultural income of cultivated land per unit in each province (city) of the Yangtze River Economic Belt. From the above analysis of the game mechanism, it can be seen that the lowest compensation standard acceptable to the ecological surplus area of cultivated land is the economic benefits that can be obtained from the implementation of the nonagriculturalization of cultivated land. Therefore, this study should first quantify the average value of nonagricultural income of cultivated land per unit in the ecological surplus area and use the average value as the lower limit standard of unit compensation for the game between the two groups. As shown in Table 3, from 2000 to 2018, the value of nonagricultural income of cultivated land per unit in the ecological surplus in the Yangtze River Economic Belt increased significantly from CNY 6509.15/hm2 in 2000 to CNY 22,379.03/hm2 in 2018. It shows that the opportunity cost of cultivated land protection lost in the ecological surplus area caused by its overprotection responsibility has increased significantly, i.e., the unit compensation lower limit standard of the two groups’ game is gradually increasing.
Table 3.
The value of nonagricultural benefits of cultivated land per unit in the Yangtze River Economic Belt from 2000 to 2018 (CNY/hm2).
4.3.3. Definition of Game Standards
Based on the above analysis, from 2000 to 2018, the highest unit ecological compensation standard () of cultivated land the deficit area (e.g., Shanghai and Zhejiang) willing to pay to the surplus area were CNY 11,633.95/hm2 and CNY 34,225.01/hm2; while the lowest unit compensation standard () of the surplus area (e.g., Jiangsu, Anhui and Zhejiang) willing to accept the deficit area were CNY 4195.07/hm2 and CNY 27,119.32/hm2. Assuming that the ecological deficit area considers the minimum compensation standard m that the ecological surplus area willing to accept is the value , this means that the deficit area is aware of the lowest price the surplus area willing to accept. In fact, it is not difficult for the cultivated land ecological compensation subjects to know the lowest desired price of the objects with open and transparent information. Suppose the ecological deficit area and the surplus area adopt the form of group game to confirm the ecological compensation standard for cultivated land. In that case, it will show that both parties have more patience and can bear more risks. Therefore, we can assume that the discount factor for both parties is , in which is the profit of one-year deposits of the People’s Bank of China from 2000 to 2018. We then bring the relevant data into the established game model. Taking 2018 as an example, the first stage bid for the ecological deficit area of cultivated land = CNY 26,824.01/hm2; at this point, (i.e., 22,379.03 < 26,789.73), which meets the interest demands of the ecological surplus area, and that will accept the bid, and the negotiation will end. Therefore, the unit ecological compensation standard of cultivated land that the arable land ecological deficit area should pay to the surplus area in 2018 is CNY 26,824.01/hm2, and the rest of the year can be calculated through the same method (Table 4).
Table 4.
Game standard of ecological compensation of cultivated land per unit in cultivated land ecological deficit area and surplus area of the Yangtze River Economic Belt from 2000 to 2018.
As shown in Table 4, from 2000 to 2018, the unit arable land ecological compensation standard that the deficit area should pay to the surplus area in the Yangtze River Economic Belt ranges from CNY 7951.74/hm2 to CNY 30,720.16/hm2. Compared with the minimum compensation standard, the ecological compensation of cultivated land per unit increased from CNY 2699.06/hm2 to CNY 5814.25/hm2 after the game, with an average annual growth of 38.14%, which to some extent increased the benefits of cultivated land protection in the responsibility area of cultivated land protection and promoted cultivated land protection motivation.
4.4. Calculation of Inter-Regional Cultivated Land Ecological Compensation Quota in the Yangtze River Economic Belt
The bargaining game model can quantify the ecological compensation standards of cultivated land per unit in the ecological deficit area and the ecological surplus area of cultivated land in the Yangtze River Economic Belt and calculate the horizontal compensation value between the river basins by combining the regional ecological carrying capacity and the ecological footprint of cultivated land. At the same time, considering the different stages of social and economic development, people’s cognition and demand of ecological service value provided by cultivated land are different. The higher the socio-economic development stage is, the higher the level of cognition and demand is, which is consistent with the S-shaped Peel growth curve. Hence, the S-shaped Peel growth curve can represent the level of cognition and demand [71]. Therefore, this study introduces the social development stage coefficient to revise the compensation value to confirm the horizontal ecological fiscal transfer amount of cultivated land between the ecological deficit area and the ecological surplus area of cultivated land. The calculation formula is:
where represents the amount of fiscal transfer (CNY 108); represents the game standard of unit ecological compensation for cultivated land between the two parties; represents the coefficient of the social development stage, where and , respectively, represent the Engel coefficient of urban and rural residents in the study area; is the level of urbanization; is the comprehensive Engel coefficient; and is the area of the regional ecological deficit of cultivated land.
Formula (20) can be used to calculate the amount of compensation that the arable land ecological deficit area should pay to the surplus area in the Yangtze River Economic Belt from 2000 to 2018 (Table 5). It is estimated that from 2000 to 2018, the payment of the cultivated land ecological deficit area of the Yangtze River Economic Belt to the surplus area ranges from CNY 3.41 billion to CNY 44.14 billion, accounting for 0.25–0.69% of GDP and 1.81–3.65% of fiscal revenue of the deficit area, while 0.09–0.20% of GDP and 0.88–1.40% of fiscal revenue of the surplus area. The results show that the horizontal financial transfer amount determined by this study based on the bargaining game model will cause neither the financial dilemma caused by the excessive compensation payment in the paying region, nor the phenomenon of “windfall gain” in the compensated area due to the transfer of farmland ecological finance. It is proven that the ecological standard is reasonable and effective. The ecological compensation of cultivated land obtained in the ecological surplus area of cultivated land can be redistributed according to the ratio of the ecological surplus area of cultivated land in each province (city) to the total surplus area of the river basin, and finally, completing the compensation procedure and realizing the goal of the compensation standard game.
Table 5.
Fiscal transfer amount of cultivated land ecological deficit area to the cultivated land ecological surplus area in the Yangtze River Economic Belt from 2000 to 2018.
5. Discussion
5.1. Result Analysis
Based on the game, the unit arable land ecological compensation standard that the deficit area should pay to the surplus area in the Yangtze River Economic Belt ranges from CNY 7951.74/hm2 to CNY 30,720.16/hm2 from 2000 to 2018. Compared with the existing studies [24,72,73], the ecological compensation standard of cultivated land per unit calculated in this study is relatively higher, mainly due to three aspects: First, based on the bargaining game model, introducing market mechanism considers the interests of both sides of the game, and fully displays the willingness of both sides to pay compensation. Second, when measuring the upper limit of ecological compensation standard of cultivated land per unit, the quality level of cultivated land is included in the calculation process of compensation standard, which improves the upper limit of compensation standard of cultivated land per unit to a certain extent, i.e., expanding the game space of both sides. Third, when quantifying the ecological negative externalities of cultivated land use, only the negative value caused by the excessive use of pesticides, fertilizers, and agricultural film is considered, therefore, the positive value of the ecosystem services of cultivated land per unit is relatively high. From the perspective of the efficiency of resource allocation, it is generally believed that whether the resource allocation is effective can be judged by the condition of the Pareto efficiency, but compared with the minimum compensation standard, the compensation standard based on the game will lead to the increase in the payment cost in the ecological deficit area of cultivated land, which does not conform to the Pareto effect, that is, the situation of both sides is not improved. However, there are vested interests in any institutional arrangement. Changing the current state based on the game method will definitely bring about one party’s loss and the other party’s benefit. Therefore, the “Kaldor–Hicks” criterion can be adopted to measure the allocation efficiency of social resources, i.e., the change of the allocation of resources, which means that as long as the benefits gained by the beneficiaries are more significant than the losses suffered by the losers, it is believed that the allocation efficiency has been improved [44]. Take 2018 as an example: for the cultivated land ecological deficit area, there is a surplus after paying based on the game standard (31,200.43–26,824.01 > 0) if compared with the upper limit of the maximum unit compensation standard that should be paid; as for the ecological deficit area, it can obtain more compensation than its lowest expected compensation through the game (26,824.01 > 22,379.03). That means more funds can be used to improve cultivated land quality and the service value of the cultivated land ecosystem. Therefore, from the perspective of the “Kaldor–Hicks” measurement standard, the compensation standard confirmed by the game can consider the interests of both sides and improve the allocation efficiency of funds.
5.2. Method Review
Establishing ecological compensation standards for cultivated land is the core and most complicated problem in the ecological compensation mechanism for cultivated land. Theoretically, establishing a farmland ecological compensation mechanism between the cultivated land ecosystem service provider and the beneficiary, only when the lost opportunity cost for protection of the cultivated land ecosystem service provider is less than the value of the cultivated land ecosystem service, and there is room for welfare improvement, can the cultivated land ecological compensation mechanism be further established. The opportunity cost of cultivated land protection and the value spillover of ecosystem service constitute the reasonable range of cultivated land ecological compensation standards. If the ecological compensation standard for cultivated land is lower than the opportunity cost of cultivated land protection, the main body of cultivated land protection will lack the motivation to protect cultivated land; if the cultivated land ecological compensation standard is higher than the value spillover of the ecological system service of the main body of the cultivated land protection, the cultivated land ecological system service beneficiaries will lack the motivation of compensation payment. Only when the compensation standard is between the two can the two parties reach an agreement through consultation to construct the cultivated land ecological compensation mechanism. In this study, the inter-regional cultivated land ecological compensation standard quantified by the bargaining game model is just in the range which maximizes the interests of both sides and helps both sides to establish the cultivated land ecological compensation mechanism and promotes the effective operation of ecological compensation projects. On the one hand, the establishment of a cultivated land ecological compensation system can alleviate the dilemma of “windfall gain” and “wipeout loss” among regions caused by the excessive responsibility of cultivated land protection in some areas, and relieve regional financial poverty, especially for the remote and underdeveloped regions at the edge. On the other hand, it can encourage farmers to plant in an environment-friendly way, to protect the quality of cultivated land, and improve the value of cultivated land agricultural products. Therefore, the market-oriented farmland ecological compensation projects are of great significance to underdeveloped regions. However, the formation of market-oriented arable land ecological compensation needs multiple participation. Although this study has constructed a three-stage bargaining game model between the subject and object of cultivated land ecological compensation and quantified the final game compensation standard of both sides, the game between the two sides is often tricky to reach equilibrium in the short-term, due to their interests, which limits the operation efficiency of cultivated land ecological compensation projects. Therefore, a third part (the central government) can be introduced to further intervene to build a three-party evolutionary game model involving the ecological compensation subject, the compensation object, and the central government of the cultivated land in the region. Through different reward and punishment mechanisms of the central government, the game behavior of the subject and the object of cultivated land ecological compensation will be affected to promote the achievement of game equilibrium and improve the efficiency of compensation. In addition, they will be affected if it is difficult for both parties to reach equilibrium in the short-term. Then, if the game stage is further postponed, what key factors will the final distribution of benefits depend on? By constructing an indefinite bargaining game model, Rubinstein finally proved that the subgame perfect Nash equilibrium is unique, and the game utilization distribution ultimately depends on its discount factor σ and the order to bid [54]. Therefore, in the game of ecological compensation standards for cultivated land, whoever takes the lead in bidding between the ecological deficit area and the surplus area of cultivated land will have the “first mover advantage”. Based on this, when the central government introduces a negotiation mechanism to promote the marketization of farmland ecological compensation, it is important to clarify the negotiation rules for the weaker party in the negotiation.
5.3. Limitations and Prospects
Ecological compensation of cultivated land protection involves many related interest groups, among which, this study mainly discusses the horizontal ecological compensation game mechanism at the macrolevel. However, it does not explore the farmland ecological compensation game mechanism involving farmers and citizens at the microlevel or the vertical ecological compensation game mechanism between the central and local governments. Therefore, future research should further explore the ecological compensation game mechanism for cultivated land at the micro- and larger macrolevels to build a complete ecological compensation mechanism for cultivated land in the basin. The determination of the standard of ecological compensation for cultivated land based on the bargaining game model is an auxiliary method to improve the ecological compensation mechanism. Although this model is suitable for analyzing the subject and object of various compensations, the subject and object of ecological compensation at different scales have different demands on interests, leading to different upper and lower limits of the game between the two parties. Therefore, for certain interest bodies, it is necessary to analyze the interest demands of both sides in detail. Secondly, this study takes the whole Yangtze River Economic Belt basin as the research object, assuming that the provinces (cities) in the cultivated land ecological deficit area and the ecological surplus area form their respective alliances when they play games. Additionally, the compensation value obtained is redistributed according to the ratio of the ecological surplus area of cultivated land in each province (city) to the total surplus area of the river basin. However, the interests within the alliance are not entirely consistent. The “patience” (σ) displayed by the stakeholders in the face of the bidding standard of the other party is not uniform. Therefore, the negotiation agent selection of the alliance group will affect the standard of the game; in addition, the study only considers the production, circulation, and consumption of the four major food crops when empirically measuring the upper limit of ecological compensation for cultivated land in the Yangtze River Economic Belt, while ignoring the production and consumption of other crops such as corn, vegetables, and sugarcane, which reduces the value of ecosystem services of arable land per unit and affects the upper limit of the game between the two parties. Meanwhile, the measurement of the regional cultivated land ecosystem service value draws on some national-level ecosystem service value parameters, which may cause differences between the measurement results and the actual situation and affect the upper limit. In conclusion, future research can further accurately quantify the standard range of the game between the two parties based on the entire arable land products and regional parameters. Additionally, the significance of this research is to provide a market-based farmland ecological compensation method to improve the pertinence and compensation efficiency of farmland ecological compensation.
5.4. Policy Implication
This arable land ecological compensation standard based on the game between the two parties is reasonable and accurate for the compensation of arable land ecological compensation objects, which can boost the economy and maintain the long-term effect of the policy. Therefore, firstly, the government should actively promote the determination of ecological compensation standards with a consulting method at its core and establish the compensation mechanism with government guidance, social participation, market-oriented operation, and sustainable ecological protection to ensure that the relevant social stakeholders can realize their interests in the compensation mechanism for ecological protection of cultivated land to promote the marketization of ecological compensation of cultivated land. Secondly, it is necessary to establish an ecological value evaluation system that integrates the quantity, quality, and ecology of cultivated land. The quantity of cultivated land determines the total value of cultivated land ecosystem service, while the quality of cultivated land determines the increment of cultivated land ecosystem service value, and the ecological protection of cultivated land reduces the negative externalities in the utilization of cultivated land, which determines the decrease in cultivated land ecosystem service value. Only by comprehensively considering the quantity, quality, and ecology can the system evaluate the overall service value of regional cultivated land ecosystem to accurately quantify the game compensation standard between the ecological compensation subjects and objects of cultivated land, and entirely stimulate the enthusiasm of the subject of cultivated land protection to protect cultivated land.
6. Conclusions
Based on an extended three-dimensional ecological footprint model, this study constructs the grain consumption flow coefficient and carbon footprint calculation model to accurately define the subject and object of ecological compensation of cultivated land in the Yangtze River Economic Belt and, based on the bargaining game between the subject and object of cultivated land, builds a fair and reasonable game model of the farmland ecological compensation standard. Furthermore, the constructed model is exerted to empirically analyze the compensation standards for the subject and object of ecological compensation in the Yangtze River Economic Belt. The study finds that the highest compensation standard that the ecological compensation subjects in the Yangtze River Economic Belt are willing to pay to the ecological compensation objects is the cultivated land ecosystem service value that the compensation objects spill over to the compensation subject, while the minimum compensation standard that the compensation object is willing to accept from the compensation subject is the nonagricultural benefits that the compensation object loses due to overprotection of cultivated land. The two sides started a game with those two standards and finally reached an equilibrium, i.e., from 2000 to 2018, the ecological compensation standard of cultivated land per unit that the subject of cultivated land ecological compensation should pay to the compensation object is CNY 7951.74/hm2~CNY 30,720.16/hm2; compared with the minimum compensation standard, the ecological compensation of cultivated land per unit after the game had increased by CNY 2699.06/hm2~CNY 5814.25/hm2, an average annual increase of 38.14%. The compensation standard of the game satisfies the “Kaldor–Hicks” resource allocation criterion, takes into account the interests of both parties simultaneously, helps to avoid local government speculation, and plays an incentivizing role in cultivated land ecological protection. Moreover, the cultivated land ecological compensation subjects (Shanghai and Zhejiang) finally measured in this study should pay the objects (Jiangsu, Anhui, Jiangxi, etc.) the compensation amount ranged from CNY 3.41 billion to CNY 44.14 billion, accounting for 1.81–3.65% and 0.88–1.40% of their fiscal revenue in that year, respectively. It will cause neither the financial difficulties in the payment region due to excessive compensation amount, nor a financial “windfall gain” phenomenon in the compensated area due to ecological financial transfer of cultivated land.
Author Contributions
M.L.: methodology, software, writing—original draft. A.Z.: conceptualization, investigation, supervision. X.Z.: formal analysis, methodology, visualization, writing—review and editing. Y.X.: methodology, software, writing—review and editing. All authors have read and agreed to the published version of the manuscript.
Funding
The study is supported by the National Natural Science Foundation of China (71873053), the National Social Science Foundation of China (18ZDA054).
Data Availability Statement
The datasets used and/or analyzed during the current study are available from the corresponding author on reasonable request.
Conflicts of Interest
The authors declare no conflict of interest.
References
- D’Arge, R.; Costanza, R.; de Groot, R.; Farber, S.; Grasso, M.; Hannon, B.; Limburg, K.; Naeem, S.; O’Neill, R.V.; Paruelo, J.; et al. The value of the world’s ecosystem services and natural capital. Nature 1997, 387, 253–260. [Google Scholar]
- Jianjun, J.; Chong, J.; Lun, L. The economic valuation of cultivated land protection: A contingent valuation study in Wenling City, China. Landsc. Urban Plan. 2013, 119, 158–164. [Google Scholar] [CrossRef]
- Xu, H.; Pittock, J.; Daniell, K. Sustainability of what, for whom? A critical analysis of Chinese development induced displacement and resettlement (DIDR) programs. Land Use Policy 2022, 115, 106043. [Google Scholar] [CrossRef]
- Liu, L.; Liu, Z.; Gong, J.; Wang, L.; Hu, Y. Quantifying the amount, heterogeneity, and pattern of farmland: Implications for China’s requisition-compensation balance of farmland policy. Land Use Policy 2019, 81, 256–266. [Google Scholar] [CrossRef]
- Duke, J.; Lynch, L. Farmland Retention Techniques: Property Rights Implications and Comparative Evaluation. Land Econ. 2006, 82, 189–213. [Google Scholar] [CrossRef]
- Lin, H.-C.; Hülsbergen, K.-J. A new method for analyzing agricultural land-use efficiency, and its application in organic and conventional farming systems in southern Germany. Eur. J. Agron. 2017, 83, 15–27. [Google Scholar] [CrossRef]
- Himiyama, Y. Historical information bases for land use planning in Japan. Land Use Policy 1999, 16, 145–151. [Google Scholar] [CrossRef]
- Perrin, C.; Clément, C.; Melot, R.; Nougarèdes, B. Preserving Farmland on the Urban Fringe: A Literature Review on Land Policies in Developed Countries. Land 2020, 9, 223. [Google Scholar] [CrossRef]
- Niu, S.; Fang, B. Cultivated Land Protection System in China from 1949 to 2019: Historical Evolution, Realistic Origin Exploration and Path Optimization. China Land Sci. 2019, 33, 1–12. [Google Scholar]
- Liu, X.; Zhao, C.; Song, W. Review of the evolution of cultivated land protection policies in the period following China’s reform and liberalization. Land Use Policy 2017, 67, 660–669. [Google Scholar] [CrossRef]
- Yan, J.; Guo, D.; Xia, F. The Historical Logic, Theoretical Logic and Practical Logic of the Change of the Land System of the Communist Party of China in the Past 100 Years. J. Manag. World 2021, 37, 2, 19–31. [Google Scholar]
- Liu, M.-B.; Zhang, A.-L. Historical Logic and Optimization Path of the Policy Changes in China’s Cultivated Land Use in the Past 100 Years since the Founding of the CPC. China Land Sci. 2021, 35, 19–28. [Google Scholar]
- Wang, Y.-J.; Zhang, J. Cultivated land protection policy failure and countermeasures from the perspective of regional development. China Popul. Resour. Environ. 2009, 19, 76–81. [Google Scholar]
- Su, M.; Guo, R.; Hong, W. Institutional transition and implementation path for cultivated land protection in highly urbanized regions: A case study of Shenzhen, China. Land Use Policy 2019, 81, 493–501. [Google Scholar] [CrossRef]
- Li, X.-W.; Zhang, W.-W.; Chen, S. Local cooperation, collusion and institutional innovation under the strict control of cultivated land conversion—Evidence from the trade policy of land development rights in Zhejiang Province. China Econ. Q. 2020, 19, 797–824. [Google Scholar]
- Zhou, Y.; Li, X.; Liu, Y. Cultivated land protection and rational use in China. Land Use Policy 2021, 106, 105454. [Google Scholar] [CrossRef]
- Wang, J.; Zhai, T.; Lin, Y.; Kong, X.; He, T. Spatial imbalance and changes in supply and demand of ecosystem services in China. Sci. Total Environ. 2018, 657, 781–791. [Google Scholar] [CrossRef]
- Zhou, H.; Wen, G.-H.; Hu, X.-H.; Hu, M.-Y. Research on the influence of farmers’ perception of agricultural pollution on farmland input behavior. Chin. J. Agric. Res. Reg. Plan. 2021, 42, 32–41. [Google Scholar]
- Bergstrom, C.; Ready, R.C. What Have We Learned from over 20 Years of Farmland Amenity Valuation Research in North America? Rev. Agric. Econ. 2009, 31, 21–49. [Google Scholar] [CrossRef]
- Zhang, H.; Jia, S. Analysis of the regulation mechanism of land conversion. Econ. Res. J. 2001, 12, 50–54. [Google Scholar]
- Tang, Y. Economic analysis of land conversion in China—From the perspective of local government game. Econ. Surv. 2011, 4, 116–120. [Google Scholar]
- Niu, H.; Zhang, A. Externality of cultivated land protection and its calculation—Taking Jiaozuo City, Henan Province as an example. Resour. Sci. 2009, 31, 1400–1408. [Google Scholar]
- Pagiola, S. Payments for Environmental Services in Costa Rica. MPRA Pap. 2006, 65, 712–724. [Google Scholar] [CrossRef]
- Zhang, J.; Zhang, A.; Song, M. Ecological Benefit Spillover and Ecological Financial Transfer of Cultivated Land Protection in River Basins: A Case Study of the Yangtze River Economic Belt, China. Sustainability 2020, 12, 7085. [Google Scholar] [CrossRef]
- Wang, K.; Ou, M.; Wolde, Z. Regional Differences in Ecological Compensation for Cultivated Land Protection: An Analysis of Chengdu, Sichuan Province, China. Int. J. Environ. Res. Public Health 2020, 17, 8242. [Google Scholar] [CrossRef]
- Ding, Z.; Yao, S. Theory and valuation of cross-regional ecological compensation for cultivated land: A case study of Shanxi province, China. Ecol. Indic. 2022, 136, 108609. [Google Scholar] [CrossRef]
- Li, H.; Su, D.; Cao, Y.; Wang, J.; Cao, Y. Optimizing the Compensation Standard of Cultivated Land Protection Based on Ecosystem Services in the Hangzhou Bay Area, China. Sustainability 2022, 14, 2372. [Google Scholar] [CrossRef]
- Meng, Y.; Liu, M.; Guan, X.; Liu, W. Comprehensive evaluation of ecological compensation effect in the Xiaohong River Basin, China. Environ. Sci. Pollut. Res. 2019, 26, 7793–7803. [Google Scholar] [CrossRef]
- Yang, X.; Zhang, A. Farmers’ Heterogeneous Willingness to Pay for Farmland Non-Market Goods and Services on the Basis of a Mixed Logit Model—A Case Study of Wuhan, China. Int. J. Environ. Res. Public Health 2019, 16, 3876. [Google Scholar] [CrossRef]
- Jiang, Y.-N.; Guan, D.-G.; He, X.-J.; Yin, B.-L.; Zhou, L.-L.; Sun, L.-L.; Huang, D.-N.; Li, Z.-H.; Zhang, Y.-J. Quantification of the coupling relationship between ecological compensation and ecosystem services in the Yangtze River Economic Belt, China. Land Use Policy 2022, 114, 105995. [Google Scholar] [CrossRef]
- Su, Y. Quantitative Evaluation of Ecotourists’ Value Cognition Based on Choice Experiment: The Case of Zhejiang, China. Appl. Ecol. Environ. Res. 2017, 15, 633–650. [Google Scholar] [CrossRef]
- Yi, H.; Güneralp, B.; Filippi, A.M.; Kreuter, U.P.; Güneralp, İ. Impacts of Land Change on Ecosystem Services in the San Antonio River Basin, Texas, from 1984 to 2010. Ecol. Econ. 2017, 135, 125–135. [Google Scholar] [CrossRef]
- Fan, M.; Chen, L. Spatial characteristics of land uses and ecological compensations based on payment for ecosystem services model from 2000 to 2015 in Sichuan Province, China. Ecol. Inform. 2019, 50, 162–183. [Google Scholar] [CrossRef]
- Xie, G.; Zhen, L.; Lu, C.; Xiao, Y.; Chen, C. Expert knowledge based valuation method of ecosystem services in China. J. Nat. Resour. 2008, 23, 911919. [Google Scholar]
- Bai, Y.; Xu, H.; Ling, H. Eco-service value evaluation based on eco-economic functional regionalization in a typical basin of northwest arid area, China. Environ. Earth Sci. 2013, 71, 3715–3726. [Google Scholar] [CrossRef]
- Chen, W.; Zhao, H.; Li, J.; Zhu, L.; Wang, Z.; Zeng, J. Land use transitions and the associated impacts on ecosystem services in the Middle Reaches of the Yangtze River Economic Belt in China based on the geo-informatic Tupu method. Sci. Total Environ. 2019, 701, 134690. [Google Scholar] [CrossRef]
- Zhang, X.; He, S.; Yang, Y. Evaluation of wetland ecosystem services value of the yellow river delta. Environ. Monit. Assess. 2021, 193, 353. [Google Scholar] [CrossRef]
- Engel, S.; Pagiola, S.; Wunder, S. Designing payments for environmental services in theory and practice: An overview of the issues. Ecol. Econ. 2008, 65, 663–674. [Google Scholar] [CrossRef]
- Ring, I. Integrating local ecological services into intergovernmental fiscal transfers: The case of the ecological ICMS in Brazil. Land Use Policy 2008, 25, 485–497. [Google Scholar] [CrossRef]
- Bai, Y.; Liu, M.; Yang, L. Calculation of Ecological Compensation Standards for Arable Land Based on the Value Flow of Support Services. Land 2021, 10, 719. [Google Scholar] [CrossRef]
- Xie, H.; Wang, W.; Zhang, X. Evolutionary game and simulation of management strategies of fallow cultivated land: A case study in Hunan province, China. Land Use Policy 2018, 71, 86–97. [Google Scholar] [CrossRef]
- Chen, X.; Wang, J. Quantitatively Determining the Priorities of Regional Ecological Compensation for Cultivated Land in Different Main Functional Areas: A Case Study of Hubei Province, China. Land 2021, 10, 247. [Google Scholar] [CrossRef]
- Pagiola, S.; Arcenas, A.; Platais, G. Can Payments for Environmental Services Help Reduce Poverty? An Exploration of the Issues and the Evidence to Date from Latin America. World Dev. 2005, 33, 237–253. [Google Scholar] [CrossRef]
- Zhang, W. Game and Society; Peking University Press: Beijing, China, 2013. [Google Scholar]
- Reichelderfer, K.; Boggess, W.G. Government Decision Making and Program Performance: The Case of the Conservation Reserve Program. Am. J. Agric. Econ. 1988, 70, 1–11. [Google Scholar] [CrossRef]
- Cameron, G.; Connell, D. Food sovereignty and farmland protection in the Municipal County of Antigonish, Nova Scotia. J. Agric. Food Syst. Community Dev. 2021, 10, 173–193. [Google Scholar] [CrossRef]
- Tan, R.; Wang, R.; Sedlin, T. Land-Development Offset Policies in the Quest for Sustainability: What Can China Learn from Germany? Sustainability 2014, 6, 3400–3430. [Google Scholar] [CrossRef]
- Barrett, H.; Browne, A.; Harris, P.; Cadoret, K. Organic certification and the UK market: Organic imports from developing countries. Food Policy 2002, 27, 301–318. [Google Scholar] [CrossRef]
- Han, R.; Feng, C.-C.; Xu, N.; Guo, L. Spatial heterogeneous relationship between ecosystem services and human disturbances: A case study in Chuandong, China. Sci. Total Environ. 2020, 721, 137818. [Google Scholar] [CrossRef]
- Zuo, A.; Wang, J.; Huang, Q. Willingness to accept compensation for land fallowing: Results from a survey of village representatives in Northern China. Aust. J. Agric. Resour. Econ. 2020, 64, 845–866. [Google Scholar] [CrossRef]
- Shang, W.; Gong, Y.; Wang, Z.; Stewardson, M.J. Eco-compensation in China: Theory, practices and suggestions for the future. J. Environ. Manag. 2018, 210, 162–170. [Google Scholar] [CrossRef] [PubMed]
- Barrows, R.L.; Prenguber, B.A. Transfer of Development Rights: An Analysis of a New Land Use Policy Tool. Am. J. Agric. Econ. 1975, 57, 549–557. [Google Scholar] [CrossRef]
- Buchanan, J.M. Freedom, Market and Country; Beijing Institute of Economics Press: Beijing, China, 1988. [Google Scholar]
- Rubinstein, A. Perfect Equilibrium in a Bargaining Model. Econometrica 1982, 50, 97–109. [Google Scholar] [CrossRef]
- Druckman, D. Determinants of Compromising Behavior in Negotiation: A Meta-analysis. J. Confl. Resolut. 1994, 38, 507–556. [Google Scholar] [CrossRef]
- Niccolucci, V.; Bastianoni, S.; Tiezzi, E.B.P.; Wackernagel, M.; Marchettini, N. How deep is the footprint? A 3D representation. Ecol. Model. 2009, 220, 2819–2823. [Google Scholar] [CrossRef]
- Jin, Y.; Liu, Q.; Li, C. Evaluation of cultivated land carrying capacity based on improved three-dimensional ecological footprint model—Taking Jiangsu Province as an example. China Land Sci. 2020, 34, 96–104. [Google Scholar]
- Sun, B.; Zhang, L.; Yang, L.; Zhang, F.; Norse, D.; Zhu, Z. Agricultural Non-Point Source Pollution in China: Causes and Mitigation Measures. Ambio 2012, 41, 370–379. [Google Scholar] [CrossRef]
- Wang, P.; Chen, X.; Shi, Z.; Kasmu, X.; Li, Y. Agricultural water and carbon footprint driving mechanisms at the household scale in North China Plain. Water Environ. J. 2019, 34, 216–228. [Google Scholar] [CrossRef]
- Yue, Q.; Guo, P. Managing agricultural water-energy-food-environment nexus considering water footprint and carbon footprint under uncertainty. Agric. Water Manag. 2021, 252, 106899. [Google Scholar] [CrossRef]
- Tristram, G.M.; West, O. A synthesis of carbon sequestration, carbon emissions, and net carbon flux in agriculture: Comparing tillage practices in the United States. Agric. Ecosyst. Environ. 2002, 91, 217–232. [Google Scholar]
- Li, B.; Zhang, J. Research on carbon effect characteristics and spatial differences based on changes in agricultural land use patterns in China. Econ. Geogr. 2012, 32, 135–140. [Google Scholar]
- Wang, X.L. Carbon Dioxide, Climate Change and Agriculture; Meteorological Press: Beijing, China, 1996. [Google Scholar]
- Li, K. Land Use Change, Net Greenhouse Gas Emissions and Terrestrial Ecosystem Carbon Cycle; Meteorological Press: Beijing, China, 2002. [Google Scholar]
- Peng, B.; Li, Y.; Elahi, E.; Wei, G. Dynamic evolution of ecological carrying capacity based on the ecological footprint theory: A case study of Jiangsu province. Ecol. Indic. 2018, 99, 19–26. [Google Scholar] [CrossRef]
- Sun, X.; Zhou, H.; Xie, G. Ecological Services and Their Values of Chinese Agroecosystem. China Popul. Resour. Environ. 2007, 17, 55–60. [Google Scholar]
- Qi, X. Spatial and Temporal Change of Positive and Negative Services Value and Its Impact Factors in Regional Farmland Ecosystem: A Case Study in Shandong Province. Res. Agric. Mod. 2013, 34, 622–626. [Google Scholar]
- Alonso, W. Location and Land Use: General Theory of Land Rent; Commercial Press: Beijing, China, 2007. [Google Scholar]
- Liu, L.; Zhang, B.; Liu, X. Research on the protection and compensation of China’s provincial cultivated land from the perspective of food security and ecological security. Trans. Chin. Soc. Agric. Eng. 2020, 36, 252–263. [Google Scholar]
- Zhou, J. Research on Theory and Method of Cultivated Land Valuation; Nanjing Agricultural University: Nanjing, China, 2005. [Google Scholar]
- Wei, Q. Research on Calculation and Operation Mechanism of Regional Cultivated Land Ecological Value Compensation; Nanjing Normal University: Nanjing, China, 2014. [Google Scholar]
- Liu, L.; Yang, B. Research on ecological compensation of provincial cultivated land in China. China Popul. Resour. Environ. 2019, 29, 52–62. [Google Scholar]
- Ruan, X.; Li, T.; Zhang, O.; Yao, Z. Quantitative study on cultivated land ecological compensation in the Yangtze River Economic Belt Based on ecological service value. Chin. J. Agric. Resour. Reg. Plan. 2021, 42, 68–76. [Google Scholar]
Publisher’s Note: MDPI stays neutral with regard to jurisdictional claims in published maps and institutional affiliations. |
© 2022 by the authors. Licensee MDPI, Basel, Switzerland. This article is an open access article distributed under the terms and conditions of the Creative Commons Attribution (CC BY) license (https://creativecommons.org/licenses/by/4.0/).