Abstract
Opencast mining contributes to the severe disturbance of vegetation and serious damage to the ecological environment. Scientific assessment of the ecological losses may provide guidance for the sustainable land use in mining areas. This study uses the Carnegie Ames Stanford Approach (CASA) model to estimate the net primary productivity (NPP) of vegetation in the Pingshuo mining area from 2006 to 2020 and uses statistical analysis and mathematical models to study the impact of mining and land reclamation on NPP. The results show that NPP decreased slowly at a rate of 0.809 gC/(m2·month) per year. In 2006, the urban area of Pinglu and the opencast coal mining area were located in the western part of the study area, while the eastern part was distributed with a large amount of grassland, forested and cultivated land, and the NPP showed a high pattern in the east and low in the west. With the continued eastward movement of Antaibao and Anjialing mining areas, as well as the construction and continuous westward expansion of the East opencast mine, the pits of all three opencast mines moved to a central location in 2020, changing the spatial distribution of NPP to high in the surroundings and low in the middle. The NPP within the three opencast mines decreased significantly, but the change in NPP increased from −7.34 gC/(m2·month) to 7.15 gC/(m2·month) as the reclamation area increased, indicating that mining increased ecological losses while land reclamation mitigated them. The variation of NPP within 600 m outside the mining area is 2.06~7.45 gC/(m2·month), and 0.11~1.00 gC/(m2·month) from 600 m to 1000 m, indicating that NPP is sensitive to the influence of mining. The results may provide guidance for further analysis of the impact of mining on local environments and exploration of more appropriate land reclamation measures.
1. Introduction
Large-scale opencast coal mining activities often lead to severe degradation of terrestrial ecosystems The damage to the land [1]. A large number of abandoned rocks and soil are discharged, occupying a large area of land, destroying the surface vegetation and the area covered by regional vegetation is constantly decreasing [2,3]. As an important carbon sink in terrestrial ecosystems, vegetation plays a huge role in the global carbon balance and in maintaining global climate stability [4,5]. The environmental issue of climate change is extremely important to the development of human society. Hence, with the reduction in carbon emissions and the improvement of carbon sinks, it has become a consensus to slow down the rate of global warming [6] The Chinese government strives to achieve carbon peaking in 2030 and carbon neutrality in 2060. Increasing the vegetation carbon storage in terrestrial ecosystems is an important way to achieve this goal, and it is also an important part of current global changes [7].
The net primary productivity (NPP) of vegetation refers to the total amount of organic matter obtained by photosynthesis per unit area and unit time, and the amount of dry matter remaining after eliminating autotrophic respiration [8,9]. NPP is not only an important variable to characterize vegetation activities, but also a main factor to determine the carbon sink capacity of the ecosystem and regulate the ecology [10]. Furthermore, NPP can use a unified scale standard to measure the impact of changes in the structure and the function of the regional ecosystems on vegetation and directly reflect the production capacity of vegetation communities under natural conditions [11]. Regional NPP estimation and spatio-temporal evolution studies can effectively indicate the changes in regional carbon sinks and its response to human activities [12]. This is helpful for ecological loss assessment and ecological quality monitoring.
Due to the importance of NPP in the study of ecological environment systems, the results of NPP calculated at different spatial scales from many studies are available [13,14]. The methods of calculating NPP of vegetation include measured method, statistical method and remote sensing technology [15]. The characteristics of remote sensing data are their periodicity and land coverage [16]. The use of different models combined with remote sensing data to estimate NPP and its spatio-temporal distribution has become a mainstream research method. There are currently three main types of vegetation NPP estimation models, namely climate-related models, ecological process models and energy use efficiency models [17]. The improved CASA model selected in this paper is a process model belonging to the light energy utilization mechanism, which is widely used for monitoring the net primary productivity (NPP) of regional vegetation due to its few parameters and strong correlation with vegetation physiological characteristics [18,19]. So far, the CASA model has been used to a certain extent for the vegetation NPP simulation of grasslands in northern China [20,21], the Yangtze River Basin [22], and the Loess Plateau [23]. Hicke et al., for instance, used the CASA model to estimate the net primary productivity of vegetation in North America and found that the NPP trends of cropland, grassland and forest peaked in late spring and early summer [24]. Based on the NPP value calculated by using the CASA model. Fan et al. quantitatively analyzed the ecological resilience in Central Asia based on the NPP values calculated by the CASA model [25].
Opencast mining is the most commonly used coal mining technology in the world, and it accounts for 15% of China’s coal production [1]. With the large-scale mining of coal resources, it has a direct or indirect negative impact on land use and ecological environment in coal mining areas, especially opencast mining has contributed to extensive damage to the original topography, vegetation and soil [26]. According to available statistics, for every 10,000 t of coal mined in China’s open-pit coal mines, 0.22 ha of land is damaged, of which 0.12 ha is directly damaged by excavation, and 0.10 ha is occupied by external dumps. The average annual damaged and occupied land area is up to 10,000 ha [27]. This has led to huge changes in the vegetation, hydrology, microclimate and biology of the mining ecosystem, which has disrupted the ecological environment of the entire mining area. Comparing soil dumps at different ages with soils in unmined areas found that up to 80% of soil organic carbon in opencast coal mining is lost to soil disturbance [28]. The carbon sink capacity of vegetation is almost completely lost due to the removal of surface vegetation [29]. Xu et al., reported that the disturbance factors affecting the net primary productivity of vegetation in the mining area are mainly mining activities, and frequent mining activities will reduce NPP [30]. Wu et al., demonstrated that the carbon stocks in mining areas are mainly affected by the mining activities, and excessive mining activity will destroy the arable land and ecological environment in mining areas, thus decreasing carbon stocks, while land reclamation improves land productivity and increases carbon stocks [31]. Liao et al. analyzed the net primary productivity (NPP) of vegetation in the process of ecological reconstruction of the mining area and found that the restored mining area can effectively improve the regional carbon sink capacity [6]. Some studies (e.g., Chen et al.; Ahirwal et al.) mainly focused on carbon stock estimation and spatial distribution variability [32,33], but there is a lack of systematic analysis of NPP changes in mining activity and ecological reconstruction. Therefore, it is very important to quantitatively evaluate the loss of the ecological environment in mining area by using the NPP as an index, which can provide a reference for the further management of the ecological environment by mining activities and the exploration of more suitable reclamation measures.
The Pingshuo mining area is located in the Loess Plateau, which is an ecologically fragile area with strong erosion potential. With the beginning of mining activity in 1986, the mining of mineral resources for 34 years changed the morphology of the original landscape. This changed the type and distribution pattern of vegetation, and also changed the capacity of energy conversion and the magnitude of productivity. The impact of coal mining on the ecological environment of the mining area has formed the pattern and change process of the surface vegetation with the characteristics of mining activities. At present, studies on the ecological environment quality of mining areas mainly adopts the methods of ecological service value [34], ecological carrying capacity [35] and multi-index method [36]. These methods cannot compare the results of the ecological environment quality assessment of mining areas for different types of mining areas [37]. NPP can be used as a unified scale standard to measure the changes in ecological conditions in mining areas [30]. The purpose of this study is to start from the vegetation change, to use the CASA model to evaluate the NPP of different vegetation types in the Pingshuo mining area, to analyze the spatio-temporal changes of the NPP from 2006 to 2020 and to analyze the impact of mining activities and land reclamation on the change of the NPP trend. The NPP is used as an indicator to analyze the ecological loss of the mining area, characterize the operational quality of the mining ecosystem and provide guidance for the restoration of the ecosystem in the Pingshuo mining area and the environmental management of the mining area.
2. Material and Methods
2.1. Study Area
The Pingshuo mining area is located in the black triangle area where the Loess Plateau borders Shanxi, Shaanxi and Inner Mongolia. It is located in Pinglu District and Shuocheng District in northern Shanxi Province, China, at the northern end of the Ningwu Coalfield. The geographical coordinates range from 112°10′–112°30′ E, 39°23′–39°37′ N (Figure 1). The mining area is 21 km long from north to south and 22 km wide from east to west, with a total area of about 380 km2. The proven coal geological reserves are 12.75 × 10⁹ t, which is one of the largest opencast mining mines in China. The study area includes 6 administrative towns, namely Jingping, Xiangyangbao, Baitang, Yulin, Taocun and Xiamiangao, as well as three large-scale opencast coal mines inside, namely Antaibao opencast mine, Anjialing opencast mine and East opencast mine. The study area has a semi-arid continental monsoon climate in the north temperate zone, with an average annual precipitation of about 450 mm, an average annual temperature of 4.8–7.8 °C and an average annual evaporation of 1786–2589 mm [38]. The zonal soil is chestnut calcareous soil and loess soil, and the vegetation type belongs to steppe vegetation [39].
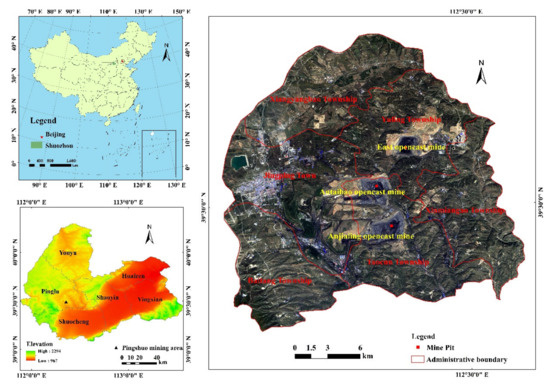
Figure 1.
Schematic diagram of the geographical location of the study area.
In recent years, due to the advancement of mining activity, many villages need to be relocated, and new rural construction has created new disturbances to the land. The type of land use changes with mining activity, expansion of construction land and relocation and resettlement of residential areas. In addition, due to the implementation of the “grain for green” ecological policy, cultivated land has been transformed into forest land and grassland, resulting in changes in the distribution of vegetation [40].
2.2. Data Soure
The data used in this study include remote sensing data, meteorological data, land use type data, etc., of the Pingshuo mining area. The data were uniformly converted to the same spatial reference coordinate system (WGS_1984_UTM_Zone_49n) by projection and cropped according to the administrative boundaries of the study area. The remote sensing data were obtained from the spatial geographic data cloud (https://www.gscloud.cn/ (accessed on 6 March 2022)), including two periods of Landsat5 TM data in August 2006 and August 2010, and two periods of Landsat8 data in August 2016 and August 2020, with a spatial resolution of 30 m. The image was preprocessed with ENVI5.3 for atmospheric correction, radiometric calibration and geometric correction, and the NDVI data set of the study area by month was calculated. According to the calculated NDVI data set and the actual situation of the mining area, the mining area was divided into vegetated and non-vegetated areas.
The meteorological data were obtained from the monitoring data from 6 meteorological stations of the Shuozhou Meteorological and Meteorological Bureau in 2006, 2010, 2016 and 2020. The data include monthly mean temperature and precipitation, as well as monthly total solar radiation data and latitude and longitude coordinates of each meteorological station. Based on the latitude and longitude information of each meteorological station, the Kriging interpolation method is used in ArcGIS to obtain the raster data of temperature, precipitation and solar radiation in Pingshuo mining area with the same pixel size, the same projection and the same spatial resolution as the NDVI data.
The land use type data for 2006 and 2010 were interpreted from Landsat TM/ETM remote sensing data, and the data for 2016 and 2020 were from Landsat8 remote sensing image data. After field investigation and random sampling verification, interpretation accuracy rate is 91.58%; after random sampling inspection, the accuracy rate is 91.75%. In order to facilitate the calculation of NPP of different vegetation types, the vegetation types of the Pingshuo mining area were combined into 8 categories according to the classification standard, including forest land, cultivated land, grassland, water area, construction land, abandoned land, stripping area and open pit.
The vegetation biomass data were obtained from the Pingshuo survey data, including various tree species, tree diameter, height, grassland types, 1 m × 1 m and 10 m × 10 m quadratic data, crop types, etc. The observed data of the above-ground biomass of various vegetation types were converted to obtain the NPP measurement data for the validation of model estimation data.
2.3. Methods
2.3.1. CASA Model
NPP is a direct indicator that expresses the energy and material quantity of an ecosystem and is used to calculate the carbon loss caused by mining [41]. This paper uses it as a quantitative indicator of ecological loss [30,37]. This paper estimates NPP based on a modified CASA model. It is a light energy utilization model driven by remote sensing data, temperature, precipitation and solar radiation, as well as vegetation type and soil type [42,43]. In this model, net primary productivity (NPP) of vegetation is a function of vegetation absorption of photosynthetically active radiation (APAR) and photosynthetic use efficiency (ε), as in Equation (1):
where NPP (x,t) is the net primary productivity, gC/(m2·month); APAR (x,t) is vegetation absorption of photosynthetically active radiation in the pixel x in month t, MJ/(m2·month); ε (x, t) is photosynthetic use efficiency in the pixel x in month t, gC/MJ; t is time; x is the spatial location.
Photosynthesis of vegetation is the process of absorbing light energy and converting light energy by vegetation leaves. Fraction of photosynthetic active radiation (FPAR) is an important measure of vegetation water, energy and carbon cycle balance, and is a basic physiological variable to describe vegetation structure and related material and energy exchange processes. It depends on the ratio of total solar radiation (SOL) to photosynthetically active radiation (FPAR) absorbed by the vegetation canopy and is described by Equation (2).
where FPAR(x, t) is fraction of photosynthetic active radiation of vegetation in the pixel x in month t, SOL (x, t) is total solar radiation in the pixel x in month t, MJ/ (m2·month); a constant of 0.5 represents about half of the effective solar radiation available to vegetation [44,45]. In this study, FPAR was estimated by Equation (3), as, follows:
where FPAR(x,t)NDVI and FPAR(x,t)SR are FPAR calculated from NDVI (see Equation(4)) and SR (see Equation(5)) at pixel x and month t, respectively [6].
where NDVIi,max and NDVIi,min are the maximum and minimum values of NDVI for the vegetation type i; the maximum and minimum values of FPAR were 0.950 (FPARmax) and 0.001 (FPARmin), respectively. SRi,max and SRi,min are the 5% and 95% lower percentile of NDVI for the vegetation type i, SR(x,t) is the ratio of NDVI for month t of x pixels [46], calculated according to Equation (6).
where NDVI(x,t) is the NDVI for month t of pixel x.
The light use efficiency (ε) is the efficiency of the conversion of photosynthetically active radiation absorbed by vegetation into organic carbon, which is mainly affected by temperature and humidity, as in Equation (7):
where ε1, ε2 is the temperature stress coefficient, which reflects the effect of temperature on the utilization rate of light energy, εw is the water stress coefficient, which reflects the effect of water conditions, ε* is the maximum light energy utilization rate under ideal conditions, g/MJ [47].
2.3.2. Statistical Analysis and Mathematical Model
This study analyzes the spatial and temporal evolution characteristics of NPP data from 2006 to 2020 and the impact of mining and land reclamation on NPP with the help of statistical tools, such as mean value analysis, simple difference and trend analysis. In addition, a buffer zone with a radius of 200 m was established within 1 km beyond the mining boundary, and the NPP values within each area were counted to analyze the impact of mining on the surrounding NPP.
2.3.3. Correlation Analysis
Correlation analysis is used to reflect the direction and degree of correlation between elements [48]. In this paper, the Pearson correlation coefficient method is used to analyze the correlation and significance level between the measured and estimated NPP values, as in Equation (8):
where Rxy is the correlation coefficient of variables x and y, n is the number of years, xi is the measured value of NPP in year i, yi is the estimated NPP in year i, xp, yp are the n-year averages of the variables x and y, respectively.
3. Result and Analysis
3.1. Model Accuracy Verification
Using the biomass data of the sampling points surveyed in the Pingshuo mining area in August 2020, the above-ground biomass observation data of various types of vegetation were converted to obtain the measured value of the NPP of vegetation. The results are according to the longitude and latitude of the 45 sampling points measured on the spot, using its coordinate information to extract the estimated NPP value in the result estimated by the CASA model and export the extracted value. In Statistical Product and Service Solutions (SPSS), the correlation analysis between the measured value and the estimated value of NPP was carried out; it was found that the vegetation NPP estimation results were significantly correlated with the measured data (R2 = 0.700, p < 0.01) (n = 45) (Figure 2), indicating that the CASA model could well predict the changes of NPP values at sampling points.
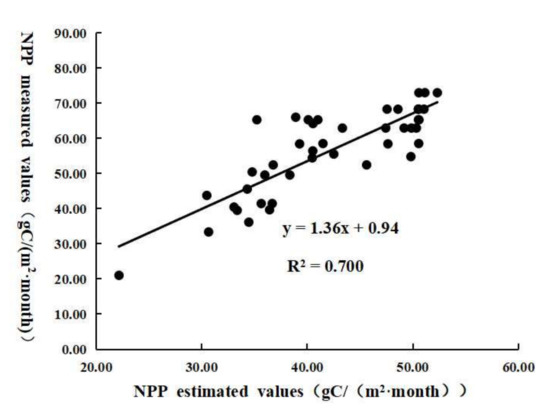
Figure 2.
Net primary productivity model accuracy verification.
3.2. Spatial Variation Analysis of NPP
Using the improved CASA model to estimate the vegetation NPP value of the Pingshuo mining area, the results are shown in Figure 3. In 2006, the urban area of Pinglu and the opencast coal mining area were located in the western part of the study area, while grassland, forested and cultivated land were distributed in the eastern part, so the vegetation NPP in the study area in 2006 showed a high pattern in the east and low in the west. The annual estimated result is greater than the average value of this year as the high value of NPP. From 2006 to 2020, the NPP values of the Xiamiangao Township in the east and the Xiangyangbao Township in the north of the entire study area remained stable and the high-value areas were relatively large. The high-value areas in the Xiamiangao Township accounted for about 57.05%, and the Xiangyangbao Township accounted for about 58.91%. This is because the two townships are not only distributed with a large amount of arable land. Similarly, the NPP value of the Baitang Township in the western part of the study area changed gradually from 2006 to 2020, and the areas with high NPP values were mainly distributed in the woodlands in the western part of the township. The area of high-value areas in Jingping Town in the northwest of the study area from 2006 to 2020 showed a continuous increase trend. The Taocun Township’s overall NPP value dropped significantly from 2006 to 2020, from 42.44 gC/(m2·month) in 2006 to 32.14 gC/(m2·month) in 2020. The area of high NPP value areas in the Taocun Township is also decreasing, mainly due to the eastward expansion of the Antaibao opencast mine and Anjialing opencast mine, resulting in the destruction of large areas of arable land and grasslands. The NPP value of the Taocun Township has changed from a uniform distribution in 2006 to a much higher value in the south than in the north in 2020. In 2006, the distribution of NPP value in the Yulin Township was relatively balanced and the area with high value was large. Due to the start of construction of the East opencast mine in 2010, the NPP value also began to decrease. From 2010 to 2016, due to the westward expansion of the East opencast mine, the area with high NPP value in the west of the Yulin Township continued to decrease, which made the decreasing trend of NPP value in the Yulin Township gradually move westward. From 2016 to 2020, due to the continuous westward movement of mining pits, the mining pits moved from the eastern part of the Yulin Township to the central part. At the same time, the NPP value in the east of the Yulin Township gradually increased, so that the NPP distribution in the Yulin Township in 2020 gradually tends to be high in the east and west and low in the middle. To sum up, due to the continuous eastward expansion of the Antaibao and Anjialing mining areas, the continuous westward movement of the East opencast mining area, and the continuous restoration of the dumps and pits in the mining areas. The NPP distribution of the study area has gradually evolved from a high in the east and a low in the west in 2006 to a situation of high in the surroundings and low in the middle in 2020.
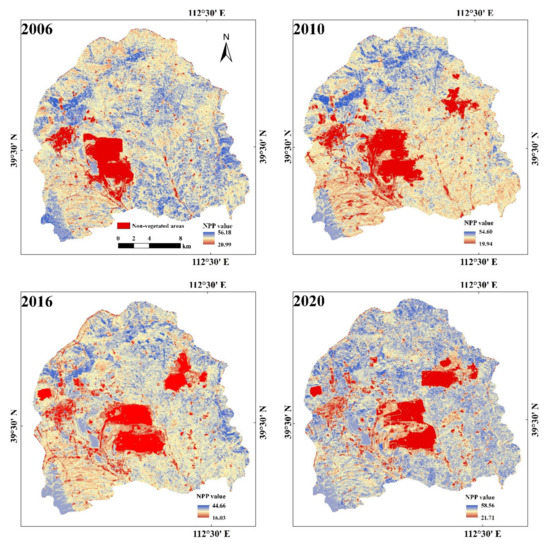
Figure 3.
Distribution of net primary productivity (NPP) of vegetation in different years.
3.3. Analysis of the Interannual Variation of NPP
The NPP in the study area took 2016 as a turning point and decreased from 39.54 gC/(m2·month) to 28.57 gC/(m2·month) from 2006–2016 and increased again from 28.57 gC/(m2·month)to 38.99 gC/(m2·month) from 2016–2020. The NPP change curve was obtained by trend analysis (Figure 4a), and the NPP decreased slowly at a rate of 0.809 gC/(m2·month) per year for 14 years. The NPP of the study area from 2006–2020 has obvious dynamics and has different dynamic characteristics in each period. The variation range of NPP value is less than −10 gC/(m2·month), which is a severe change, mainly in areas with greatly decreased vegetation coverage.
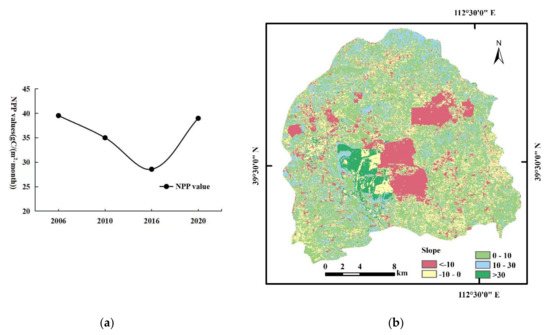
Figure 4.
(a) The NPP change trend of the study area from 2006 to 2020 (b).the spatial distribution of the NPP change trend from 2006 to 2020.
Areas with a variation range of >30 gC/(m2·month) have obvious changes, mainly due to the reclamation of dumps and mining pits, and the increase in vegetation coverage. The fluctuation range is between −10 gC/(m2·month) and 10 gC/(m2·month), which is a general change, mainly in urban areas, rural settlements, industrial sites and original mining pits, as well as some forest land, cultivated land and grassland. The fluctuation range is between 10 gC/(m2·month) and 30 gC/(m2·month) for moderate change. As shown in Table 1, from 2006 to 2010, the change range was the smallest, and the proportion of the area within the range of −10~10 gC/(m2·month) was 78.14%, and the proportion increased by 19.05%; The fluctuation range of <−10 gC/(m2·month) accounted for 18.01% of the total area, mainly due to the start of construction of the East opencast mine in 2010 and the advancement of the Antaibao opencast mine and Anjialing opencast mine. The area with a variation range of >30 gC/(m2·month) is relatively small, accounting for only 1.05% of the total area. From 2010 to 2016, the area ratio within the range of −10~10 gC/(m2·month) was 70.4%, which remained stable. The fluctuation range <−10 gC/(m2·month) accounted for 25.11% of the total area, an increase of 7.10%, mainly due to the increase in the stripping area of the three open-pit mines. In addition, there are very few areas with a variation range of >30 gC/(m2·month). From 2016 to 2020, the area within the range of −10~10 gC/(m2·month) was 24.4%. The fluctuation range is <−10 gC/(m2·month), accounting for 5.99% of the total area, mainly because the advancing speed of the mine is slowing down. The proportion of fluctuations in the range of 10~30 gC/(m2·month) was the largest, accounting for 67.61%. The area with a variation range of >30 gC/(m2·month) accounted for 1.91% because of the increase in the land reclamation area in the mining area.

Table 1.
Area distribution of variation range of different NPP (gC/(m2·month)).
In addition, the spatial distribution of NPP dynamic from 2006 to 2020 was obtained by the trend analysis (Figure 4b). The areas with a significant increases in NPP are concentrated in the ecological restoration areas, such as reclaimed dumps and restored mine pits in Jingping Town, which shows that the vegetation restoration in these areas is obvious, and the restoration project in the mining area has achieved certain results. The areas where NPP was significantly decreased were mine advancement areas, urban expansion, reservoir construction and other areas, concentrated in the Jingping Township, Taocun Township and Yulin Township.
3.4. Analysis of NPP Variation in Mining Area
It can be seen from Table 2 that the NPP values of the Antaibao opencast mine, Anjialing opencast mine and East opencast mine from 2006 to 2020 are in a downward trend as a whole. However, between 2016 and 2020, the NPP value of the Antaibao opencast mine increased by 7.97 gC/(m2·month), the Anjialing opencast mine increased by 7.51 gC/(m2·month), and the East opencast mine increased by 5.95 gC/(m2·month). Analysis of the reasons: on the one hand, with the mining of coal resources, the ecological environment of the mining area is continuously damaged, resulting in the continuous decline of the NPP value of the mining area. However, from 2016 to 2020, ecological restoration and land reclamation measures were taken in the mining area, and large-scale dumps were reclaimed, which improved the ecological environment quality of the mining area and eased the damage to the mining area, and the NPP value began to rise. At the same time, with the improvement of reclamation technology, the reclamation of open-pit mines has mainly developed from the reclamation of external dumps to the integration of mining and reclamation. It achieves mining and reclamation at the same time and slows down the damage to the ecological environment caused by the progress of the mine. On the other hand, large areas of cultivated land and grasslands in the unmined areas of the mining area have been converted into forest land. In addition, it can be found that the upward trend of the East opencast mine is much lower than that of the Antaibao opencast mine and Anjialing opencast mine; because the enlarged area of the pits of the Antaibao opencast mine and Anjialing opencast mine decreased significantly from 2016 to 2020, the damaged original landform area was small, and the pit advancement area was mainly grassland. On the other hand, the advancing area of the East Opencast mine has greatly increased, and the main damages caused by the advancing of the pit are arable land and forest land.
Table 2.
NPP change trend table of three opencast mines from 2006–2020.
In addition, comparing the degree of change of the NPP value of the three mining areas (Figure 5), it was found that the NPP value of the Antaibao opencast mine has a lower decline than that of the Anjialing opencast mine and the East opencast mine. First, because the three mining areas are in different stages. In 1987, the Antaibao opencast mine started coal mining activities, and by 2006, there was a large coal mining area. The Anjialing opencast mine only started coal mining activities in 2001. By 2006, the area of mining pit was small, and from 2006 to 2020, the mine area increased significantly. The East opencast mine started coal mining in 2010. In 2006, the entire mining area was still a primitive landform, and the NPP value was also at a high value. By 2020, due to the large-scale increase in mine pits, the ecological environment has been severely damaged, and the NPP value has also dropped sharply. Second, from 2006 to 2020, the land reclamation area in the Antaibao opencast mine is relatively large, while the land reclamation area in the Anjialing opencast mine and the East opencast mine is relatively small.
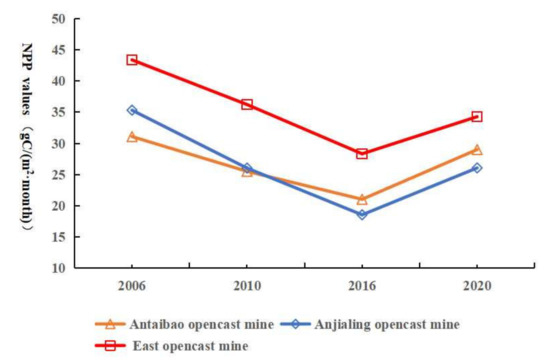
Figure 5.
NPP change trend of three opencast mines.
3.5. NPP Analysis of the Surrounding Area of the Mining Area
A buffer zone with a radius of 200 m was established within 1 km beyond the mining boundary of the Antaibao and Anjialing opencast mines from 2006 to 2020 (Figure 6), and the NPP values within each area were analyzed (Figure 7). It can be found that the NPP value within 600 m changes greatly, the change value in 2006 is 7.45 gC/(m2·month), the change value in 2010 is 5.21 gC/(m2·month), the change value in 2016 is 2.03 gC/(m2·month), and the change value in 2020 is 5.73 gC/(m2·month). The variation between 600 m and 1000 m is relatively gentle, and the variation range is between 0.11 gC/(m2·month) to 1.00 gC/(m2·month), and the NPP value maintains a relatively stable state. It can be seen from the above change trends that the mining area has a greater impact on the NPP value of the area within 600 m outside the boundary, while the impact on the NPP value of the area beyond 600 m is small, so it is also very important for the vegetation monitoring around the mining area.
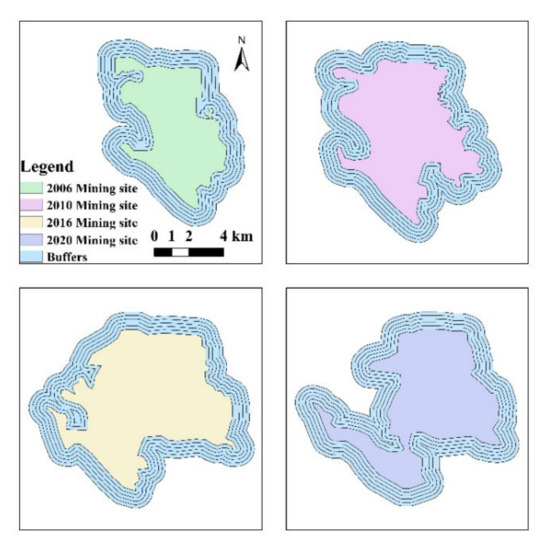
Figure 6.
The mining boundary buffer zone of Antaibao opencast mine and Anjialing opencast mine.
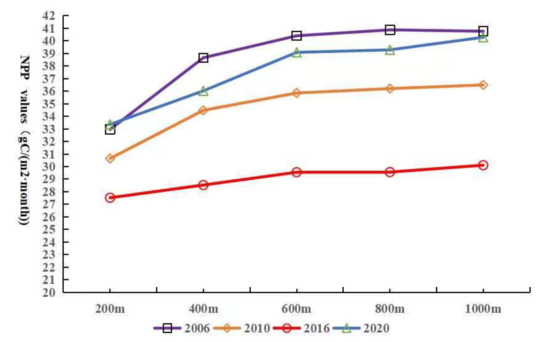
Figure 7.
Variation trend of buffer zone NPP value.
3.6. NPP Dynamics of Reclaimed Land
As shown in Table 3, by comparing the NPP values of different land use types in the same period, it was found that the NPP values of the unreclaimed dumps from 2006 to 2020 are all at the minimum value. This shows that dump is likely destructive to the ecological environment, and it also shows that it is not feasible to restore only through natural restoration without artificial reclamation. Secondly, the NPP value of the reclaimed forest land was 48.86 gC/(m2·month) in 2006, 47.18 gC/(m2·month) in 2010, 37.44 gC/(m2·month) in 2016, and 50.33 gC/(m2·month) in 2020. Compared with cultivated land, forest land and grassland, the NPP value of the reclaimed forest land is basically the highest in each year. The reclaimed forest land is mainly distributed in the west dump, the expansion area of the west dump, the south dump, and the inner dump of the Antaibao opencast mine and the Anjialing opencast mine. In addition, the reclamation years of the west dump and the south dump are more than 20 years, the soil quality has been greatly improved and the vegetation coverage rate is very high. The reclamation period of the expansion area of the west dump and the inner dump has also exceeded 10 years, and the vegetation is growing well. At the same time, the NPP of the dump is also at a high value after being reclaimed into arable land and grassland, indicating that the land reclamation measures in the mining area have achieved certain results.
Table 3.
NPP value of different land use types (gC/(m2·month)).
Combined with the changes in the mining area and reclamation area in the mine from 2006–2020 (Table 4), during 2006–2010, the newly added mining area was large, 1859.88 ha, the newly reclaimed area was smaller, 564.34 ha, and the NPP decreased by 7.34 gC/(m2·month). During 2010–2016, the new mining area decreased to 1326.87 ha, the new reclaimed area increased to 788.19 ha and NPP decreased by 6.62 gC/(m2·month). During 2016–2020, the newly added mining area continued to decrease to 521.14 ha, while the newly added reclamation area continued to increase to 1141.08 ha, and NPP increased by 7.15 gC/(m2·month). This fully shows that the land reclamation measures in the mining area have brought a positive effect on the ecological environment and alleviated the ecological loss in the coal mining area.
Table 4.
Changes in new mining area, new reclaimed area and NPP in the mining area from 2006 to 2020.
4. Discussion
4.1. Validation of the NPP Estimation of CASA
In this study, the estimated results were verified by the measured values of vegetation NPP obtained by converting the above-ground biomass observation data of vegetation, and the results showed a high correlation between the measured and estimated values (R2 = 0.700), indicating that the accuracy of the CASA model is reliable. Liu et al. verified the calculation of vegetation NPP in the Yili River Basin through aboveground biomass conversion and showed that the correlation between the measured and estimated NPP values in the entire study area was very high (R2 = 0.726) [49]. The high accuracy of the model may be due to the appropriate number of sampling points and the extent of the study area covering the study area [18]. However, due to the complexity of field collection data, at present, many studies have verified NPP through the annual net primary productivity (aNPP) of vegetation calculated by the BIOME-BGC model [50,51], but this method is mainly applied in large-area studies [52]. Therefore, future studies may need to seek simpler verification methods. In addition, according to the CASA model estimation, there is an overall non-significant decreasing trend of NPP in the study area and significant variation of NPP within the mine area, which is consistent with the research results of other scholars in the Pingshuo mining area, where Zhang et al. reported a continuous decreasing trend of carbon sink in the study area from 2005 to 2009 [53].
4.2. Effects of Mining Activities on NPP of Vegetation
The net primary productivity of vegetation varies in different ecosystems. Mining activities change land use types, leading to a decline in the NPP of vegetation. China’s open-pit coal mines are mainly distributed in Inner Mongolia, Shanxi and Xinjiang. Among them, the Loess Plateau is rich in mineral resources and has huge coal reserves, making it the largest coal mining base in China [54]. In this paper, we analyze the impact of mining on the ecological loss of the three major open-pit coal mines in the Pingshuo mining area from a new perspective, using NPP as an indicator. As mining activities progressed, the NPP of the three open-pit mines fell by 2.08 gC/(m2·month) to 9.25 gC/(m2·month), mainly because the vegetation in the stripping area almost disappeared after the surface was stripped by open-pit mining. In particular, the east open-pit mining area was in a high-value area before mining in 2010. However, with the progress of mining activities, a large amount of cultivated land, grassland and forest land were developed into mining and construction areas, which gradually inhibited NPP. Hou et al. reported that as mining activities intensified, the NPP in the ecologically damaged area varied from 2.752 gC/(m2·month) to 4.752 gC/(m2·month) [37]. An et al. analyzed the carbon sink in the Jiawang mining area in Xuzhou and found that coal mining weakened the carbon sink capacity of the regional ecosystem, and the carbon sink capacity of vegetation decreased by 10.23% from 1990 to 2010, mainly due to the reduction in vegetation area caused by mining [55]. Mylliemngap et al. found that removal of vegetation prior to coal mining and dumping reduces vegetation density, resulting in a 30% drop in grassland NPP [56]. Yang et al. studied the NPP of open pit coal mines in Inner Mongolia, China, and reported that when the intensity of mining activities was the highest, there was a significant inhibitory effect on NPP [57]. Open-pit mining needs to discard a large amount of rocks and topsoil, which occupies a large area of land, destroys more vegetation and reduces the net primary productivity of vegetation [58]. The change of NPP in the open pit mining area is particularly significant, and the decreasing trend of the vegetation NPP in the mining area is consistent with the advancement of the open pit. The mining of coal resources will not only directly damage the ecological environment in the mining area but also affect the surrounding vegetation conditions [59]. Hou et al., reported that mining activities resulted in a reduction in carbon stocks in vegetation, but the surrounding areas showed less change in carbon stocks than areas directly damaged by mining [60]. In our study, the variation range of NPP within 600 m from the mining area is between 2.03 gC/(m2·month) and 7.45 gC/(m2·month), and within 600–1000 m from the mining area, the NPP change value is 0.11 gC/(m2·month) to 1.00 gC/(m2·month), which is consistent with other studies. Coal mining leads to the destruction of the groundwater system, the quality of the surrounding land will also decline, the growth conditions of vegetation will be affected, and the coverage rate will also decrease [61]. Li et al. have shown that it is necessary to focus on dynamic monitoring of the mining area and its surrounding ecological environment [62].
Mining activities not only directly destroy the original landscape but also promote the expansion of urban land and the relocation of rural settlements, leading to continuous changes in land use types and consequent changes in the vegetation landscape, which largely affects the net primary productivity of regional vegetation. The mining area is a complex community involving natural, social and economic factors, and the direction and method of mining must be planned rationally, requiring monitoring in the later stages of land reclamation to prevent problems, such as forest land degradation and overgrazing [63,64].
4.3. Effects of Land Reclamation on NPP of Vegetation
The two main ways in which the open-pit mining of coal mines destroys the ecological environment are the occupation of the land by the dump and the damage to the original landform by the mine [65]. To alleviate the damage to the ecological environment caused by coal mining, the main method is to carry out land reclamation and ecological restoration in the mining area [66]. A study shows perennial vegetation reduces organic carbon loss when mining activity destroys natural vegetation [67]. In Table 3, we can find that the NPP of the reclaimed forest land is higher than that of the native vegetation, land reclamation has significantly improved the ecosystem functions of the mining area and the ecosystem functions of the reclaimed land have even surpassed the original landform [68]. Yang et al. showed that the reclamation of damaged land in mining areas, cultivated land, forest land and grassland has a strong carbon sequestration capacity [40]. In our study, the NPP values of unreclaimed dumps were low and higher NPPs were also obtained by reclaiming mine sites to grassland and cropland. Liu et al. encourage the reclamation of mining areas into forest land and other ecological land, which can help increase regional carbon stocks [69].
It is worth noting that the NPP value of the forest land in the reclamation area of the dump is higher than that in the reclamation pit because the reclamation period of the outer dump is longer than that of the reclamation pit. Studies have shown that a long reclamation period is conducive to the restoration of vegetation [70]. As of 2020, the south dump has been reclaimed from 1992 to 1997, and the west dump has been reclaimed from 1994 to 1997. Both dumps have been reclaimed for more than 20 years. The expansion area of the west dump began to be reclaimed from 2001 to 2008, and the reclamation period has exceeded 10 years. Moreover, the main reclamation direction of these areas is forest land with rich vegetation types. After years of development, vegetation and soil have formed a good cycle, and the soil quality and the number of vegetation have been improved, and finally NPP has also shown a high value. In addition, the mines were backfilled and the land was leveled. In the forest land distributed in these areas, due to the short reclamation years, the soil quality has not reached a high level, the vegetation NPP value in these areas is low. It shows that the soil quality in the mining area plays an important role in the net primary productivity of vegetation, and the net primary productivity of vegetation has a high correlation with soil quality. Therefore, it is important to apply a reasonable soil reconstruction model for the reclamation of land in mining areas when carrying out reclamation of land in mining areas [71].
Forestland plays an important role in improving carbon cycle and in climate regulation of mining ecosystems. With respect to the carbon cycle of mining area, the reclamated vegetation forest carbon pool is very important for the reclamated ecosystem and could reach more than 50% of the total carbon pool of that ecosystem [72,73]. Different vegetation types and vegetation allocation methods have different effects on the net primary productivity (NPP) of vegetation in land reclamation in mining areas. Studies have shown that on the Loess Plateau, Robinia pseudoacacia, Pinus tabulaeformis and Elm trees have strong adaptability to pollutants emitted by mining activities and have significant carbon sequestration effects. The configuration model of Robinia tabacum pine mixed forest has good ecosystem multi-functionality. This model promotes the productivity and biodiversity restoration of the reclaimed land ecosystem and improves the carbon sequestration and nutrient cycling functions of the reclaimed land ecosystem [74].
4.4. Impact Factors of NPP
We found that NPP was at a low level in 2016 and recovered to a high level in 2020, and this trend is also seen in areas far from the mining area. By analyzing the correlation between NPP value and monthly average precipitation and monthly average temperature, it is found that the change of NPP value in the mining area is positively correlated with precipitation (r = 0.790, p = 0.111) but has little correlation with temperature (r = 0.222, p = 0.720). In addition, the precipitation in 2020 is three times that of 2016, which shows that the NPP value is greatly affected by precipitation, which may be the reason for the large difference between the NPP in 2016 and other years. Xu et al. reported that climate change and mining factors are the dominant factors in NPP changes, but in mining areas, the impact of the mining activities on NPP is much greater than climate change [30].
5. Conclusions
This study systematically assessed and analyzed the net primary productivity (NPP) of vegetation in the Pingshuo mining area from 2006 to 2020. NPP was also used as an indicator to identify carbon loss. The study focused on the impact of mining activities and ecological restoration in mining areas, providing a theoretical basis for further analysis of the impact of mining on the local ecological environment and exploring more appropriate ecological restoration measures. The following conclusions were drawn:
- From 2006 to 2020, the NPP of the Pingshuo mining area has a downward trend, from 39.54 gC/(m2·month) in 2006 to 38.99 gC/(m2·month) in 2020. The spatial distribution of NPP in the study area has gradually evolved from high in the east and low in the west in 2006 to a trend of high in the surrounding area and low in the middle in 2020. The significant decrease area is the mining area distributed in the center of the study area, and the significant increase area is the land reclamation area.
- As mining activities progressed, the NPP of the three open-pit mines fell by 2.08 gC/(m2·month) to 9.25 gC/(m2·month). It shows that with the increase in the mining speed and the continuous expansion of the mining scope, the degree of damage to the ecological environment of the mining area is also increasing, and the disturbance to the ecosystem continues to increase.
- The NPP value within 600 m from the mining area has a large change. The change value of NPP in different years is between 2.03 gC/(m2·month) and 7.45 gC/(m2·month). The change between 600 m and 1000 m from the mining area is relatively gentle, and the change range is −0.11~1.00 gC/(m2·month), indicating that vegetation NPP is sensitive to the impact of mining activities.
- The NPP value of the unreclaimed area is 18.63–26.65 gC/(m2·month), the NPP value of forest land in the reclaimed area is 37.44–50.53 gC/(m2·month), the reclaimed cultivated land is 35.28–45.56 gC/(m2·month), and the reclaimed grassland is 37.01–44.57 gC/(m2·month). It shows that NPP is significantly affected by land reclamation, and land reclamation can effectively restore part of the lost NPP and can alleviate the ecological loss of the mining area to a certain extent.
Author Contributions
Software, validation, formal analysis, investigation, resources, data curation, writing—original draft preparation, writing—review and editing, S.F. and L.X.; methodology, visualization, supervision, B.Y.; Conceptualization, project administration, funding acquisition Z.B. All authors have read and agreed to the published version of the manuscript.
Funding
The study was supported by the National Key Research and Development Program of China (2017YFF0206802).
Institutional Review Board Statement
Not applicable.
Informed Consent Statement
Not applicable.
Data Availability Statement
The data are not publicly available due to privacy.
Conflicts of Interest
The authors declare no conflict of interest.
References
- Ussiri, D.A.N.; Lal, R. Carbon sequestration in reclaimed minesoils. Crit. Rev. Plant Sci. 2005, 24, 151–165. [Google Scholar] [CrossRef]
- Wong, M.H. Ecological restoration of mine degraded soils, with emphasis on metal contaminated soils. Chemosphere 2003, 50, 775–780. [Google Scholar] [CrossRef]
- Li, M.S. Ecological restoration of mineland with particular reference to the metalliferous mine wasteland in China: A review of research and practice. Sci. Total Environ. 2006, 357, 38–53. [Google Scholar] [CrossRef] [PubMed]
- Guenther, A. The contribution of reactive carbon emissions from vegetation to the carbon balance of terrestrial ecosystems. Chemosphere 2002, 49, 837–844. [Google Scholar] [CrossRef] [Green Version]
- Fatichi, S.; Pappas, C.; Zscheischler, J.; Leuzinger, S. Modelling carbon sources and sinks in terrestrial vegetation. New Phytol. 2019, 221, 652–668. [Google Scholar] [CrossRef] [Green Version]
- Liao, Q.P.; Liu, X.R.; Xiao, M.Z. Ecological Restoration and Carbon Sequestration Regulation of Mining Areas-A Case Study of Huangshi City. Int. J. Environ. Res. Public Health 2022, 19, 4175. [Google Scholar] [CrossRef]
- Wu, J.; Zhang, Y.; Jiang, W. Spatial and temporal evolution of ecosystem carbon stocks in the Guangdong-HongKong-Macao Greater Bay Area. Landsc. Archit. 2020, 27, 57–63. [Google Scholar]
- Pan, J.H.; Dong, L.L. Spatio-temporal variation in vegetation net primary productivity and its relationship with climatic factors in the Shule River basin from 2001 to 2010. Hum. Ecol. Risk Assess. 2018, 24, 797–818. [Google Scholar] [CrossRef]
- Yan, Y.C.; Liu, X.P.; Ou, J.P.; Li, X.; Wen, Y.Y. Assimilating multi-source remotely sensed data into a light use efficiency model for net primary productivity estimation. Int. J. Appl. Earth Obs. Geoinf. 2018, 72, 11–25. [Google Scholar] [CrossRef]
- Field, C.B.; Behrenfeld, M.J.; Randerson, J.T.; Falkowski, P. Primary production of the biosphere: Integrating terrestrial and oceanic components. Science 1998, 281, 237–240. [Google Scholar] [CrossRef] [Green Version]
- Zhu, W.Q.; Pan, Y.Z.; Zhang, J.S. Estimation of Net Primary Productivity of Chinese Terrestrial Vegetation Based on Remote Sensing. Acta Phytoecol. Sin. 2007, 31, 413–424. [Google Scholar]
- Ge, W.Y.; Deng, L.Q.; Wang, F.; Han, J.Q. Quantifying the contributions of human activities and climate change to vegetation net primary productivity dynamics in China from 2001 to 2016. Sci. Total Environ. 2021, 773, 145648. [Google Scholar] [CrossRef] [PubMed]
- Yuan, Q.Z.; Wu, S.H.; Zhao, D.S.; Dai, E.F.; Chen, L.; Zhang, L. Modeling net primary productivity of the terrestrial ecosystem in China from 1961 to 2005. J. Geogr. Sci. 2014, 24, 3–17. [Google Scholar] [CrossRef]
- Zhang, F.; Zhou, G.S.; Wang, Y.H. Dynamics Simulation of Net Primary Productivity by a Satellite Data-Driven Casa Model in Inner Mongolian Typical Steppe, China. Acta Phytoecol. Sin. 2008, 32, 786–797. [Google Scholar]
- Steele, S.J.; Gower, S.T.; Vogel, J.G.; Norman, J.M. Root mass, net primary production and turnover in aspen, jack pine and black spruce forests in Saskatchewan and Manitoba, Canada. Tree Physiol. 1997, 17, 577–587. [Google Scholar] [CrossRef] [Green Version]
- Li, Y.; Zhang, T.; Sun, R.; Liu, Q. A Model of Estimating Vegetation Productivity Based on Meteorological and Remote Sensing Data. J. Northwest For. Univ. 2017, 32, 230–236. [Google Scholar]
- Zhu, W.; Chen, Y.; Xu, D.; Li, J. Advances in terrestrial net primary productivity (NPP) estimation models. Chin. J. Ecol. 2005, 24, 296–300. [Google Scholar]
- Hadian, F.; Jafari, R.; Bashari, H.; Tartesh, M.; Clarke, K.D. Estimation of spatial and temporal changes in net primary production based on Carnegie Ames Stanford Approach (CASA) model in semi-arid rangelands of Semirom County, Iran. J. Arid. Land 2019, 11, 477–494. [Google Scholar] [CrossRef] [Green Version]
- Jia, J.; Liu, H.; Lin, Z. Multi-time scale changes of vegetation NPP in six provinces of northwest China and their responses to climate change. Acta Ecol. Sin. 2019, 39, 5058–5069. [Google Scholar]
- Mu, S.J.; Zhou, S.X.; Chen, Y.Z.; Li, J.L.; Ju, W.M.; Odeh, I.O.A. Assessing the impact of restoration-induced land conversion and management alternatives on net primary productivity in Inner Mongolian grassland, China. Glob. Planet. Change 2013, 108, 29–41. [Google Scholar] [CrossRef]
- Gang, C.C.; Zhao, W.; Zhao, T.; Zhang, Y.; Gao, X.R.; Wen, Z.M. The impacts of land conversion and management measures on the grassland net primary productivity over the Loess Plateau, Northern China. Sci. Total Environ. 2018, 645, 827–836. [Google Scholar] [CrossRef] [PubMed]
- Zhang, F.Y.; Zhang, Z.X.; Kong, R.; Chang, J.; Tian, J.X.; Zhu, B.; Jiang, S.S.; Chen, X.; Xu, C.Y. Changes in Forest Net Primary Productivity in the Yangtze River Basin and Its Relationship with Climate Change and Human Activities. Remote Sens. 2019, 11, 1451. [Google Scholar] [CrossRef] [Green Version]
- Wang, H.; Liu, G.H.; Li, Z.S.; Wang, P.T.; Wang, Z.Z. Assessing the Driving Forces in Vegetation Dynamics Using Net Primary Productivity as the Indicator: A Case Study in Jinghe River Basin in the Loess Plateau. Forests 2018, 9, 374. [Google Scholar] [CrossRef] [Green Version]
- Hicke, J.A.; Asner, G.P.; Randerson, J.T.; Tucker, C.; Los, S.; Birdsey, R.; Jenkins, J.C.; Field, C. Trends in North American net primary productivity derived from satellite observations, 1982–1998. Glob. Biogeochem. Cycles 2002, 16, 1–14. [Google Scholar] [CrossRef]
- Fan, X.; Hao, X.M.; Hao, H.C.; Zhang, J.J.; Li, Y.H. Comprehensive Assessment Indicator of Ecosystem Resilience in Central Asia. Water 2021, 13, 124. [Google Scholar] [CrossRef]
- Wang, J.; Guo, L.; Bai, Z.; Yang, R.; Zhang, M. Succession law of reclaimed soil and vegetation on opencast coal mine dump of loess area. Trans. Chin. Soc. Agric. Eng. 2013, 29, 223–232. [Google Scholar]
- Zhou, Y.; Luo, M.; Zhou, X.; Huang, Y.; Zhang, S. Making method of tracking monitoring scheme for abandoned industrial and mining land reclamation and its empirical research. Trans. Chin. Soc. Agric. Eng. 2017, 33, 240–248. [Google Scholar]
- Akala, V.A.; Lal, R. Soil organic carbon pools and sequestration rates in reclaimed minesoils in Ohio. J. Environ. Qual. 2001, 30, 2098–2104. [Google Scholar] [CrossRef]
- Dutta, R.K.; Agrawal, M. Restoration of opencast coal mine spoil by planting exotic tree species: A case study in dry tropical region. Ecol. Eng. 2003, 21, 143–151. [Google Scholar] [CrossRef]
- Xu, Z.; Hou, H.; Zhang, S.; Ding, Z.; Ma, C.; Gong, Y.; Liu, Y. Effects of mining activity and climatic change on ecological losses in coal mining areas. Trans. Chin. Soc. Agric. Eng. 2012, 28, 232–240. [Google Scholar]
- Guowei, W.; Yanling, Z.; Yanhua, F.; Wei, N.; Yan, Z.; Jianxin, Y. Impact of reclamation-driven land use change on vegetation carbon store in mining areas. Chin. J. Eco-Agric. 2015, 23, 1437–1444. [Google Scholar]
- Chen, G.; Li, X.; Jiao, L.; Wang, J.; Gu, K. Spatial-temporal Variation of Vegetation Net Primary Productivity in Huainan Coal Mine Area from 2000 to 2012. Ecol. Environ. Sci. 2017, 26, 196–203. [Google Scholar]
- Ahirwal, J.; Maiti, S.K. Assessment of carbon sequestration potential of revegetated coal mine overburden dumps: A chronosequence study from dry tropical climate. J. Environ. Manag. 2017, 201, 369–377. [Google Scholar] [CrossRef] [PubMed]
- Liu, W.Q.; Chen, G.Z. Evolution of Ecosystem Service Value and Ecological Storage Estimation in Huainan Coal Mining Area. Bull. Environ. Contam. Toxicol. 2021, 107, 1243–1249. [Google Scholar]
- Cao, D.Y.; Huang, C.L.; Wu, J.; Li, H.T.; Zhang, Y.D. Environment Carrying Capacity Evaluation of Coal Mining in Shanxi Province. In Proceedings of the 1st International Conference on Energy and Environmental Protection (ICEEP 2012), Hohhot, China, 23–24 June 2012; p. 1141. [Google Scholar]
- Jiang, H.; Fan, G.; Zhang, D.; Zhang, S.; Fan, Y. Evaluation of eco-environmental quality for the coal-mining region using multi-source data. Sci. Rep. 2022, 12, 6623. [Google Scholar] [CrossRef] [PubMed]
- Hou, H.; Zhang, S.; Ding, Z.; Gong, Y.; Ma, C. Study on the measurement of ecological loss based on the net primary productivity in coal mines. J. China Coal Soc. 2012, 37, 445–451. [Google Scholar]
- Xu, W.X.; Wang, J.M.; Zhang, M.; Li, S.J. Construction of landscape ecological network based on landscape ecological risk assessment in a large-scale opencast coal mine area. J. Clean. Prod. 2021, 286, 125523. [Google Scholar] [CrossRef]
- Yuan, Y.; Ren, Y.X.; Gao, G.Q.; Zhao, Z.Q.; Niu, S.Y. Intra- and Interspecific Interactions among Pioneer Trees Affect Forest-Biomass Carbon Accumulation in a Nutrient-Deficient Reclaimed Coal Mine Spoil. Forests 2020, 11, 819. [Google Scholar] [CrossRef]
- Yang, B.Y.; Bai, Z.K.; Cao, Y.G.; Xie, F.; Zhang, J.J.; Wang, Y.N. Dynamic Changes in Carbon Sequestration from Opencast Mining Activities and Land Reclamation in China’s Loess Plateau. Sustainability 2019, 11, 1473. [Google Scholar] [CrossRef] [Green Version]
- Huang, Y.; Tian, F.; Wang, Y.J.; Wang, M.; Hu, Z.L. Effect of coal mining on vegetation disturbance and associated carbon loss. Environ. Earth Sci. 2015, 73, 2329–2342. [Google Scholar] [CrossRef]
- Yu, D.Y.; Shi, P.J.; Shao, H.B.; Zhu, W.Q.; Pan, Y.H. Modelling net primary productivity of terrestrial ecosystems in East Asia based on an improved CASA ecosystem model. Int. J. Remote Sens. 2009, 30, 4851–4866. [Google Scholar] [CrossRef]
- Potter, C.S.; Randerson, J.T.; Field, C.B.; Matson, P.A.; Vitousek, P.M.; Mooney, H.A.; Klooster, S.A. Terrestrial Ecosystem Production—A Process Model-Based on Global Satellite and Surface Data. Glob. Biogeochem. Cycles 1993, 7, 811–841. [Google Scholar] [CrossRef]
- McGuire, A.D.; Melillo, J.M.; Kicklighter, D.W.; Joyce, L.A. Equilibrium responses of soil carbon to climate change: Empirical and process-based estimates. J. Biogeogr. 1995, 22, 785–796. [Google Scholar] [CrossRef]
- Rahman, A.F.; Gamon, J.A. Detecting biophysical properties of a semi-arid grassland and distinguishing burned from unburned areas with hyperspectral reflectance. J. Arid. Environ. 2004, 58, 597–610. [Google Scholar] [CrossRef]
- Zhu, W.Q.; Pan, Y.Z.; He, H.; Yu, D.Y.; Hu, H.B. Simulation of maximum light use efficiency for some typical vegetation types in China. Chin. Sci. Bull. 2006, 51, 457–463. [Google Scholar] [CrossRef]
- Zhang, Y.; Qi, W.; Zhou, C.; Ding, M.; Liu, L.; Gao, J.; Bai, W.; Wang, Z.; Zheng, D. Spatial and temporal variability in the net primary production (NPP) of alpine grassland on Tibetan Plateau from 1982 to 2009. Acta Geogr. Sin. 2013, 68, 1197–1211. [Google Scholar]
- Li, J.; Yang, Y.; Zhang, H.; Huang, L.; Gao, Y. Spatio-temporal variations of net primary productivity and its natural and human factors analysis in Qinling-Daba Mountains in the past 15 years. Acta Ecol. Sin. 2019, 39, 8504–8515. [Google Scholar]
- Liu, L.; Guan, Y.J.; Mu, C.; Han, W.Q.; Qiao, X.L.; Zheng, J.H. Spatio-temporal characteristics of vegetation net primary productivity in the Ili River Basin from 2008 to 2018. Acta Ecol. Sin. 2022, 42, 1566. [Google Scholar]
- Zhao, M.S.; Heinsch, F.A.; Nemani, R.R.; Running, S.W. Improvements of the MODIS terrestrial gross and net primary production global data set. Remote Sens. Environ. 2005, 95, 164–176. [Google Scholar] [CrossRef]
- Jiang, R.; Li, X.; Zhu, Y.; Zhang, Z. Spatial-temporal variation of NPP and NDVI correlation in wetland of Yellow River Delta based on MODIS data. Acta Ecol. Sin. 2011, 31, 6708–6716. [Google Scholar]
- Zhou, X.; Zhu, W.; Ma, G.; Zhang, D.; Zhen, Z. Assessing the Vegetation Net Primary Productivity Loss Resulted from the Mining of Rare Earth Ore based on Remote Sensing Technology. A Case Study in Ganzhou, Jiangxi Province. Remote Sens. Technol. Appl. 2016, 31, 307–315. [Google Scholar]
- Zhang, Z.; Bai, Z.; He, Z.; Bao, N. Dynamic changes of land use type and carbon sinks based RS and GIS in Pingshuo opencast coal mine. Trans. Chin. Soc. Agric. Eng. 2012, 28, 230–236. [Google Scholar]
- Cao, Y.; Bai, Z.; Zhang, G.; Zhou, W.; Wang, J.; Yu, Q.; Du, Z. Soil Quality of Surface Reclaimed Farmland in Large Open-cast Mining Area of Shanxi Province. J. Agro-Environ. Sci. 2013, 32, 2422–2428. [Google Scholar]
- An, Y.; Bian, Z.; Dai, W.; Dong, J. Analysis on the gas carbon source and carbon sink in coal mining: A case study of Jiawang, Xuzhou. J. China Univ. Min. Technol. 2017, 46, 415–422. [Google Scholar]
- Mylliemngap, W.; Barik, S.K. Plant diversity, net primary productivity and soil nutrient contents of a humid subtropical grassland remained low even after 50 years of post-disturbance recovery from coal mining. Environ. Monit. Assess. 2019, 191, 697. [Google Scholar] [CrossRef]
- Yang, F.; Wang, J.Y.; Zhang, C.Y.; Li, J.; Xie, H.Z.; Zhuoge, Z.R. The Impact of Human Activities on Net Primary Productivity in a Grassland Open-Pit Mine: The Case Study of the Shengli Mining Area in Inner Mongolia, China. Land 2022, 11, 743. [Google Scholar] [CrossRef]
- Guo, W.B.; Yu, X.Y.; Wei, J.F.; Tong, J.B.; Tian, X.J. Integrating operation study on mining and reclamation in Hulun Buir Grassland open-pit mine area. Coal Eng. 2014, 46, 143–145. [Google Scholar]
- Sun, Q.; Bai, Z.; Cao, Y.; Xie, M.; Hu, X.; Jiang, Y.; Lu, Y. Ecological risk assessment of land destruction in large open-pit mine. Trans. Chin. Soc. Agric. Eng. 2015, 31, 278–288. [Google Scholar]
- Hou, H.P.; Zhang, S.L.; Ding, Z.Y.; Huang, A.P.; Tian, Y.F. Spatiotemporal dynamics of carbon storage in terrestrial ecosystem vegetation in the Xuzhou coal mining area, China. Environ. Earth Sci. 2015, 74, 1657–1669. [Google Scholar] [CrossRef]
- Xing, Z.G.; Peng, S.P.; Du, W.F.; He, Y.L.; Chong, S.; Feng, F.S.; Yu, P.; She, C.C.; Xu, D.J. Hydrogeological changes caused by opencast coal mining in steppe zone: A case study of Shengli 1 open-pit coal mine. Desalination Water Treat. 2018, 121, 126–133. [Google Scholar] [CrossRef]
- Ting, L. Dynamic monitoring and analysis of ecological environment in open-pit mining area of Pingshuo coal mine. China Acad. J. Electron. Publ. House 2013. [Google Scholar]
- Cao, Y.G.; Bai, Z.K.; Zhou, W.; Zhang, X.R. Characteristic analysis and pattern evolution on landscape types in typical compound area of mine agriculture urban in Shanxi Province, China. Environ. Earth Sci. 2016, 75, 585. [Google Scholar] [CrossRef]
- Cao, Y.G.; Bai, Z.K.; Zhou, W.; Zhang, X.R. Analyses of traits and driving forces on urban land expansion in a typical coal-resource-based city in a loess area. Environ. Earth Sci. 2016, 75, 1191. [Google Scholar] [CrossRef]
- Hu, Z.; Long, J.; Wang, X. Self-healing, natural restoration and artificial restoration of ecological environment for coal mining. J. China Coal Soc. 2014, 39, 1751–1757. [Google Scholar]
- Prakash, A.; Gupta, R.P. Land-use mapping and change detection in a coal mining area—A case study in the Jharia coalfield, India. Int. J. Remote Sens. 1998, 19, 391–410. [Google Scholar] [CrossRef]
- Post, W.M.; Kwon, K.C. Soil carbon sequestration and land-use change: Processes and potential. Glob. Change Biol. 2000, 6, 317–327. [Google Scholar] [CrossRef] [Green Version]
- Yuan, Y.; Zhao, Z.Q.; Bai, Z.K.; Wang, H.Q.; Wang, Y.Z.; Niu, S.Y. Reclamation patterns vary carbon sequestration by trees and soils in an opencast coal mine, China. CATENA 2016, 147, 404–410. [Google Scholar] [CrossRef]
- Liu, C.; Liang, Y.; Zhao, Y.J.; Liu, S.S.; Huang, C.B. Simulation and Analysis of the Effects of Land Use and Climate Change on Carbon Dynamics in the Wuhan City Circle Area. Int. J. Environ. Res. Public Health 2021, 18, 11617. [Google Scholar] [CrossRef]
- Zhang, Y.; Zhou, W. Remote estimation of vegetation fraction for reclaimed areas of Antaibao opencast mine. J. Cent. South Univ. For. Technol. 2016, 36, 113–119. [Google Scholar]
- Wang, S.; Cao, Y.; Bai, Z.; Luo, G.; Kuang, X.; Yang, G. Spatial Characteristics of Reconstructed Soil Texture in Dumping Site of Loess Open-pit Mining Area. J. Northwest For. Univ. 2020, 35, 40–51. [Google Scholar]
- Karu, H.; Szava-Kovats, R.; Pensa, M.; Kull, O. Carbon sequestration in a chronosequence of Scots pine stands in a reclaimed opencast oil shale mine (vol 39, pg 1507, 2009). Can. J. For. Res. 2010, 40, 595. [Google Scholar] [CrossRef]
- Shrestha, R.K.; Lal, R. Carbon and nitrogen pools in reclaimed land under forest and pasture ecosystems in Ohio, USA. Geoderma 2010, 157, 196–205. [Google Scholar] [CrossRef]
- Yuan, Y.; Zhao, Z.Q.; Niu, S.Y.; Li, X.Z.; Wang, Y.Y.; Bai, Z.K. Reclamation promotes the succession of the soil and vegetation in opencast coal mine: A case study from Robinia pseudoacacia reclaimed forests, Pingshuo mine, China. CATENA 2018, 165, 72–79. [Google Scholar] [CrossRef]
Publisher’s Note: MDPI stays neutral with regard to jurisdictional claims in published maps and institutional affiliations. |
© 2022 by the authors. Licensee MDPI, Basel, Switzerland. This article is an open access article distributed under the terms and conditions of the Creative Commons Attribution (CC BY) license (https://creativecommons.org/licenses/by/4.0/).