Article

Frontier of Rural Revitalization in China: A Spatial Analysis of National Rural Tourist Towns

1
College of Art and Design, Nanjing Forestry University, No. 159 Longpan Road, Nanjing 210037, China
2
Faculty of Architecture and Urban Planning, University of Mons, Rue d’ Havre, 88, 7000 Mons, Belgium
*
Author to whom correspondence should be addressed.
Land 2022, 11(6), 812; https://doi.org/10.3390/land11060812
Submission received: 27 April 2022 / Revised: 27 May 2022 / Accepted: 27 May 2022 / Published: 30 May 2022

Abstract

:
As the national economic situation improves, concerns about rural issues in China, a large agricultural country, are gradually increasing. Hence, rural tourism has been thrust into the limelight. This research is based on the National Rural Tourist Towns of China (NRTTC). It aims to analyze the spatial structure, influencing factors and their relevance to rural tourism development. Initially, this research examines the spatial distribution pattern in terms of kernel density. Subsequently, the imbalance index and Lorenz curve are used to distinguish the differences in spatial distribution. The Gini coefficient is used to explore the clustered regional distribution. The results indicate the following: (1) the number of NRTTC in each province is relatively even; and (2) the spatial distribution is highly uneven. The degree of aggregation is bounded by the Hu Huanyong boundary, with more in the southeast and less in the northwest. The capital circle is the core density area. Additionally, those NRTTC in the eastern and southeastern regions have a large distribution density and a more comprehensive radiation range. This study additionally analyzed the factors influencing the spatial distribution characteristics of NRTTC, and found four crucial aspects, namely, the national development strategy, the social environment, the geographical environment, and historical development. This research can provide a reference for the construction of rural tourist towns in different countries and regions.

1. Introduction

As China is an agricultural country, agriculture is one of the three pillars of the country’s national economy [1]. At the beginning of the establishment of the People’s Republic of China (PRC), China put forward the goal of shared prosperity as a socialist country, growing rich first before attempting to make up for the imbalance between rural and urban development [2,3]. Subsequently, rural economic development has received the attention of the community. From the perspective of geography, rural areas account for 92.38% of China’s territory [4]. From the perspective of administration, there are 662,238 town-level administrative units in China [5]. As of 2020, data from China’s National Bureau of Statistics show that China has 509.92 million permanent rural town residents, accounting for 36.1% of the country’s total population [6,7]. This means that 6.4% of the global population lives in rural China. It is important to focus on developing China’s rural areas for both the Chinese people and for global civilization as a whole [8].
In 2017, the 18th National Congress of the Communist Party of China (CCP) proposed implementing a rural revitalization strategy [9], putting forward the general requirements of prosperous industry, livable ecological villages, civilized governance, and an influential and affluent life for residents with a commitment to consolidating and enhancing the achievements of new rural construction [10]. In 2021, the CCP Central Committee released the Opinions of the CCP Central Committee and the State Council on Comprehensively Promoting Rural Revitalization and Accelerating agricultural and Rural Modernization in order to implement vigorous construction activity in rural areas [11,12]. After implementing the rural revitalization strategy, rural construction practices led by local governments have emerged [13].
Tourism is an inclusive industry. It has a strong ability to integrate primary, secondary, and tertiary industries [14,15]. Tourism and the primary industries can link together to create rural tourism, and integration with the secondary industries creates industrial tourism. Integration with cultural industries produces cultural tourism [16]. This is the ideal channel that can help towns develop new economic formats according to local conditions and protect their original industries to a large extent. Through these tourist towns’ example and driving role, more towns can understand the same benefits and adopt a similar model, investing more into rural construction.
In 2021, the Italian government put forward the National Rural Revitalization Plan (Piano Nazionale Borghi), divided into two lines of intervention, in order to achieve rural revitalization. The first is the cultural, social, and economic revitalization of villages by implementing new functional spaces, new infrastructure, and new services in 21 pilot villages abandoned or at risk of being abandoned. The second is to combine cultural heritage protection with social and economic revitalization in order to develop rural tourism to improve the employment environment and alleviate the trend of reduced population in villages [17]. In 2020, Maroto-Martos et al. studied strategic plans based on the Liaison entre Actions de Développement de l’Économique Rurale (LEADER) approach for rural areas in Spain and Germany. They believed that information and communication technologies should promote the restoration, protection, management, and promotion of natural and cultural heritage in the most difficult rural areas, rather than solely improving the quality of accommodation and residents’ income [18]. As China is a developing country, with the promulgation of the rural revitalization policy, the enhancement of the national economy, and the emergence of the phenomenon of reverse urbanization, the attention paid to rural tourism has increased sharply year over year [19,20,21]. Throughout Chinese history, many ancient ethnic groups in different natural environments and with different cultural features have gradually converged into an increasingly integrated Chinese ethnic community thanks to a long period of communication, differentiation, and re-integration [22,23]. China has a vast territory with many ethnic minorities, rich regional characteristics, rural architectural styles, and historical traditions [24]. Different towns have different individual development potential, and there is no comprehensive guidance model for determining and constructing specific recommendations. As a result, the local governments may develop blindly, even creating an unnecessary waste of workforce and resources on construction [25]. Therefore, it is essential to study rural tourist towns. After setting standards for similar villages, local governments can avoid unnecessary waste of resources via trial and error, and the development of towns can be better guided.
On 2 August 2021, the Ministry of Culture and Tourism of the PRC (MCTC) announced the first batch of NRTTC [26]. This list plays an exemplary role in setting specific norms for rural tourism in order that the benefits can be gradually formed, improving residents’ rural environment and living standards. This can drive the development of rural tourism to promote the economic benefits of rural areas, allowing more residents and towns to understand the benefits of rural construction, improving residents’ recognition of the benefits and thus forming a positive cycle [27]. The development of rural tourism is a crucial step in rural revitalization, and is a positive response to the overall strategy of rural renewal in China [28].
Social organizations and institutions have published similar lists before; however, the NRTTC is the first resource related to the national rural tourist towns that the Chinese central government has posted, proving that rural tourism is a significant method of rural revitalization [29,30,31]. For a centralized country such as China, this directory is the most authoritative document to guide rural tourism development [32]. In terms of theoretical research, several studies at the rural administrative level have explored rural tourist villages. From the international perspective, scholars are now paying more attention to the supply motivation, the supply and demand contradiction in rural tourism, innovations in rural tourism operation modes, and the consumption model of rural tourism [33,34,35,36]. Research on rural tourism has gradually diversified under the many Chinese domestic rural revitalization policies involving rural tourism development modes, coordination between rural tourism and rural revitalization, tourism development, and construction of countryside settlements [37,38,39]. In terms of empirical development, many tourist villages and towns are conscious of protecting the natural ecology in order to develop their own unique culture. Local governments have achieved breakthroughs in the development of rural tourism, the use of rural human resources and natural resources, farming activities within the local cultural tradition of agricultural civilization, and leisure tourism. However, a gap remains in the research in the lack of practical examples of the spatial structure and geographical distribution of rural tourism, as there are a variety of town styles in China. A single template cannot be applied to the whole country. Therefore, analyzing these villages from the perspective of macroscopic spatial structural characteristics can help us to better understand China’s rural tourism resources and provide an important basis for sustainable development of the rural environment. This study can provide a reference for rural areas in China that are facing difficulties in tourism development and revitalization as well as for countries with similar political, social environmental, geographical, and historical conditions, such as China’s neighboring countries. An in-depth analysis of the reasons for these towns being on the list and the influencing factors may provide a reference and a goal for other villages that have rural tourism resources to work towards. Under the influence of the COVID-19 pandemic, different epidemic prevention policies have curbed long distance travel across provinces and territories, thereby promoting rural tourism [40,41].

2. Data Sources and Research Method

2.1. Data Sources

This research used the list provided by the NRTTC as its research object. ArcGIS 10.2 was used to analyze social and economic data from the official Chinese Government work reports and statistical yearbooks, last updated at the end of 2021.
The NRTTC is a list issued by the MCTC. The MCTC and the National Development and Reform Commission jointly selected the first batch of towns. In China, the government selects towns with a high level of resource development and product construction and which can provide a typical example and play a leading role in line with the cultural and tourism development direction in which NRTTC ought to be established. This database began to collect data in 2019, and the first batch was published in 2021, with the working period lasting for three years. This list is considered to be the most authoritative and representative list of rural tourist towns in China. The final version of this list selected 100 towns covering 22 provinces, five autonomous regions, and four municipalities.
This research used the location of each town’s official administrative institutes (including the town government, street offices, community management committees, and governing bodies) as the coordinate origin. We used these points to form a coordinate database and selected their coordinates (X, Y) in the Google Maps coordinate picking system. The raw spatial coordinates of the NRTTC were calibrated with the Google Maps Coordinate picker, then the data were imported into ArcGIS. The coordinates were registered and projected in ArcGIS (Figure 1) and then displayed in the form of point feature visualizations on a map of China obtained from the Map Technology Review Center of the Ministry of Natural Resources of China.

2.2. Research Method

2.2.1. Kernel Density Estimation

This research used kernel density estimation to identify the spatial aggregation areas of the NRTTC in China. Different kernel density calculation methods can be established on the basis of other spatial distance concepts [42]. It is one of the nonparametric tests used to estimate unknown density functions in probability theory. This method evaluated the degree of spatial aggregation of NRTTC at the administrative region level. The formula is
f n x = 1 n h i = 1 n k x X i h
where f n represents the kernel density estimation value of NRTTC, n represents the number of towns, x X i represents the distance between the estimated points x and X i , h represents the search radius, and k represents the kernel function.

2.2.2. Imbalance Index

This research used the imbalance index method to calculate the distribution equilibrium of the NRTTC. The discrepancy in the spatial distribution of NRTTC presented differences in the densities of different regional rural tourist towns [43]. The imbalance index, S, was used to reflect the balanced distribution of NRTTC at the administrative region level. The formula is
S = i = 1 n Y i 50 n + 1 100 n 50 n + 1
where S represents the imbalance index, n represents the number of administrative regions (n = 34), and Y i  represents the cumulative percentage of the i th region within all tourist towns. If the value of S is 0, the tourist towns are evenly distributed in each zone. When the S value is 1, the tourist towns are concentrated in a significant area. The closer the S value is to 1, the more uneven the distribution of tourist towns is.

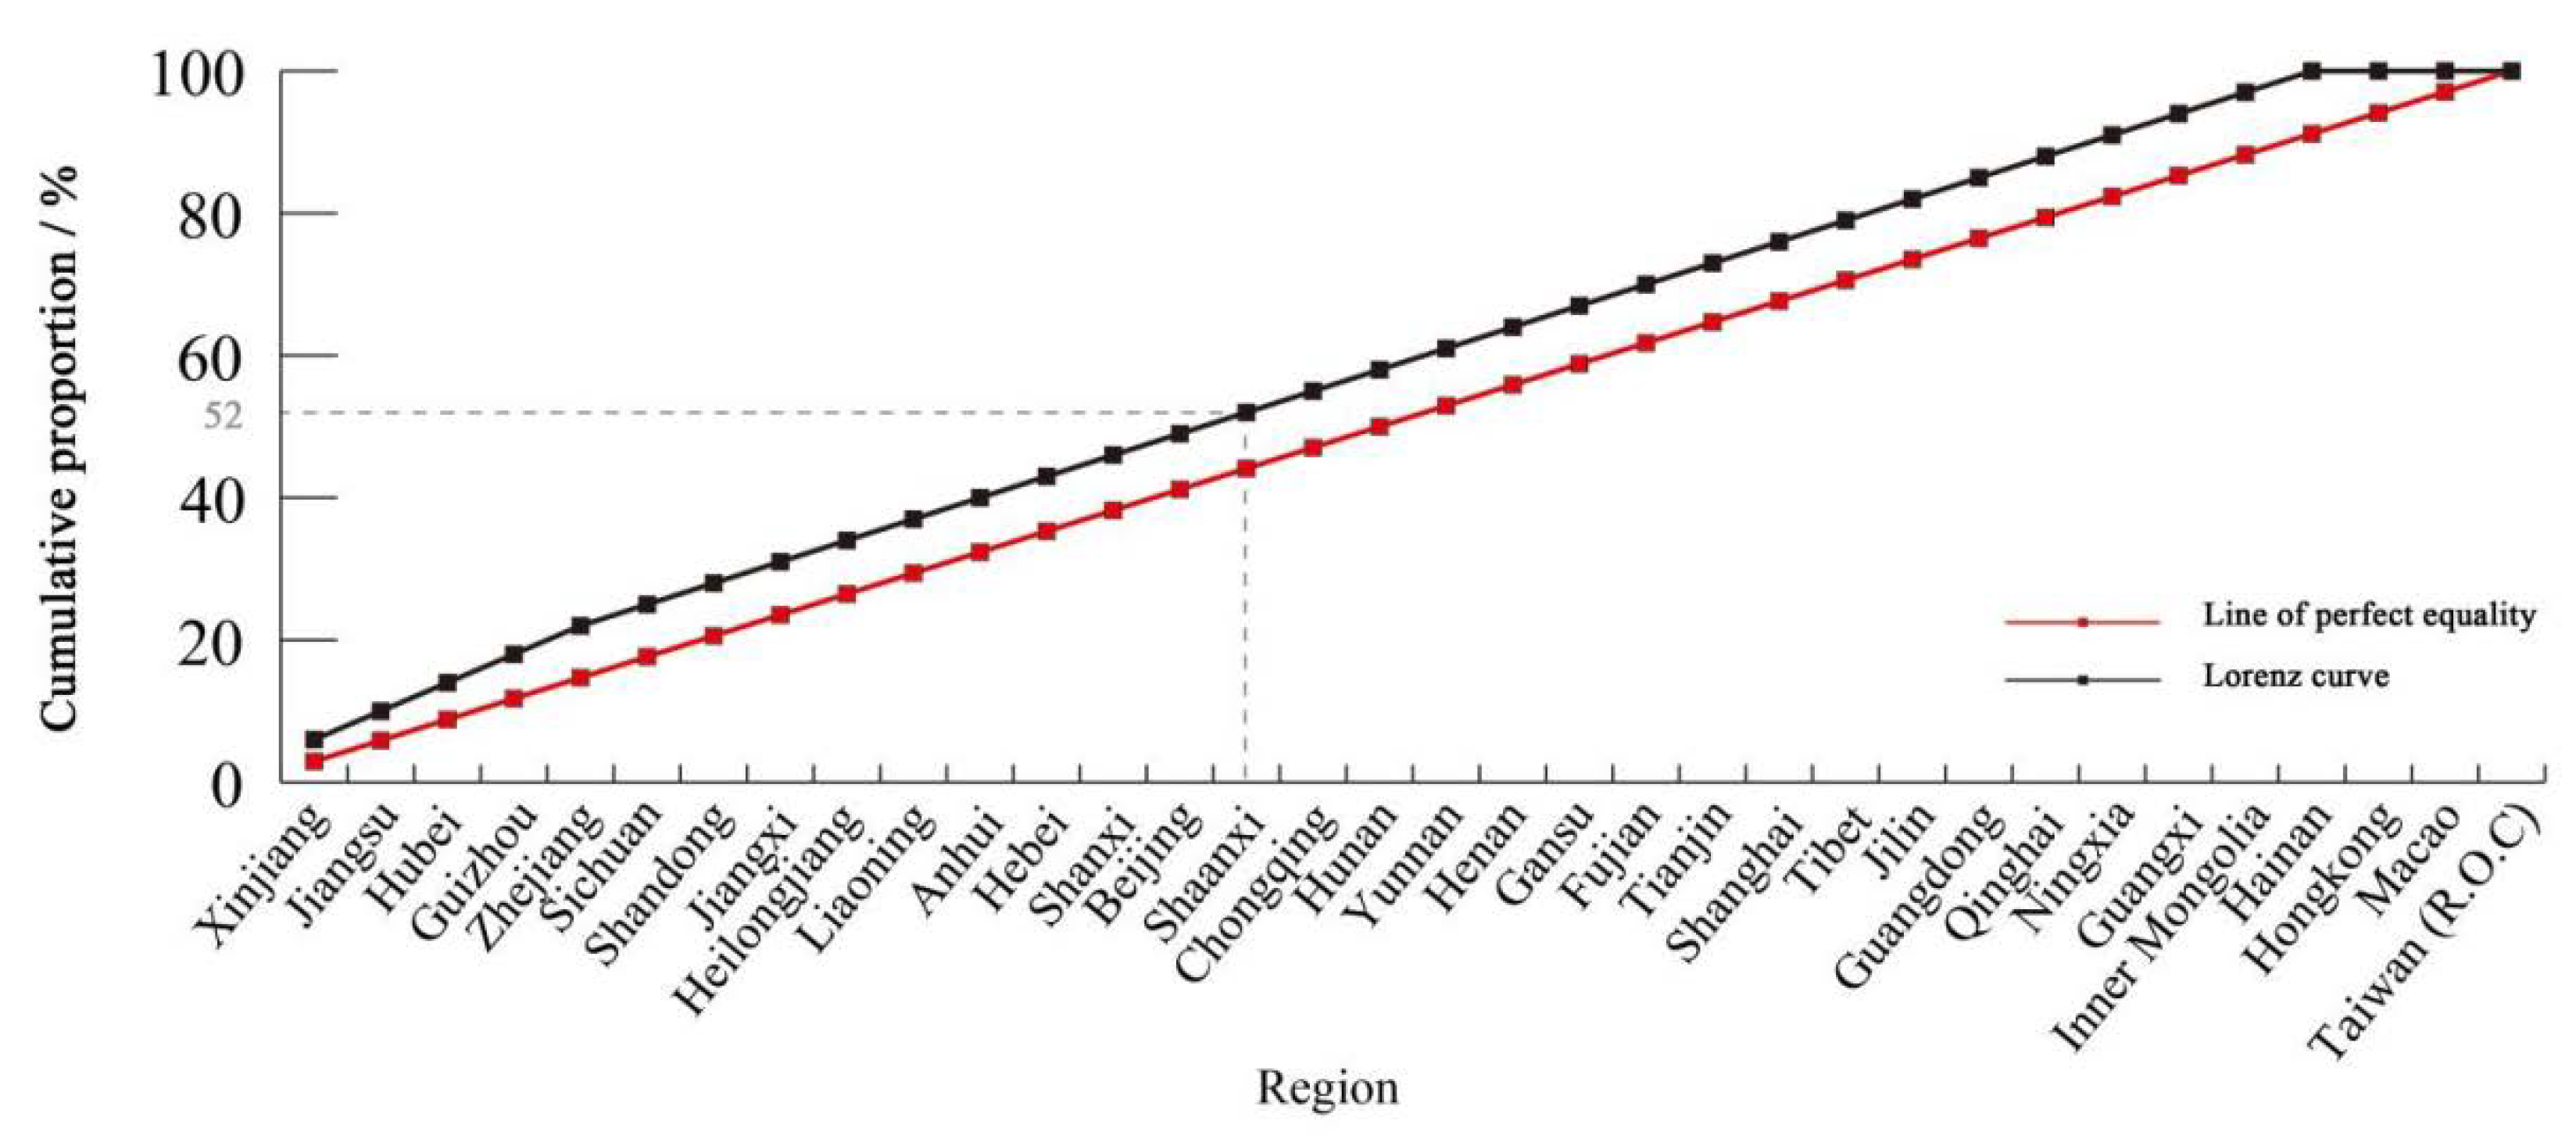
2.2.3. Gini Coefficient

This research used the Gini coefficient to describe the distribution of spatial elements in discrete divisions in the spatial structure analysis, determining the geographical division level of the spatial distribution of the locations of the NRTTC [44]. This is an index derived from the Lorenz curve. The formula is
G = i = 1 n P i ln P i ln N
C = 1 G
where G is the Gini coefficient, N represents the number of tourist towns, P i represents the proportion of the number of NRTTC in the i th geographical division, and C refers to the monotonous distribution of the Gini coefficient. The value of the Gini coefficient is between 0 and 1. The closer the result is to 0, the lower the concentration.

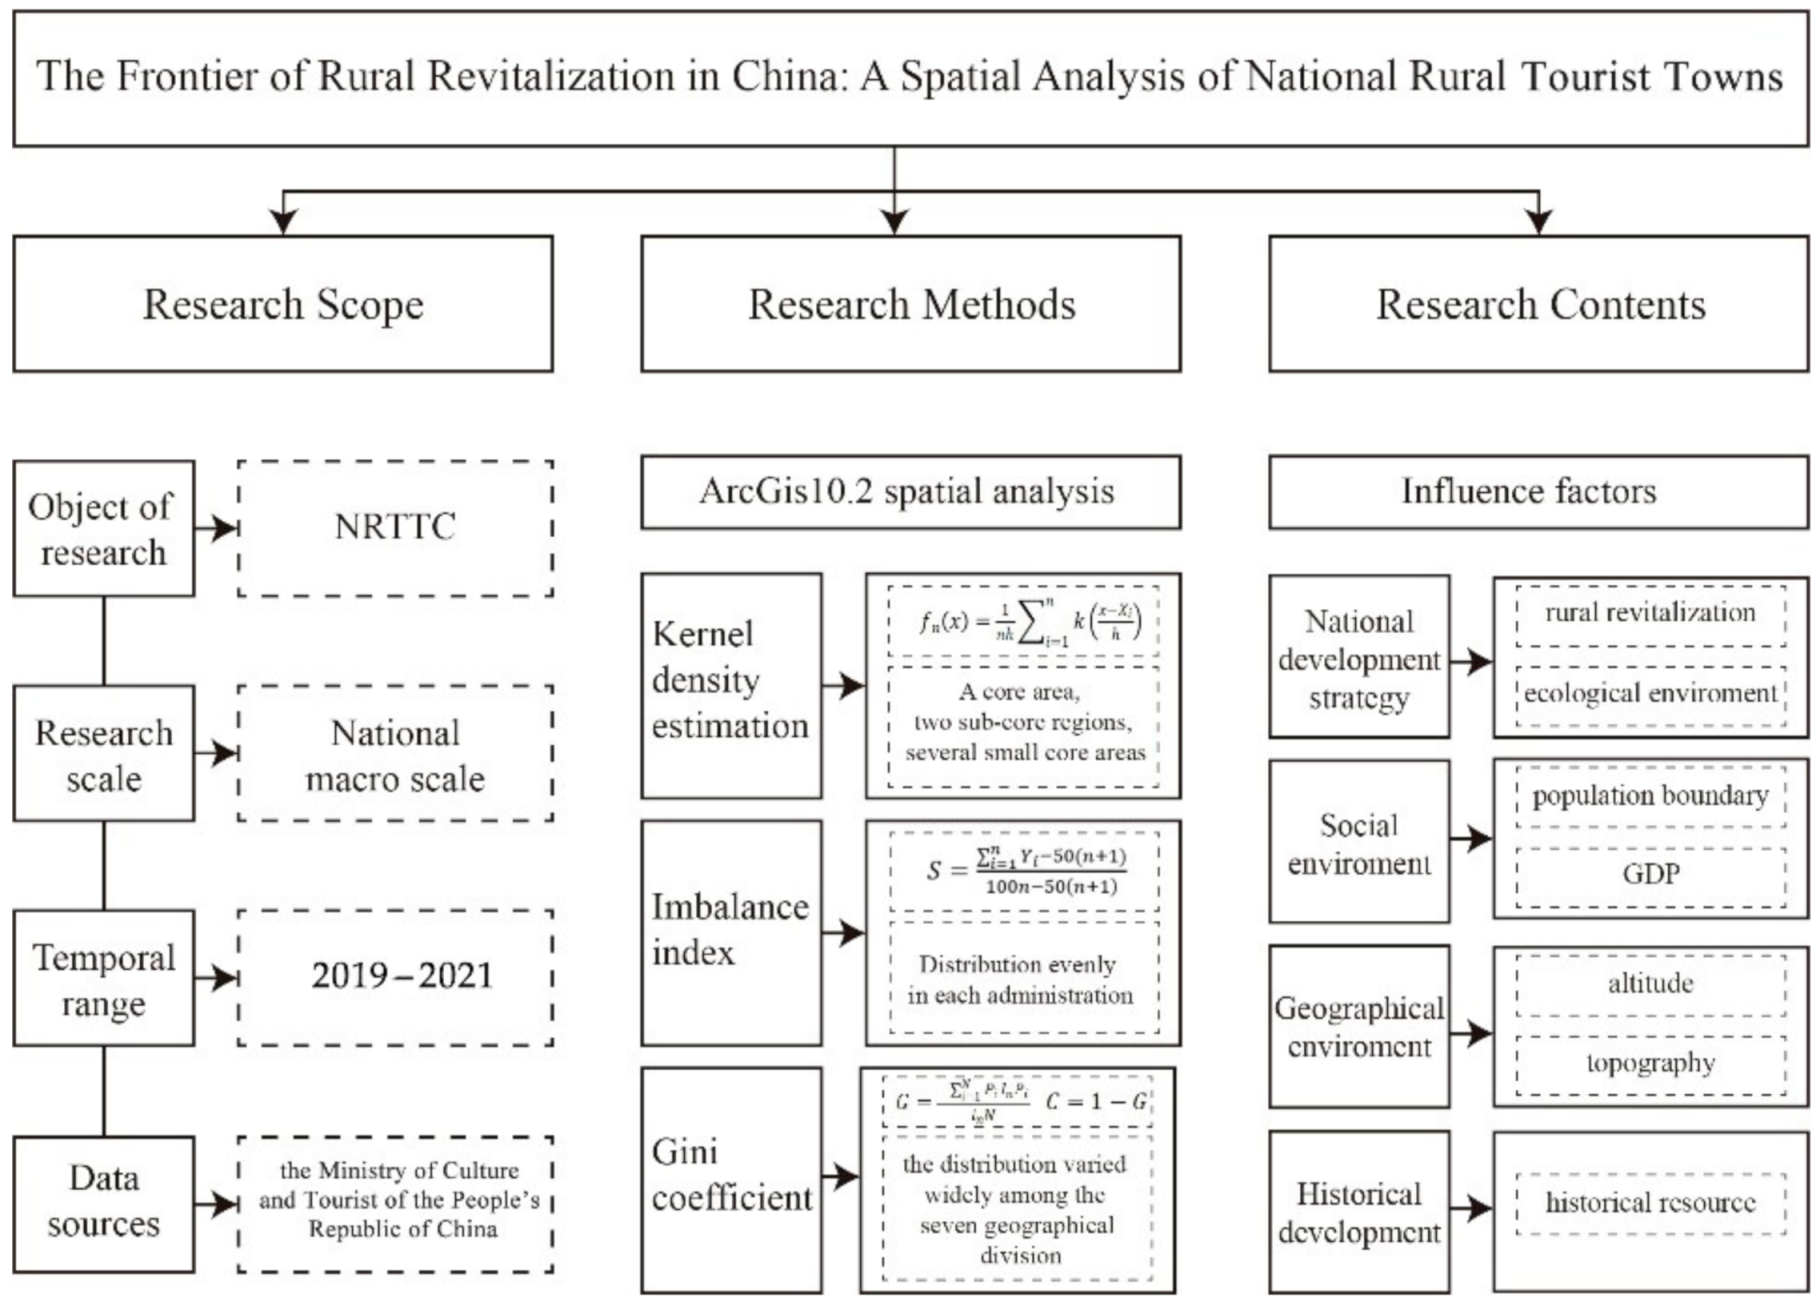
2.3. Research Design

The research on the spatial distribution characteristics and influencing factors of NRTTC, as a whole, follows the path of establishing the research framework, problem formulation, problem analysis, problem-solving, and summarizing the research [45].
  • The research framework and problem-solving parts were based on a review of the relevant data. The need for this research and its significance are proposed against the research background through a literature review.
  • The problem-solving section represents the main body of this research, and was based on the four aspects (policy, social, geographical, historical levels) of the spatial distribution characteristics of NRTTC and the influencing factors. The summary presents the results of the research based on the conclusions, as well as any shortcomings.

3. Analysis of the Spatial Structure Characteristics of NRTTC

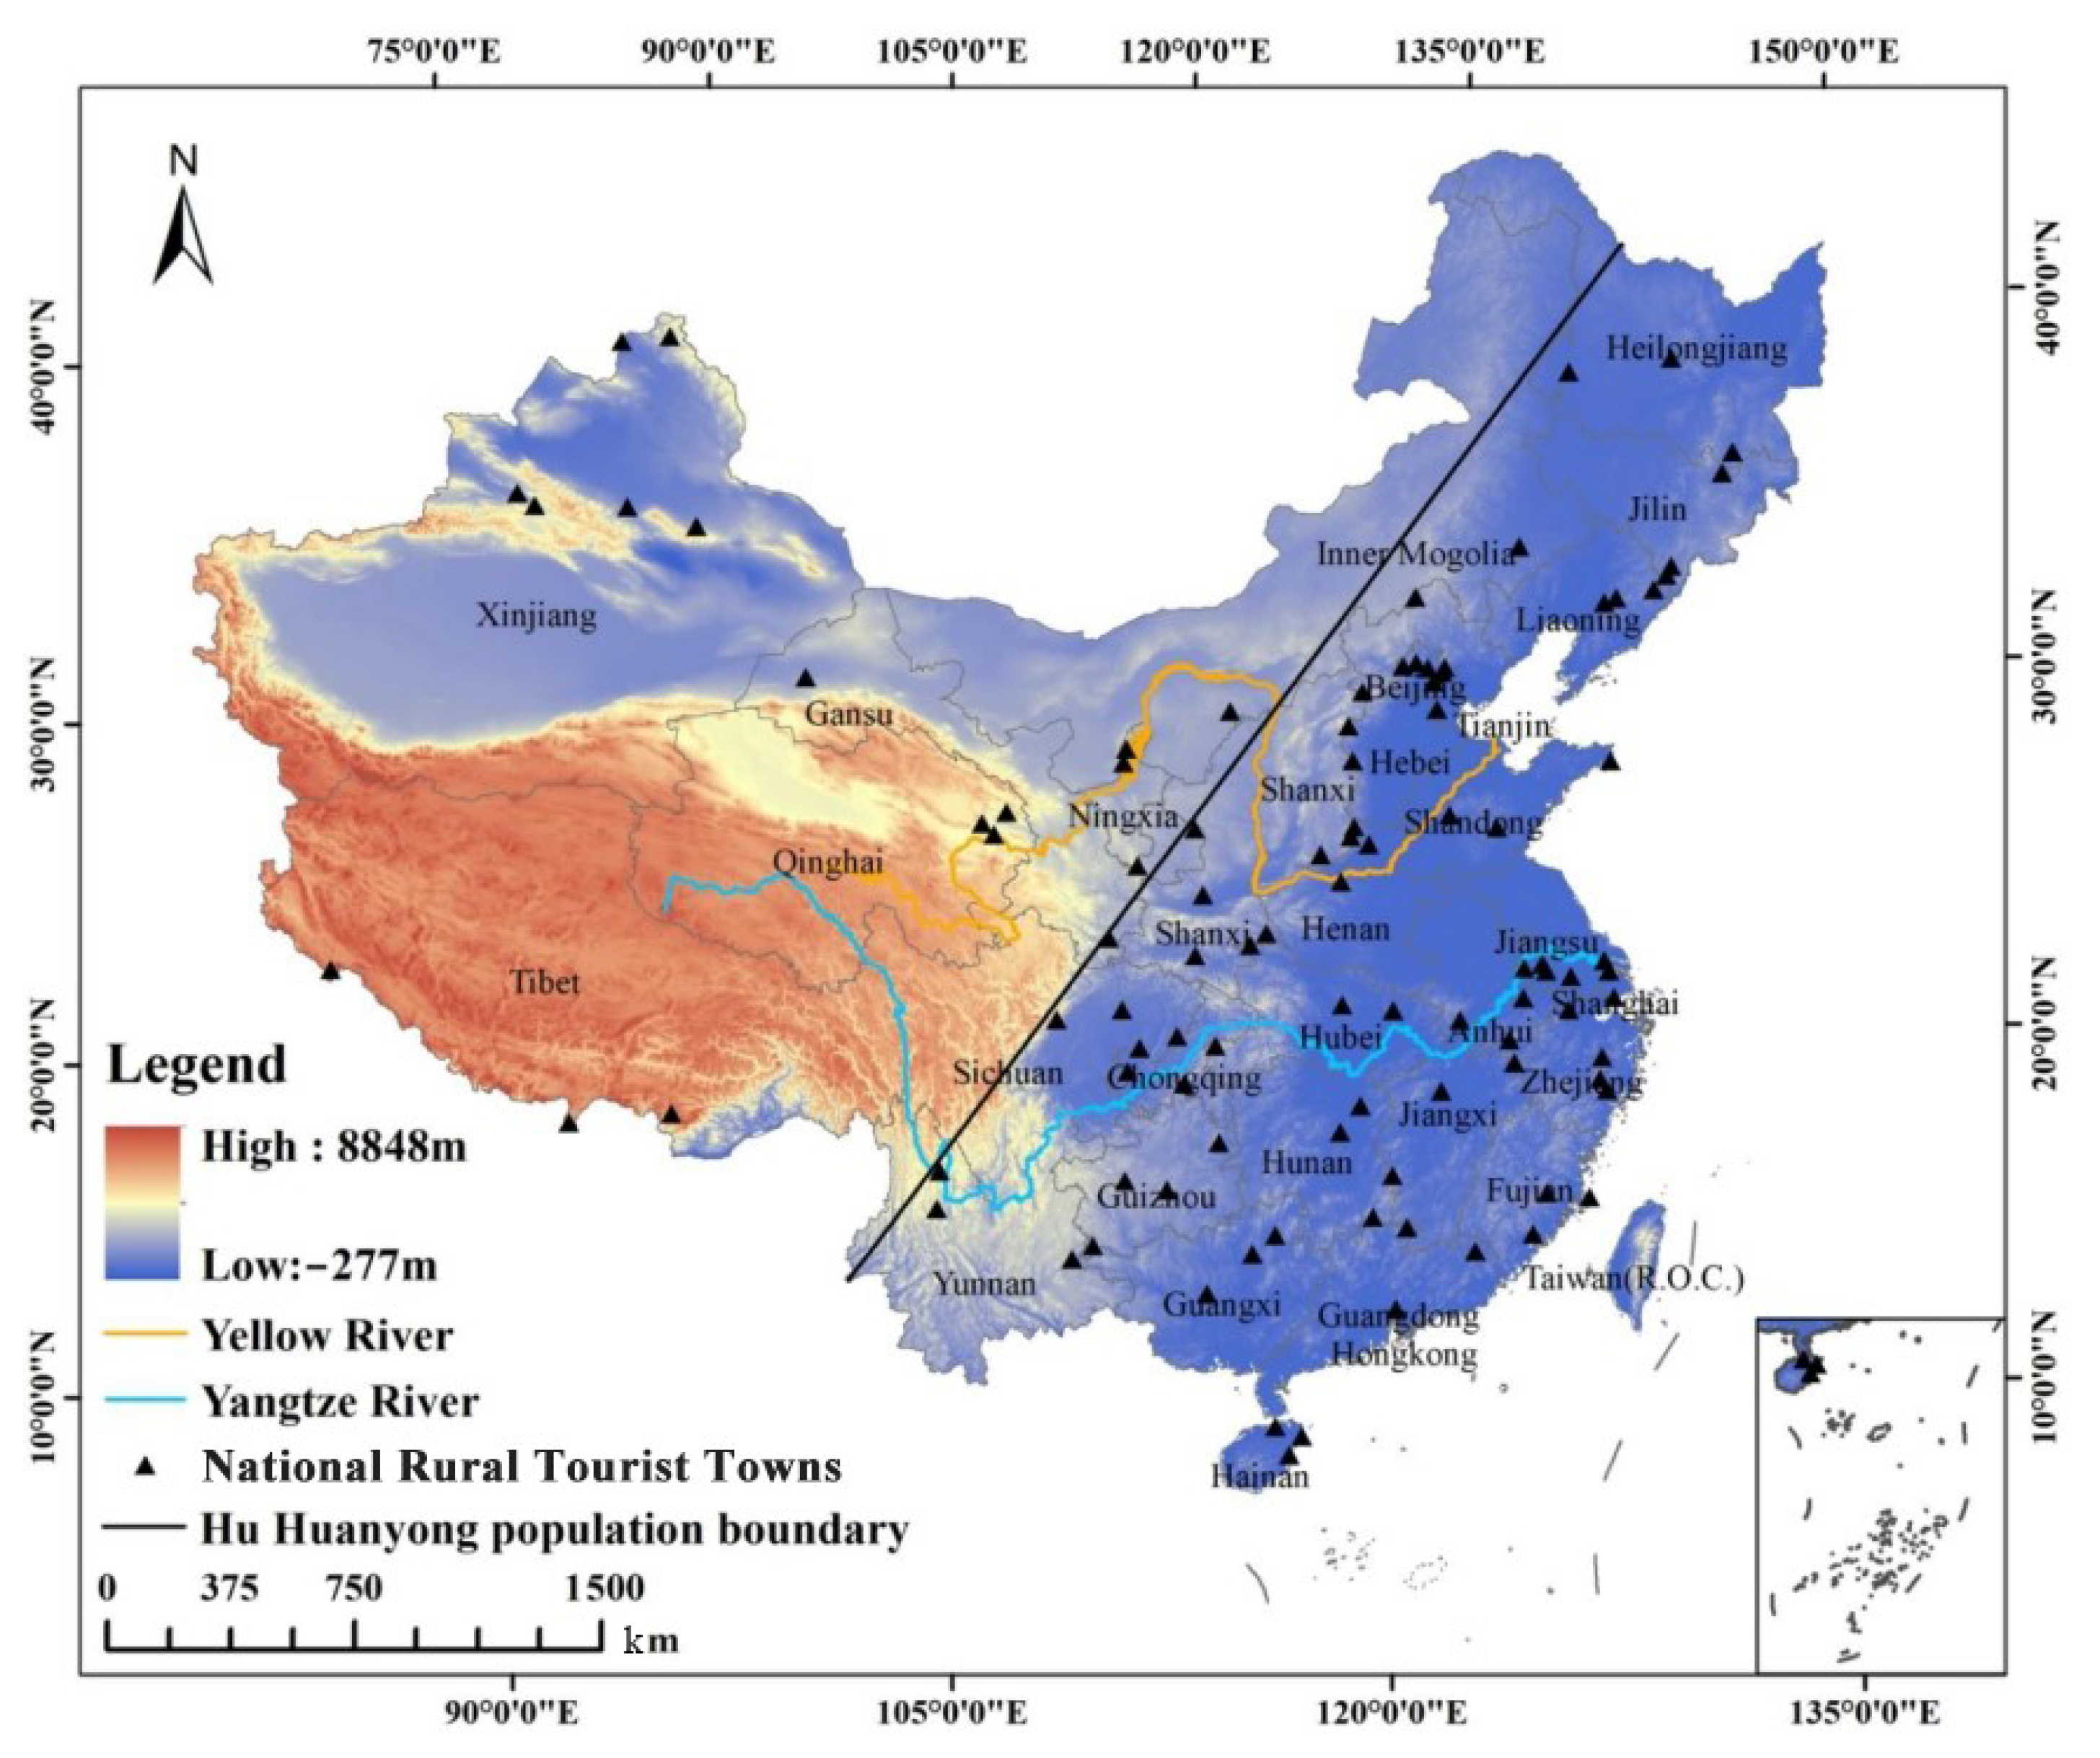
3.1. Overview of the Distribution of NRTTC

The list of rural tourist towns adopted in this research comes from the MCTC. The research object is the first batch of the NRTTC on the list jointly selected by the National Development and Reform Commission of the MCTC. Beginning in 2019, this ministry has published lists of tourist areas at other administrative levels; however, this is the first time they have posted a list at the town level [46]. According to China’s administrative regional plan, the distribution of the NRTTC covers 31 administrative provinces, municipalities, and autonomous regions (Table 1). There are six tourist towns in Xinjiang, while the number of tourist towns in Hubei, Jiangsu, Zhejiang, and Guizhou is four each. The list excludes Hong Kong, Macao, and Taiwan (the Republic of China), where the list is unavailable. All other provinces have three tourist towns each.
The classification of rural tourism resources into categories integrates the existing resources more effectively [47]. This study distinguished the categories of rural tourist towns in terms of Chinese rural tourism resources for the first time. GB represents the national standard, which means that it has been approved and issued by the national standardization authority [48]. This has an essential meaning for the economy of the whole country and the development of technology with a uniform standard nationwide. The category system of GB/T 18972-2017 “Classification, investigation, and evaluation of tourism resources” (Document 2017) has eight categories and 25 subcategories [49]. The categories of standards include the geomantic landscape, the water landscape, the ecological landscape, the astronomical and climatic landscape, buildings and facilities, historical sites, destination shopping, and human activity. Among the primary tourist resources of each town, in this research the “astronomical and climatic landscape” category did not appear in the NRTTC, thus, the NRTTC were divided into seven major categories and fifteen subcategories. This diagram shows that buildings and facilities (31) and the geomantic landscape (30) are the two most dominant tourist resources in the tourist towns as a whole, as 61% of the tourist resources are classified as one of these two types. The “cultural landscape complex” subcategory had the most significant number of rural towns in the category of buildings and facilities, accounting for 90.32% of this category (Figure 2).
Different administrative regions have various tourism resources (Figure 3). Buildings and facilities and geomantic landscapes are two kinds of tourism resources common in most regions, while other tourism resources are scattered across different regions.

3.2. Spatial Distribution Characteristics

3.2.1. The Pattern of Spatial Distribution

The imbalanced distribution of NRTTC illustrates that it has specific spatial distribution characteristics. With ArcGIS 10.2, according to the calculation model provided in Formula (1), this research grouped the spatial patterns of NRTTC into four classes (Table 2). The calculated density value can be divided into four levels: low density, medium density, high density, and core density. The final generated spatial kernel density distribution characteristics (Figure 4) show that the regions have no apparent aggregation in terms of their administrative distribution, and are uneven in terms of their geographical distribution (Table 3).
The results of this classification produced a distribution model of a core area, two sub-core regions, and several small core areas:
  • The core refers to the core density surrounding Beijing and Tianjin, where the kernel density was above 3.21;
  • The two sub-cores are the two high-density areas, one with Jiangsu as the center, radiating to Zhejiang, Shanghai, Anhui, Hubei, Anhui, and Jiangxi, and the other with Hebei as the core and including Henan and Shaanxi. The kernel density estimation for these sub-cores was between 0.17 and 1.79;
  • The small core areas, which include the rest of the rural tourist towns, cover every province of China. The kernel density estimation for this group was between 0.17 and 1.04.

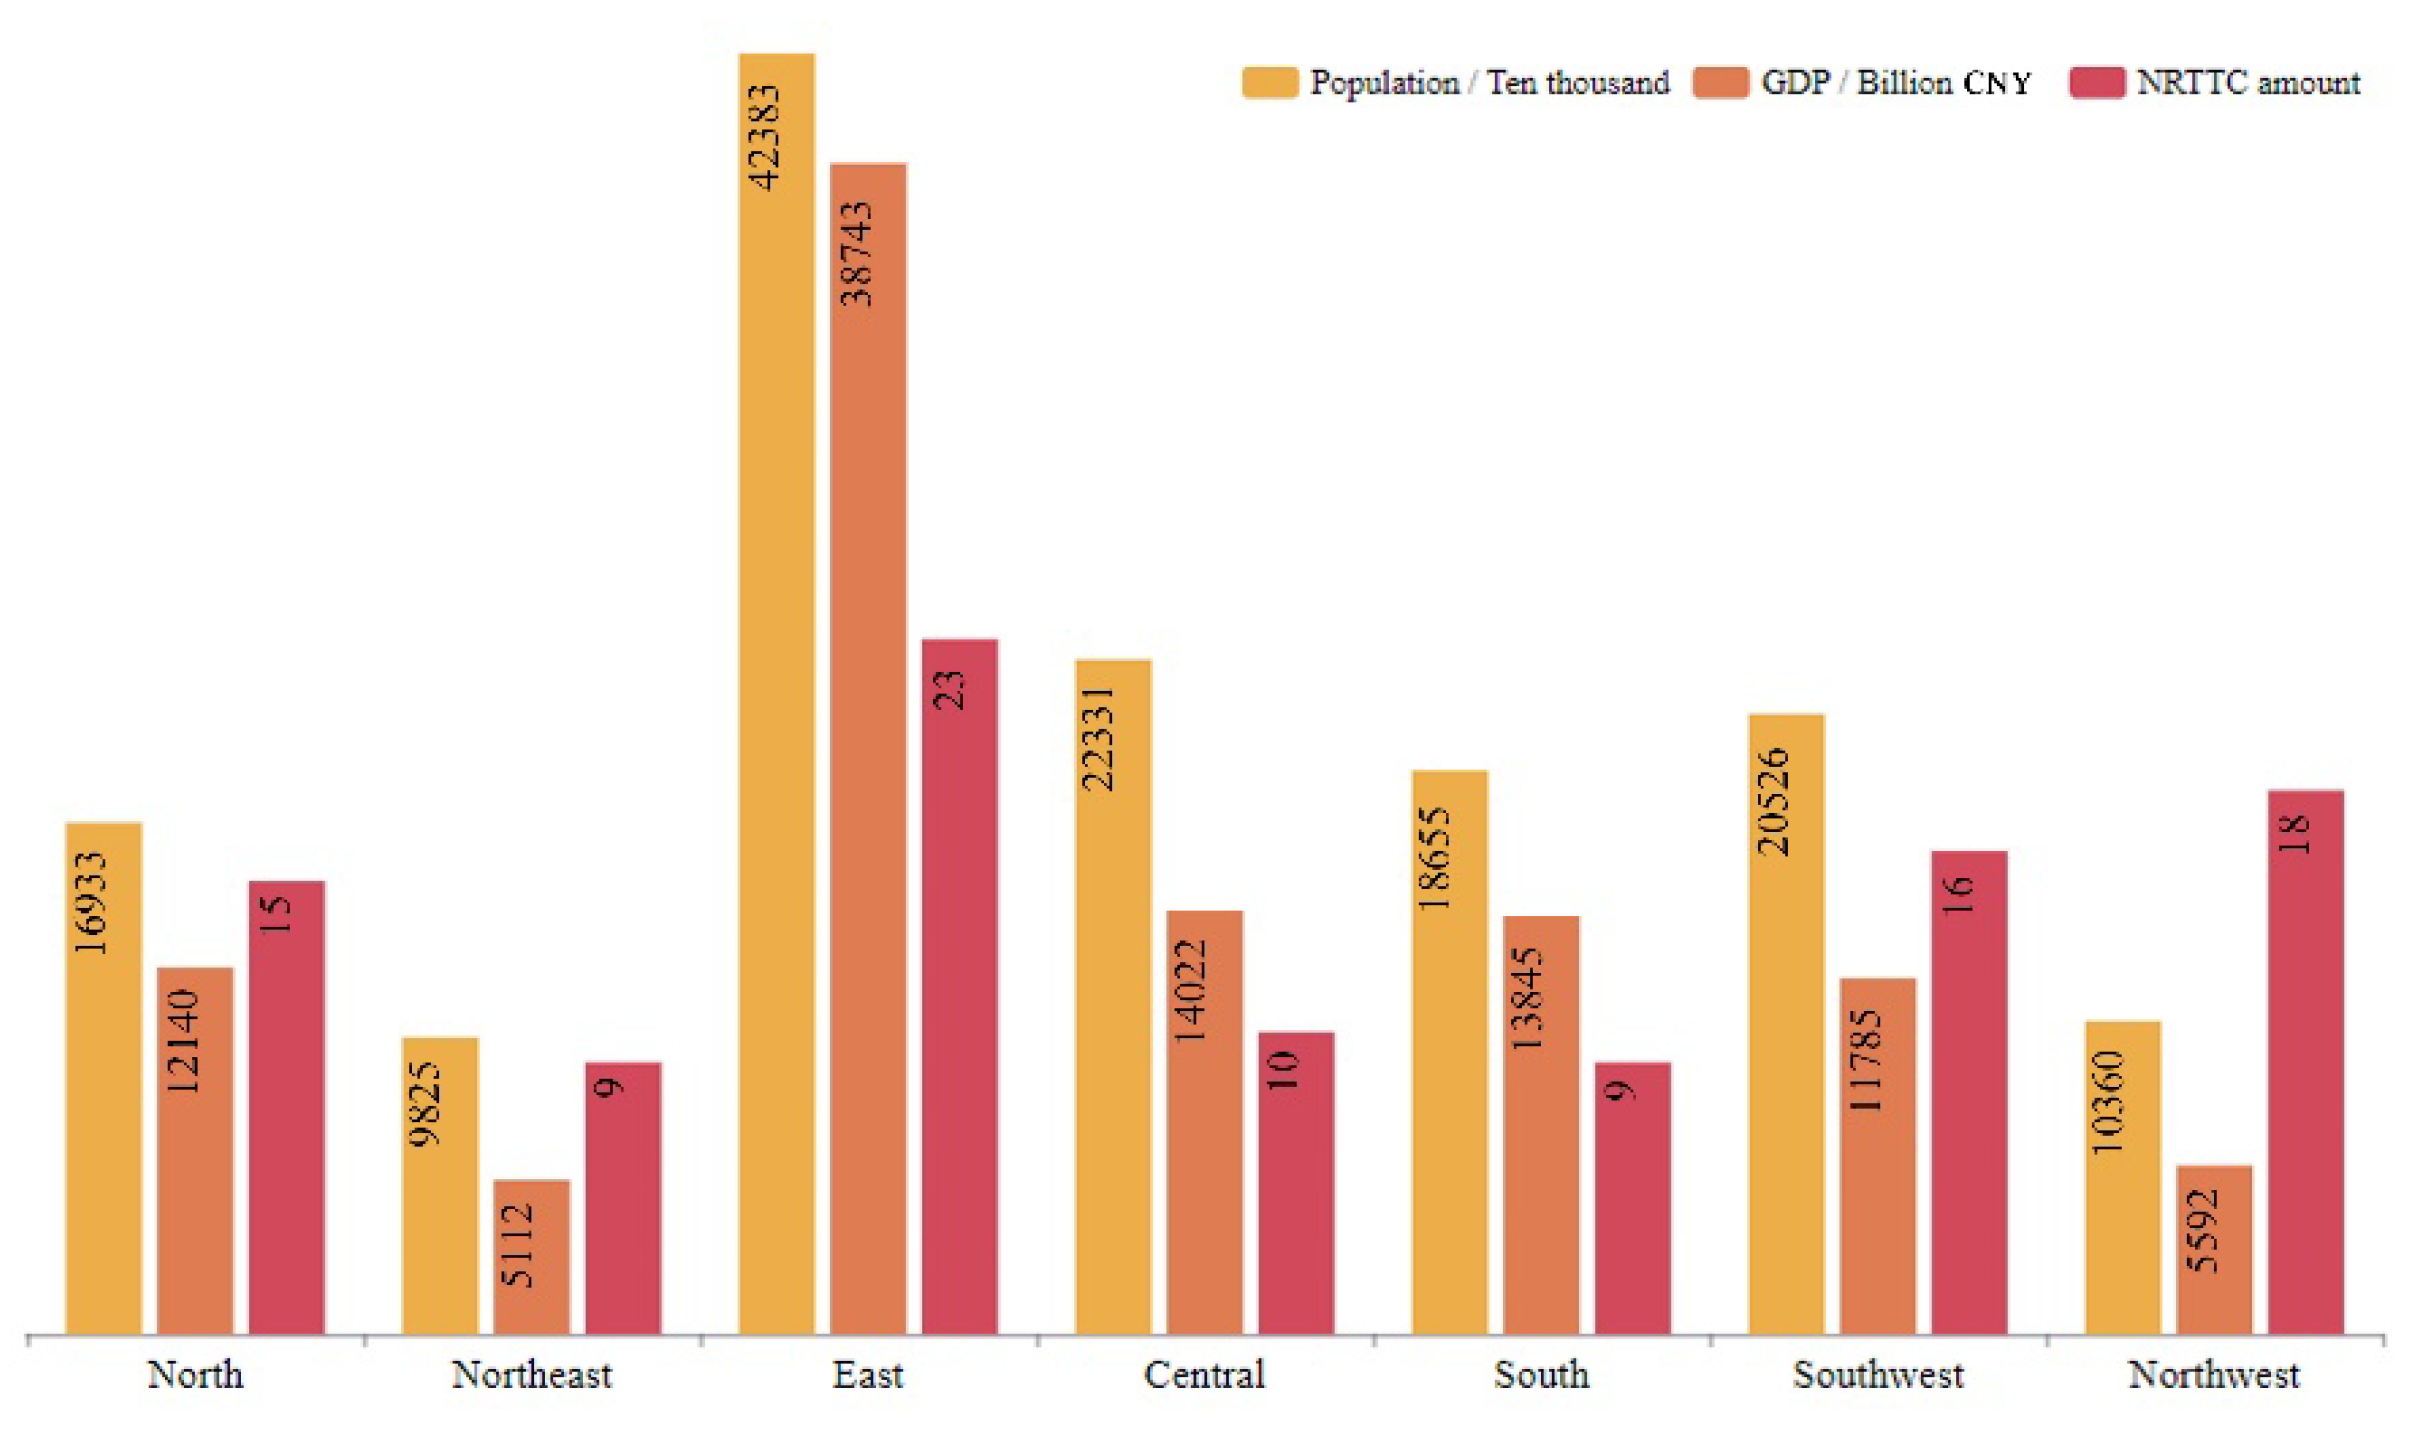
3.2.2. Differences in Distribution between Administration Regions

China covers a vast area of 9.6 million km2, with longitudes ranging from 73°33′ E to 135°05′E and latitudes ranging from 3°51′ N to 53°33′ N [50]. Distances between provinces are relatively large. The government has encouraged inter-provincial tourism in order to reduce the circulation of people across provinces in an attempt to prevent and control the COVID-19 pandemic, in which the NRTTC have a guiding effect.
According to the data in Table 1, the imbalance index (Formula (2)), or S, is 0.15. The value of S is biased towards 0, which further indicates that the spatial distribution of these rural tourist towns is relatively even across every administrative region in China.
According to the Lorenz curve (Figure 5), the cumulative proportion is almost parallel to the line of perfect equality. The distance between the two lines is relatively close, confirming the results obtained by the imbalance index.

3.2.3. Clustered Regional Distribution

The geographical division of China follows the results obtained by experts in physical geographical regionalization [51]. This has been a consensus for a long time in China. China can be divided into seven regions according to their characteristics in order to better explore the seven geographical areas from the perspectives of geography, climate, economy, and administration [52].
China’s territory has seven primary geographical divisions, as summarized in Table 4: north (Beijing, Tianjin, Hebei, Shanxi, Inner Mongolia), northeast (Liaoning, Jilin, Heilongjiang), east (Shanghai, Jiangsu, Zhejiang, Anhui, Jiangxi, Shandong, Fujian, Taiwan (R.O.C.), south (Guangdong, Guangxi, Hainan, Hong Kong, Macao), southwest (Chongqing, Sichuan, Guizhou, Yunnan, Tibet), central (Henan, Hubei, Hunan), and northwest (Shaanxi, Gansu, Qinghai, Ningxia, Xinjiang).
The distribution of the NRTTC across the seven geographical divisions is quite different. The east and southeast account for 41% of the total percentage. Those in the southwest and north outnumber those in the northeast and south, which account for 16% and 15%, respectively. The proportion in the south, northeast, and central is about 10% each. The Gini coefficient (G) is 0.97, and the distribution uniformity, C, is 0.03. This result illustrates that the distribution of NRTTC across the seven geographical divisions is quite uneven, and the uniformity is very low. The distribution proportion in the east and northwest divisions combined reaches 41%. The east division has the most rural tourist towns, with 23 rural tourist towns, accounting for 23% of the total, while the south division has the fewest rural tourist towns.

4. Influencing Factors in the Spatial Distribution of NRTTC

4.1. Policy Level

China is a socialist country; the ruling class of a socialist country is the proletariat, and the main body of the proletariat is the peasants, who live in the rural areas [53]. Moreover, China is a predominantly agricultural country, with thousands of years of history of human agrarian civilization. With the progress of history and the promotion of industrialization, the development of rural areas has been neglected for a long time. Therefore, the rural economy has gradually fallen behind [54]. Developing rural tourism is a good way forward when towns want to preserve their history and civilization while growing their economy.
In the last few years, the Chinese government has been focused on developing the economy in rural areas. It has promulgated a series of policies and regulations, and the NRTTC list has gradually formed across this wider background.
  • In 2014, China’s targeted poverty alleviation strategy was officially launched. China fully implemented the Opinions on Innovative Mechanisms to Solidly Promote Rural Poverty Alleviation and Development [55]. The supreme leader of the CCP, Xi Jinping, put forward the strategic idea of poverty alleviation to ensure that all poor habitats would be lifted out of poverty in 2019 and build a well-off society all around [56].
  • On 30 December 2015, the General Office of the State Council of China issued the Guiding Opinions on Promoting the Development of Rural Areas 123 [57]. This document proposed to explore the deep integration of agriculture with the tourism, education, culture, health, and pension industries. The integration of agriculture and tourism can break through the traditional production mode, enhance the vitality of rural cultural development, and clear the path to agricultural ecological development [58].
  • On 20 January 2016, the Ministry of Agriculture of China and the Poverty Alleviation Office of the State Council held a symposium to develop the key industries for precision poverty alleviation in Fuping County, Hebei Province [59]. This symposium pointed out that characteristic industries are the primary source of income for rural areas. The tourism poverty alleviation project is one of the ten major projects implemented by the Poverty Alleviation Office of the State Council of China for targeted poverty alleviation [60]. The practice of many places has proven that rural tourism poverty alleviation is an effective way to alleviate poverty.
  • The Central Committee of the CCP and the State Council issued a strategic plan for rural revitalization (2018–2022) and requiring all regions and departments to implement it earnestly in light of the actual conditions [61].
Hence, the MCTC actively responded to the call to begin rural tourism and promote rural revitalization through rural tourism. The NRTTC list in this research includes three to six tourist towns in each province. The numbers are evenly distributed in each administrative region. The spatial distribution across regions is very even. The list does not include all of China’s famous tourist towns. Rural tourism development is not only for local tourism development. The ultimate goal is to promote the development of the rural economy through tourism. Not every town on the list has a high level of construction maturity. The tourist towns in this list can radiate the benefits of tourism to the surrounding areas, drive economic growth and rural revitalization, increase jobs, and serve as an example nationwide to encourage the peaceful development of tourism in villages and towns.
In addition to rural revitalization, the ecological environment is a topic of particular concern globally [62]. Adhering to green development is one of China’s national policies. A healthy ecology means a suitable environment for travel, views, and livability. The outcome of tourism in towns implies the creation of a sound ecology, which urges governments at all levels to build a new pattern of agricultural development, which matches the carrying capacity of resources and the environment, improves the environment’s quality according to the actual town’s development situation, and lays a better foundation for rural tourism.
The Chinese government has set up the NRTTC for rural revitalization, which can develop a characteristic economy through rural tourism as a pathway to preserving the local natural ecosystem. The list does not include the most prosperous scenic areas. Instead, each administrative region has the maximum range of coverage for the whole of China on average through the NRTTC.
Mamamenba is an ethnic township located in Tibet (Figure 6) [63]. In 2014, the Chinese government began to build Mamamenba’s ecological infrastructure as an example in the region. The purpose of building this demonstration region is to narrow the gaps in national development, explore the ancient ethnic culture of Monpa, and build a town with Monpa characteristics. Through government guidance and mass participation, the local tourism industry’s reception capacity and service quality have been significantly improved and tourist infrastructure and supporting functions have been increasingly perfected, forming an excellent circular economy. The scale has been expanding year by year, and it has now become a Grade 3A national tourist resort [64]. In this study, the tourism resource subcategory of Mamamenba is defined as a Cultural landscape complex.

4.2. Social Level

The number of towns and their population are positively correlated with the economic level, which affects the spatial distribution pattern of the NRTTC. Obviously, in areas with a high population density and developed economies many tourist towns are more distributed and dense.
The graph in Figure 7 displays the most well-known population boundaries, which were put forward by the Chinese scholar Hu Huanyong in 1935 [65]. The land area accounts for 36% of the territory, and the population accounts for 96% on the southeastern side of the line. While the northwest side of this line accounts for 64% of the area, the population accounts for only 4%. The population density difference is more than 40-fold. In terms of the distribution density of all the tourist towns, one core area and two secondary core areas are distributed to the southeast of this line. The remaining small areas are primarily spread to the southeast of this line [66]. Only 17 tourist towns are located on the northwest side of the boundary, while 83 are located on the southeast side, accounting for 17% and 83%, respectively.
The eastern region has the largest population. The northeast has the smallest, with only 6.82% in 2020; second is the northwest, with 7.17% according to the Chinese Seventh Population Census. This shows that population numbers and tourist towns have a particular link. As a representative form of sub-urban tourism, the main source market of rural tourism is from the nearby cities. Populous regions can expand rural tourism in the towns of commuters, which would be conducive to the development of rural tourist towns. With the largest number of people, the eastern region is the region with the largest number of NRTTC, and thus the richest rural tourism resources (Figure 8).
The total gross domestic product in 2020 (GDP, in billion CNY) from highest to lowest was ranked as follows: east (38,743), central (14,022), south (13,845), north (12,140), southwest (11,785), northwest (5592), and northeast (5112) [67]. The eastern region’s GDP (unit: CNY) is always the highest. The density of the rural tourist towns in the eastern area is relatively large. The radiation range is the widest for the whole country, followed by the central and southern regions and the northern regions. From this, it can be concluded that population and economic development are related to rural tourism. The more developed the economy is, the more funds and resources will be available for rural tourism development, creating positive feedback for urban tourism development [68]. This makes local rural tourism development more dynamic, innovative, and competitive. Similarly, the more developed the economy is, the better the transportation system will be, which will increase the radiation area. The audience base of tourists will be more significant [69]. On the contrary, the traffic system in western China is relatively backward. The number of tourists in scenic spots will therefore be reduced, which will harm the development of local rural tourism.
Guli Street is a rural town located in Jiangsu (Figure 9) [70]. Jiangsu province has a relatively high population density and a large land area [71]. Moreover, its comprehensive economic strength has always been among the highest in China. The average educational level of the population of this province is high, second only to Beijing, the capital of China [72]. Guli Street has many famous scenic spots, such as the Taoyuan Caves, Mount Niushou, and more. The town is surrounded by elevated and ground-based railways and highway transportation resources. These affluent social and local resources have provided a sustainable impetus to tourism development in this town [73]. In this study, the tourism resource subcategory of Guli is defined as a Cultural landscape complex.

4.3. Geographical Level

This research used ArcGIS10.2 to overlay the map of China with the DEM elevation data (Figure 7), concluding that the distribution of rural tourist towns is related to their altitude and topography. Most rural tourist towns are clustered at low altitudes (the plain in the middle and lower reaches of the Yangtze River and the North China Plain) and low latitudes (10° N~30° N). North China is the region with the highest density of rural tourist towns. The terrain is dominated by the North China Plain, which has a temperate continental climate, sufficient light and heat, and fertile soil; the vegetation is primarily deciduous broadleaf forests and temperate grasslands. The cultivated land resources are rich, with an elevation of 100–500 m, and the terrain is flat and wide [74,75]. The middle and lower reaches of the Yangtze River region are mainly 500 m above sea level. The terrain is primarily hills and plains, and it has a subtropical monsoon climate, which is warm and humid [76]. Across the area, there is abundant rainfall and many subtropical evergreen broadleaf forests. This area includes the most popular freshwater lakes in China, and natural resources are abundant; as a result, the region’s agriculture is booming [77]. The distribution of tourist towns in this area is the widest in China.
These two areas are more suitable for human life and the production of materials than other areas, and the density and number of rural tourist towns in these two areas are greater. This does not mean, however, that other regions are not rich in tourism resources. For example, karst landforms are widespread in the southwest region of China, and there is tourism based on caves in these rural tourist towns [78]. The vertical spectrum of vegetation in the western mountainous plateau in this area is complete, and the range of vegetation is rich. There are spectacular snow-capped mountains on the Qinghai–Tibet Plateau. The vast Gobi Desert and the Yadan landforms in the northwest region have temperate continental climates and relatively arid scenery. South China has many hills, few plains, and broken terrain. Due to its low latitude, it has a subtropical monsoon climate, and typhoons are more frequent. Nevertheless, its natural resources are very distinctive, including the Danxia landform and other wonders.
Nalati, in Xinjiang (Figure 10) [79], is a town located in a place surrounded by mountains on three sides. The highest peak is the prominent peak of Mount Nalati, 4275 m above mean sea level [80]. From ancient times, it has been a famous pasture area, one of the world’s four subalpine meadow areas of grassland plants. The Nalati grassland is a natural summer resort. This town’s rich and highly distinctive natural beauty means that is has had plenty of exposure. In this study, the tourism resource subcategory of Nalati is defined as a Vegetation landscape.

4.4. Historical Level

A rich historical and cultural heritage can become a unique tourism resource to attract tourists, further develop rural tourism in undeveloped areas, increase regional economy, and promote rural revitalization [81]. Cultural reserves should be built while developing rural cultural tourism. Cultural reserves can express history and modernity, life and culture, and materiality and spirituality. Thus, cultural reserves are both living areas and an emotional expression in space of the local people, as well as production and inheritance sites of intangible cultural heritage. Regions with a long history have more cultural tourism resources, and thus more towns in the NRTTC list. The cultural reserves completely retain the local cultural heritage, maintaining the characteristics of local tourism and enabling the rural tourism economy.
China has a history of nearly 5000 years, during which time there have been countless dynasties [82], which today have produced numerous tourist destinations. Historically, the location of the capital city has led to an economic boom in the surrounding rural area, producing many cultural heritage sites. Different dynasties had different capitals and different cultural heritage sites, producing different cultural tourist sites. Beijing is the modern capital of China and the place with the highest density of NRTTC.
Shaoshan town in Hunan province is the hometown of Mao Zedong, the pioneer who founded the People’s Republic of China and the Communist Party of China (Figure 11) [83]. It has prominent characteristics of the red tourism industry [84], and has naturally become a patriotic education base and revolutionary memorial in China [85]. Based on its unique historical background, Shaoshan has dug deep into its red cultural resources, developed continuously by relying on tourism, and became one of China’s most famous red tourism destinations [86]. In this study, the tourism resource subcategory of Shaoshan is defined as Material cultural relics.

5. Discussion

This research analyzed the spatial pattern of NRTTC (Figure 12). From the perspective of the numerical distribution across each province, the distribution is relatively even. From the perspective of the entire Chinese territory, the spatial distribution is highly uneven. National policies, population density, the economic level, and the geographical environment all influence the spatial distribution of rural tourist towns to a certain extent. The overall spatial distribution of NRTTC is greater in the southeast than in the northwest.
The list is time-sensitive, will change with time, and due to the limited number on the list, it cannot include all of the towns with relevant development potential nationwide. Xinjiang has the greatest number of tourist towns (six), twice as many as most provinces. Nevertheless, Xinjiang has a small population and an underdeveloped economy. This phenomenon is mainly due to the large land area of Xinjiang. The transportation system in this region is not developed, and it is not easy to travel between various places. Xinjiang is located in the hinterland of Eurasia, in the region of northwestern China, bordering eight different countries. Xinjiang’s strategic location is critical. Wen Jiabao, the former premier of the State Council of China, visited in Nalati in Xinjiang and proposed making the Nalati scenic area one of the five major scenic area for Xinjiang’s fundamental development. As a socialist centralized country, the central government holds absolute power; policy inclinations can therefore make up for deficiencies in other development conditions to a certain extent.
From the perspective of tourism resource categories, cultural heritage has a very significant impact on the distribution of tourist towns. Most cultural heritage sites among the NRTTC are preserved in the circle of Beijing and Jiangsu, and the regional density is more concentrated. Henan, Sichuan, and Shaanxi, which have their own rich history. Although the cultural heritage sites are not as dense as in the other two core areas, they can form an agglomeration because of their rich historical resources. By contrast, while the southern part of China has a higher economic development now, there are few historical traces in the southern region other than a few tourist towns with architectural facilities and historical relics. Most scenic areas in the southern area are natural and depend upon the local topography and landform development. As can be seen from the map of China shown above, there are fewer administrative regions in northwest China, which has a more extensive area and higher elevations. The administrative regions on the southeast side of the Hu Huanyong boundary are densely distributed, and the terrain is gentle. Although the number of tourist towns in each administration region is similar, they present an uneven spatial distribution as a result.
Meanwhile, through our influence factors analysis, this article can provide a reference for rural construction in other countries near China with similar national policies and social, geographical, and historical environments. For example, such a policy provides priority support to towns which, although suffering economically, have development potential. Policies should encourage nearby towns with large populations and more developed economies to innovate in terms of tourism and to create better rural tourism opportunities. Guidance and references should be provided for local towns which, while not well-developed, have distinctive geographical landscapes. In order to develop characteristic cultural tourism, cultural reserves should be set aside for towns with historical and cultural heritage. Developing rural tourism should, as far as possible, ensure the preservation of the local cultural heritage, maximize the protection of local history and civilization, provide full play to the different characteristics of the town, and only then develop the local economy.
As a predominantly agricultural country for thousands of years, China cannot be limited to solving infrastructure problems by the construction and development of rural tourism. Every participant in rural construction should be more flexible in linking local history and culture as well as in thinking about the significance of rural tourism for rural values and civilization, avoiding similarities between rural and urban construction, and thinking about rural areas’ mode of existence and importance in the contemporary era.

6. Conclusions

This article used a spatial analysis method to research different densities in different areas and their spatial distribution. Next, it further proved the previous spatial analysis through data analysis, making the results more objective and accurate. From the imbalance index, it can be seen that there are two essential centers in the country: Beijing is the center, with the highest kernel density, while Jiangsu is the sub-center, with the most comprehensive radiation range. At the same time, it was determined that the number of tourist towns on this list is relatively evenly distributed across provinces. However, the spatial distribution is highly uneven. The distribution of NRTTC is influenced by national policies, demographic factors, and the geographical environment. In addition, historical factors are essential for a town to become one of the NRTTC. It can be seen that the proportion of towns with building and facility resources in the NRTTC list is the largest, and these buildings and facilities mainly comprise the local material cultural heritage. Historical factors can improve the infrastructure and cultural development in certain areas, and can be used as a cultural reserve to form the regional tourist characteristics.
With the development direction of NRTTC as an example, this research has discussed the phases of achievement of rural tourism in the development process. Rural tourism faces many challenges and difficulties, and many towns in the world are undeveloped. It can be expected that thorough analysis of the directory of rural tourist towns provided in this research can provide a more precise and more stereotypical models for the construction of rural tourist towns. Every prosperous rural tourist town is not determined by only one factor. Each town has its main advantages and general advantages, as well as its disadvantages. For example, Nalati, as mentioned above, has significant natural landscape advantages. However, due to its geographical location in a mountainous area the transportation is not convenient, which limits economic development. In addition, it has the unique local customs and practices of the Kazakh nationality, which are historical and cultural advantages. The distribution of the NRTTC in terms of resource type can correspond to different tourism resource towns, which can become a good reference point.
The successful development of tourist towns is a unique historical point. In certain areas, there is a misunderstanding regarding the development of rural tourism. It is thought that a standard development model is likely to lead to the outcomes of rural tourism being almost the same, and that there is thus ultimately no novelty. In such cases, a screened reference list with multiple perspectives can be of crucial value to other regions in similar situations.

Author Contributions

J.Z. developed the research topic; Z.Z. prepared the writing—original draft; J.Z. and J.C. were responsible for the writing—review and editing. All the authors contributed to reviewing the paper. All authors have read and agreed to the published version of the manuscript.

Funding

This work was supported by the University of Mons, grant project CoMod, Compacité urbaine sous l’angle de la modélisation mathématique (théorie des graphes et des jeux) of the Faculty of Architecture and Urban Planning and the Faculty of Sciences.

Institutional Review Board Statement

Not applicable.

Informed Consent Statement

Not applicable.

Data Availability Statement

Not applicable.

Conflicts of Interest

The authors declare no conflict of interest.

References

  1. Zeng, X.; Ma, Y.; Ma, L. Utilization of straw in biomass energy in China. Renew. Sustain. Energy Rev. 2007, 11, 976–987. [Google Scholar] [CrossRef]
  2. Wang, S. Toward Shared Prosperity: China’s New Leap Forward in Social Protection. Econ. Political Stud. 2014, 2, 161–196. [Google Scholar] [CrossRef]
  3. Lin, C. The transformation of Chinese socialism. In The Transformation of Chinese Socialism; Duke University Press: Durham, NC, USA, 2006. [Google Scholar]
  4. Quan, B.; Zhu, H.-J.; Chen, S.-L.; Römkens, M.; Li, B.-C. Land suitability assessment and land use change in Fujian Province, China. Pedosphere 2007, 17, 493–504. [Google Scholar] [CrossRef]
  5. Liang, X.; Ma, L.; Chong, C.; Li, Z.; Ni, W. Development of smart energy towns in China: Concept and practices. Renew. Sustain. Energy Rev. 2020, 119, 109507. [Google Scholar] [CrossRef]
  6. Xie, Y.; Ji, X.; Wu, J.; Tian, F.; Zhu, J.; Liu, Z. Assessment of Cadmium (Cd) in Paddy Soil and Ditch Sediment in Polluted Watershed and Non-Polluted Watershed. Int. J. Environ. Res. 2021, 15, 527–534. [Google Scholar] [CrossRef]
  7. Gu, D.; Andreev, K.; Dupre, M.E. Major trends in population growth around the world. China CDC Wkly. 2021, 3, 604. [Google Scholar] [CrossRef]
  8. Chen, P.; Shi, X. Dynamic evaluation of China’s ecological civilization construction based on target correlation degree and coupling coordination degree. Environ. Impact Assess. Rev. 2022, 93, 106734. [Google Scholar] [CrossRef]
  9. Sullivan, L.R. Historical Dictionary of the Chinese Communist Party; Rowman & Littlefield: Lanham, MD, USA, 2021. [Google Scholar]
  10. Jinping, X. Secure a decisive victory in building a moderately prosperous society in all respects and strive for the great success of socialism with Chinese characteristics for a new era. In Proceedings of the delivered at the 19th National Congress of the Communist Party of China, Beijing, China, 18 October 2017. [Google Scholar]
  11. Wenjing, S. A Brief Discussion on the Dilemma and Outlet of Rural Financial Development--Based on Empirical Data Research of Chongqing. Acad. J. Humanit. Soc. Sci. 2021, 4. [Google Scholar] [CrossRef]
  12. Xue, S.; Song, J.; Wang, X.; Shang, Z.; Sheng, C.; Li, C.; Zhu, Y.; Liu, J. A systematic comparison of biogas development and related policies between China and Europe and corresponding insights. Renew. Sustain. Energy Rev. 2020, 117, 109474. [Google Scholar] [CrossRef]
  13. Li, X.; Hui, E.C.; Chen, T.; Lang, W.; Guo, Y. From Habitat III to the new urbanization agenda in China: Seeing through the practices of the “three old renewals” in Guangzhou. Land Use Policy 2019, 81, 513–522. [Google Scholar] [CrossRef]
  14. Romao, J.; Neuts, B. Territorial capital, smart tourism specialization and sustainable regional development: Experiences from Europe. Habitat Int. 2017, 68, 64–74. [Google Scholar] [CrossRef] [Green Version]
  15. Tian, X.; Wu, M.; Ma, L.; Wang, N. Rural finance, scale management and rural industrial integration. China Agric. Econ. Rev. 2020, 12, 349–365. [Google Scholar] [CrossRef]
  16. Alberti, F.G.; Giusti, J.D. Cultural heritage, tourism and regional competitiveness: The Motor Valley cluster. City Cult. Soc. 2012, 3, 261–273. [Google Scholar] [CrossRef]
  17. Ivona, A.; Rinella, A.; Rinella, F.; Epifani, F.; Nocco, S. Resilient rural areas and tourism development paths: A comparison of case studies. Sustainability 2021, 13, 3022. [Google Scholar] [CrossRef]
  18. Maroto-Martos, J.C.; Voth, A.; Pinos-Navarrete, A. The importance of tourism in rural development in Spain and Germany. In Neoendogenous Development in European Rural Areas; Springer: Berlin/Heidelberg, Germany, 2020; pp. 181–205. [Google Scholar]
  19. Zhang, X.; Zhang, K.H. How does globalisation affect regional inequality within a developing country? Evidence from China. J. Dev. Stud. 2003, 39, 47–67. [Google Scholar] [CrossRef]
  20. Wang, J.; Lin, Y.; Glendinning, A.; Xu, Y. Land-use changes and land policies evolution in China’s urbanization processes. Land Use Policy 2018, 75, 375–387. [Google Scholar] [CrossRef]
  21. Liu, Y.; Liu, Y.; Chen, Y.; Long, H. The process and driving forces of rural hollowing in China under rapid urbanization. J. Geogr. Sci. 2010, 20, 876–888. [Google Scholar] [CrossRef]
  22. Ho, E.L.-E. Citizens in Motion. In Citizens in Motion; Stanford University Press: Stanford, CA, USA, 2020. [Google Scholar]
  23. Zhao, Y. Communication in China: Political economy, power, and conflict; Rowman & Littlefield Publishers: Lanham, MD, USA, 2008. [Google Scholar]
  24. Gernet, J.; Foster, J.R.; Gernet, J.A. A History of Chinese Civilization; Cambridge University Press: Cambridge, UK, 1996. [Google Scholar]
  25. Hong, Y.; Lyu, X.; Chen, Y.; Li, W. Industrial agglomeration externalities, local governments’ competition and environmental pollution: Evidence from Chinese prefecture-level cities. J. Clean. Prod. 2020, 277, 123455. [Google Scholar] [CrossRef]
  26. Zhang, A.; Yang, Y.; Chen, T.; Liu, J.; Hu, Y. Exploration of spatial differentiation patterns and related influencing factors for National Key Villages for rural tourism in China in the context of a rural revitalization strategy, using GIS-based overlay analysis. Arab. J. Geosci. 2021, 14, 83. [Google Scholar] [CrossRef]
  27. Weaver, D.B.; Lawton, L.J. Resident perceptions in the urban–rural fringe. Ann. Tour. Res. 2001, 28, 439–458. [Google Scholar] [CrossRef]
  28. Gao, J.; Wu, B. Revitalizing traditional villages through rural tourism: A case study of Yuanjia Village, Shaanxi Province, China. Tour. Manag. 2017, 63, 223–233. [Google Scholar] [CrossRef]
  29. Liu, C.; Dou, X.; Li, J.; Cai, L.A. Analyzing government role in rural tourism development: An empirical investigation from China. J. Rural Stud. 2020, 79, 177–188. [Google Scholar] [CrossRef]
  30. Su, M.M.; Wall, G.; Wang, Y.; Jin, M. Livelihood sustainability in a rural tourism destination-Hetu Town, Anhui Province, China. Tour. Manag. 2019, 71, 272–281. [Google Scholar] [CrossRef]
  31. Gao, S.; Huang, S.; Huang, Y. Rural tourism development in China. Int. J. Tour. Res. 2009, 11, 439–450. [Google Scholar] [CrossRef]
  32. Smith, G. The hollow state: Rural governance in China. China Q. 2010, 203, 601–618. [Google Scholar] [CrossRef] [Green Version]
  33. Šimková, E.; Holzner, J. Motivation of tourism participants. Procedia-Soc. Behav. Sci. 2014, 159, 660–664. [Google Scholar] [CrossRef] [Green Version]
  34. Ghadban, S.; Shames, M.; Abou Arrage, J.; Abou Fayyad, A. Rural tourism in Lebanon: What does the market reveal? Manag. Avenir 2017, 96, 165–185. [Google Scholar] [CrossRef] [Green Version]
  35. Hjalager, A.-M.; Kwiatkowski, G.; Østervig Larsen, M. Innovation gaps in Scandinavian rural tourism. Scand. J. Hosp. Tour. 2018, 18, 1–17. [Google Scholar] [CrossRef]
  36. Sidali, K.L.; Kastenholz, E.; Bianchi, R. Food tourism, niche markets and products in rural tourism: Combining the intimacy model and the experience economy as a rural development strategy. J. Sustain. Tour. 2015, 23, 1179–1197. [Google Scholar] [CrossRef]
  37. Su, B. Rural tourism in China. Tour. Manag. 2011, 32, 1438–1441. [Google Scholar] [CrossRef]
  38. Zhongxin, L. Research on Beautiful Countryside Construction in China: Taking Shandong Province as an Example. Can. Soc. Sci. 2016, 12, 69–73. [Google Scholar]
  39. Yang, J.; Yang, R.; Chen, M.-H.; Su, C.-H.J.; Zhi, Y.; Xi, J. Effects of rural revitalization on rural tourism. J. Hosp. Tour. Manag. 2021, 47, 35–45. [Google Scholar] [CrossRef]
  40. Yang, Y.; Cao, M.; Cheng, L.; Zhai, K.; Zhao, X.; De Vos, J. Exploring the relationship between the COVID-19 pandemic and changes in travel behaviour: A qualitative study. Transp. Res. Interdiscip. Perspect. 2021, 11, 100450. [Google Scholar] [CrossRef] [PubMed]
  41. Chebli, A. The impact of Covis-19 on tourist consumption behaviour: A perspective article. J. Tour. Manag. Res. 2020, 7, 196–207. [Google Scholar]
  42. Zhang, J.; Cenci, J.; Becue, V. A Preliminary Study on Industrial Landscape Planning and Spatial Layout in Belgium. Heritage 2021, 4, 1375–1387. [Google Scholar] [CrossRef]
  43. Zhang, J.; Cenci, J.; Becue, V.; Koutra, S. Research of the industrial heritage category and spatial density distribution in the Walloon region, Belgium, and Northeast China. In Structural Studies, Repairs and Maintenance of Heritage Architecture XVII & Earthquake Resistant Engineering Structures XIII; WIT Press: Southampton, UK, 2021; Volume 285. [Google Scholar]
  44. Palmer, J.R. Activity-space Segregation: Understanding Social Divisions in Space and Time; Princeton University: Princeton, NJ, USA, 2013. [Google Scholar]
  45. Wang, X.; Zhang, J.; Cenci, J.; Becue, V. Spatial Distribution Characteristics and Influencing Factors of the World Architectural Heritage. Heritage 2021, 4, 2942–2959. [Google Scholar] [CrossRef]
  46. Tang, X. The historical evolution of China’s tourism development policies (1949–2013)—A quantitative research approach. Tour. Manag. 2017, 58, 259–269. [Google Scholar] [CrossRef]
  47. Zhang, J.; Cenci, J.; Becue, V.; Koutra, S. Analysis of spatial structure and influencing factors of the distribution of national industrial heritage sites in China based on mathematical calculations. Environ. Sci. Pollut. Res. 2022, 29, 27124–27139. [Google Scholar] [CrossRef]
  48. Zhu, H.; Tang, C.; Wang, L.; Zhao, L.; Long, J.; Li, Y.; Zhang, Y.; Yang, Z.; Zhang, P.; Gan, M. Research on tourism resources in the new era: Protection, utilization and innovative development: Comments of young tourism geographers. J. Nat. Resour. 2020, 35, 04000992. [Google Scholar]
  49. Wu, X.; Qiao, S.; Tan, Q. Destination Management for Ecotourism Activity Using Analytical Hierarchy Process. Sci. Program. 2022, 2022, 4143060. [Google Scholar] [CrossRef]
  50. Song, G.; Zhang, M.; Liu, W.; Liang, G. Changing face of epidemiology of dermatophytoses in Chinese Mainland: A 30 years nationwide retrospective study from 1991 to 2020. Mycoses 2022, 65, 440–448. [Google Scholar] [CrossRef] [PubMed]
  51. Fang, C.; Liu, H.; Luo, K.; Yu, X. Process and proposal for comprehensive regionalization of Chinese human geography. J. Geogr. Sci. 2017, 27, 1155–1168. [Google Scholar] [CrossRef] [Green Version]
  52. Zhang, Y.; Li, Y.; Yang, B.; Zheng, X.; Chen, M. Risk assessment of COVID-19 based on multisource data from a geographical viewpoint. IEEE Access 2020, 8, 125702–125713. [Google Scholar] [CrossRef]
  53. Trotsky, L. The Permanent Revolution & Results and Prospects; Red Letter Press: Seattle, WA, USA, 2010. [Google Scholar]
  54. Liu, Y.; Zang, Y.; Yang, Y. China’s rural revitalization and development: Theory, technology and management. J. Geogr. Sci. 2020, 30, 1923–1942. [Google Scholar] [CrossRef]
  55. Keay, A.; Zhao, J. Transforming corporate governance in Chinese corporations: A journey, not a destination. Nw. J. Int’l L. Bus. 2017, 38, 187. [Google Scholar]
  56. Hao, S. Reducing the Interethnic Developmental Gap: A Road to Common Prosperity and Development. In China’s Solution to Its Ethno-National Issues; Springer: Berlin/Heidelberg, Germany, 2020; pp. 125–164. [Google Scholar]
  57. Weidong, W.; Yu, X. Research on the Development Path of Rural Electronic Commerce in the Perspective of Precision Poverty Alleviation. Innov. Reg. Public Serv. Sustain. 2016, 9, 137. [Google Scholar]
  58. Long, H.; Zhang, Y.; Tu, S. Rural vitalization in China: A perspective of land consolidation. J. Geogr. Sci. 2019, 29, 517–530. [Google Scholar] [CrossRef] [Green Version]
  59. Zuo, C. Regional Development and Poverty Reduction in Contiguous Destitute Areas (2011–2020). In The Evolution of China’s Poverty Alleviation and Development Policy (2001–2015); Springer: Berlin/Heidelberg, Germany, 2019; pp. 71–105. [Google Scholar]
  60. Zhou, Y.; Guo, L.; Liu, Y. Land consolidation boosting poverty alleviation in China: Theory and practice. Land Use Policy 2019, 82, 339–348. [Google Scholar] [CrossRef]
  61. Yu-rui, L.; Chang-li, B.; Zhi, C.; Xuan-he, L.; Yan-sui, L. Village classification system for rural vitalization strategy: Method and empirical study. J. Nat. Resour. 2020, 35, 02000243. [Google Scholar] [CrossRef]
  62. Ericksen, P.J. Conceptualizing food systems for global environmental change research. Glob. Environ. Chang. 2008, 18, 234–245. [Google Scholar] [CrossRef]
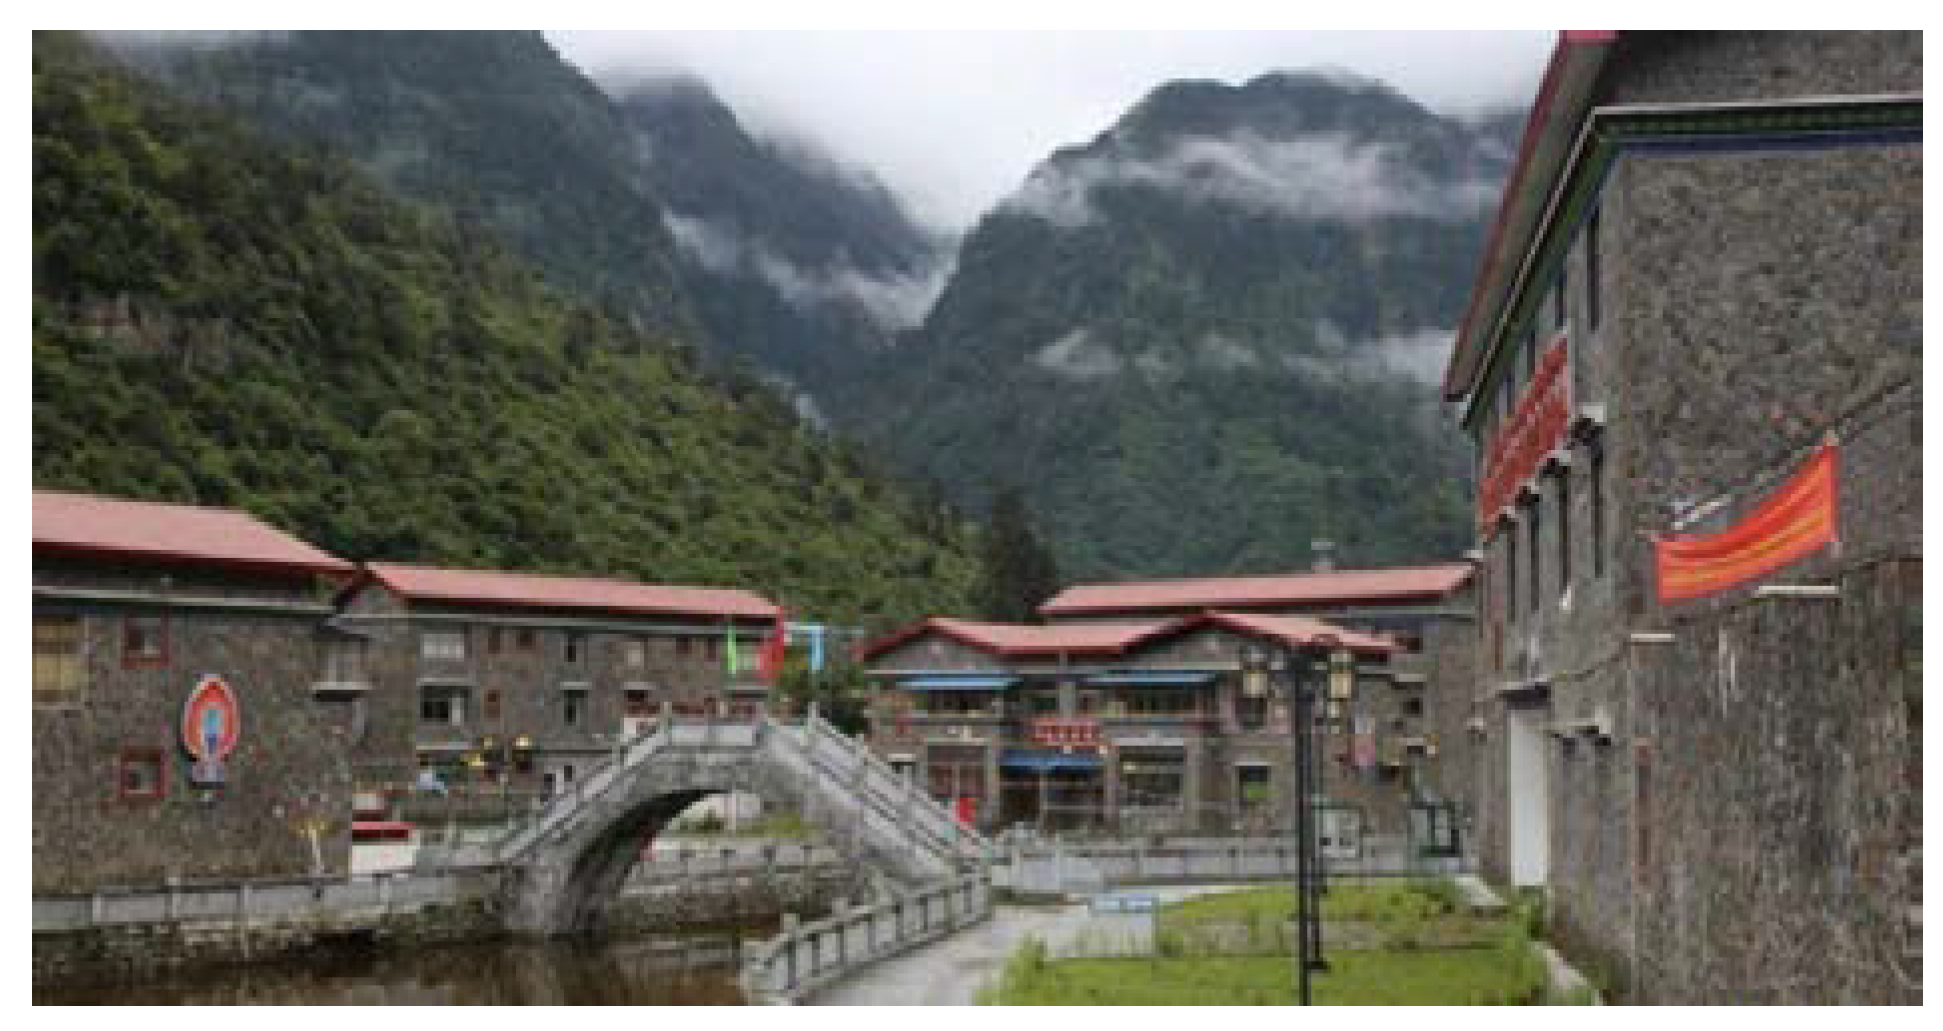
  63. Tibetan Villagers Escape Poverty, Protect Borders in Southwest China. Available online: https://leftreviewonline.com/english/international/tibetan-villagers-escape-poverty-protect-borders-southwest-china.html (accessed on 16 May 2022).
  64. The Rebirth of the Menluo Nationality. Available online: https://inf.news/en/travel/1f19973f41db63dcf65cad0257ffc62e.html (accessed on 15 May 2022).
  65. Chen, M.; Gong, Y.; Li, Y.; Lu, D.; Zhang, H. Population distribution and urbanization on both sides of the Hu Huanyong Line: Answering the Premier’s question. J. Geogr. Sci. 2016, 26, 1593–1610. [Google Scholar] [CrossRef]
  66. Deng, W.; Cheng, Y.-F.; Yu, H.; Peng, L.; Kong, B.; Hou, Y.-T. Spatio-temporal characteristics of population and economy in transitional geographic space at the southern end of “Hu Huan-yong Line”. J. Mt. Sci. 2022, 19, 350–364. [Google Scholar] [CrossRef]
  67. Zhao, J.; Zhang, Q.; Zhu, X.; Shen, Z.; Yu, H. Drought risk assessment in China: Evaluation framework and influencing factors. Geogr. Sustain. 2020, 1, 220–228. [Google Scholar] [CrossRef]
  68. Wilson, S.; Fesenmaier, D.R.; Fesenmaier, J.; Van Es, J.C. Factors for success in rural tourism development. J. Travel Res. 2001, 40, 132–138. [Google Scholar] [CrossRef]
  69. Zhang, P.; Zhao, Y.; Zhu, X.; Cai, Z.; Xu, J.; Shi, S. Spatial structure of urban agglomeration under the impact of high-speed railway construction: Based on the social network analysis. Sustain. Cities Soc. 2020, 62, 102404. [Google Scholar] [CrossRef]
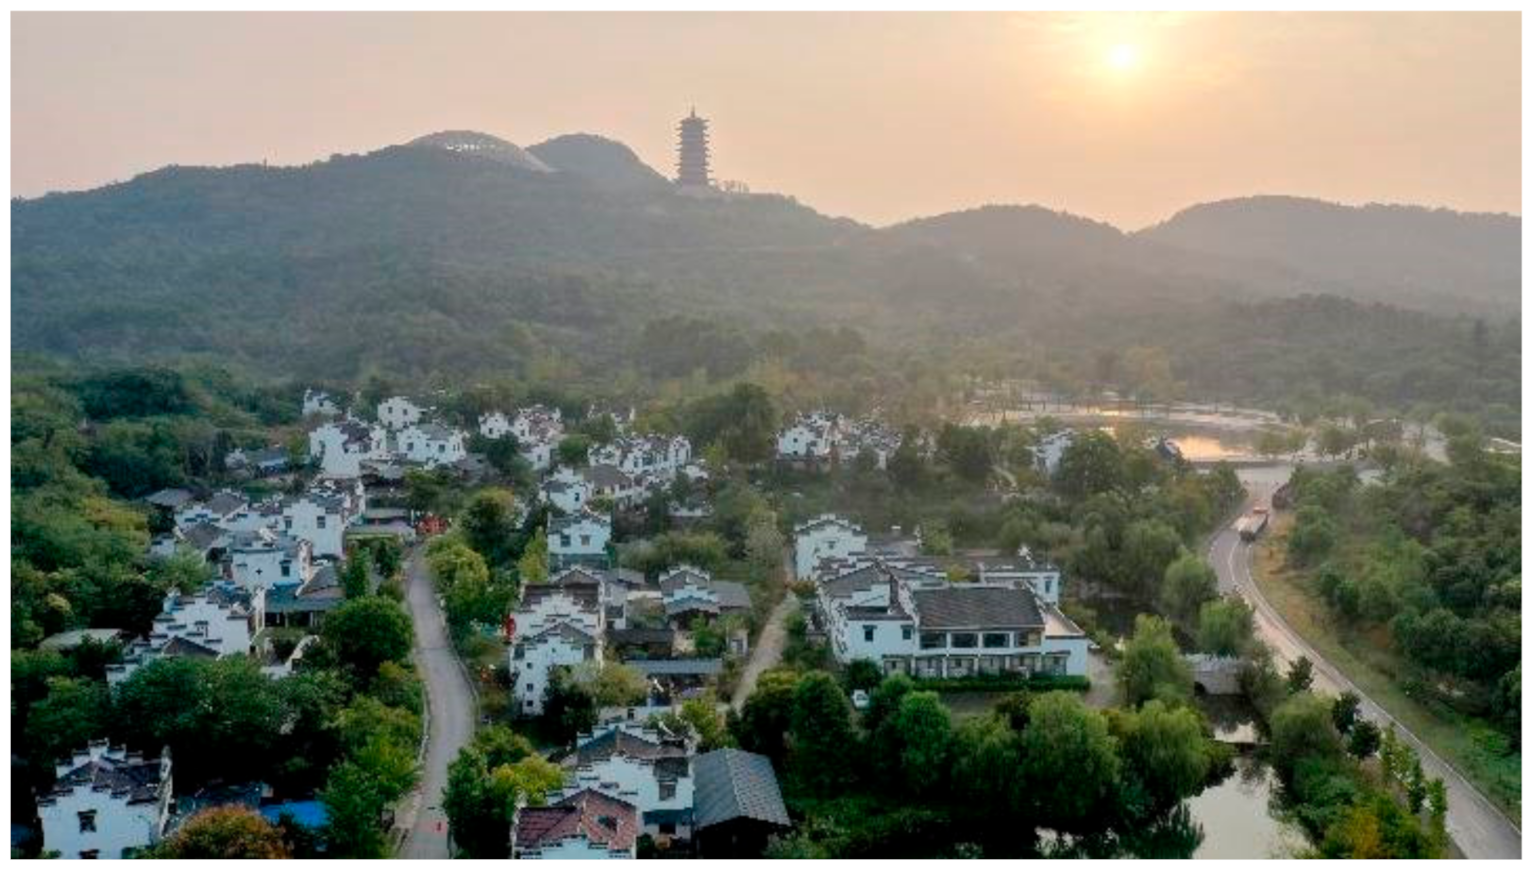
  70. Walking into the Beautiful Countryside—Thinking That the Dream Was Originally “in the valley/Guli”. Available online: https://www.sohu.com/a/426545864_267106 (accessed on 15 May 2022).
  71. Peng, B.; Li, Y.; Elahi, E.; Wei, G. Dynamic evolution of ecological carrying capacity based on the ecological footprint theory: A case study of Jiangsu province. Ecol. Indic. 2019, 99, 19–26. [Google Scholar] [CrossRef]
  72. Cai, Y. China’s below-replacement fertility: Government policy or socioeconomic development? Popul. Dev. Rev. 2010, 36, 419–440. [Google Scholar] [CrossRef]
  73. Lu, X.; Wang, G.; Zhu, C.; Chi, X. Mapping the Challenges to the Sustainable Operation of Suburban Villages in a Metropolis: A Comparative Case Study from the Lens of Three Stakeholder-Led Approaches. Land 2021, 10, 864. [Google Scholar] [CrossRef]
  74. Li, J.; Wang, Z.; Lai, C.; Wu, X.; Zeng, Z.; Chen, X.; Lian, Y. Response of net primary production to land use and land cover change in mainland China since the late 1980s. Sci. Total Environ. 2018, 639, 237–247. [Google Scholar] [CrossRef]
  75. Zhou, Z.; Jia, Z.; Wang, N.; Fang, M. Sustainable mountain village construction adapted to livelihood, topography, and hydrology: A case of Dong villages in southeast Guizhou, China. Sustainability 2018, 10, 4619. [Google Scholar] [CrossRef] [Green Version]
  76. Kang, B.; Deng, J.; Wu, Y.; Chen, L.; Zhang, J.; Qiu, H.; Lu, Y.; He, D. Mapping C hina’s freshwater fishes: Diversity and biogeography. Fish Fish. 2014, 15, 209–230. [Google Scholar] [CrossRef]
  77. Li, M.; Mo, D.; Mao, L.; Sun, G.; Zhou, K. Paleosalinity in the Tianluoshan site and the correlation between the Hemudu culture and its environmental background. J. Geogr. Sci. 2010, 20, 441–454. [Google Scholar] [CrossRef]
  78. Guo, F.; Jiang, G.; Yuan, D.; Polk, J.S. Evolution of major environmental geological problems in karst areas of Southwestern China. Environ. Earth Sci. 2013, 69, 2427–2435. [Google Scholar] [CrossRef]
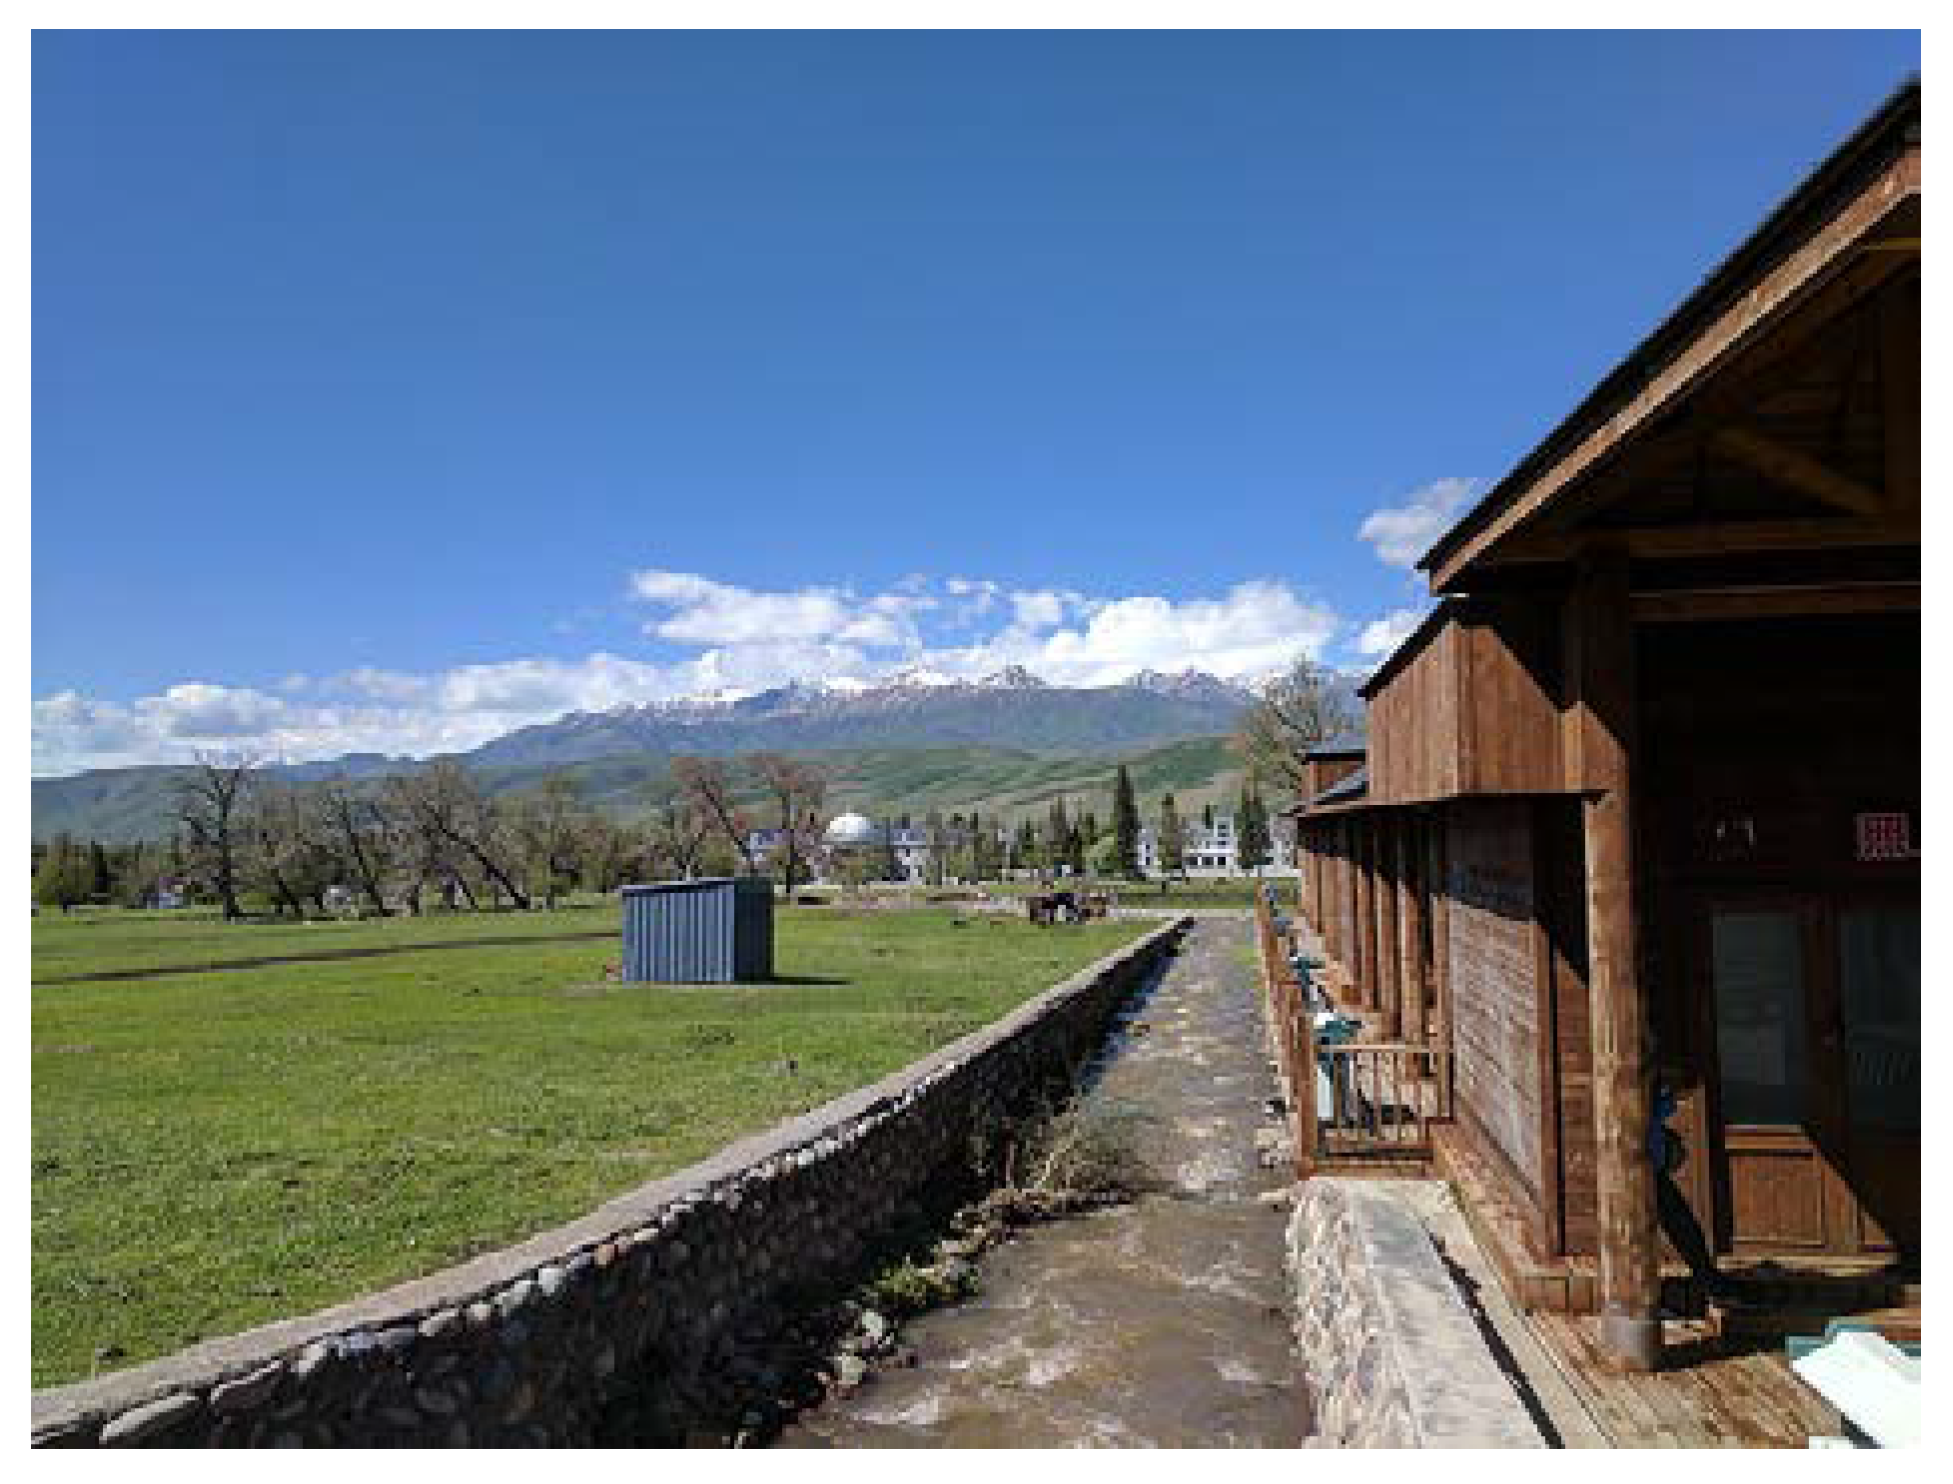
  79. Nalati Town. Available online: https://upload.wikimedia.org/wikipedia/commons/e/e8/%E9%82%A3%E6%8B%89%E6%8F%90%E9%95%87_%28IMG_20170512_164224%29.jpg (accessed on 15 May 2022).
  80. Yan, S.; Shan, Q.; Niu, H.-C.; Yang, W.-B.; Li, N.-B.; Zeng, L.-J.; Jiang, Y.-H. Petrology and geochemistry of late Carboniferous hornblende gabbro from the Awulale Mountains, western Tianshan (NW China): Implication for an arc–nascent back-arc environment. J. Asian Earth Sci. 2015, 113, 218–237. [Google Scholar] [CrossRef]
  81. Wang, L.-E.; Cheng, S.-K.; Zhong, L.-S.; Mu, S.-L.; Dhruba, B.G.; Ren, G.-Z. Rural tourism development in China: Principles, models and the future. J. Mt. Sci. 2013, 10, 116–129. [Google Scholar] [CrossRef] [Green Version]
  82. French, H.W. Everything under the Heavens: How the Past Helps Shape China’s Push for Global Power; Vintage: New York, NY, USA, 2017. [Google Scholar]
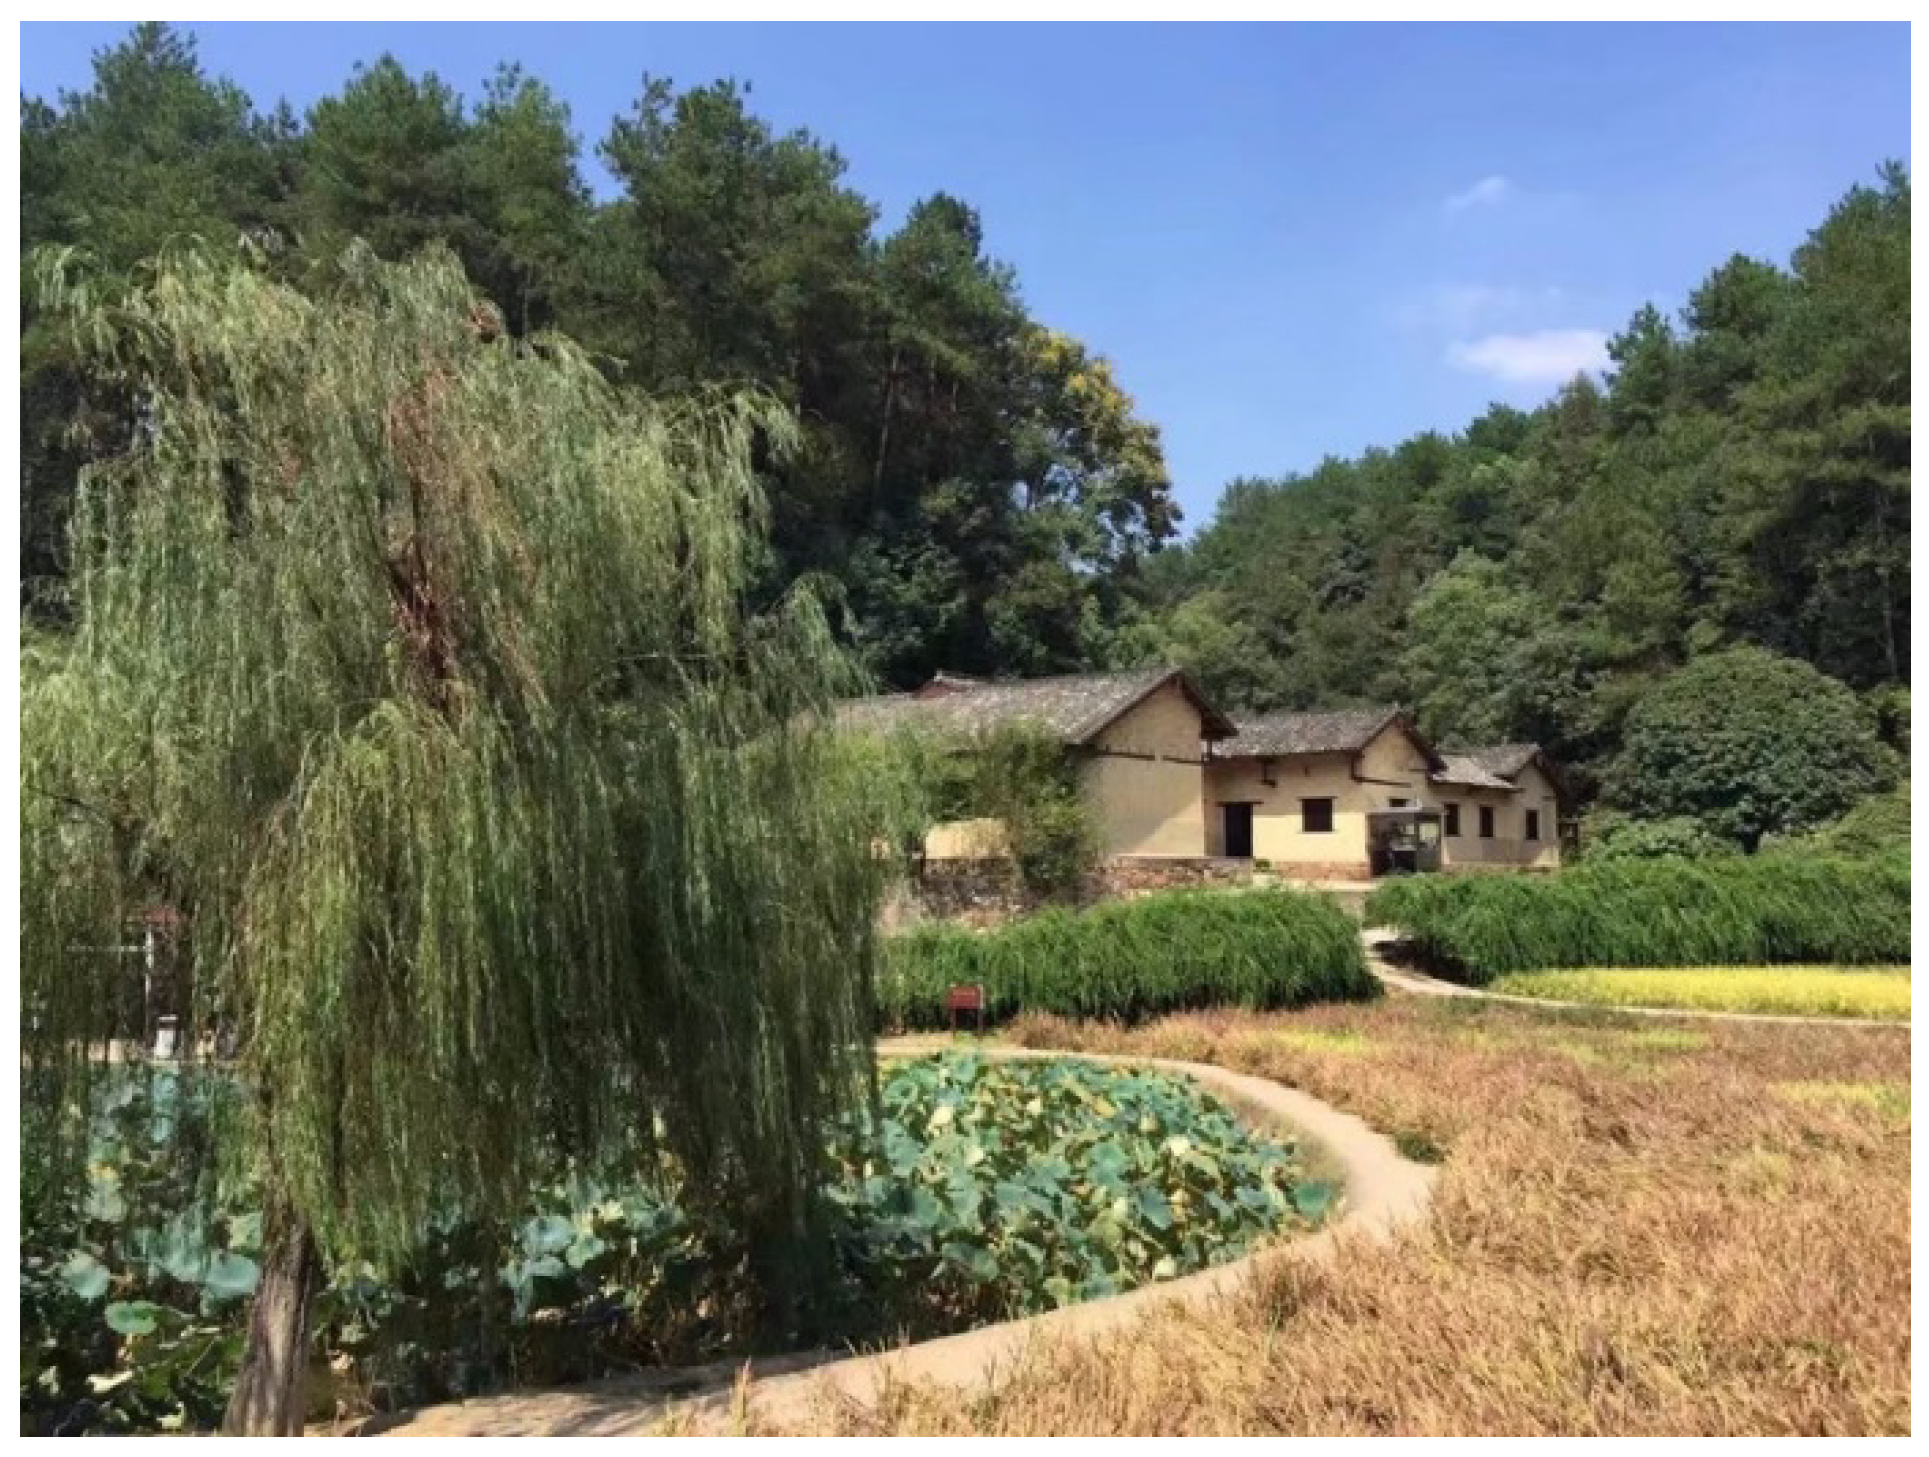
  83. Former Residence of Mao Zedong, Shaoshan. Available online: http://m.tuniucdn.com/fb2/t1/G4/M00/D6/8A/Cii_J1oKltGIIblHAASdJ4otMM8AADQ8QGAn7gABJ0_907_w800_h0_c0_t0.jpg (accessed on 27 May 2022).
  84. Hunter, W.C. China’s Chairman Mao: A visual analysis of Hunan Province online destination image. Tour. Manag. 2013, 34, 101–111. [Google Scholar] [CrossRef]
  85. Denton, K.A. Museums, memorial sites and exhibitionary culture in the People’s Republic of China. China Q. 2005, 183, 565–586. [Google Scholar] [CrossRef]
  86. Zhou, M.; Yan, L.; Wang, F.; Lin, M. Self-congruity Theory in Red Tourism: A Study of Shaoshan City, China. J. China Tour. Res. 2022, 18, 46–63. [Google Scholar] [CrossRef]
Figure 1. Geographic distribution of NRTTC.
Land 11 00812 g001
Figure 2. Proportion of categories and subcategories of the NRTTC.
Land 11 00812 g002
Figure 3. Regional distribution of NRTTC tourism resource categories.
Land 11 00812 g003
Figure 4. Spatial kernel density distribution of the NRTTC.
Land 11 00812 g004
Figure 5. The Lorenz curve of NRTTC.
Land 11 00812 g005
Figure 6. Town supported by the policy to develop rural tourism, Mamamenba, NRTTC.
Land 11 00812 g006
Figure 7. The spatial distribution of NRTTC as divided by Hu Huanyong’s population boundary.
Land 11 00812 g007
Figure 8. Distribution of the NRTTC in the seven geographical divisions with population and GDP.
Land 11 00812 g008
Figure 9. A rural tourist town with balanced social resources: Guli Street, NRTTC.
Land 11 00812 g009
Figure 10. Grassland and town, Nalati, NRTTC.
Land 11 00812 g010
Figure 11. Former residence of Mao Zedong, Shaoshan, NRTTC.
Land 11 00812 g011
Figure 12. Main research framework.
Land 11 00812 g012
Table 1. Statistics on the regional distribution of the NRTTC.
No.Administrative RegionNumber of TownsProportion (%)Cumulative Proportion (%)
1Xinjiang66.006.00
2Jiangsu44.0010.00
3Hubei44.0014.00
4Guizhou44.0018.00
5Zhejiang44.0022.00
6Sichuan33.0025.00
7Shandong33.0028.00
8Jiangxi33.0031.00
9Heilongjiang33.0034.00
10Liaoning33.0037.00
11Anhui33.0040.00
12Hebei33.0043.00
13Shanxi33.0046.00
14Beijing33.0049.00
15Shaanxi33.0052.00
16Chongqing33.0055.00
17Hunan33.0058.00
18Yunnan33.0061.00
19Henan33.0064.00
20Gansu33.0067.00
21Fujian33.0070.00
22Tianjin33.0073.00
23Shanghai33.0076.00
24Tibet33.0079.00
25Jilin33.0082.00
26Guangdong33.0085.00
27Qinghai33.0088.00
28Ningxia33.0091.00
29Guangxi33.0094.00
30Inner Mongolia33.0097.00
31Hainan33.00100.00
32Hong Kong00.00100.00
33Macao00.00100.00
34Taiwan (R.O.C)Not availableNot available100.00
Table 2. Kernel density analysis of NRTTC.
Density ClassificationAdministrative RegionKernel Density Zone
Core density* Beijing0.52–3.21
Tianjin0.17–1.79
High density* Jiangsu0.17–1.79
Anhui0.17–1.79
Shanghai0.52–1.79
Zhejiang0.17–1.04
Hubei0.17–1.04
Jiangxi0.17–1.04
* Henan0.17–1.79
Shaanxi0.17–1.79
Hebei0.17–1.04
Medium density* Sichuan0.17–1.04
Chongqing0.17–1.04
Shanxi0.17–1.04
* Hunan0.17–1.04
Fujian0.17–1.04
Guangdong0.17–1.04
* Gansu0.17–1.04
Qinghai0.17–0.52
* Ningxia0.17–1.04
Inner Mongolia0.17–1.04
* Liaoning0.17–1.04
Jilin0.17–1.04
Heilongjiang0.17–1.04
* Guizhou0.17–1.04
Yunnan0.17–1.04
* Hainan0.17–1.04
* Guangxi0.17–1.04
* Xinjiang0.17–1.04
Low density* Tibet0.17–0.52
* Shandong0.17–0.52
* Represents the core of the zone.
Table 3. Spatial indices of the NRTTC based on function calculations.
No.FunctionIndex
1Kernel density estimation0.17–3.21
2Imbalance index0.15
3Gini coefficientG = 0.97, C = 0.03
Table 4. Statistical distribution of rural tourist towns in the seven geographical regions of China.
Administrative Division Number of Towns Proportion (%) Cumulative Proportion (%)
East
(Shanghai, Jiangsu, Zhejiang, Anhui, Jiangxi, Shandong, Fujian, Taiwan (R.O.C.))
2323.0023.00
Northwest
(Shaanxi, Gansu, Qinghai, Ningxia, Xinjiang)
1818.0041.00
Southwest
(Chongqing, Sichuan, Guizhou, Yunnan, Tibet)
1616.0057.00
North
(Beijing, Tianjin, Hebei, Shanxi, Inner Mongolia)
1515.0072.00
Central
(Henan, Hubei, Hunan)
1010.0082.00
Northeast
(Liaoning, Jilin, Heilongjiang)
99.0091.00
South
(Guangdong, Guangxi, Hainan, Hong Kong, Macao)
99.00100.00
Publisher’s Note: MDPI stays neutral with regard to jurisdictional claims in published maps and institutional affiliations.

