Abstract
The concept of Ecosystem Service Value (ESV) is indispensable when balancing the need for economic development and ecological protection, because it can clarify the ecological assets and values provided by a region. The study of spatio-temporal variation of ESV in ecologically fragile regions is helpful when attempting to restore regional ecological function. Taking the ecologically fragile area in Western Jilin as an example, this paper analyzes the spatial distribution and spatial-temporal evolution characteristics of the integrated ecosystem service value (IESV) in the study area by constructing an IESV model. The drivers of spatial differentiation of integrated ESV in the study area and the mechanisms controlling the interaction between various factors are examined using the geographical detector technique. The results showed that the areas of high value with integrated ecosystem services in Western Jilin were mainly distributed in protected areas, and that there has been a downward trend in the past 23 years. Moreover, the explanatory ability of NDVI (Normalized Difference Vegetation Index) was strongest of any of the natural factors considered. Among the socio-economic factors, the explanatory power of the human activity index (HAI) was greatest. Additionally, the interaction between natural factors and socio-economic factors exhibits synergistic enhancement, which affects the degree of spatial differentiation of IESV. The spatio-temporal variation in IESV is the result of the joint action between human activities and natural factors. This study can provide a scientific basis for the optimization of ecosystems and the development of ecological security in Western Jilin.
1. Introduction
Ecosystem Services (ESs) are the foundation of human survival and development, and are also irreplaceable natural resources and natural assets [1]. ESs are the benefits humans receive from functioning ecosystems, directly or indirectly [2]. ESs not only provide food, pharmaceuticals, and other materials that humans use, but they also create and sustain the Earth’s life support systems, create the environmental conditions necessary for survival, and supply leisure, entertainment, and aesthetic enjoyment for people [3,4,5,6]. Effective ESs play an important role in maintaining regional ecological balance and regional ecosystem health, ensuring territorial ecological security and coping with global climate change [7]; however, according to the Millennium Ecosystem Assessment (MEA), around 60% of the ecosystem services studied have been degraded over the past 50 years [8]. Since the late 1970s, economic reforms and opening-up policies have led to a rapid rural–urban transition and large disparities in economic development across regions in China [9]. This rapid transition has placed tremendous pressure on ecosystems, especially in ecologically fragile areas. The deterioration of water and air quality, deforestation and grassland degradation, or even the loss of service functions of regional ecosystems, can lead to various chain reactions such as climate change, soil erosion, and biodiversity decline, which directly threaten the health and sustainable development of human society and regional and global ecological security; therefore, it is of great significance to evaluate the value of regional ecosystem services and study their temporal and spatial evolution and mechanisms controlling spatial differentiation in order to maintain and improve regional ecosystem services and ensure regional ecological security.
Ecosystem Service Value (ESV) is derived by assessing ESs’ contributions to sustainable wellbeing [10,11]. In 1997, Costanza et al. proposed a number of ecosystem service types and a system to determine their values, providing an effective way to quantitatively evaluate the benefits that humans derive from ecosystems, and coordinate economic development and ecological protection. The United States and Europe have successively carried out the evaluation of the value of ecosystem services in the region [12]. The subject is of great interest within the academic community, and the MEA Project has further promoted the development of ESs research on a global scale. Based on Costanza’s evaluation system, and according to the characteristics of different ecosystems in China, Xie Gaodi, a Chinese scholar, conducted a questionnaire survey on 600 ecologists in 2002 and 2007, respectively. Then, he proposed an equivalent table of ESV in China, along with a correction method (biomass correction method) to take account of the current situation in different regions [13]. This has been widely used in evaluations and related research into ecosystem service function value in China [14]. With the continuous development of ESV calculation methods, approaches based on existing data have emerged, such as the InVEST and GUMBO models [15,16]. Of these, the InVEST model is widely used in many countries and regions because of its user-friendly interface, simple parameter acquisition, and easy data input [17,18]; however, the indirect calculation method based on the value evaluation system and the direct calculation method based on an integrated model have certain limitations [19], so researchers are increasingly turning to the construction of more integrated models. Wu et al. used ESV to represent habitat quality, standardized the range between that based on the value coefficient and the habitat quality based on InVEST, and generated integrated habitat quality evaluation results for the growth triangle of an urban agglomeration, using a multiplicative approach [20]. Peng et al. then integrated the ecosystem service value evaluation model, InVEST habitat quality evaluation model, and habitat quality correction coefficient to construct an integrated model to study integrated ecosystem services in Huangshan city from 1987 to 2017 [21]. The ESV of the study area calculated using an equivalent coefficient method based on a land resource background was used as the foundation, and a habitat quality assessment based on external threat factors was used as the biodiversity correction coefficient to construct the integrated model. This approach not only considers the actual land use situation in the study area, but also the impact of external sources of threat to ecosystem services, so that the evaluation results not only address the benefits for human beings but also nature, which enhances the accuracy of the evaluation results [21]; however, generally speaking, there are relatively few examples of the evaluation of ESV and the analysis of its spatio-temporal variation in ecologically fragile regions using integrated models. Most previous studies examining the drivers of spatial differentiation of ecosystem service functions focus on qualitative and correlation analyses [7]. Su and Fu used correlation analysis and found a positive relationship between the difference in sediment export and water yield, with negative correlations between the difference in NPP and water yield [22]. In recent years, with the proposal of the geographic detector method [23], a new understanding of the factors responsible for ecosystem service function values and the mechanisms controlling interactions between factors has been developed. The approach has been applied using many scales, such as important natural areas [24] and watersheds [25]. On the whole, there have been few studies that have used an integrated model to assess ESV in important ecologically fragile regions and applied the geographic detector method to study the spatial differentiation of ESV.
In recent years, in Western Jilin, a typical ecologically fragile region in China, soil desertification, expansion of saline alkali land, grassland degradation, and wetland water shortages have become increasingly serious [6]. The deterioration of the natural environment is leading to the continuous degradation of ecosystem service functions in Western Jilin. Taking the ecologically fragile area in the west of Jilin Province as an example, the objectives of our study included the following: (1) constructing an integrated model to study the characteristics of spatial differentiation of the IESV over the past 23 years; (2) using spatial analysis to analyze the temporal and spatial evolution of IESV; (3) exploring the spatial differentiation mechanisms of IESV by using the geographic detector method. In the discussion section, we discuss the reasons for the spatio-temporal evolution of IESV, habitat degradation in the study area, and the prospect of future research. The results of this study are intended to provide a scientific foundation for decision-making in relation to ecological environment protection, ecosystem service restoration, and regional sustainable development in the ecologically fragile region of the Western Jilin province.
2. Materials and Methods
2.1. Study Area
Western Jilin (43°59′ N–46°18′ N, 121°38′ E–126°11′ E) is located in the east of the Horqin Grassland and southwest of the Songnen Plain, covering an area of about 46,800 km2. The administrative divisions comprise Songyuan City (Ningjiang District, Qianguo County, Qian’an County, Changling County, Fuyu City) and Baicheng (Taobei District, Taonan City, Da’an City, Zhenlai County, Tongyu County) (Figure 1). Western Jilin has a semi-arid or semi-humid climate. Due to the climate and geological structure, there are a large number of lakes in the study area, of which nearly 30 are quite sizeable, including Moon Bubble, Chagan Lake, and Dabusupao, with a surface area of thousands of hectares. More than 60% of the catchment area of Jilin Province and more than 90% of the catchment area of the Songhua River Basin drains via Songyuan City in the west of Jilin Province, with a total runoff of 39.774 billion m3 and a total drainage area of 8012.74 km2 [26]. In recent years, severe overgrazing, wasteland reclamation and ecosystem destruction associated with rapid population growth have resulted in desertification, alkalization, and grassland degradation [6]. The expansion of saline alkali land has exceeded 1500 km2, the reduction of wetland has been more than 1000 km2, and the reduction in grassland has reached more than 3000 km2.
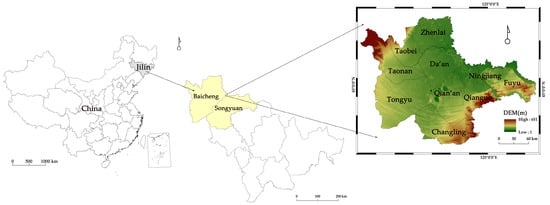
Figure 1.
Locations of study area.
2.2. Data Sources
The land use data for Western Jilin in 1995, 2000, 2005, 2010, and 2018 was obtained from the Resource and Environment Science and Data Center website (http://www.resdc.cn/, accessed on 15 June 2020). The land use data were remote sensing interpretation data with a spatial resolution of 30 m × 30 m. When calculating ESV based on land resources in Western Jilin, land use types were grouped into seven categories (forest land, grassland, wetland, water, desert, cultivated land, and construction land), in accordance with the classification of Xie et al. (Table 1). The national grain unit price data are from the cost and income of agricultural products in China Rural Statistical Almanacs. Annual average temperature and precipitation data for the cities of Baicheng and Songyuan were from Jilin Provincial Statistical Almanacs. The boundary data for inland wetland nature reserves and wetland parks at all levels are from land survey data.

Table 1.
Equivalent land use categories between raw data and Xie’s method.
In this study we selected 10 indicators as driving factors of spatial differentiation in IESV, including NDVI, net primary production (NPP), average annual precipitation (precipitation), average annual temperature (temperature), soil type, soil erosion, population density, land average gross domestic product (GDP), and HAI. The data sources and the results of the raw data processing are shown in Table 2 and Figure 2. The basis for the selection of indicators was explained in Section 2.3.3.
Table 2.
The indictor system of geographic detector analysis.
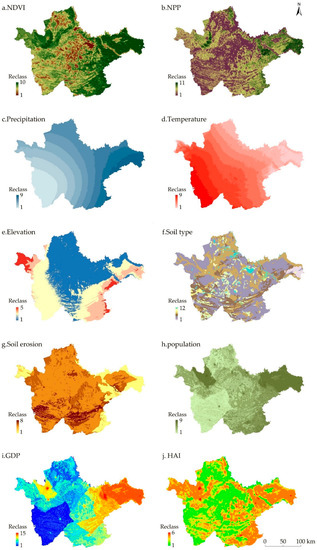
Figure 2.
Spatial distribution of driving factors.
2.3. Methods
This study quantitatively portrayed the spatial pattern of ESs and their evolutionary characteristics in Western Jilin, a typical ecologically fragile region in China, by constructing an IESV model. The geographical detector model was used to investigate the driving factors of the spatial distribution patterns of IESV in Western Jilin, taking into account both natural and socio-economic factors.
2.3.1. Estimation of Integrated Ecosystem Service Value in Western Jilin
The background of regional land resources is the basis for providing ecosystem services, and biodiversity is closely related to the production of ecosystem services. The InVEST model takes habitat quality as a reflection of biodiversity [15]. Integrating the ecosystem service value, based on the background of land resources and the habitat quality value, based on external threat factors to build an integrated ecosystem service evaluation model, is helpful for comparing the spatial patterns of biodiversity and ecosystem services, and to identify areas that are beneficial for both natural ecological protection and human economic development.
(1) Estimation of ecosystem service value based on land resource background.
The estimation of ESV, based on land resource background, uses the equivalent coefficient method. The ESV equivalent factor refers to the potential of the relative contribution of ecosystem services generated by the ecosystem, which is defined as the economic value of annual natural grain yield of farmland with a national average yield of 1 hm2 [13]. Through relevant research and analysis, it has been determined that the economic value of an ESV equivalent factor is equal to 1/7 of the national average grain yield market value in that year [13,14]. In this paper, the unit price of ecosystem services was generated using the average price data for three kinds of grain (rice, wheat and maize) in 2005. The average unit price for the three grains was 8214 yuan × hm−2 × year−1. Moreover, the economic value of the ESV equivalent factor was calculated to be 1173.43 yuan × hm−2 × year−1. Referring to the research of Costanza et al. and Xie et al. the ESV equivalent coefficient per unit area of each land ecosystem was obtained (Table 3), and the total ESV for Western Jilin was finally determined by adding together the ESVs of each land ecosystem. Construction land does not provide ecosystem services due to its impermeability and other attributes; therefore, in this study, the ESV equivalent for construction land is regarded as 0.
Table 3.
Equivalent value per unit area of ecosystem services (yuan × hm−2 × year−1).
The formula used to calculate ESV was
where Ai is the area of the i-th land ecosystem (hm2) and VCi is the ecosystem services value per unit area of the i-th land ecosystem [6,28,29].
(2) Habitat quality assessment based on external threat factors.
Habitat quality generally decreases with an increase in nearby human land use intensity [20]. We used the InVEST model to map and assess the habitat quality in the study area. InVEST is a spatially explicit model that uses habitat quality as a proxy for biodiversity associated with different land use and land cover (LULC) categories [30]. As reported by Terrado et al. (2016; p. 64), “the model is based on the hypothesis that areas with higher habitat quality support higher richness of native species, and that decreases in habitat extent and quality lead to a decline in species persistence” [31]. Habitat quality is directly related to the suitability of each LULC class to provide habitats to support biodiversity [32]. The habitat quality ranges between 0 and 1, where 1 indicates LULC categories with the highest suitability for species [17]. Threat factors and the habitat type sensitivity coefficient need to be set for model operation. Construction land (including urban land, rural residential areas, and industrial and mining land) is the area with the highest concentration of human activities, and therefore, it has the greatest impact on habitat quality. Cultivated land is also associated with concentrated human activities, so these two land types are generally set as the threat sources affecting regional biodiversity. The Western Jilin province is a typical ecologically fragile area, and land salinization and desertification have a great impact on the regional habitat quality; therefore, in addition to construction land and cultivated land, saline alkali land and sandy land were treated as threat factors. The formula used to assess habitat quality was
where, Dxy is the habitat degradation degree (degradation risk index) of grid x (grid x and grid y is the basic unit of raster data) in habitat type j; R is the number of threat sources; Wr is the weight of threat source r; Yr is the number of cells containing threat source r; ry is the threat value of grid y; irxy is the threat value of grid y on grid x; βx is the accessibility of each threat source to grid x of each habitat type (in the area protected by law, the value is greater than 0 but less than 1, the stricter the protection, the smaller the value; in other areas, it is 1); Sjr is the sensitivity of habitat type j to threat source r; dxy is the linear distance between grid x and grid y; drmax is the maximum distance to threat source r. Qxj is the habitat quality index of each grid cell containing habitat j; Dxj is the threat level in each grid cell containing habitat type j; k is the half-saturation constant, taking half of the maximum habitat degradation degree (obtained by running the model once); z is the default parameter of the model; Hj is the habitat suitability of habitat type j, having a value between 0 and 1, where 1 represents the best land use category for species conservation [17,33].
The relevant parameters in the model need to be adjusted in light of the specific situation in Western Jilin. The maximum stress distance and weight of each threat source, habitat suitability of different habitat types, and sensitivity to threat factors were assigned on the basis of the examples in the InVEST model and relevant studies (Table 4 and Table 5). To determine the accessibility of degradation sources, six wetland nature reserves and nine wetland parks in Western Jilin were selected, and their accessibility parameters were assigned according to the management and control requirements of different functional zones of various protected areas. The core area of nature reserves and the conservation, restoration, and reconstruction areas in wetland parks were assigned a value of 0; the buffer area of each nature reserve was allocated a value of 0.2; the experimental area within any nature reserve, the publicity and display area, areas required for support activities, and the management service area of wetland parks were assigned a value of 0.6; and the Urban Wetland Park (Zhenlai around the city Wetland Park) was assigned a value of 0.8.
Table 4.
Threat source and its maximum threat distance, weight, and attenuation type.
Table 5.
Habitat suitability and its relative sensitivity to different threat sources.
(3) Calculation of integrated ecosystem service value.
The formula used to calculate the integrated ecosystem service value in the study area was as follows:
where, Q is the integrated ecosystem service value in the study area; Q1 is the ESV based on the land resource background; Q2 is the habitat quality coefficient based on external threats. This method not only considers the actual situation in relation to land use in the study area, but also takes into account the impact of ESs on external threat sources. In order to facilitate an easy comparison of the changes in IESV, according to relevant studies [21], the value was divided into five levels: low (0), sub-low (0–1000), intermediate (1000–2000), sub-high (2000–3000) and high (>3000).
2.3.2. Analysis of Temporal and Spatial Variation Characteristics of IESV in Western Jilin
Trajectory analysis is often used to analyze the temporal and spatial transfer characteristics of land use [34]. By using statistical spatial analysis of the IESV trajectory for the study area, we can identify the spatio-temporal characteristics of IESV for a defined time period. A change of direction in the time series can be represented by different codes; the letters or numbers of each code represent the different levels of IESV during different time periods. Based on the IESV classification system for the study area, “1” represents “low level”, “2” represents “sub-low level”, “3” represents “intermediate level”, “4” represents “sub-high level”, and “5” represents “high level”. As there are fewer than 10 categories, the trajectory codes for each category can be calculated using the following formula, in the “Raster Calculator” mode within ArcGIS [35]:
where Tij is the trajectory code from raster i to j; n is the number of time nodes; and G1, G2,…, and Gn are the IESV levels codes for each time node. When the number of IESV levels is more than 10, a trajectory code is usually replaced by a letter. In this study, the IESV change trajectory was divided into three types: unchanged (e.g., “11”, “2//2”), low→high (e.g., “12”, “13”) and high→low (e.g., “21”, “31”).
2.3.3. Geographical Detection of Spatial Differentiation of Integrated ESV in Western Jilin
The spatial differentiation of integrated ESV is the spatially representative result of the complex coupling of natural, cultural, and socio-economic factors [7]. The geographical detector technique, proposed by Wang et al. does not need a linear hypothesis to reveal the driving factors behind spatially stratified heterogeneity [36,37]. The principle is that if the sum of the variances of subareas which are classified by the factor is less than the variance of the whole area, spatially stratified heterogeneity exists, and the q-statistic can be used to detect influencing factors [23,37]. The geographical detector technique includes a factor detector, interaction detector, risk detector, and ecological detector. Factor detection can identify the extent to which each driving factor explains the spatial differentiation of analytical variables. Interaction detection can identify whether the interaction between different drivers increases or decreases the explanatory power of analytical variables [23]. The formulae used were as follows:
where, h = 1,…, L is the stratification of variable y or factor X; Nh and N are the number of units in layer h and the whole area, respectively; σh2 and σ2 are the variance of layer h and the Y value for the whole region; SSW and SST are the sum of intra layer variance and total variance of the whole region, respectively. The value range of q is [0, 1], and the larger the value, the more obvious the spatial differentiation of Y; if the stratification is generated by the independent variable X, the greater the q value, and the stronger the explanatory power of the independent variable X to the attribute Y, and vice versa.
The spatial pattern of ESV is formed under the combined effect of multiple driving factors [38]. In this study, 10 factors were selected from both natural and socio-economic factors to detect the mechanism of the formation of IESV spatial patterns in western Jilin. Natural elements underpin the spatial pattern of regional ESs. We selected 7 factors mainly from 4 aspects: vegetation factor, climate factor, topography factor, and soil factor. The ability of the same land use type to provide ESs varies depending on the vegetation cover [21], so this study selected NDVI and NPP to detect the influence of vegetation factors on the spatial pattern of ESs. Climatic factors are the most direct and sensitive factors in the evolution of regional ecosystem services, and climatic factors can influence the evolution of regional ecosystem quality at any spatial or temporal scale [39]. In this paper, average annual precipitation and average annual temperature are selected to represent climate factors. Topography factors are one of the decisive factors in the formation of spatial and temporal distribution patterns of ecosystem quality [38]. In this study, elevation was chosen to detect the influence of topography factors on the spatial distribution patterns of ESV. Soil conditions are related to the generation of ESs [40], and soil types and soil erosion levels were selected to characterize regional soil conditions. Socio-economic factors are the most dynamic factors influencing the evolution of the ecological environment. In this paper, we selected population density and land average GDP, HAI, to reflect human socio-economic activities.
Based on the ArcGIS10.6 platform, the study area was spatially gridded and sampled by 3 km × 3 km, generating a total of 5200 sampling points. Each driving factor was sampled using the ArcGIS10.6 multi-value extraction to point function, and sample point values were imported into the geographical detector to produce the results.
3. Results
3.1. Spatial-Temporal Variation Characteristics of IESV in Western Jilin
Using the method described, we derived the IESV for Western Jilin. Figure 3 and Figure 4, respectively, show the spatial distribution of IESV in Western Jilin and the proportion of the area of each level. The results show that the regions with a high IESV are mainly located in Chaganhu, Momoge, Dabusu, Hada Mountain, and Sanjiangkou, whereas the regions with low values are mainly located in central towns and sandy areas. The sub-low level has the highest coverage, at about 85% from 1995 to 2018, and the intermediate level has the lowest coverage, at less than 0.01% in 23 years. The proportion of high-level areas decreased from 8.17% in 1995 to 4.08% in 2010, with a slight increase in 2018. Most of the high-level areas are located in nature reserves. In 1995, large high-level areas not in nature reserves were distributed in the middle of the study area, but they have been significantly reduced over the past 20 years; therefore, more nature reserves should be designated, high-value areas should be included within nature reserves, and the areas with high ecological values should be protected by legislation in order to reduce interference resulting from human development and exploitative activities.
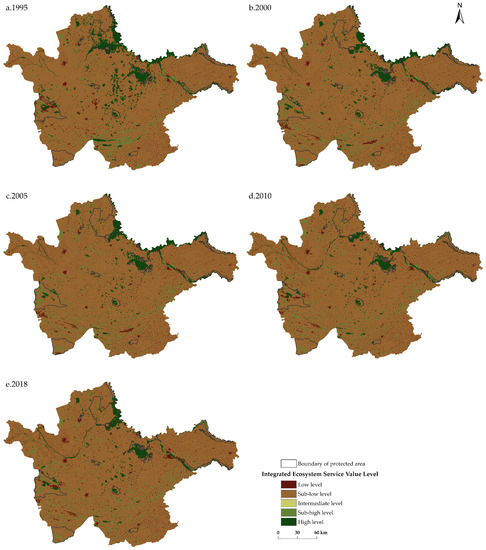
Figure 3.
Spatial distribution characteristics of IESV from 1995–2018.
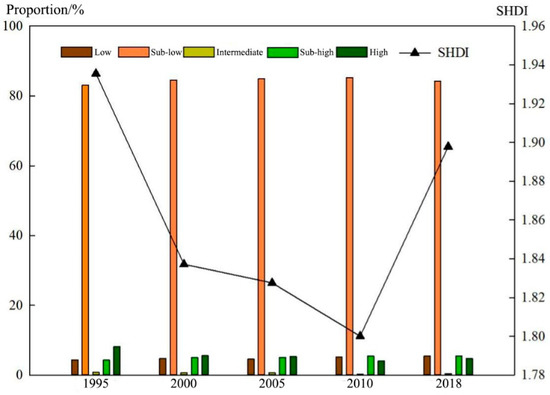
Figure 4.
Area proportion of each level of IESV from 1995–2018.
Shannon’s diversity index (SHDI) can be used to describe landscape heterogeneity and reflect land use richness [41]. Here, this was calculated by fragstats4.2. SHDI in Western Jilin continued to decrease from 1995 to 2010 and increased in 2018. The land use in the study area was least diverse in 2010, and was most diverse in 1995, with a relatively high degree of land fragmentation. As can be seen from Figure 4, the variation in SHDI exhibited the same trend as that of high level IESV. During 1995–2010, construction land and saline alkali land in Western Jilin expanded greatly, the degree of land fragmentation was low, the land use became less varied, and the area of high-level IESV kept decreasing. From 2010 to 2018, the Jilin Province began to pay attention to the protection of the natural environment, focusing on the restoration of wetlands and the treatment of saline alkali land. During this period, the degree of land fragmentation in Western Jilin increased, the land use structure became more acceptable, and areas with high-level IESV began to increase.
3.2. Analysis of Temporal and Spatial Variation Characteristics of IESV in Western Jilin
As can be seen from the IESV spatial change data for Western Jilin, IESV change was more obvious during 1995–2000 and 2005–2010 (Figure 5 and Table 6). During 1995–2000, the unchanged area accounted for 89.84% of the total, and the area of change accounted for 10.16%, of which the transfer from high to low level was greatest, accounting for 6.07%. During this period, the low value area increased at the expense of high value land and there was spatial agglomeration, which occurred in the southern central part of the study area, and near the edge of the Momoge reserve. The change from low value to high value land mainly occurred in the southwest of the study area and spread around the Xianghai nature reserve. From 2005 to 2010, the unchanged area accounted for 92.14% of the total area, and the change from high value to low value land accounted for 4.66% of the area, which was higher than the 3.19% change from low value to high value. Most of the change occurred in the southeast of the Momoge reserve, the Ningjiang district, Fuyu city, and the boundary with Heilongjiang Province. The area of IESV change was lowest between 2000 and 2005, but the low-to-high change accounted for a smaller area than the high-to-low change. From 2010 to 2018, the area changing from low value to high value exceeded the area changing from high value to low value. From the perspective of spatial distribution, there is a large area of increased IESV in the Momoge reserve, which shows that the Province focused on ecological restoration in Western Jilin during this period. The implementation of wetland restoration and returning farmland to wetland has played a significant role in improving the ecological quality in Western Jilin.
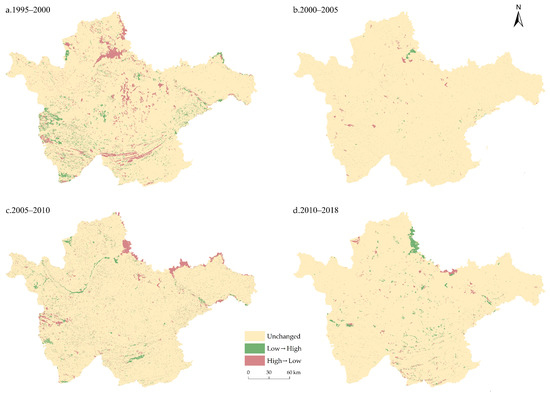
Figure 5.
Spatial distribution of IESV change from 1995–2018.
Table 6.
Area of IESV change (km2, %).
3.3. Analysis of the Driving Factors of Spatial Differentiation of IESV in Western Jilin
3.3.1. Factor Detector Analysis Based on the Geographical Detector Method
Spatial differentiation is the manifestation of the complex coupling process of natural and socio-economic factors. Human beings can comprehend and cognize natural phenomena through the analysis of spatial data [7]. In this study, we employed the factor detector component of the geographical detector technique in order to evaluate the effect of determinants on the spatial differentiation of IESV. Taking the intermediate year of the study (2005) as an example, covariates (Table 2) were selected to explore the contribution of various natural and socio-economic driving factors to the spatial differentiation of the dependent variable, IESV.
Using the geographical detector technique, we then calculated the power of determinant (q) values. As shown in Figure 6, the q value of the factors was in the range 0.0062 to 0.1263. It can be seen that NDVI, soil type, and HAI contributed more to the spatial differentiation of IESV in Western Jilin, whereas the contribution of the soil erosion degree and elevation was relatively small. The order of factor q statistics was NDVI > soil type > HAI > population density > land average GDP > NPP > precipitation > temperature > soil erosion degree > elevation. The explanatory power of NDVI and soil type, with respect to the spatial differentiation of IESV, was more than 10%, and these were the most significant factors. The explanatory power of HAI, population density, and land average GDP were also relatively high, meaning that they are important factors affecting the spatial differentiation of IESV in Western Jilin. NPP, precipitation, and temperature had relatively little explanatory power in relation to IESV, but they do affect the spatial differentiation of dependent variables to a certain extent. The explanatory power of the soil erosion degree and elevation on the dependent variable was less than 1%, indicating their very limited influence.
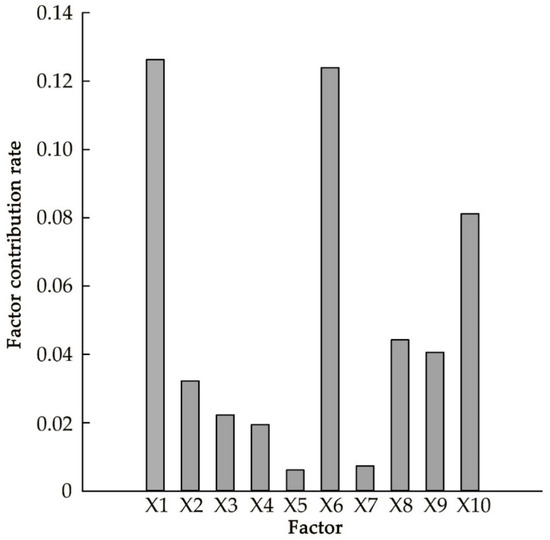
Figure 6.
Influence of the driving factors.
Both natural factors and socio-economic factors explain the spatial differentiation of IESV in the study area to varying degrees. The results show that natural factors have a greater impact on the spatial differentiation of IESV in the study area than socio-economic factors. As a typical ecologically fragile area, greater regional ecological restoration, increased conservation of natural resources, and strengthened policy and institutional guarantees of regional ecological protection are required. Moreover, because it is a plain, Western Jilin is also subject to intensive human activities. Social and economic factors such as HAI, population density, and land average GDP do play an important role in the spatial differentiation of IESV. Human beings should take account of natural processes in relation to land use, planning appropriately on the basis of land type without damaging the ecological environment, strictly implementing land use control, optimizing the allocation of land resources, improving the potential for sustainable development in the region, and promoting the coordinated symbiosis of human land use and natural systems.
3.3.2. Interaction Detector Analysis Based on the Geographical Detector Analysis
In the geographical detector, interactions between different risk factors can be identified and evaluated, indicating whether the joint action of different factors will increase or decrease the explanatory power of dependent variables [20]. Our analysis indicated that the interaction between any two factors was greater than the influence of a single factor, with six double-factor enhancements and 39 nonlinear enhancement types (Table 7 and Table 8).
Table 7.
Interactions between the driving factors of spatial differentiation of IESV.
Table 8.
Key interactions between driving factors.
We found that the interaction between NDVI and soil types had the strongest impact on the spatial differentiation of IESV in the study area, with an explanatory power of 21.95%. The other interactions with an explanatory power greater than 20% were land average GDP∩soil type (q value 0.2104), NDVI∩soil erosion degree (q value 0.2030), and population density∩soil type (q value 0.2021). Thus, although the explanatory power of the soil erosion degree on the spatial differentiation of IESV was small, when combined with NDVI, the effect was very high. Similarly, the interaction between soil type and soil erosion had an explanatory power greater than 15%, and the explanatory power of the interaction between NDVI and elevation was 14.74%. The western part of Jilin is a plain, so the effect of the elevation factor is not obvious, and the explanatory power of its interaction with other factors is relatively small, mostly less than 10%; however, it also shows that the interaction of two factors has a higher impact on the spatial differentiation of IESV than that of single factor.
The spatial differentiation of IESV in Western Jilin is the result of the interactions between various natural and social factors, which have synergistic enhancement effects on regional IESV through complex coupling. The synergistic interaction between the socio-economic factors such as land average GDP, population density, HAI, and natural factors such as NDVI, soil type, and temperature is significantly stronger than the internal interaction between socio-economic factors and most natural factors. Western Jilin is a semi-arid region with low annual precipitation, and most soil can be classified as chernozem or meadow soil. Under the constraints of natural and geographical conditions, planned land reclamation and development activities will greatly enhance the spatial distribution of IESV; therefore, in the process of land planning in Western Jilin, it is essential to consider the impact of multi-factor enhancement effects, including both natural and socio-economic factors on the ecological environment, and to plan land development and utilization according to local conditions, to protect natural systems during development work, to enhance protection, increase the sustainability of ecosystems, and avoid damaging regional ecosystems that are subjected to the synergistic effects of natural conditions and intensive human activities.
4. Discussion
4.1. Analysis of the Factors Associated with Spatio-Temporal Changes in IESV
It is widely acknowledged that multiple factors drive the generation, states, and evolution of ecosystem services; these include LULC changes, atmospheric carbon dioxide, biotic changes, warming, nitrogen deposition, pollutants and toxic substances in air, soils, and water [42,43,44,45]. According to the results of geographical detector, spatial differentiation of IESV is the result of the interactions between various natural and social factors. As shown in Figure 5, there was no obvious pattern in the spatial and temporal conversion of IESV in the ecologically fragile area of Western Jilin. Moreover, the driving factors of IESV changes should be considered at the regional scale. Similarly, spatio-temporal variation in IESV is caused by a combination of anthropogenic interventions and natural factors. Su and Fu used the Loess Plateau as an example, confirming that climate change and land use change were the major natural and human factors driving fluctuations in ESs in ecologically fragile area [22].
4.1.1. Land Use and Land Cover Change
Land use change represents the most substantial human alteration of the Earth’s systems for long-term study [22,46]. From the perspective of land use structure (Figure 7), the main land use type in Western Jilin was cultivated land, and the area of cultivated land increased from 50.21% to 54.99% during the period 1995–2018. In addition to cultivated land, the area of desert also increased significantly. The area of grassland of ecological significance decreased from 17.91% in 1995 to 10.00% in 2018, and the wetland with the highest ecological value also decreased by more than 1000 km2 over the past 23 years. These changes in land resource background have substantially reduced the IESV in Western Jilin. Moreover, the expansion of cultivated land and desert will also reduce the region’s habitat quality. Our study demonstrates this, with areas of IESV conversion from high to low values being spatially consistent with areas of desert encroaching on grassland or wetland transfer to other land types (Figure 5 and Figure 7).
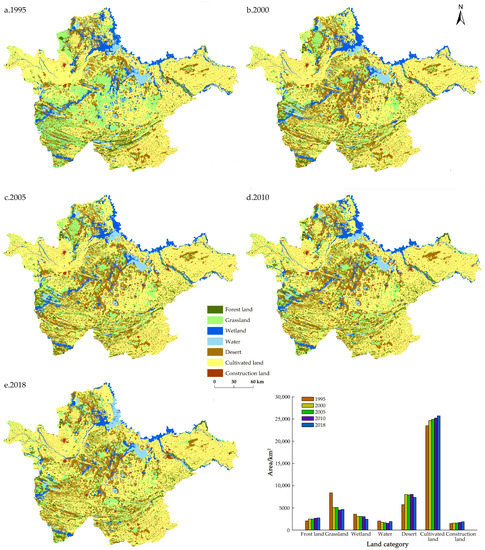
Figure 7.
The land use situation in Western Jilin from 1995–2018.
The most significant change of human activities on the land surface is the development and utilization of land for construction; its effect and degree of influence can be described by the “construction land equivalent” and human activity intensity [47]. These values were calculated on the basis of previous studies (Figure 8). It can be seen from the results that the equivalent area of construction land increased by 546.95 km2 in Western Jilin from 1995 to 2018, and the intensity of human activities increased by 1.17% during this period. The intensification of human activities and the expansion of construction land will further affect the value of regional ESs.
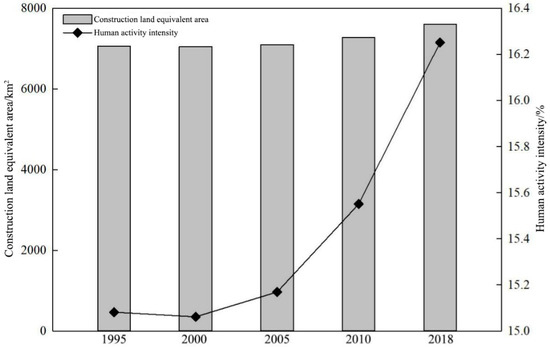
Figure 8.
Equivalent area of construction land and intensity of human activities.
4.1.2. Precipitation and Temperature
Temperature and precipitation are important drivers of change in ESs [48]. Western Jilin covers a semi-arid and semi humid area. During 1995–2018, the average annual temperature change in Western Jilin is not obvious. The average annual temperature in Baicheng is between 5 °C and 7 °C, and in Songyuan it is between 4.5 °C and 6 °C; however, over 8 years, the rainfall in Baicheng city was less than 400 mm, as was the case in Songyuan City from 1995–2005 (Figure 9). The rainfall was low and the interannual fluctuation was great, which led to the reduced area of bottomland and lakes in Western Jilin. The area of water and wetland decreased by 491.92 km2 and 387.38 km2, respectively. The water shortage and wetland area decrease reduced the IESV of the study area. In addition, low precipitation and high evaporation led to the accumulation of salt dissolved in water on the soil surface, which readily leads to soil salinization. Over the past 10 years, the saline alkali land in the west of Jilin has expanded, with an increase of 2261.56 km2, occupying a large amount of grassland, and further reducing the environmental quality of the study area. From 2005 to 2018, rainfall began to increase in Western Jilin. The area of lakes and rivers in Western Jilin also increased, and this has played an important role in the restoration of the natural environment and the enhancement of IESV.
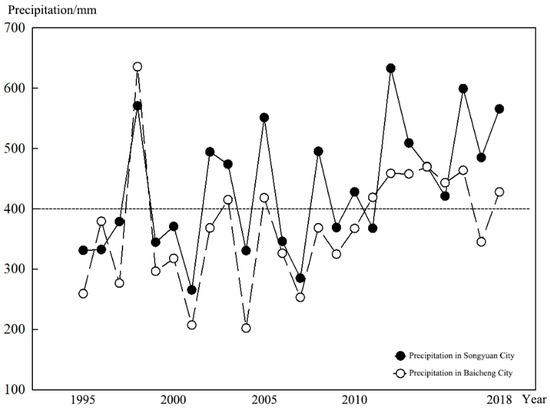
Figure 9.
Annual precipitation in Western Jilin.
Regional IESV change is caused by natural factors such as climate change and human activities. The joint action of natural factors and human activities will not only change the background of land resources, but also improve or reduce the external threat to habitat quality. It can be seen from Table 6, that the conversion of IESV from low to high exceeded that from high to low for the first time during 2010–2018. During this period, desert land began to decrease. In addition to the increase in precipitation, the governance of saline alkali land and the restoration of wetlands has been strengthened in Western Jilin. When the regional ecology deteriorates naturally, strengthening human intervention can limit this trend; therefore, regional ecological needs must be addressed in relation to local conditions, enhancing the sustainability of ecosystems and improving the value of integrated ecosystem service functions by a combination of natural and human activities.
4.2. Implications for Improving This Ecologically Fragile Region’s Ecosystem Services
If only habitat quality is used without considering habitat degradation, the impact of threats to habitats will be underestimated [32]. In this paper we also simulated the degree of habitat degradation in the state of no accessibility parameters. The results showed that the highest degree of degradation was the same irrespective of our approach and there will be a small number of areas with increased degradation in the protected area in the latter case. Similarly to the high IESV distribution areas (Figure 3), the interior of the protected areas in Western Jilin experienced levels of habitat degradation, whereas the degradation values in non-protected areas were higher, indicating that they were more vulnerable to human activities, and the protected areas were strictly protected by the state and less affected by human threats. This result is consistent with Zhao’s findings [33]. It can be seen that protected areas play a vital role in preserving biodiversity and maintaining habitat quality. Locations that are not included in protected areas are also at risk of habitat quality deterioration and degradation even if their condition is currently good. Although Western Jilin is an ecologically fragile area, it supports a large number of natural lakes and bottomlands. More areas with high IESV and those facing severe habitat degradation should be included in protected area management systems, with policy tools to enhance the protection of regional ecosystem services. In addition, Western Jilin should plan its land use appropriately, restrict the expansion of construction land and cultivated land so that it does not encroach on ecological land such as wetland and grassland, and strengthen the management of saline alkali land, so as to improve the ability of ecosystems to provide services in ecologically fragile areas.
4.3. Next Steps for Development
It has been shown that an ecosystem services assessment plays an important role in balancing ecological conservation with economic and agricultural development, landscaping, and urban planning [49,50], and thus, further development of ecosystem service assessment methods is necessary. In this study, we found that among natural factors, NDVI, soil type, and NPP have the strongest explanatory power for the spatial differentiation of IESV. These variations need to be acknowledged and a regional ecosystem productivity index model based on NDVI, NPP, and soil types needs to be constructed. In addition, the InVEST habitat quality model placed emphasis on the diversity of plant species [19]; therefore, in future research, more emphasis should be placed on the potential distribution areas of regional animal species, and a biodiversity index model should be constructed. By combining the indexes of each model, we can build a quantitative model that integrates multiple elements at the same time. The foundations of economics and ecology remain dominant [51], but regional ecosystem services are also linked to the physical geography and the human and social environment. We call for more geographers and sociologists to get involved in order to improve the assessment framework. Government policy makers and regional planners should act as the final users of the assessment results, and then use them as a reference point for planning and managing existing regional systems.
5. Conclusions
Taking a typical ecologically fragile area in Western Jilin as an example, in this study, we describe the construction of an integrated ecosystem service value model, analyze the spatio-temporal variation of IESV in the study area from 1995 to 2018, and use the geographical detector method to explore the spatial differentiation mechanism controlling IESV in the study area. The results showed that in the past 23 years, IESV in Western Jilin has shown a downward trend. Both high IESV values and low habitat degradation values were mostly distributed within protected areas; therefore, more areas with high IESVs facing severe anthropogenic interference and severe habitat degradation should be included in protected area management systems to conserve regional ecosystems through policy instruments.
The spatial differentiation of IESV in Western Jilin is the result of the interactions between the enhancement of natural factors, human activities, and socio-economic factors. Similarly, regional IESV changes are caused by natural factors and human activities. The optimization of regional ecosystems needs to adapt to local conditions and consider land use development patterns and ecosystem optimization patterns in combination with the actions of natural factors and human factors, as well as the interaction effects and characteristics of different factors.
Author Contributions
Y.S., H.L. and D.W. conceived and designed the study; Y.S. analyzed the data; Y.S. and H.L. wrote the manuscript, and S.L. edited it. All authors have read and agreed to the published version of the manuscript.
Funding
This research was funded by National Natural Science Foundation of China (No. 42071255).
Institutional Review Board Statement
Not applicable.
Informed Consent Statement
Not applicable.
Data Availability Statement
The data presented in this study are available on request from the corresponding author.
Conflicts of Interest
The authors declare no conflict of interest.
References
- Xie, G.D.; Zhang, C.X.; Zhang, C.S.; Xiao, Y.; Lu, C.X. The value of ecosystem services in China. Resour. Sci. 2015, 37, 1740–1746. [Google Scholar]
- Costanza, R.; d’Arge, R.; de Groot, R.; Farber, S.; Grasso, M.; Hannon, B.; Limburg, K.; Naeem, S.; O’Neill, R.V.; Paruelo, J.; et al. The value of the world’s ecosystem service and natural capital. Nature 1997, 387, 253–260. [Google Scholar] [CrossRef]
- Chen, Z.; Zhang, X. Value of ecosystem services in China. Chin. Sci. Bull. 2000, 45, 870–876. [Google Scholar] [CrossRef]
- Brauman, K.A.; Daily, G.C.; Duarte, T.K.; Mooney, H.A. The nature and value of ecosystem services: An overview highlighting hydrologic services. Annu. Rev. Environ. Resour. 2007, 32, 67–98. [Google Scholar] [CrossRef]
- Kozak, J.; Lant, C.; Shaikh, S.; Wang, G. The geography of ecosystem services value: The case of the Des Plaines and Cache River wetlands, Illinois. Appl. Geogr. 2011, 31, 303–311. [Google Scholar] [CrossRef]
- Li, F.; Zhang, S.W.; Yang, J.C.; Bu, K.; Wang, Q.; Tang, J.M.; Chang, L.P. The effects of population density changes on ecosystem services value: A case study in Western Jilin, China. Ecol. Indic. 2016, 61, 328–337. [Google Scholar]
- Huang, M.Y.; Fang, B.; Yue, W.Z.; Feng, S.R. Spatial differentiation of ecosystem service values and its geographical detection in Chaohu Basin during 1995–2017. Geogr. Res. 2019, 38, 2790–2803. [Google Scholar]
- MEA (Millennium Ecosystem Assessment). Ecosystems and Human Well-Being: Current State and Trends: Synthesis; Island Press: Washington, DC, USA, 2005; pp. 829–838. [Google Scholar]
- Long, H.; Tu, S.; Ge, D.; Li, T.; Liu, Y. The allocation and management of critical resources in rural China under restructuring: Problems and prospects. J. Rural Stud. 2016, 47, 392–412. [Google Scholar] [CrossRef] [Green Version]
- Costanza, R.; Liu, S. Ecosystem services and environmental governance: Comparing China and the US. Asia Pac. Policy Stud. 2014, 1, 160–170. [Google Scholar] [CrossRef]
- Chen, H.Y. The ecosystem service value of maintaining and expanding terrestrial protected areas in China. Sci. Total Environ. 2014, 781, 146768. [Google Scholar] [CrossRef]
- Kreuter, U.R.; Harris, H.G.; Matlock, M.D.; Lacey, R.E. Change in ecosystem service values in the San Antonio area, Texas. Ecol. Econ. 2001, 39, 333–346. [Google Scholar] [CrossRef]
- Xie, G.D.; Zhen, L.; Lu, C.X.; Xiao, Y.; Chen, C. Expect knowledge based valuation method of ecosystem services in China. J. Nat. Resour. 2008, 5, 911–919. [Google Scholar]
- Chen, J.C.; Li, T.H. Changes of spatial variations in ecosystem services value in China. Acta Sci. Nat. Univ. Pekin. 2019, 55, 951–960. [Google Scholar]
- Sharp, R.; Tallis, H.T.; Ricketts, T.; Guerry, A.D.; Wood, S.A.; Chaplin-Kramer, R.; Nelson, E.; Ennaanay, D.; Wolny, S.; Olwero, N.; et al. InVEST 3.6.0 User’s Guide; The Natural Capital Project: Stanford, CA, USA, 2019. [Google Scholar]
- Boumans, R.; Costanza, R.; Farley, J.; Wilson, M.A.; Portela, R.; Rotmans, J.; Villa, F.; Grasso, M. Modeling the dynamics of the integrated earth system and the value of global ecosystem services using the GUMBO model. Ecol. Econ. 2002, 41, 529–560. [Google Scholar] [CrossRef]
- Leh, M.D.K.; Matlock, M.D.; Cummings, E.C.; Nalley, L.L. Quantifying and mapping multiple ecosystem services change in West Africa. Agric. Ecosyst. Environ. 2013, 165, 6–18. [Google Scholar] [CrossRef]
- Marquès, M.; Bangasha, F.R.; Kumar, V.; Sharp, R.; Schuhmacher, M. The impact of climate change on water provision under a low flow regime: A case study of the ecosystems services in the Francoli river basin. J. Hazard. Mater. 2013, 263, 224–232. [Google Scholar] [CrossRef]
- Bai, Y.; Zheng, H.; Zhuang, C.W.; Ouyang, Z.Y.; Xu, W.H. Ecosystem services valuation and its regulation in Baiyangdian basin: Based on InVEST model. Acta Ecol. Sin. 2013, 33, 711–717. [Google Scholar]
- Wu, J.S.; Mao, J.Y.; Lin, Q.; Li, J.C. Urban Growth Boundary Based on the Evaluation of Habitat Quality: Taking the Yangtze River Delta as an Example. Sci. Geogr. Sin. 2017, 37, 28–36. [Google Scholar]
- Peng, J.; Wu, J.; Xu, F.X.; Lu, J. Spatio—Temporal evolution characteristics of habitat quality in typical tourism cities based on value evaluation: A case study of Huangshan. Acta Ecol. Sin. 2021, 41, 665–679. [Google Scholar]
- Su, C.H.; Fu, B.J. Evolution of ecosystem services in the Chinese Loess Plateau under climatic and land use changes. Glob. Planet. Chang. 2013, 101, 119–128. [Google Scholar] [CrossRef]
- Wang, J.F.; Xu, C.D. Geo-detector: Principle and prospective. Acta Geogr. Sin. 2017, 72, 116–134. [Google Scholar]
- Liu, C.F.; Wang, C.; Liu, L.C. Spatio-temporal variation on habitat quality and its mechanism within the transitional area of the Three Natural Zones: A case study in Yuzhong county. Geogr. Res. 2018, 37, 419–432. [Google Scholar]
- Zhang, P.; Geng, W.; Yang, D.; Li, Y.; Zhang, Y.; Qin, M. Spatialtemporal evolution of land use and ecosystem service value in the lower reaches of the Yellow River region. Trans. Chin. Soc. Agric. Eng. 2020, 36, 277–288. [Google Scholar]
- Jiang, L.X. Ecosystem Services Changes and Restoration Strategies of Grassland in Western Jilin Province; College of Earth Sciences, Jilin University: Changchun, China, 2021. [Google Scholar]
- Chen, F.; Ge, X.P.; Chen, G.; Peng, B.Z. Spatial different analysis of landscape change and human impact in urban fringe. Sci. Geogr. Sin. 2001, 21, 210–216. [Google Scholar]
- Yue, S.; Zhang, S.; Yan, Y. Impacts of land use change on ecosystem services value in the Northeast China Transect (NECT). Acta Geogr. Sin. 2007, 62, 879–886. [Google Scholar]
- Li, W.K.; Li, T.H.; Qian, Z.H. Impact of land use change on ecosystem services value in Shenzhen. J. Nat. Resour. 2008, 23, 440–446. [Google Scholar]
- Sharp, R.; Tallis, H.T.; Ricketts, T.; Guerry, A.D.; Wood, S.A.; Chaplin-Kramer, R.; Nelson, E.; Ennaanay, D.; Wolny, S.; Olwero, N.; et al. InVEST 3.3.1 User’s Guide; The Natural Capital Project: Stanford, CA, USA, 2016. [Google Scholar]
- Terrado, M.; Sabater, S.; Chaplin-Kramer, B.; Mandle, L.; Ziv, G.; Acuna, V. Model development for the assessment of terrestrial and aquatic habitat quality in conservation planning. Sci. Total Environ. 2016, 540, 63–70. [Google Scholar] [CrossRef] [PubMed] [Green Version]
- Sallustio, L.; De, T.A.; Strollo, A.; Di Febbraro, M.; Gissi, E.; Casella, L.; Geneletti, D.; Munaf, M.; Vizzarri, M.; Marchetti, M. Assessing habitat quality in relation to the spatial distribution of protected areas in Italy. J. Environ. Manag. 2017, 201, 129–137. [Google Scholar] [CrossRef] [PubMed]
- Zhao, X.J.; Wang, J.; Su, J.D.; Sun, W.; Jin, W.Q. Assessment of habitat quality and degradation degree based on InVEST model and Moran index in Gansu Province, China. Trans. Chin. Soc. Agric. Eng. 2020, 36, 301–308. [Google Scholar]
- Van Der Laan, C.; Budiman, A.; Verstegen, J.A.; Dekker, S.C.; Effendy, W.; Faaij, A.P.C.; Kusuma, A.D.; Verweij, P.A. Analyses of land cover change trajectories leading to tropical forest loss: Illustrated for the West Kutai and Mahakam ulu districts, East Kalimantan, Indonesia. Land 2018, 7, 108. [Google Scholar] [CrossRef] [Green Version]
- Liu, S.H.; Wang, D.Y.; Li, H.; Li, W.B.; Wang, Q. Ecological land fragmentation evaluation and dynamic change of a typical black soil farming area in Northeast China. Sustainability 2017, 9, 300. [Google Scholar] [CrossRef] [Green Version]
- Wang, J.F.; Li, X.H.; Christakos, G.; Liao, Y.L.; Zhang, T.; Gu, X.; Zheng, X.Y. Geographical detectors-based health risk assessment and its application in the neural tube defects study of the Heshun region, China. Int. J. Geogr. Inf. Sci. 2010, 24, 107–127. [Google Scholar] [CrossRef]
- Zhou, C.S.; Chen, J.; Wang, S.J. Examining the effects of socioeconomic development on fine particulate matter (PM2.5) in China’s cities using spatial regression and the geographical detector technique. Sci. Total Environ. 2018, 619–620, 436–445. [Google Scholar] [CrossRef]
- Chen, W.X.; Li, J.F.; Zeng, J.; Ran, D.; Yan, B. Spatial heterogeneity and formation mechanism of eco-environmental effect of land use change in China. Geogr. Res. 2019, 38, 2173–2187. [Google Scholar]
- Yang, G.H.; Wang, D.Y.; Feng, Y.Z. Study on the Evolution and Quality Evaluation of Ecological Environment in the Source Region of the Yangtze and Yellow Rivers; Science Press: Beijing, China, 2008; pp. 302–332. [Google Scholar]
- Yang, Y. Vegetation and Soil Restoration Characteristics and Ecosystem Service Function Assessment in Typical Small Watershed on the Loess Plateau; Northwest A&F University: Xianyang, China, 2019. [Google Scholar]
- Ding, M.T.; Pei, F.S.; Hu, Y.C.; Dong, S.; Zhang, Z.N.; Liu, Z.P. Spatial and temporal changes of ecosystem service value in Jiangsu Province based on LUCC. Acta Ecol. Sin. 2020, 40, 6801–6811. [Google Scholar]
- Körner, C. Biosphere responses to CO2 enrichment. Ecol. Appl. 2000, 10, 1590–1619. [Google Scholar]
- Matson, P.A.; Lohse, K.; Hall, S. The globalization of nitrogen deposition: Consequences for terrestrial ecosystems. Ambio 2002, 31, 113–119. [Google Scholar] [CrossRef] [PubMed]
- Reynolds, J.F.; Stafford-Smith, D.M. Global Desertification: Do Humans Cause Deserts? Dahlem Workshop Report 88; Dahlem University Press: Berlin, Germany, 2002; p. 437. [Google Scholar]
- Rustad, L.E.; Norby, R.J. Temperature increase: Effects on terrestrial ecosystems. In The Earth System: Biological and Ecological Dimensions of Global Environmental Change: Encyclopedia of Global Environmental Change; Mooney, H.A., Canadell, J.G., Eds.; Wiley: Hoboken, NJ, USA, 2002; Volume 2, pp. 575–581. [Google Scholar]
- Vitousek, P.M.; Mooney, H.A.; Lubchenco, J.; Melillo, J.M. Human domination of earth’s ecosystems. Science 1997, 277, 494–499. [Google Scholar] [CrossRef] [Green Version]
- Xu, Y.; Sun, X.Y.; Tang, Q. Human activity intensity of land surface: Concept, method and application in China. Acta Geogr. Sin. 2015, 70, 1068–1079. [Google Scholar] [CrossRef]
- Stoll, S.; Frenzel, F.; Burkhard, B.; Adamescu, M.; Augustaitis, A.; Baeßler, C.; Bonet, F.J.; Carranza, M.L.; Cazacu, C.; Cosor, G.L.; et al. Assessment of ecosystem integrity and service gradients across Europe using the LTER Europe network. Ecol. Model. 2015, 295, 75–87. [Google Scholar] [CrossRef]
- Kirchner, M.; Schmidt, J.; Kindermann, G.; Kulmer, V.; Mitter, H.; Prettenthaler, F.; Rüdisser, J.; Schauppenlehner, T.; Schönhart, M.; Strauss, F.; et al. Ecosystem services and economic development in Austrian agriculturallandscapes—The impact of policy and climate change scenarios on trade-offs and synergies. Ecol. Econ. 2015, 109, 161–174. [Google Scholar] [CrossRef]
- Assumma, V.; Bottero, M.; Angelis, D.E.; Lourenço, J.M.; Monaco, R.; Soares, A.J. A decision support system for territorial resilience assessment and planning: An application to the Douro Valley (Portugal). Sci. Total Environ. 2021, 756, 143806. [Google Scholar] [CrossRef] [PubMed]
- Chaudhary, S.; McGregor, A.; Houston, D.; Chettri, N. The evolution of ecosystem services: A time series and discourse-centered analysis. Environ. Sci. Policy 2015, 54, 25–34. [Google Scholar] [CrossRef]
Publisher’s Note: MDPI stays neutral with regard to jurisdictional claims in published maps and institutional affiliations. |
© 2022 by the authors. Licensee MDPI, Basel, Switzerland. This article is an open access article distributed under the terms and conditions of the Creative Commons Attribution (CC BY) license (https://creativecommons.org/licenses/by/4.0/).