Article

Interactive Effects on Habitat Quality Using InVEST and GeoDetector Models in Wenzhou, China

1
College of Arts College of Landscape Architecture, Fujian Agriculture and Forestry University, Fuzhou 350002, China
2
Engineering Research Center for Forest Park of National Forestry and Grassland Administration, Fuzhou 350002, China
*
Author to whom correspondence should be addressed.
Land 2022, 11(5), 630; https://doi.org/10.3390/land11050630
Submission received: 8 March 2022 / Revised: 7 April 2022 / Accepted: 19 April 2022 / Published: 24 April 2022
(This article belongs to the Special Issue National Parks and Protected Areas)

Abstract

:
Global urbanisation has accelerated in recent years, especially in rapidly growing coastal cities, and the destruction of habitat and natural resources has intensified. Although much attention has been paid to the study of habitat quality, there are still gaps in our understanding of the factors that influence it and their interactions. In this study, the InVEST habitat quality evaluation model and the GeoDetector model were used to construct a framework for analysing the dynamic changes in habitat quality and their influencing factors from 1992 to 2015. Wenzhou City, Zhejiang Province, China, was selected as the study area. The new framework extends studies on habitat quality change to annual analysis and reduces the lag between the actual change and the mapping time. The interactions between natural and anthropogenic factors are explored, and the effects of different types of land use conversion on habitat quality are further discussed. The results show that: (1) During the study period, cultivated and construction land areas in Wenzhou City increased the most, and forest land area decreased the most. (2) Habitat quality in Wenzhou City was generally good during the study period, but it showed a declining trend from year to year, and the distribution of habitat quality decreased from west to east. (3) The interactions between land use change and annual precipitation change and those between land use change and population density change have the most significant impact on habitat quality. The conversion of forest land to cultivated land, conversion of water area to cultivated land, and conversion of forest land to building land have the greatest impact on habitat quality. The results of the study can provide recommendations for ecological restoration, optimal integration of protected areas, and provide a reference for the healthy and sustainable development of coastal regions.

1. Introduction

Coastal cities represent intersections between land and sea, and are characterised by their special geographical location, differential natural resources, and good economic foundations [1]. Land reclamation and urbanisation can have a significant impact on coastal ecological health in terms of issues such as habitats for plant and animal communities, and changes in soil properties [2]. Habitat quality refers to the provision of a suitable living environment for individuals or populations in an ecosystem [3] and reflects the biodiversity to a certain extent [4]. High quality of habitat is the basis of ecosystem services, providing humans with significant economic benefits and cultural values [5]. However, according to the Global Assessment of Biodiversity and Ecosystem Services, one million of the eight million species found globally are now threatened by extinction due to human activities [6]. Comparing with inland cities, the habitat quality of coastal cities faced more pressure from urban development and climate change [7,8] Assessment of the spatiotemporal evolution of habitat quality and exploration of the factors affecting its change are critical to the construction of a regional ecological security framework [9], and to spatial and layout planning in coastal cities.
How is habitat quality measured? Different methods are developed for the assessment of habitat quality at different scales [10]. At a small scale, the distribution and abundance of major species in the region are determined based on field survey data [11]. For example, Loffler and Fartmann [12] measured regional habitat quality based on vegetation structure, analysed the effects of grassland landscape and habitat quality on Orthoptera insects, and proposed that improving regional habitat quality is critical to strengthening the conservation and management of Orthoptera insects. However, it is difficult to study all types of provinces and cities with large regional areas using this method. To extract environmental factors at a large and medium scale, the InVEST model [13] and the remote sensing ecological index (RSEI) [14] are usually used to rapidly evaluate habitat quality. Many previous studies have used the InVEST model to explore the correlation between habitat quality and land use changes in different regions [15]. However, most current studies discuss habitat quality changes over different time periods at intervals of five or ten years, but annual habitat quality changes have not been studied.
Although much attention has been paid to the study of habitat quality, there are still gaps in our understanding of the factors that influence it and their interactions. The determination of factors affecting changes in habitat quality provides the basis for the protection of the habitat biodiversity [16], and it is important to solve certain key problems for the promotion of habitat protection [17]. In recent studies, the influencing factors have been classified into two groups [18]: natural factors and anthropogenic factors. Natural factors, such as elevation, do not change significantly in the short term; however, they indirectly limit human activities. Differences in topography, precipitation, and vegetation distribution affect the spatial component of various habitats [19]. Anthropogenic factors, such as population density, gross domestic product (GDP), and land use changes, are the most direct manifestations of human activities [20]. The results of recent studies show that land use changes are the main factor controlling changes in habitat quality [21]. However, it remains unclear which types of land use changes have the most significant effects on habitat quality. In real life, changes in habitat quality are due to interactions among various influencing factors, which form a relatively complex network. The relative importance of each influencing factor changes depending on the time, policy, and region.
Ordinary least squares regression and geographically weighted regression analysis are the most important methods used to study the correlations between habitat quality and influencing factors [22]. These two methods can be used to analyse the spatial heterogeneity of similar geographical attributes and local clustering [23]. These effects can be explained by the position, relation, and weight of spatial distance of influencing factors based on a linear model [24]. However, these methods only involve linear interpolation and have certain limitations, although they all are based on linear regression models [25]. In most studies, county-level administrative units or different grid units are used, but the effects of different influencing factors at different scales are ignored [26]. The nonlinear GeoDetector model, which is a group of statistical methods that can be used to determine geospatial heterogeneity and its driving forces [27], was used in this study to analyse the correlations between changes in habitat quality and influencing factors at different scales and in different regional zones. The advantage of the GeoDetector model is that it can analyse both numerical and qualitative data. It can be used to determine the interactions among different factors [28] and to quantitatively analyse the interactions between two factors [29].
Wenzhou City located in the east of Zhejiang Province, China, is a prefecture-level city that is designated as one of the three major representative cities after the reform and opening up of China. It has developed rapidly and is often regarded as a typical example of the privatisation and corporatisation of Chinese cities in the context of market-oriented reforms and open experiments [30]. However, rapid economic development often comes at the cost of damaging the environment, putting enormous pressure on the ecological environment due to urban expansion, changes in land use, and uneven spatial allocation of resources and environment. This study chose Wenzhou City as the research area and analysed annual changes in its habitat quality and the factors influencing it, to provide a reference for ecological environmental protection and land use in rapidly developing Chinese coastal cities, and to promote the pace of urban transformation to encourage the construction of the ecological civilisation of China. This study focuses on the following questions:
  • What is the overall habitat quality situation in the urban area of Wenzhou City?
  • How has habitat quality in Wenzhou changed from 1992 to 2015, year by year?
  • What are the main factors contributing to changes in habitat quality?
  • How do natural and anthropogenic factors interact with each other?
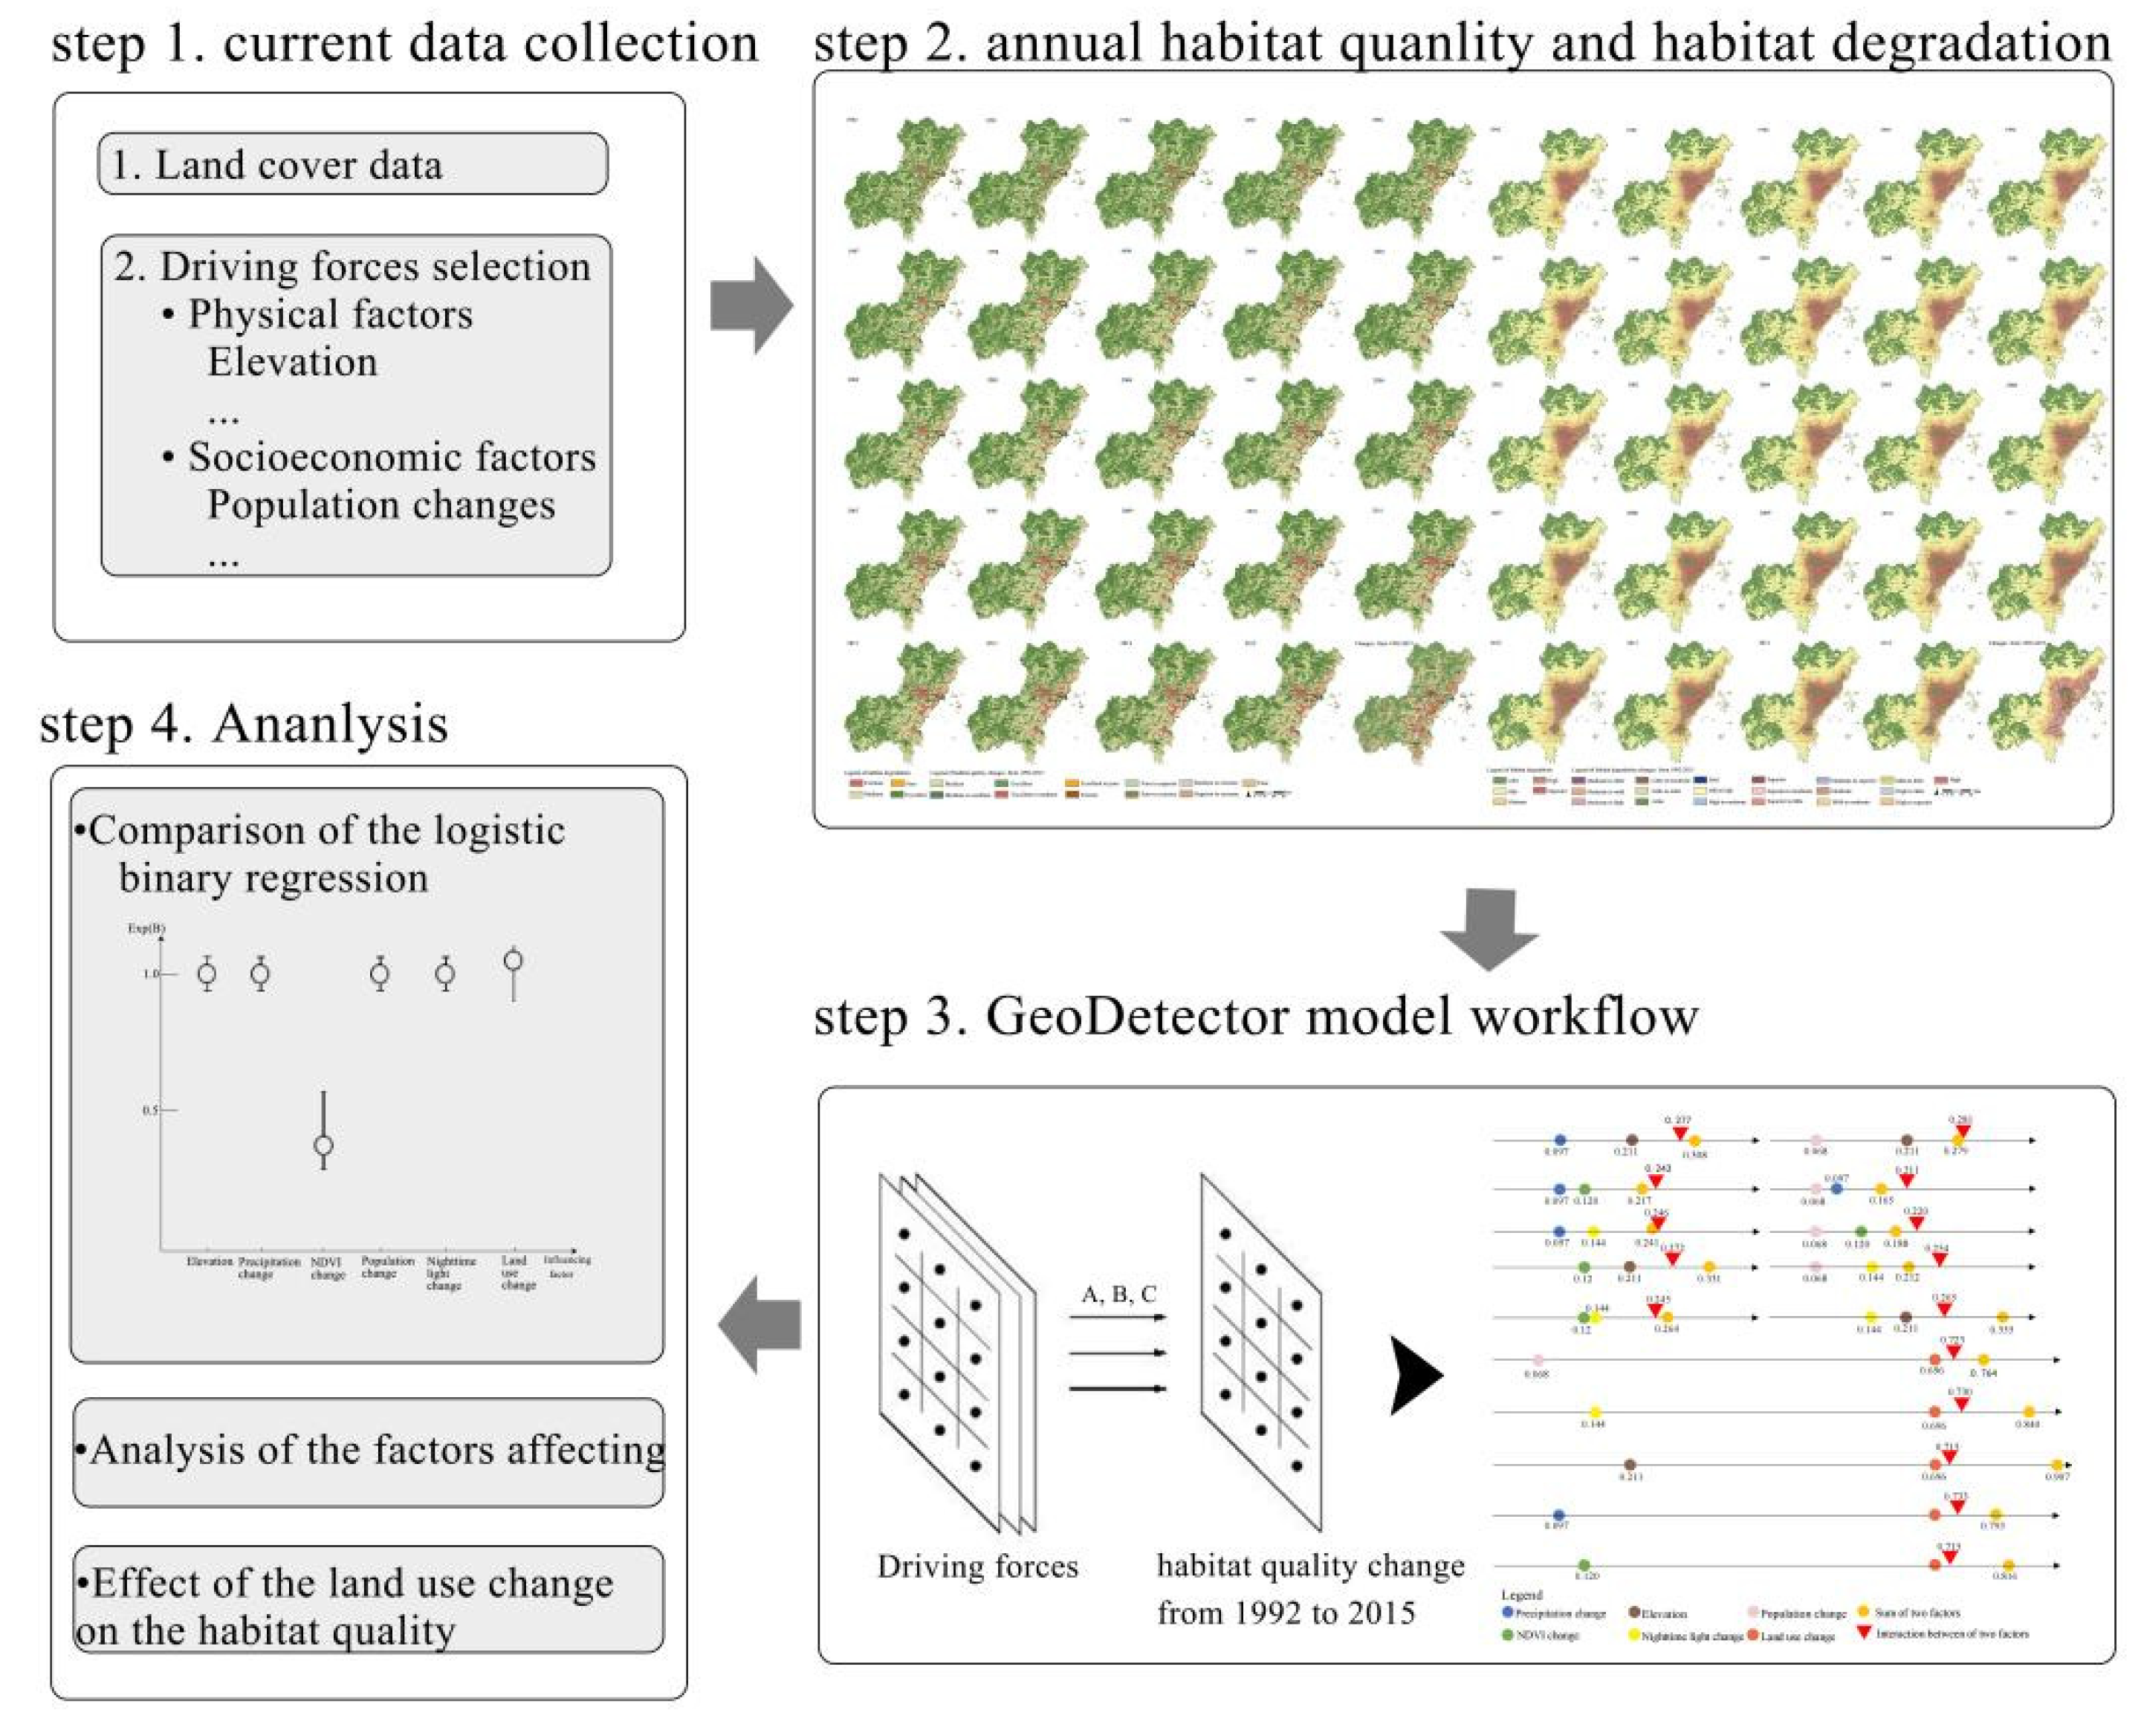
The aim of this study is to construct a framework for analysing the dynamic changes in habitat quality and their influencing factors and explore interactive effects between natural factors and anthropogenic factors on habitat quality. Based on the InVEST habitat quality evaluation model, the annual assessment of habitat quality is conducted. In addition, the GeoDetector model is applied in the study to explore the interaction between the factors that influence the change of habitat quality. The continuous evaluation of habitat quality and the effects of various factors may provide a scientific basis for the ecology evaluation in territorial spatial planning, optimal integration of protected areas, and suggest the direction for future planning measures and development.

2. Methodology

2.1. Study Area

Wenzhou City is on the south-eastern coast of China. It is surrounded by mountains on three sides and faces the sea on one side. The territory is rich in natural resources and known as ‘seven mountains, two waters, and one field’. The topography of Wenzhou City is trapezoidal from the southwest to the northeast and the landforms can be divided into low mountainous areas in the west, low mountainous and hilly basins in the centre, plain and tidal flat areas in the east, and coastal island areas. The region is rich in forest resources, with forest coverage of 60.03% [31]. The forest ecosystem is the most extensive ecosystem type found in Wenzhou City. Wenzhou City has a dense river network and a developed surface water system, including the Oujiang, Feiyun, and Ao rivers [32]. According to the Wenzhou Bureau of Statistics [33], the land and sea areas of Wenzhou City are 12,083 and 8649 km2, respectively. Wenzhou City has 12 counties and districts under its jurisdiction, with a permanent population of 9.3 million people. In recent years, Wenzhou has seen rapid urbanisation, with the city’s gross domestic product (GDP) standing at 1.322 billion yuan in 1978; surpassing 100 billion yuan in 2002; and reaching 687.09 billion yuan in 2020, with rapid economic growth.

2.2. Methods

2.2.1. Description of the Habitat Quality Model

The habitat quality model was selected as the submodule of the InVEST model. Habitat quality maps were generated by combining land use data and information about biodiversity threat factors to determine the regional environmental quality [34]. Habitat quality scores were calculated as follows:
Q a b = M b ( 1 G a b z G a b z K z )
where Qa represents the habitat quality score of habitat pixel a in habitat type b; M represents the habitat suitability of habitat type b; and G and K are the default model parameters, which are 2.5 and 0.5, respectively.
The degree of the degradation of the habitat at this location is:
G a c = e = 1 E f = 1 F ( W e e = 1 E w e ) e c i e a c β a S b e
where Gac denotes the habitat degradation degree of habitat pixel a in habitat type c; e is the threat source for the habitat; and f is the grid of the threat source e.
The stress effect of e(ef) in grid f on the habitat in grid a is ieac:
i e a c = 1 G a c G m a x ( linear   decay ) i e a c = exp ( 2.99 G m a x G a c ) ( exponential   decay )
where Gac is the distance between pixel a of the habitat and pixel c of the threat source; W and Gmax are the weight and maximum influence range of the threat source E, respectively; β represents the effects of local conservation policies; and S represents the relative sensitivity of each habitat to different threat sources.
The land-use was derived from MODIS Land Cover/Dynamics (MCD12) data [35]. The original land-use and cover classification includes six categories: agricultural land, forest land, grassland, wetland, construction land, and other land uses, as well as 22 subcategories from the original spatial dataset [36]. Based on the actual situation in Wenzhou City, six categories were used in this study: cultivated land, forest land, grassland, aquatic environments, construction land, and bare land. Cultivated land, construction land, and bare land were considered to be the primary habitat threat factors, because all three are disturbed by human activities, the natural conditions of bare land, bare rock, and stony land in Wenzhou City are poor, and bare land causes dust pollution in sunny days and erosion in rainy days.
Information about threat sources and habitat sensitivity parameters were obtained from Haiyan [37] and related studies and were used as input for the habitat quality module of the InVest model (Tables S1 and S2).

2.2.2. GeoDetector Model

The GeoDetector model is composed of four detectors: factor detector, risk detector, interaction detector, and ecological detector. In this study, the interaction and factor detectors were used to explore the factors affecting the spatial differentiation of habitat quality.
  • Factor detector
The calculation is as follows [28]:
q = 1 a = 1 A N a σ a 2 n σ 2
where q is the degree to which an impact factor explains the distribution of the habitat quality; A is the stratification of the impact factors; Na and n are the habitat quality of layer a and the whole region, respectively; and σ2h and σ2 are the variance of layer a and the study area. If the explanatory power of the influencing factor q is within the range of (0–1), the closer q is to 1, and the stronger the influence of this factor on the spatial differentiation of the habitat quality. Otherwise, the influence is weaker.
  • Interaction detector
Based on the comparison of the q values of single factors, the sum of two single factor q values, and the q values of the double-factor interaction, the interaction detector can be divided into five classes based on the highs and lows of these three values. If q(Y1∩Y2) < Min[q(Y1), q(Y2)], the interaction is decreasing nonlinearly. If Min[q(Y1), q(Y2)] < q(Y1∩Y2) < Max[q(Y1), q(Y2)], the interaction decreases linearly by a single factor. If q(Y1∩Y2) > Max[q(Y1), q(Y2)], the interaction is a double-factor enhancement. If q(Y1∩Y2) = q(Y1) + q(Y2), the interaction is independent. If q(Y1∩Y2) > q(Y1) + q(Y2), the interaction is a nonlinear enhancement.
  • Selection of the best GeoDetector parameters
As a spatial statistical method, the GeoDetector model analyses the correlations among different factors based on grid data. The sizes of different aggregation areas or spatial distribution, i.e., the scale and partition effects, must be considered to produce different results [23]. Firstly, the effect of scale on the GeoDetector model results was analysed to determine the best parameters. Based on previous studies, the data resolution, and research area, five grid scales were selected: 1000 × 1000 pixel, 2000 × 2000 pixel, 3000 × 3000 pixel, 4000 × 4000 pixel, and 5000 × 5000 pixel. Secondly, different types of independent variables were used to determine the effect of partitioning on the GeoDetector model. Different classification methods are generally used for the discretisation of numerical independent variables. In this study, the natural breakpoint and manual classification methods were adapted to test and select the best model.
  • Selection of the spatial distribution of influencing factors
The factors affecting changes in habitat quality are diverse and complex. Based on previous studies, the natural environment is in innate existence, and its transformation is caused by human interference. Therefore, the effects of changes in habitat quality can be divided into natural factors and anthropogenic factors. Based on the literature and on existing data for the study area, six influencing factors were selected for analysis in this study (Table 1).
In this study, the indexes that represent natural factors include the elevation, annual mean precipitation, and normalised vegetation index. Elevation influences the composition of the vegetation structure and indirectly affects the habitat selection of animals [38], and thus the habitat quality. Annual average precipitation is an important factor that affects the growth and reproduction of organisms as well as the food resources of animals and plants [39]. The normalised difference vegetation index (NDVI) can reflect the growth status and coverage degree of vegetation. It is the most direct method that can be used to model the advantages and disadvantages of regional ecological environments [40]. Anthropogenic factors include urbanisation, population density, and land use/cover change (LUCC). Night-time light data can be used to measure the overall urbanisation intensity [41]. Rapid urbanisation leads to a gradual imbalance in ecosystem functions [42]. The population density reflects the distribution of the population. Where habitat quality is good, there tends to be less human disturbance. LUCC can reflect the human economic activities and is an embodiment of human activities [43]. The digital elevation model (DEM), precipitation, and population density data were obtained from the Resources and Environmental Science Data Center, Chinese Academy of Sciences (Beijing, China; http://www.resdc.cn/, (accessed on 5 March 2021)). The NDVI data originated from the Geospatial Data Cloud (http://www.gscloud.cn/#page6, (accessed on 5 March 2021)). Night-time light data were derived from the Chinese Long-term Series Annual Artificial Night-time Light dataset (1984–2020) [44].
Table 1. Summary of factors affecting habitat quality based on the literature and factors used for the GeoDetector model.
CategoryFactors Affecting Habitat Quality, Based on the LiteratureFactors Used for the Geodetector Model
Natural factorsTopographic factors [5]Elevation
Climate [45]Annual average precipitation changes
Vegetation coverage [46]NDVI changes from 1992 to 2015
Anthropogenic factorsUrbanisation [42]Changes of night-time light data from 1992 to 2015
Population [41]Population changes from 1992 to 2015
LUCC [47,48]Land use transformation from 1992 to 2015

2.2.3. Improvement of the Logistic Multiple Regression Model for the Analysis of Influencing Factors

SPSS Statistics 26.0 (IBM Corp, Armonk, NY, USA) statistical software was used to re-analyse the same data, using logistic regression model analysis. Based on sample data, the model generates regression coefficients for each variable. The correlations between dependent and independent variables in the model can be determined and discussed based on these coefficients. The subordinate variables are 0 and 1, where 0 indicates no change in the habitat quality [19]. If q is the occurrence probability of the event and the value range is 0–1, 1−q is the probability that the event does not occur, which can be calculated using a logistic function:
Q = exp ( β 0 + β 1 N 1 + β 2 N 2 + + β n N n ) 1 + exp ( β 0 + β 1 N 1 + β 2 N 2 + + β n N n )
where N1, N2, …, Nn are factors that affect habitat quality change, such as the elevation, precipitation, and land use change. The constants in the β0 equation, that is, β1, β2, and so forth, are partial regression coefficients of the βn logistic regression that represent the degree of the influence of the independent variables.

2.2.4. Principal Component Analysis

Principal component analysis (PCA) is a statistical analysis method that converts multiple indicators into a small number of comprehensive indicators [49]. In this study, various land use changes were used as indicators for the PCA, to obtain the characteristic roots of the matrix and corresponding variance contribution rate. PCA was undertaken using SPSS Statistics 26.0 statistical software. Subsequently, the score of each component factor was calculated using the linear expression and a comprehensive score was obtained using the variance contribution rate as the weight [50]. Finally, the comprehensive score of each principal component was converted to a percentage system and used as the evaluation score, which more accurately reflects the effects of various land use changes on habitat quality.

3. Results

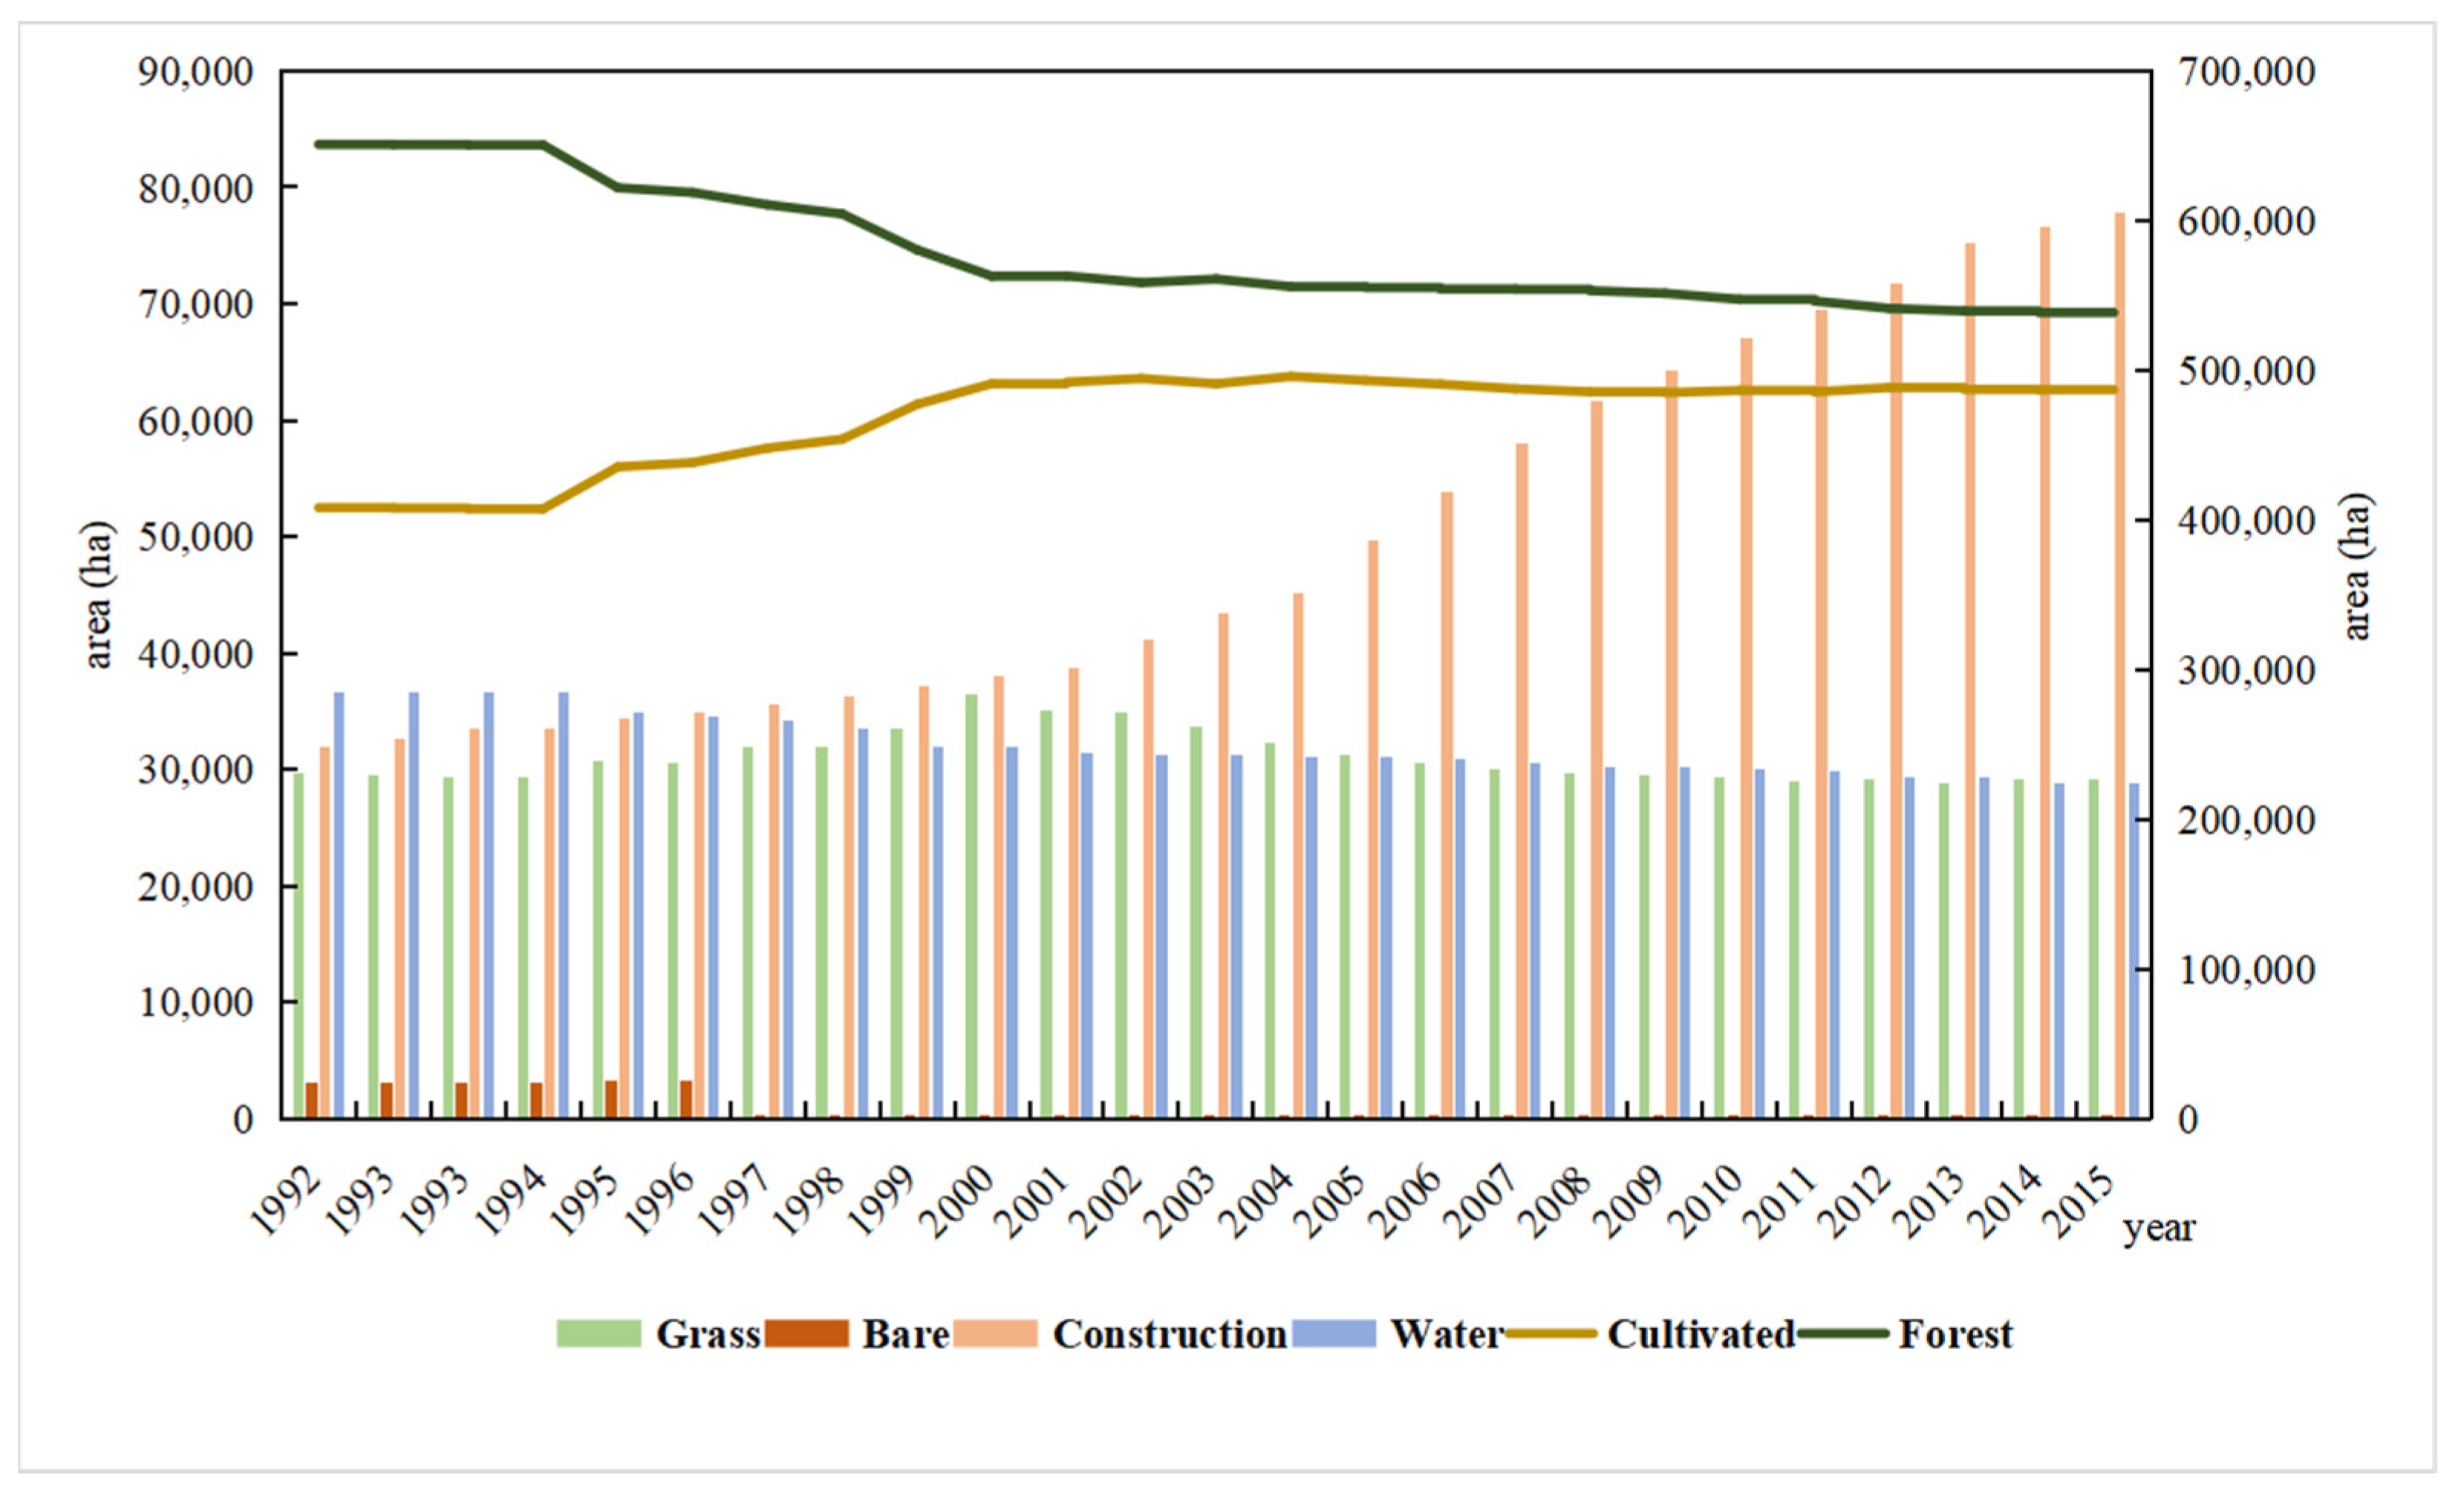
3.1. Spatiotemporal Patterns of Land Use in Wenzhou City from 1995 to 2015

From 1992 to 2015, the proportions of forest land and cultivated land in Wenzhou City remained high. Cultivated land and construction land areas increased slowly, whereas forest land, grassland, bare land, and aquatic environments decreased gradually. From 1992 to 2015, the cultivated land area increased the most (77,652.98 ha). It increased rapidly from 1992 to 2000 and remained at 57,000 ha in 2015. The construction land area increased by 45,851.43 ha; it expanded continuously and, after 2000, the construction area increased more rapidly (Figure 1).
The forest land area decreased to 112,313.87 ha. The forest land area decreased from 1992 to 2000 and has remained at ~560,000 ha since then. The grassland area increased to a maximum of 35,137.44 ha in 2001, then decreased to 30,000 ha and remained at a relatively stable level. The bare land area slightly decreased, whereas the aquatic environments remained unchanged.

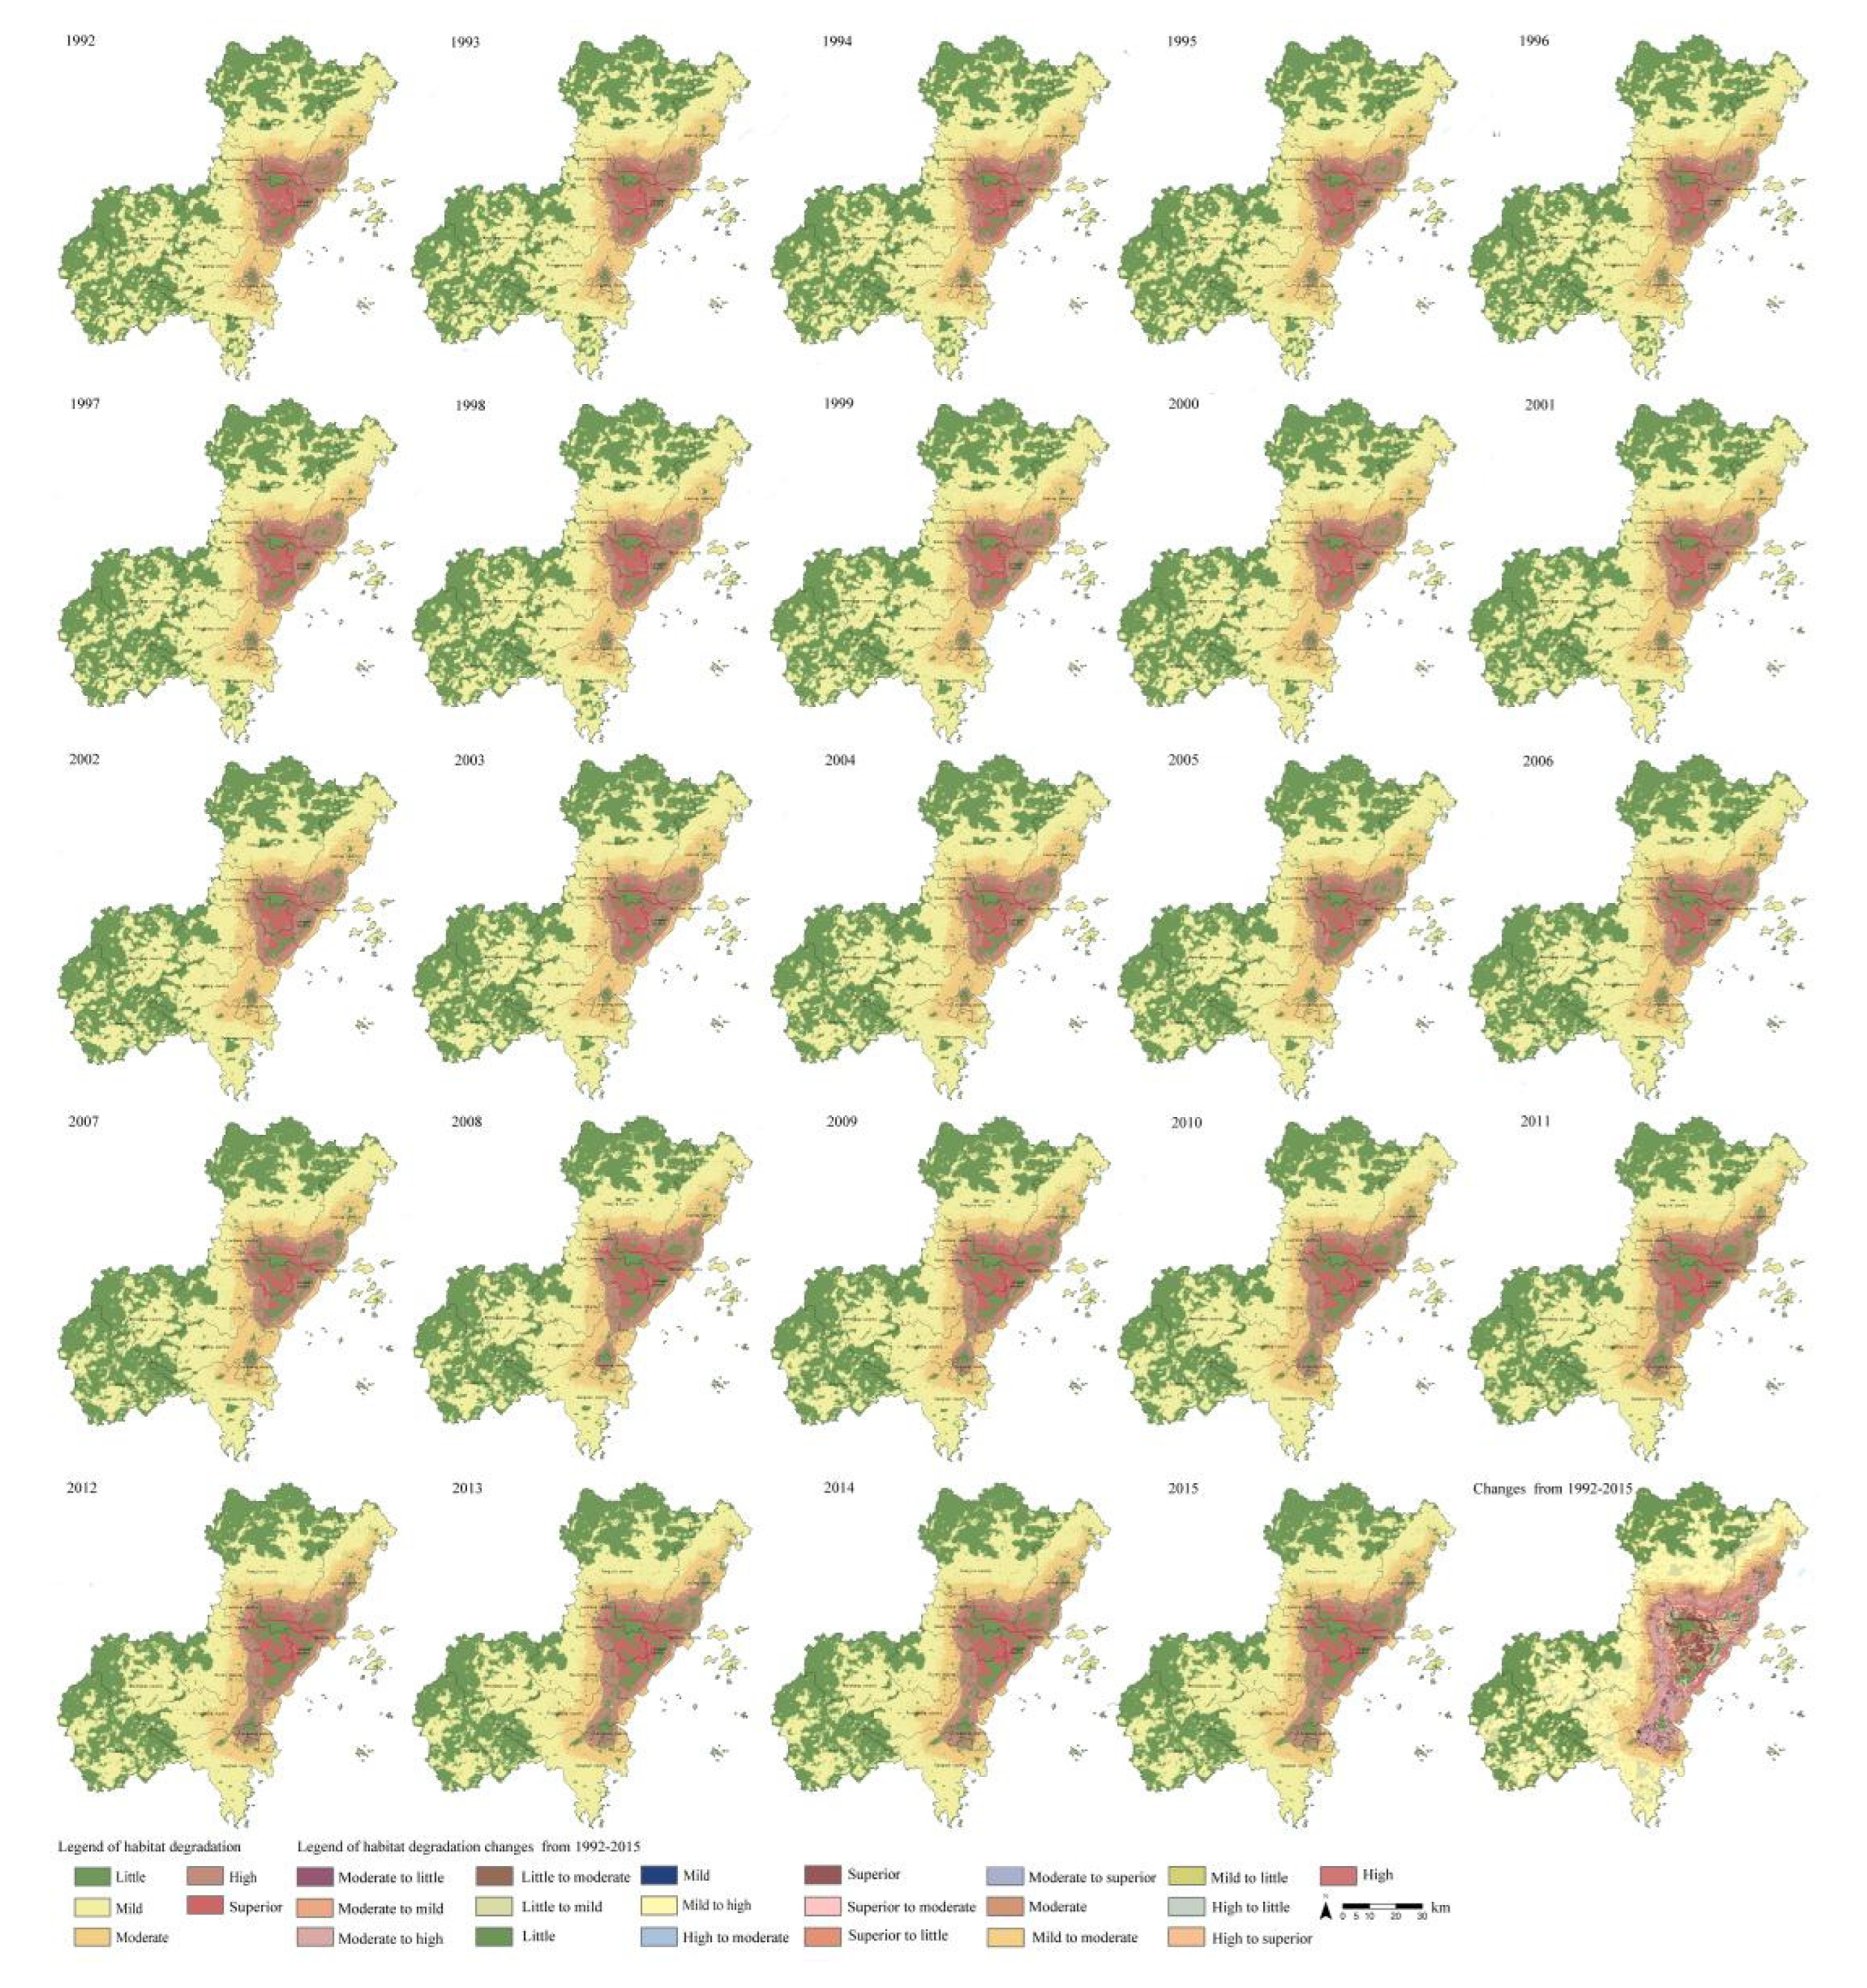
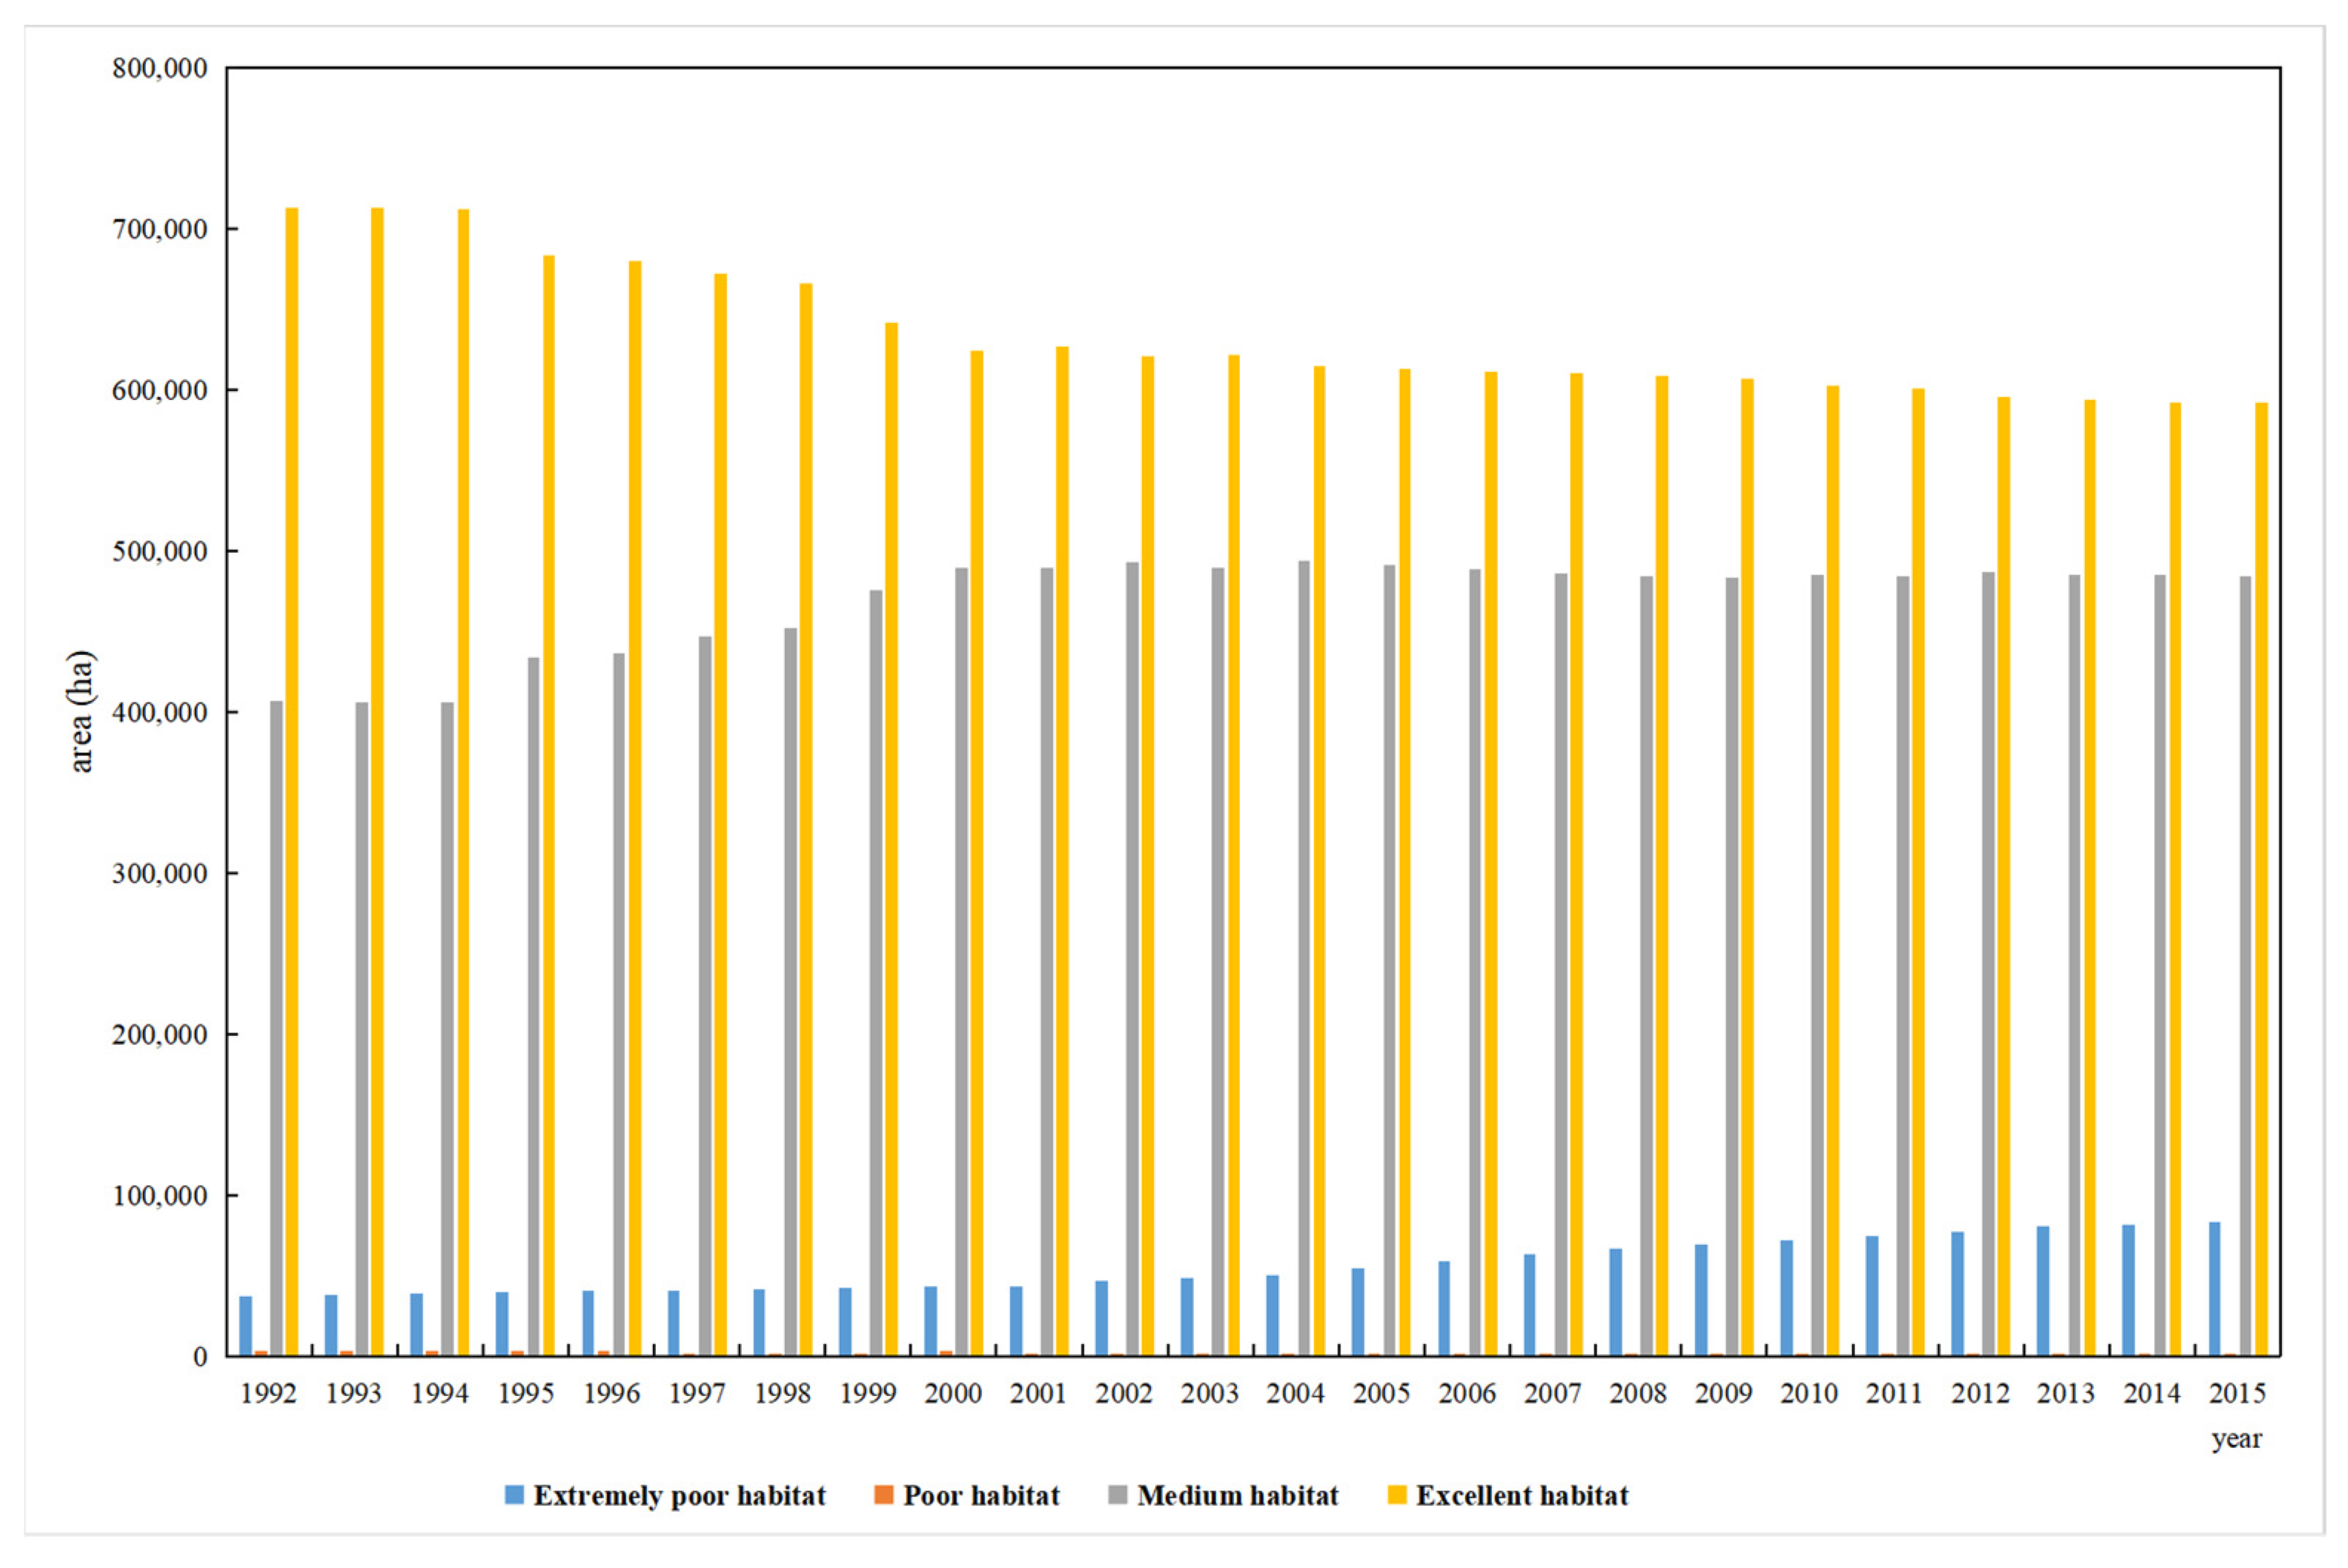
3.2. Spatiotemporal Changes in the Habitat Quality

The value range of habitat quality is (0–1). The larger the value is, the higher the habitat suitability [41]. To explain the changes in habitat quality in Wenzhou City, the results of the calculations of the 24 phases of the habitat quality index were divided into five ranges: 0–0.2, 0.2–0.4, 0.4–0.6, 0.6–0.8, and 0.8–1. The quality of the habitat was then graded according to the following five levels: extremely poor, poor, medium, good, and excellent. Based on these results, it was found that there is no good habitat in Wenzhou City.
The habitat quality in Wenzhou City was relatively good from 1992 to 2015. The area of excellent habitat quality accounted for the largest proportion of the whole city. However, the area of excellent habitat decreased from 1992 to 2003 and then stabilised at ~610,000 ha. The area of medium habitat quality increased from 406,615.78 ha in 1992 to 491,415.81 ha in 2005 and then remained at the same level. The area of extremely poor or poor habitat quality was smaller. The area of extremely poor habitat quality increased from 37,334.59 ha in 1992 to 83,121.74 ha in 2015. During 1996, the area of poor habitat quality sharply decreased by 2894.69 ha and reached 197.83 ha in 1997. Subsequently, the area of poor habitat quality slightly fluctuated, but did not exceed 307.99 ha (Figure 2).
The spatial distribution of habitat quality in Wenzhou City considerably differs. Overall, habitat quality decreases from the west to the east; that is, the average habitat quality in the inland region is better than in coastal counties and cities (Figure 3). Excellent habitat is mainly located in Yongjia, Taishun, and Wencheng counties, followed by Longwan District and Dongtou District. The prime quality habitats decreased in all counties and cities. The habitats in Cangnan County, Ruian City, Yueqing City, and Pingyang County decreased significantly. Yongjia County had a medium habitat quality. Ruian City, Yueqing City, Cangnan County, Pingyang County, Taishun County, and Wencheng County have experienced rapid growth for 24 years. Ruian City rapidly grew from 1994 to 2002 and then stabilised. In 2005, it slowly declined to the 2015 level of Cangnan County. Lucheng District, Longwan District, Longgang City, and Dongtou District have fewer areas of medium habitat quality. The area of poor habitat quality decreased in all counties. It declined rapidly from 1996 to 1997, especially in the Longwan District, which had the poorest habitat quality. The area of extremely poor habitat quality increased in all counties and cities. The rate of increase started to accelerate after 2000, and this trend was noticed particularly in Yueqing City and Ruian City. The area of extremely poor habitat quality in the Ouhai District rapidly increased from 2000 to 2010, ranking third after the Lucheng District. Taishun County and Wencheng County had the smallest areas and slowest growth rates.

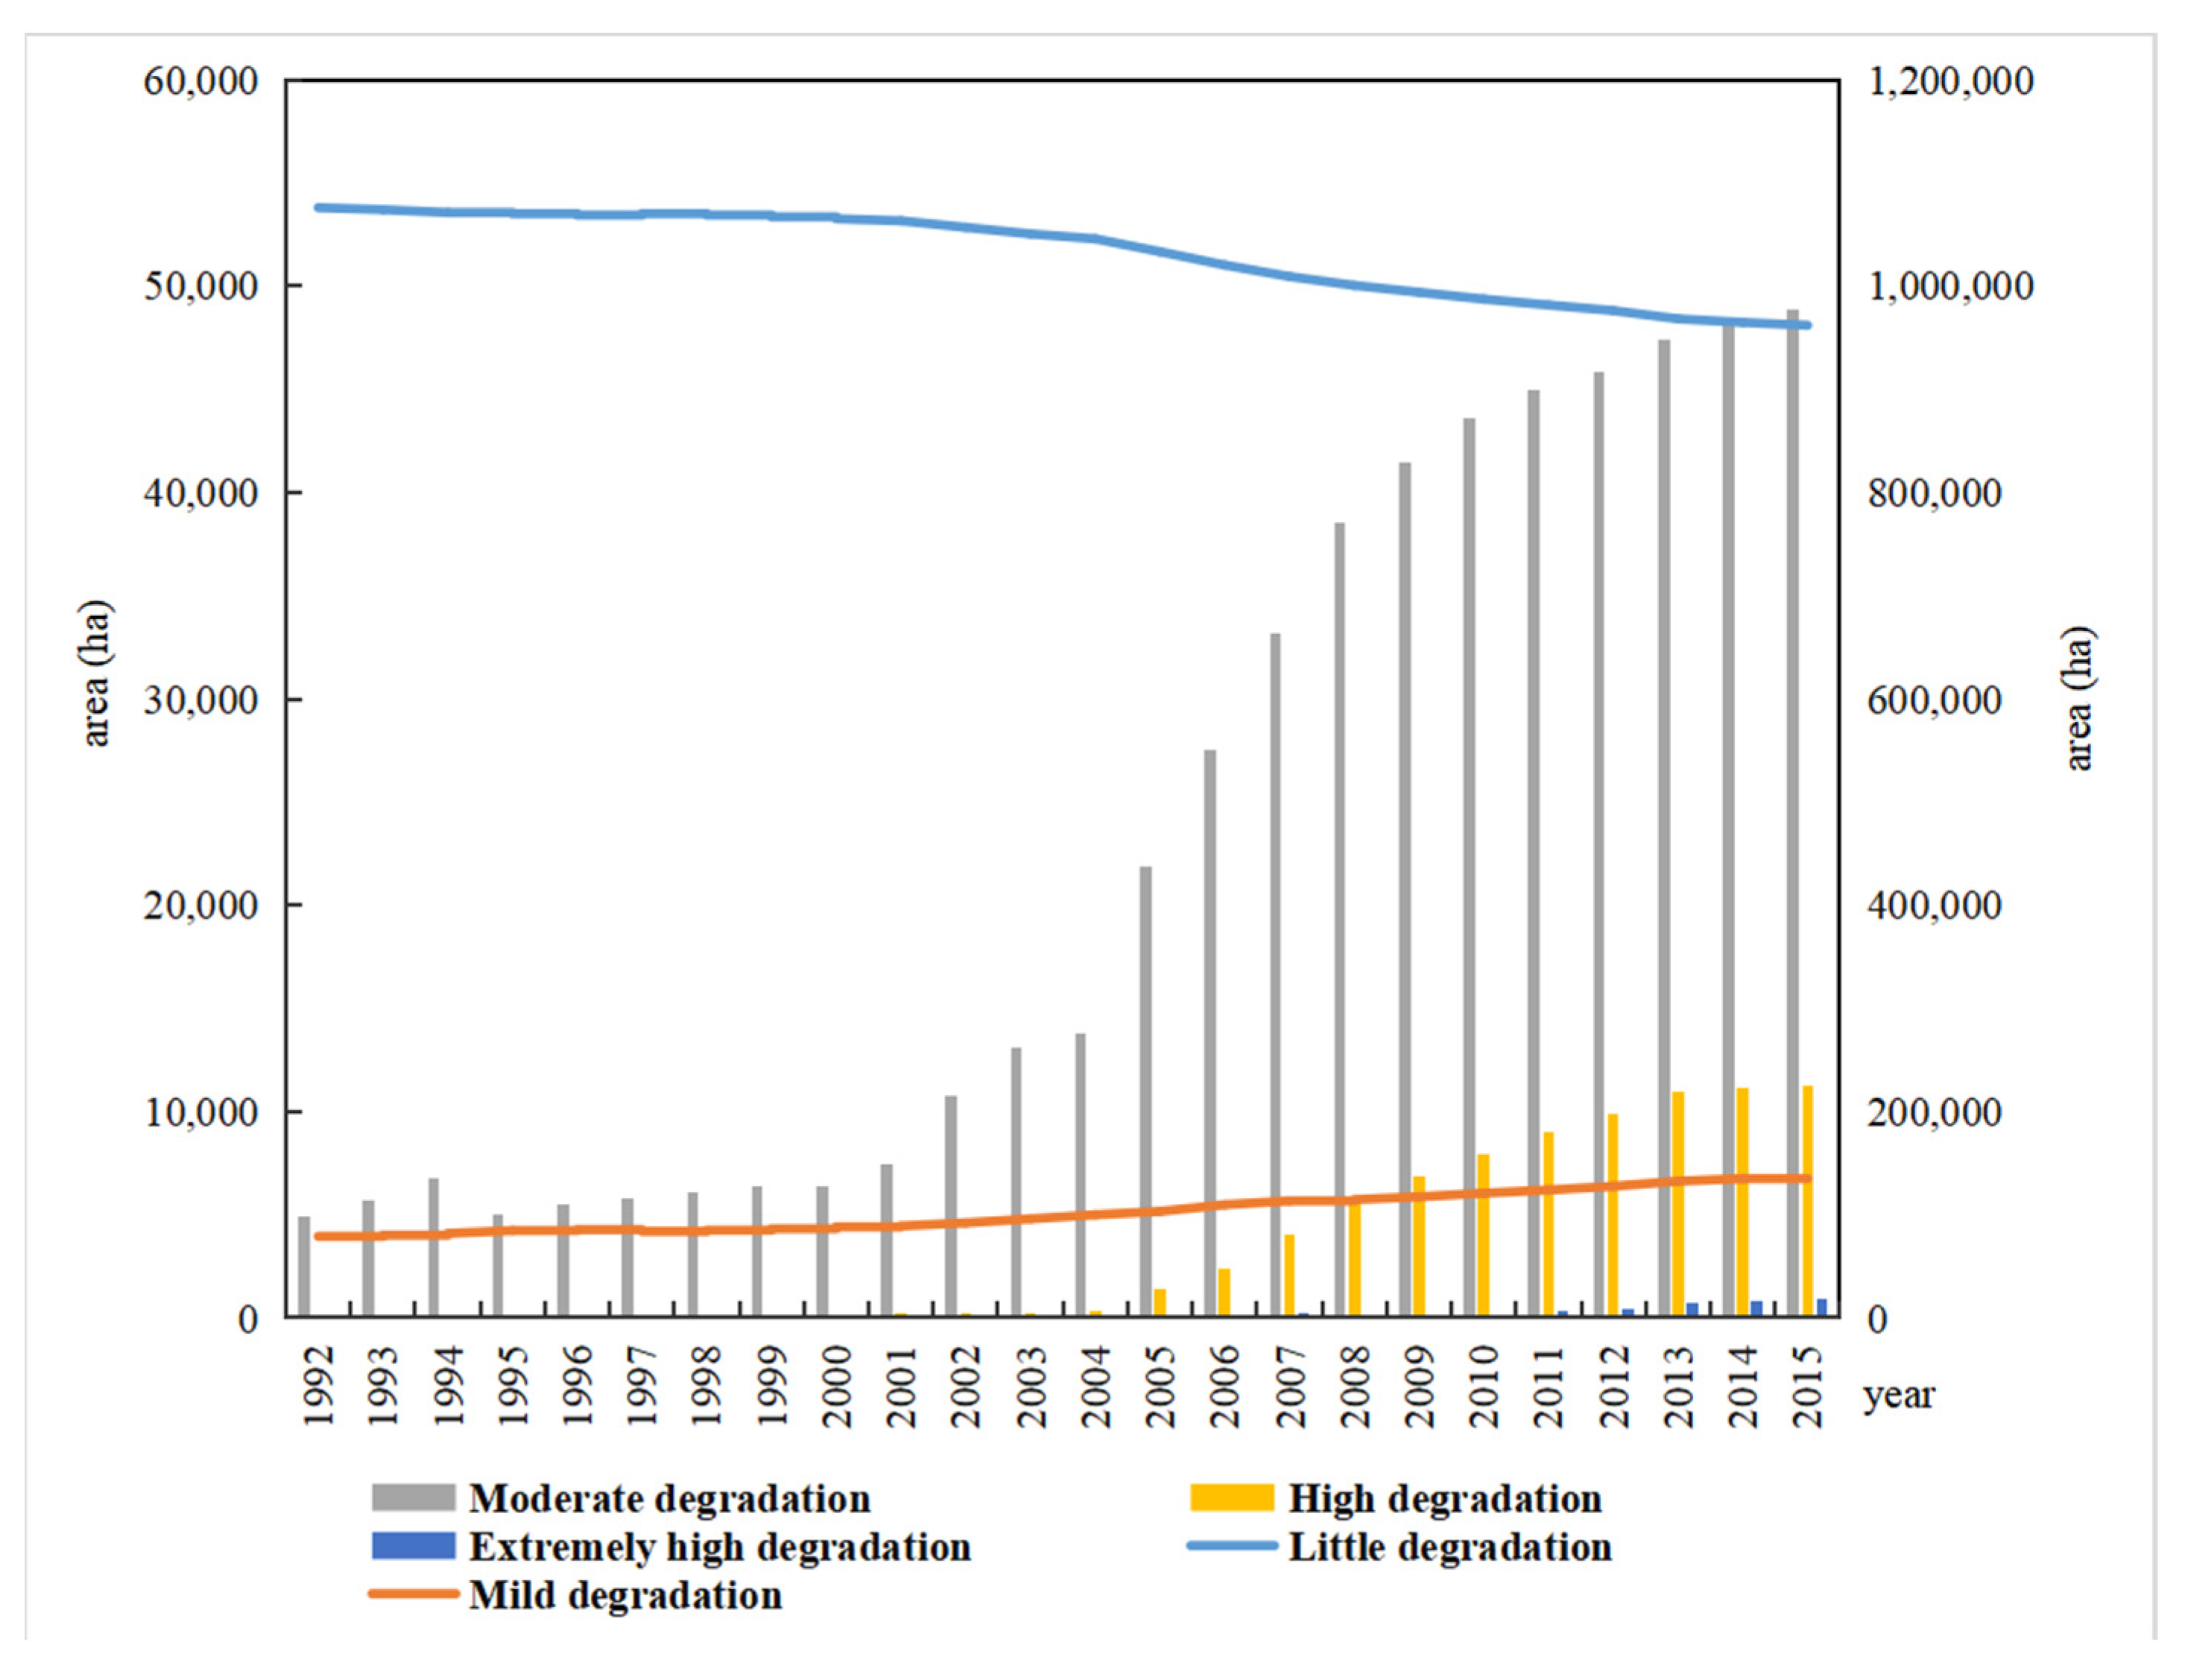
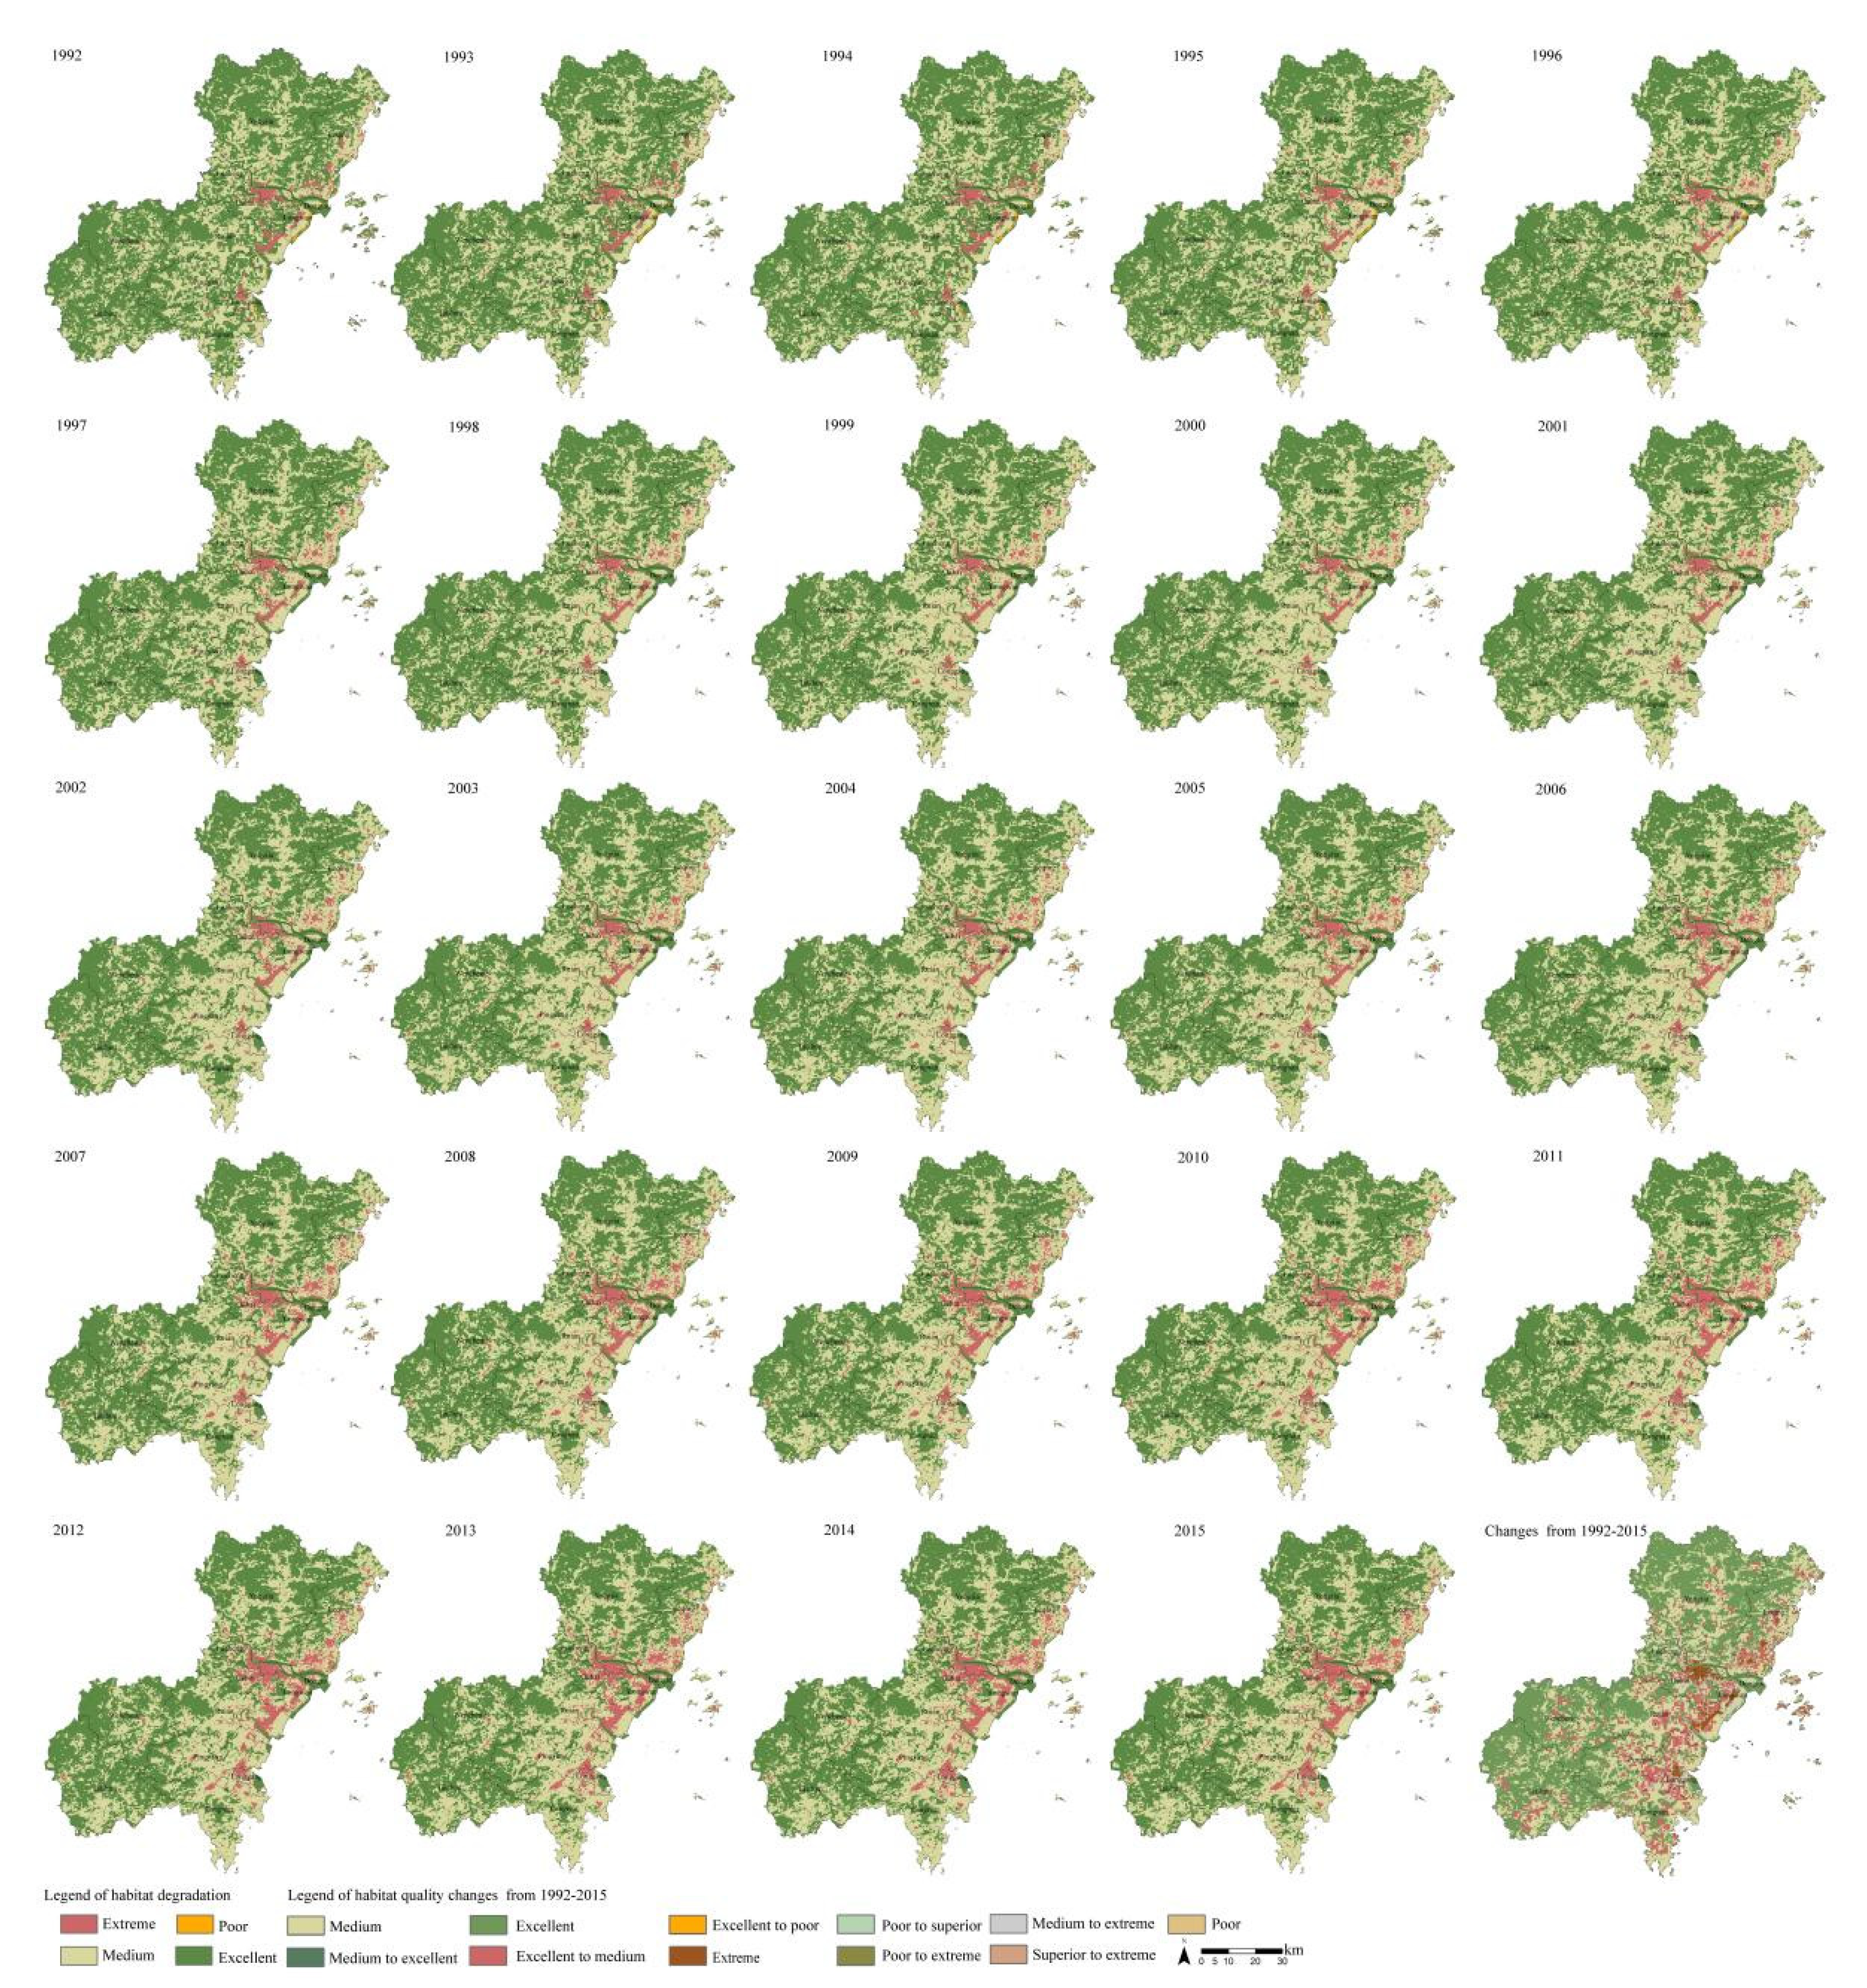
3.3. Relative Level of Habitat Degradation

The degree of habitat degradation ranges from zero to one. The larger the value is, the higher the habitat suitability [41]. To explain the changes in the habitat degradation in Wenzhou City, habitat degradation has been reclassified in GIS into five stages: little degradation (0–0.2), mild degradation (0.2–0.4), moderate degradation (0.4–0.6), high degradation (0.6–0.8), and extremely high degradation (0.8–1).
The land area that experienced habitat degradation in Wenzhou City was relatively low from 1992 to 2015. The areas of little degradation accounted for the largest proportion of the whole city. These decreased over the 24 years, whereas areas with the other four types of degradation increased. Areas of moderate degradation grew the most rapidly. In 2015, these areas accounted for approximately ten times their area in 1992. There were no areas with a relatively high degree of degradation from 1992 to 1995, but they began to appear after this time. After 2004, the growth rate of areas with relatively high degree of degradation accelerated and reached ~11,241.60 hectares in 2015. There were no areas of extremely high degradation from 1992 to 2006. These began to appear after 2007 and reached 902.05 hectares in 2015 (Figure 4).
Coastal areas were the main areas that experienced habitat degradation in Wenzhou City, whereas the degree of degradation of inland areas was relatively low. Areas of little degradation were concentrated in Yongjia County, Taishun County, and Wencheng County; there was a lower proportion of such areas in in Longgang City and the Longwan, Dongtou, Lucheng, and Ouhai districts. The areas of mild degradation increased, except in the Ouhai and Longwan districts. The area of mild degradation in Leqing City remained stable from 1992 to 2000 and then sharply increased. The area of mild degradation was the largest in 2015. In 1992, Pingyang County experienced the least degradation. Over the past 24 years, its rapid growth surpassed that of many other counties and cities; it ranks second. The areas of moderate degradation in each county and city increased by different amounts over the past 24 years. The Ouhai District showed slow growth from 1992 to 2000 and rapid increase from 2000 to 2007. The area of moderate degradation then slightly decreased to 10106.41 ha. After 2004, the growth rate of Ruian City accelerated. In 2012, it surpassed that of Ouhai District. The county accounted for the largest area of moderate degradation in Wenzhou City. After 2000, the area of relatively high degradation was zero. Subsequently, each county and city started to grow. The Ouhai District had the fastest growth rate. It accounted for an area of ~5254.77 hectares in 2015. Before 2006, there were no areas of extremely high degradation in Wenzhou City, but these increased by different degrees in the Lucheng, Longwan, and Ouhai districts and in Yongjia County. The Ouhai District had a rapid rate of growth; the area of extremely high degradation area was ~354.01 hectares in 2015. Before 2011, the area of extremely high degradation in the Lucheng District was ~157.34 hectares. Subsequently, the area exceeded that of the Ouhai District and accounted for the largest area of high degradation area in Wenzhou City (~445.16 hectares; Figure 5).

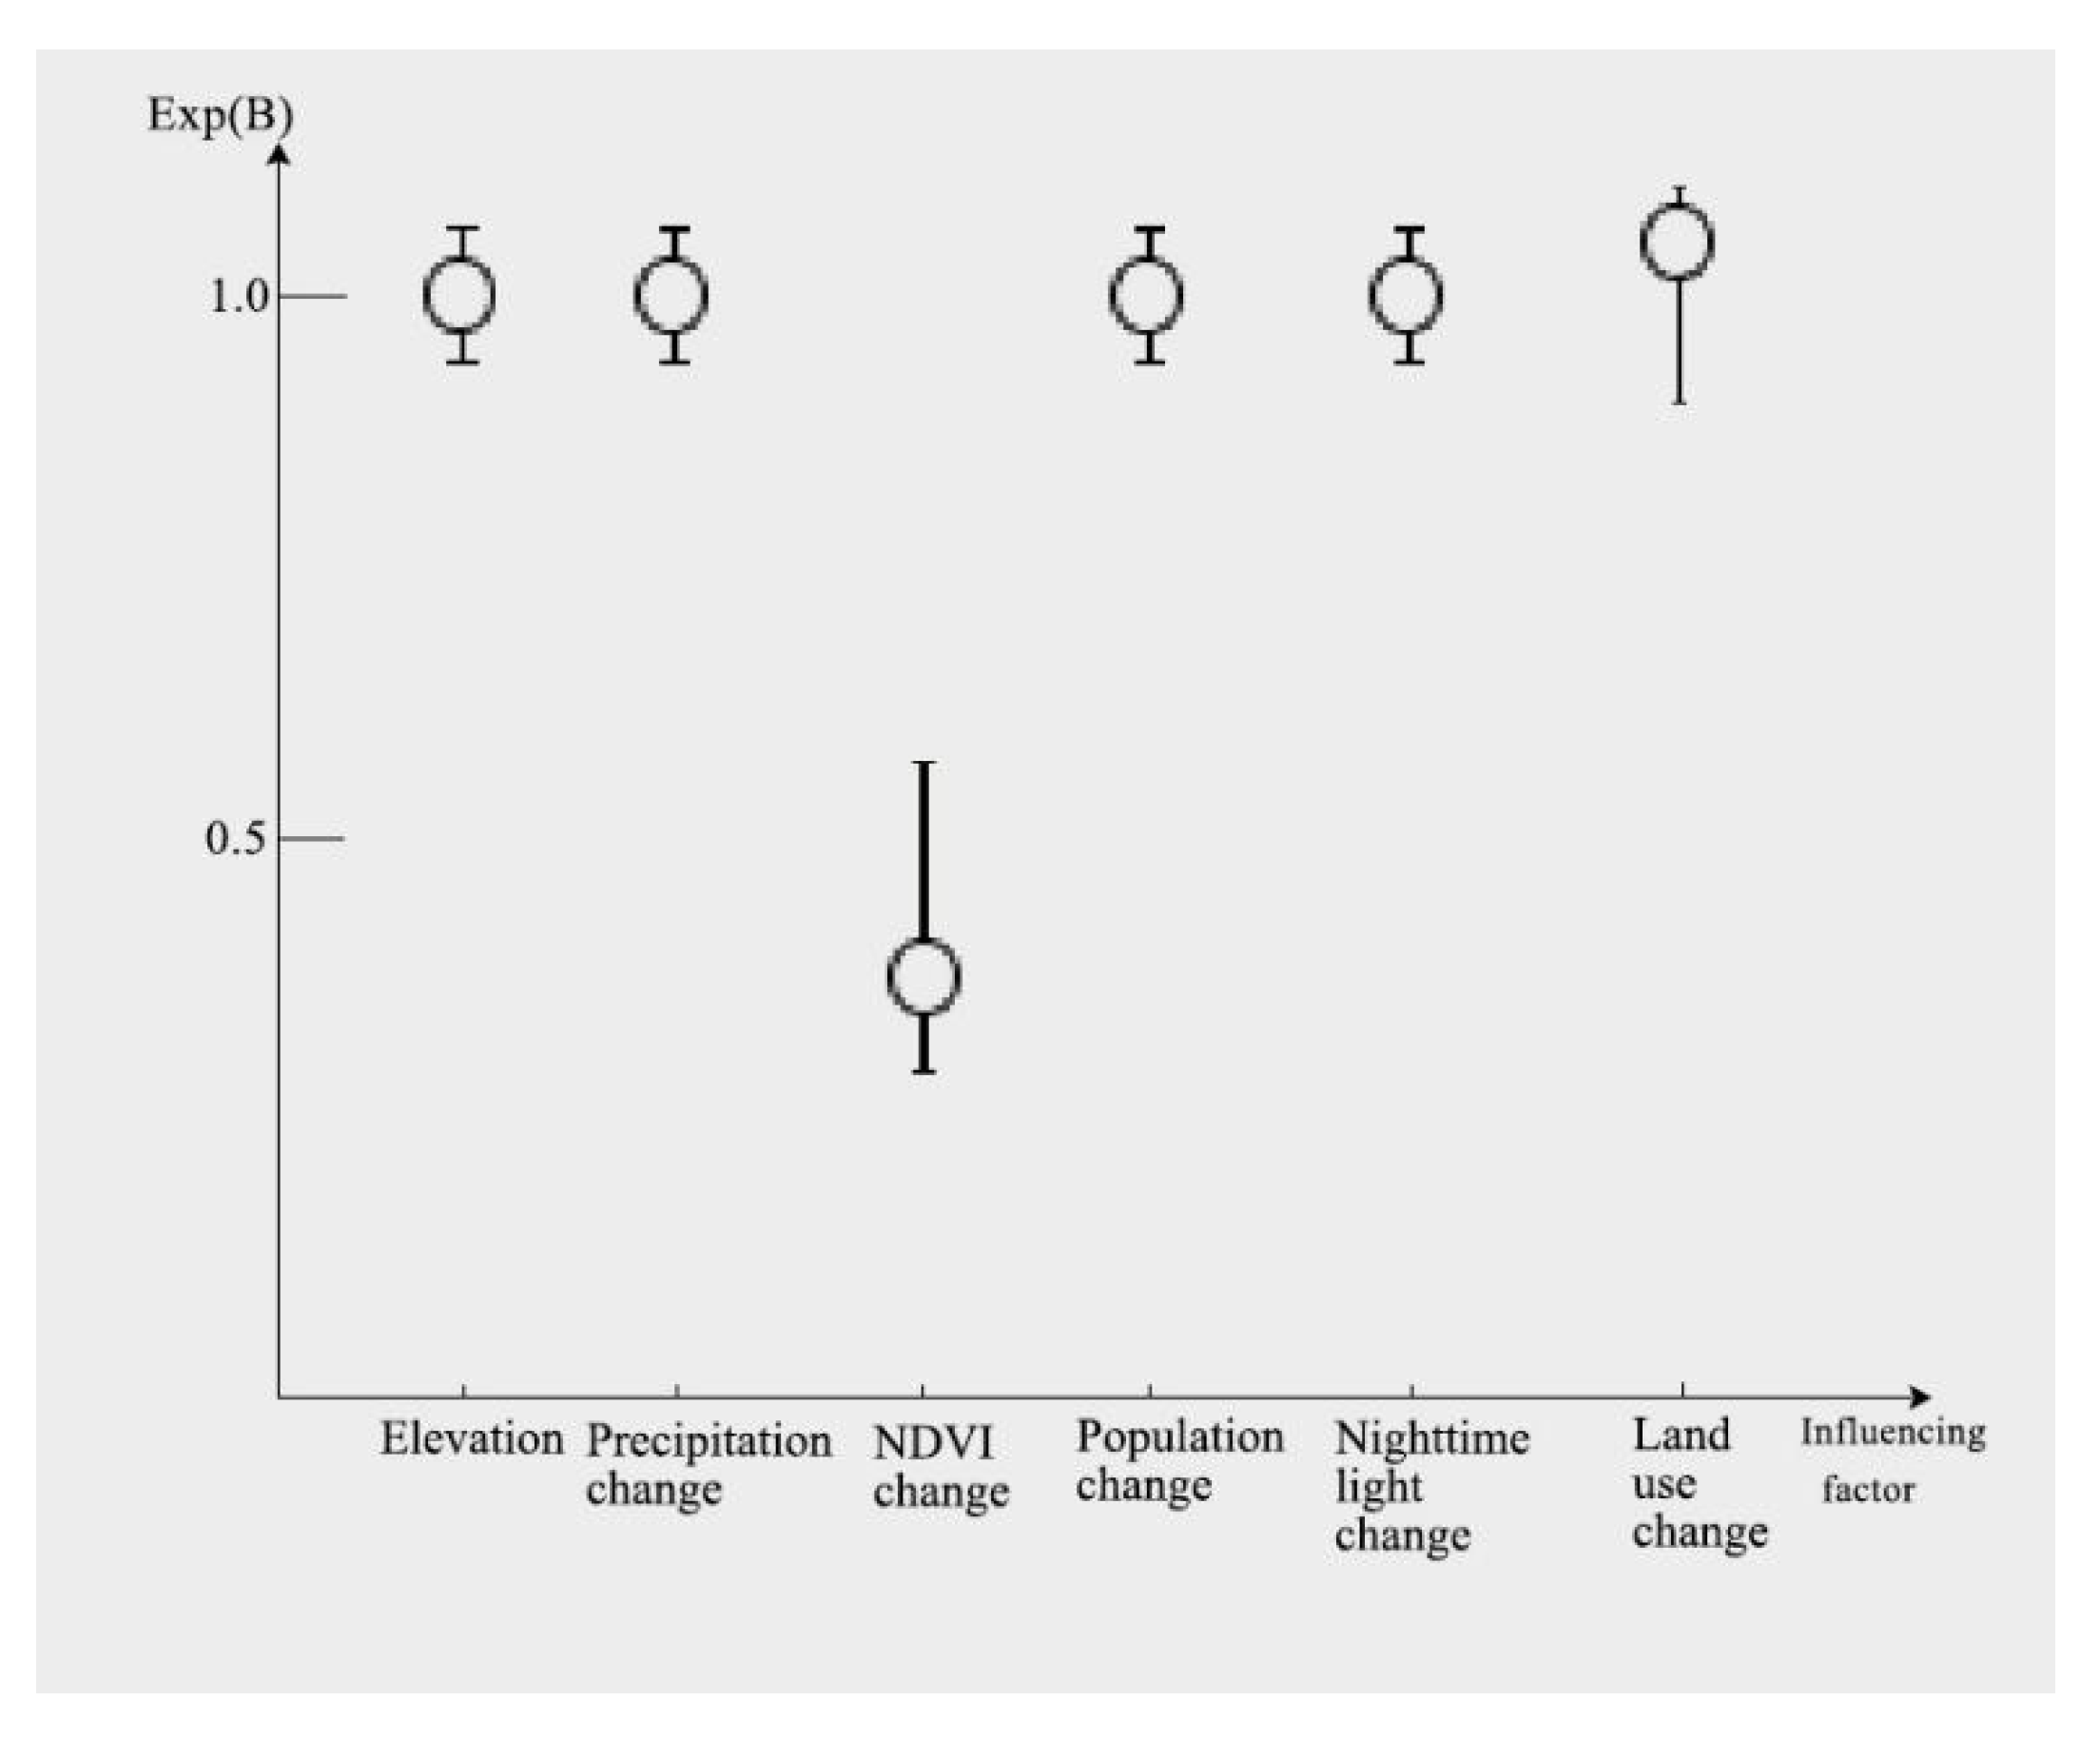
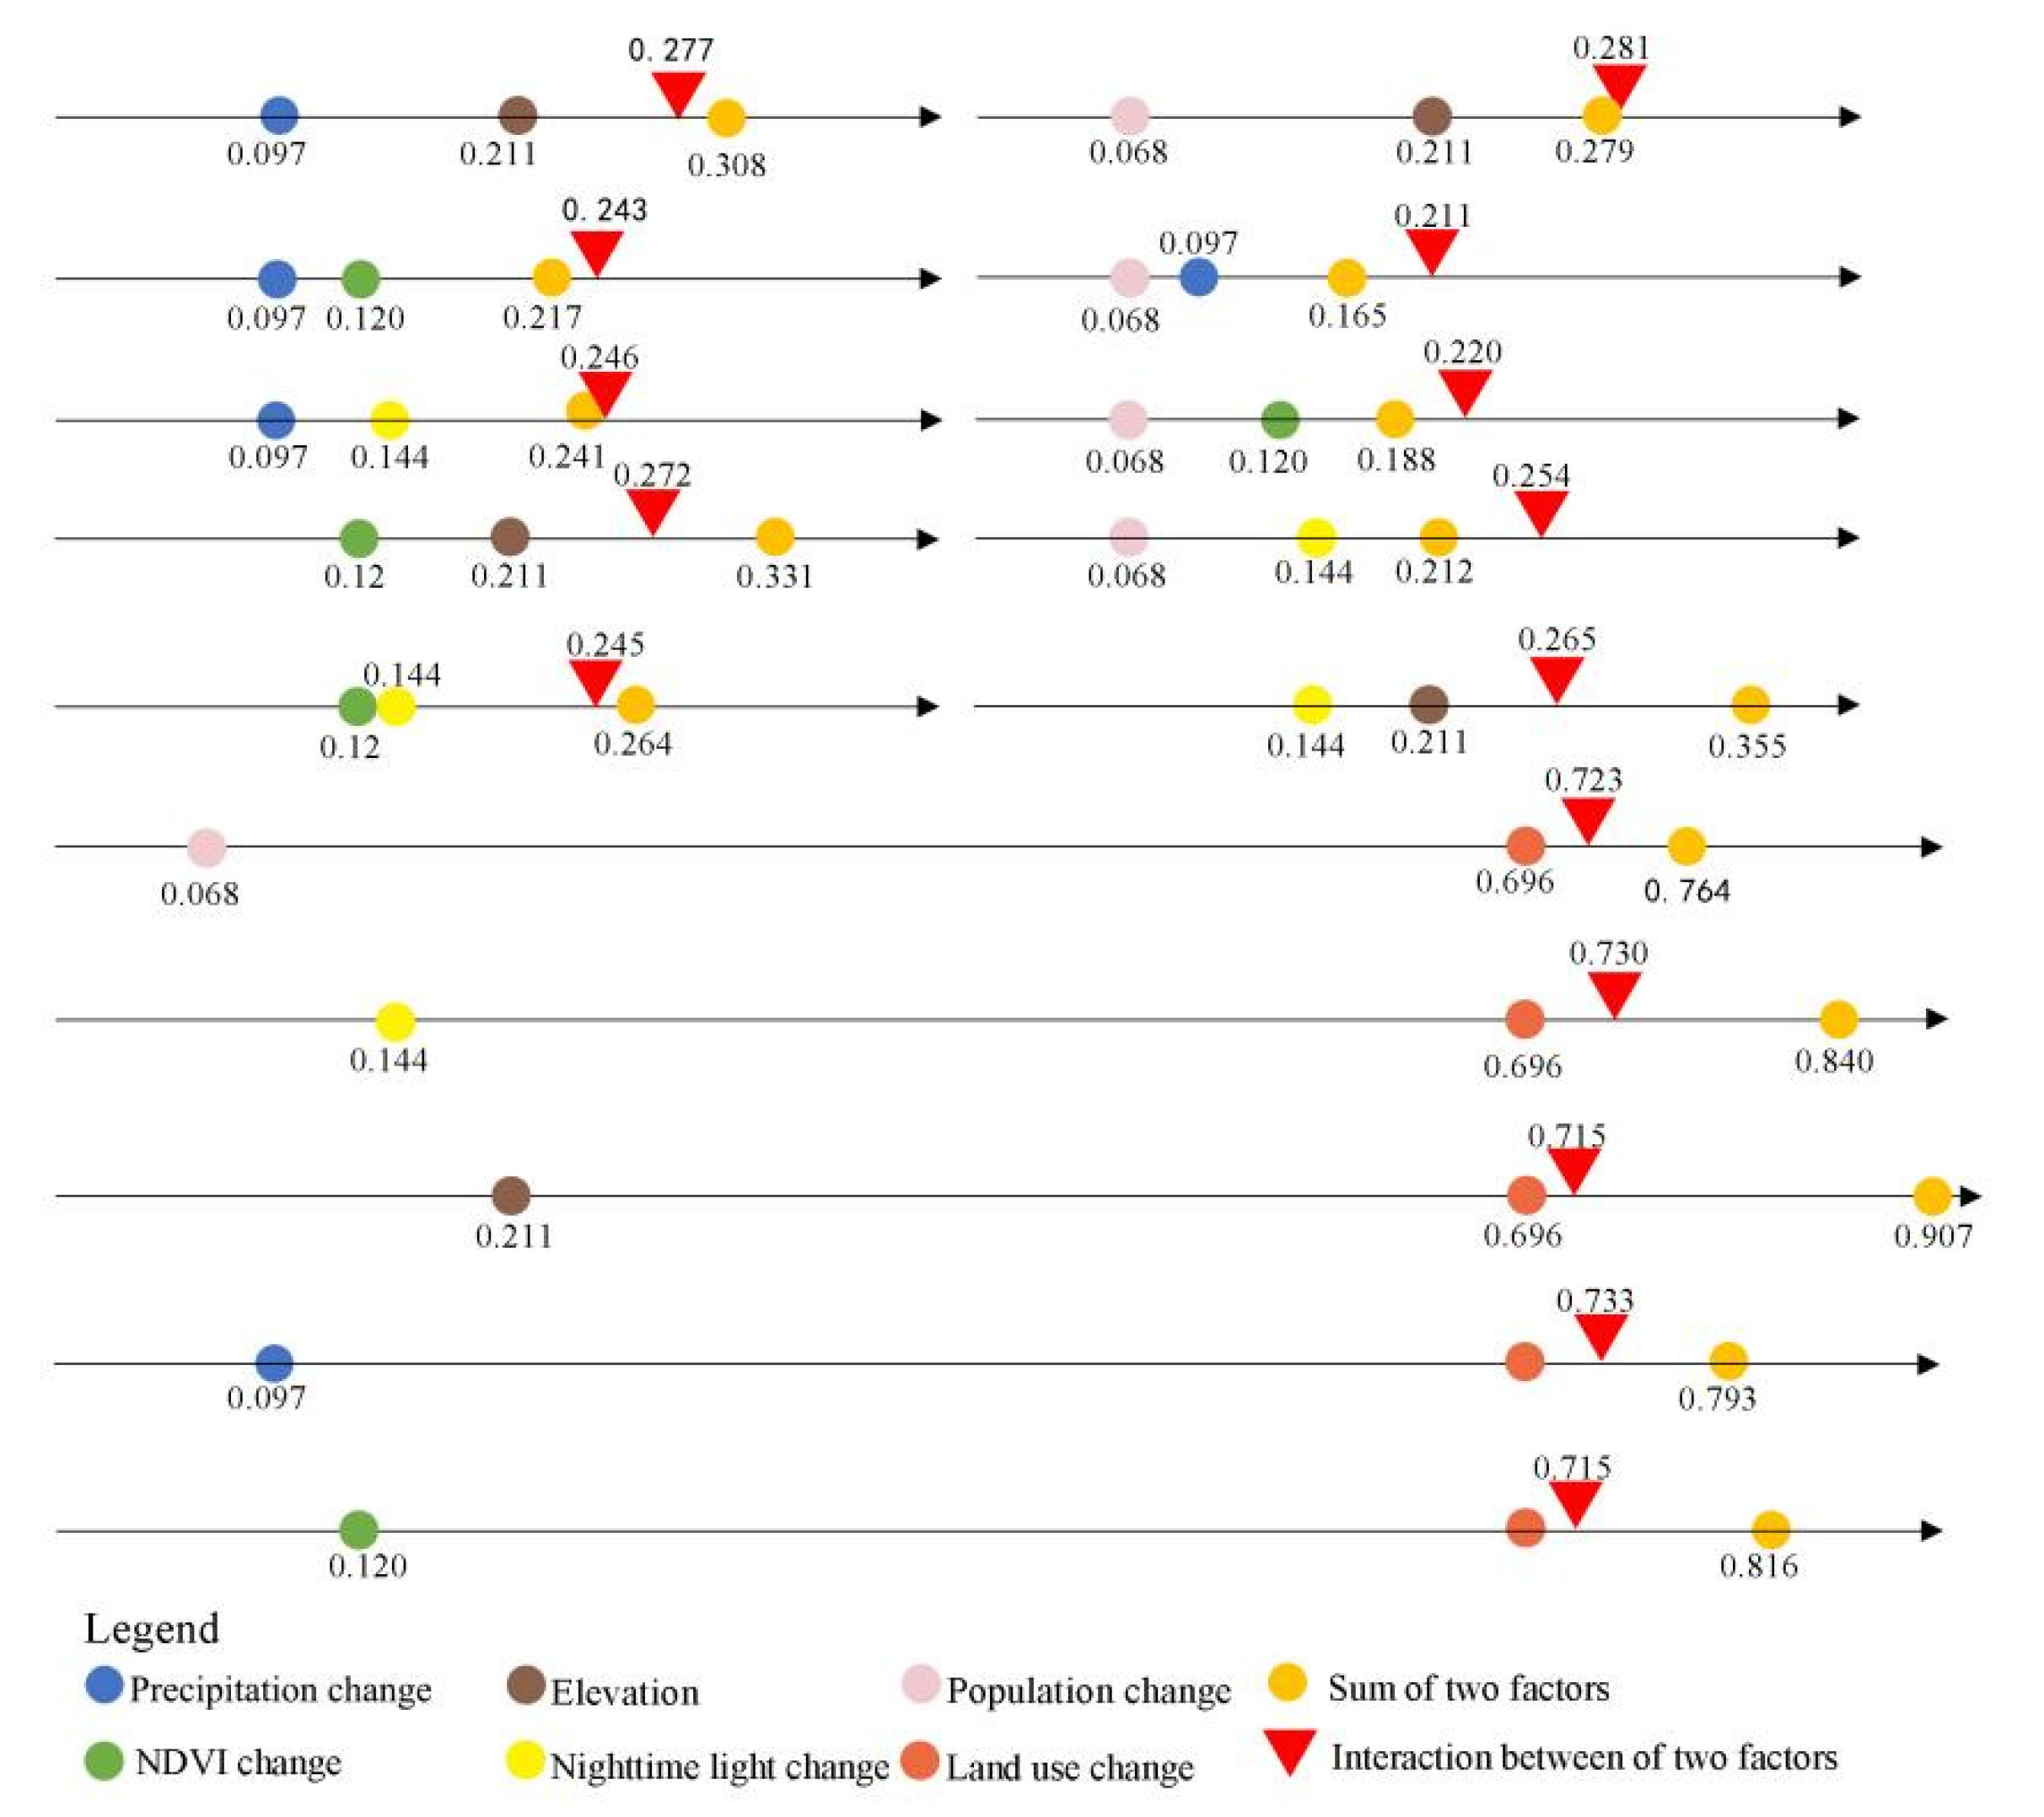
3.4. Analysis of Factors That Affected Changes in Habitat Quality

The natural breakpoint method was used to match the natural and anthropogenic factors with habitat quality in Wenzhou City. The results were imported into the GeoDetector model to calculate the Q value of each factor, to illustrate its influence on the spatial distribution of habitat quality. The result shows that the Q value of each influencing factor can be ranked from large to small as follows: land use change (0.696); elevation (0.211); night-time light change (0.144); NDVI change (0.120); precipitation change (0.097); and population density change (0.068). Therefore, land use change is the key factor that affected the changes in habitat quality in Wenzhou City. As the areas of cultivated land and construction land in Wenzhou City has risen, the intensity of land use has significantly increased. This increased the possibility of changes in land use type from habitat to non-habitat. The effect of elevation is more notable than that of other natural factors. Wenzhou City is surrounded by mountains on three sides and the sea on one side. Landform can be divided into low mountainous areas in the west, low mountainous and hilly basins in the centre, plain and tidal flat areas in the east, and coastal island areas. Plains and hilly areas are conducive to the development of human activities, whereas mountains have a higher elevation and rugged terrain that is not conducive to human activities. The change in night-time light ranks third. In recent years, the rate of urbanisation has accelerated, which significantly contributed to the changes in habitat quality. The increase in the regional economic GDP of Wenzhou City attracts migrants and promotes urbanisation. The transportation networks and infrastructure were significantly improved, but this increased the possibility of a decline in habitat quality.
Analysis of the factor interactions (Figure 6) shows that when compared with single factor interaction, the results of the interactions between each impact factor and other factors are enhanced by varying degrees. Land use ∩ precipitation change (0.733) and population density change (0.730) have the largest values, followed by the land use ∩ night-time light change (0.723), land use elevation ∩ DEM (0.715), and land use ∩ NDVI (0.715). The population density change ∩ precipitation change (0.211) showed the least interaction. There is a notable interaction between land use change and other factors. The land use type significantly affected the distribution patterns of different ecosystems. In addition, the increasing frequency of human activities led to an accelerated transformation of land use types, which increased the ecological pressure of surrounding towns and sped up changes in habitat quality. The interaction among anthropogenic factors was stronger than among natural factors, although natural factors are the foundations of habitat quality; they change slightly with weak intensity. Obvious changes in natural factors such as elevation would not occur without the disturbance of human activities. Therefore, the pairwise interaction among the anthropogenic factors is stronger than that among natural factors or between natural factors and social-economic factors.

4. Discussion

4.1. Analysis of the Habitat Quality in Wenzhou City

From 1992 to 2015, the overall habitat quality in Wenzhou City was good. Habitat quality slightly decreased from west to east. This is mainly due to the rich ecological resources in the western part of Wenzhou City. There are contiguous forest lands in the western part of Wenzhou City with high forest coverage. Economic development is slower in the western region than in the eastern region. According to Pan et al. [51], higher habitats in Zhejiang Province are mostly concentrated in the mountainous and hilly areas of Wenzhou City, which is consistent with the findings of this paper. In 1994, the State Council issued and implemented the Regulations of the People’s Republic of China on Nature Reserves [52]. In the same year, Wenzhou City council established the Zhejiang Wuyanling National Nature Reserve in Taishun County to protect its subtropical forest ecosystem and rare plants and animals, such as pheasants and macaques [53]. In 1997, Wenzhou City established its first national forest park, Zhejiang Yandang Mountain National Forest Park. By the end of 2015, the number of natural protected areas in Wenzhou City significantly increased. It had 32 protected areas at and above the provincial level. During this period, the forest area of Wenzhou City increased by 33,000 hectares and the forest coverage rate increased by 20.9% [33]. Therefore, the quality of excellent habitats in Wenzhou City is well protected, and the quality of habitats in the western region is higher than in the eastern region. In addition, during 1995–2015, urban expansion in Wenzhou City was mainly concentrated in urban centres and coastal areas [54], with the largest area of land occupied by construction land, followed by forest land. The findings of our study are consistent with previous studies mentioned above. The habitat quality in Wenzhou City has been declining year by year in recent years, especially in coastal areas, where it is emergent to establish protected areas or take other effective conservation measures to change the degradation status.

4.2. Analysis of the Factors Affecting the Change in the Habitat Quality

Based on the results discussed in Section 3.3, the social and economic factors are the key factors that have affected changes in habitat quality in Wenzhou City. Based on the Wenzhou City 1992–2015 Yearbook [55], the land area, population, and GDP of Wenzhou City increased by 281 km2, 1.35 million, and 417.619 billion yuan, respectively, mainly in Ouhai District, and in Yueqing City and Ruian City. Based on the adjustment of the land use structure in Wenzhou City (1997–2010) [56], the largest increase in construction land was mainly concentrated in Yueqing City and in the Ouhai and Lucheng districts, which further suggests that areas of extremely poor and poor habitat quality in the Ouhai District, Ruian City, and Yueqing City accounted for the largest proportion of the whole city. Regions with relatively slow population and GDP growth were mainly distributed in Yongjia County, Taishun County, Wencheng County, and the Dongtou District, which corresponded to the regions with the most extensive distribution of superior habitat. LUCC, population density, and economic growth have a notable spatial aggregation effect and the driving forces of social and economic growth in Wenzhou City weaken gradually from the east to the west.
In addition, natural factors play an important role in changes in the habitat quality. The geographical environment restricts the development of human activities in the western region and forest ecosystems are well protected from construction by the creation of protected areas, and the relatively high annual rainfall ensures a suitable environment for the growth of flora and fauna, creating areas rich in species diversity. Therefore, ecological restoration at a national scale should consider designating areas with a long history of excellent habitat quality within the biodiversity protection red line, and strictly controlling the human destruction of ecosystems within the ecological red line. For areas where habitat destruction has been greater and serious fragmentation has occurred in recent years, a combination of biological and engineering remediation measures should be used to actively promote the restoration of natural habitats. It is important to build the protected areas network, with protected areas as ecological sources, and important rivers where land and sea meet as ecological corridors to maintain the stability of habitat quality. The results of Section 3.2 of this study can be used to help optimal integration of the boundaries of protected areas, and ensure ecological measures are taken together to optimise the ecological network pattern, enhance biodiversity, promote the restoration of natural ecosystems, and create a high-quality ecological hinterland.

4.3. Effect of the Different Type of Land Use Change on the Habitat Quality

PCA was carried out using SPSS to extract eight components with a cumulative variance contribution rate of 84.414%, based on the principle that the characteristic root should be greater than one and the cumulative variance contribution rate should reach ≥ 80% [57]. Based on an analysis of the land use change types and eight principal components, it was determined that the main factors that affected habitat quality changes are cultivated land and construction land. The factors that contributed the most to the changes in the habitat quality can be ordered as follows, from large to small: conversion of forest land to cultivated land (0.889), aquatic environments to cultivated land (0.866), forest land to construction land (0.742), grassland to forest land (0.734), aquatic environments to forest land (0.715), and cultivated land to forest land (0.704). Additional data are shown in Tables S3 and S4.
Therefore, the conversion of forest land to cultivated land had the greatest effect on the deterioration of the habitat quality. Based on Section 3.1, the area of forest land decreased sharply around 2000, whereas the area of cultivated land rapidly increased. This was principally due to the promulgation of the Land Management Law in 1998, which stipulated the implementation of a compensation system for occupied farmland and the implementation of measures to protect the balance between the occupation of, and compensation for, occupied farmland for non-agricultural construction. Under this policy, people receive economic benefits from land reclamation, and as a result forest land was converted to cultivated land. Subsequently, the state implemented a policy of ‘returning farmland to forest’ in 2002 to protect and improve the ecological environment. From 2010 to 2014, Wenzhou City enacted the Balance of Arable Land, an act that allocated an equivalent amount and quality of arable land to the local government to supplement the amount of arable land occupied by construction, at the municipal level [58], and cultivated land and forest areas stabilised. Combined with the trend in habitat quality changes shown in Figure 3, it can be concluded that the quality of prime habitat rapidly declined from 1998 to 2000. This decline slowed after 2002. After the Balance of Arable Land was enacted from 2012 to 2014, the area with a prime habitat quality remained stable. Therefore, the effect of relevant policies on habitat quality changes has been validated by this study.
The conversion of aquatic environments to cultivated land also led to a deterioration in habitat quality. The explosive growth of the marine economy of Wenzhou City has led to an increase in land reclamation at many locations and aquatic environments have gradually decreased. Therefore, changes in areas with an excellent and intermediate habitat quality slowed down in Wenzhou City, whereas the areas of extremely poor habitat quality continued to increase, mainly in the eastern coastal areas. The eastern coastal area, which is the core of the economic construction and development of Wenzhou City, is mainly characterised by plains and hills. Frequent reclamation projects and other activities have led to the deterioration of the habitat quality in coastal areas, water pollution, and the continuous disappearance of natural ocean shorelines and harbours. The coastal waters, canals, plain river networks, and urban inland rivers within its boundaries are severely polluted. The eutrophication of water bodies is significant and wetland functions are severely threatened [59].

4.4. Comparison of the Logistic Binary Regression and GeoDetector Models

Logistic regression model analysis was carried out on the same data using SPPS. The contribution of land use changes was the largest, but the p value was greater than 0.05. The Exp(B) values of elevation, rainfall change, population change, and night-time light change were the same (see Figure 7). In contrast, the contribution of NDVI change was the smallest. An increase in the NDVI will likely mean a decrease in habitat quality deterioration, i.e., these two factors are negatively correlated. The Exp(B) values of multiple influencing factors were the same as those obtained using the GeoDetector model. However, the results obtained using the GeoDetector model explained the influence of multiple factors in more detail. In addition, the effect of NDVI change ranked fourth in Section 3.3, which slightly differs from the results obtained from the regression analysis. NDVI reflects the degree of vegetation coverage, which is the basis of the ecological environment and directly affects the quality of the habitat. Its influence is normally greater than of rainfall, as has been confirmed by numerous studies [29,60] The changes in habitat quality as a result of the combined action of these two factors cannot be compared. To conclude, the GeoDetector model is superior to the logistic binary regression model. Its operation is simpler, and collinearity and correlations among various factors are not considered.

4.5. Overall Analysis

Coastal cities are at the forefront of economic development, but they are also habitats for many important plants and animals, including birds; land use changes have led to large-scale losses of natural coastal wetlands [61]. Consequently, many fast-growing coastal cities are under great ecological pressure. In this study, the annual changes in the habitat quality from 1992 to 2015 were analysed, which reduced the lag between the actual change and mapping time compared with analyses of the total change over a five-year period, because the changes analysed could have occurred at any point in this period (Figure 8). For example, the area with a medium habitat quality in Taishun County increased from 1992 to 2000. However, it first decreased and then increased during this period. The increase occurred between 1998 and 2000; therefore, the lag time of the change is two years. Thus, the use of a simple and efficient method to track the annual changes in habitat quality provides time for the mitigation of the habitat degradation in rapidly developing coastal cities of China.
The GeoDetector model revealed the factors that influence changes in habitat quality and then helped determine measures for changing the natural condition of coastal areas [37]. For example, the most influential factor in the changes in habitat quality in Wenzhou City was land use change, particularly the conversion of forest land and aquatic environments into arable land. Consequently, improvements to ecological environment quality in Wenzhou City should focus on increasing urban green space coverage, improving the layout of green space in urban areas, improving water resource conservation and wetland protection, preventing reclamation of aquatic environments, protecting water resources, reducing water pollution, reducing reclamation projects including shore zone restoration and beach restoration, and enhancing the landscape effect and ecological service value of water bodies.
China’s territorial spatial planning includes the evaluation of the carrying capacity of resources and environment and the suitability of territorial spatial development, among which the evaluation of the carrying capacity of resources and environment summarises the characteristics of regional resource and environmental endowments and analyses their strengths and weaknesses according to three different functional directions: ecological protection, agricultural production, and urban construction. This research framework is simple to operate and can be applied in areas where data collection is difficult, to analyse regional ecological conservation by modelling habitat quality, to use habitat degradation to illustrate the direction of town construction, and to explore the factors influencing ecological change, providing a scientific basis for recent implementation measures in territorial spatial planning.
In this study, due to limitations in the collection of endemic species data information, it was not possible to validate the distribution of plants and animals against the quality of habitats simulated by the InVEST model. In the next step of the study, species distribution data could be used as a basis for habitat definition, and a plant ecology approach could be used as a basis for the model, potentially reducing the subjectivity of the results. Habitat quality changes are generally caused by multiple factors. In this study, GeoDetector models were used to explore the interaction between these two factors. However, the interaction between these factors is complex and uncertainties affect the results. In this study, when selecting climate change factors, rainfall change was chosen as an indicator due to the availability of data, but the indicators of climate change could be further refined, e.g., temperature change could be added to the influencing factors, as extreme weather may also influence the choice of sites for human activities, etc. The human factors also should be refined, the addition of policies and government interventions should be considered, and the mechanisms driving the multi-factor coupling should be analysed.
The intensity and interaction between the drivers of habitat quality may change in the future according to some studies, while the main driver may remain the same in the future [21]. This study aims to investigate the factors influencing past changes in habitat quality and to provide scientific guidance for the implementation of next steps in the short and medium term. Subsequent studies can forecast land use changes in the study area and provide a scientific basis for longer-term coastal urban planning in the future.

5. Conclusions

The land use structure in coastal cities, as the pacesetters of national major development strategies, has changed significantly and different land use structures have affected the regional ecological environment. The InVEST model is parameterised by the use of expert knowledge, so that the framework can be extended for use in different coastal cities. In addition, analysis of influencing factors using the GeoDetector model showed that habitat quality in coastal cities is impacted by natural, human, and social factors. Cross-probing between two random factors shows different degrees of enhancement. Significant interactions between land use and other factors were noted in the study area. Land-use types have an important influence on the distribution patterns of different ecosystems and, in combination with increasingly frequent anthropogenic activities, force an accelerated rate of land type change. This increases the ecological pressure on the surrounding towns and accelerates changes in habitat quality. Therefore, attention should be paid to the social and economic development of future cities, the construction of environmentally friendly land use patterns, and targeted action measures that protect and mitigate ecological threats. This study demonstrates that this research framework provides a simple, efficient, and low-cost decision support tool that can provide time to mitigate habitat degradation in the rapidly growing coastal cities of China and provide a scientific basis for ecological civilisation and spatial ecological restoration of the country, leading to a robust and integrated approach to land use planning and management.

Supplementary Materials

The following supporting information can be downloaded at: https://www.mdpi.com/article/10.3390/land11050630/s1, Table S1: Weights of the threat data; Table S2: Sensitivities of the habitat types to each threat; Table S3: Characteristic roots and variance contribution rate derived from the principal component analysis; Table S4: Factors of each component.

Author Contributions

Conceptualization, X.Z. and L.L.; Data curation, Z.X. and J.Z.; Formal analysis, X.Z.; Funding acquisition, L.L. and S.L.; Investigation, L.L., J.Z. and M.C.; Methodology, X.Z. and Z.X.; Project administration, M.C. and S.L.; Software, Z.X.; Supervision, L.L.; Validation, J.Z.; Writing—original draft, X.Z., L.L. and Z.X.; Writing—review & editing, L.L., M.C., S.L. and Q.G.All authors have read and agreed to the published version of the manuscript.

Funding

The study was funded by Distinguished Youth Program of Fujian Agriculture and Forestry University [No. XJQ201932] and the Interdisciplinary Integration Guidance Project of the College of Landscape Architecture, Fujian Agriculture and Forestry University [No. YSYL-xkjc-3].

Institutional Review Board Statement

Not applicable.

Informed Consent Statement

Not applicable.

Acknowledgments

The study was also supported by the Wenzhou Natural Resources and Planning Bureau. The authors very much appreciate their contributions.

Conflicts of Interest

The authors declare no conflict of interest.

References

  1. Xu, Y. Development strategy of China’s coastal cities for addressing climate change. Clim. Chang. Res. 2020, 16, 88–98. [Google Scholar]
  2. Zhang, Y.; Chen, R.; Wang, Y. Tendency of land reclamation in coastal areas of Shanghai from 1998 to 2015. Land Use Policy 2020, 91, 104370. [Google Scholar] [CrossRef]
  3. Van Horne, B. Density as a misleading indicator of habitat quality. J. Wildl. Manag. 1983, 47, 893–901. [Google Scholar] [CrossRef]
  4. Johnson, M.D. Measuring habitat quality: A review. Condor 2007, 109, 489–504. [Google Scholar] [CrossRef]
  5. Aneseyee, A.B.; Noszczyk, T.; Soromessa, T.; Elias, E. The InVEST Habitat Quality Model Associated with Land Use/Cover Changes: A Qualitative Case Study of the Winike Watershed in the Omo-Gibe Basin, Southwest Ethiopia. Remote Sens. 2020, 12, 1103. [Google Scholar] [CrossRef] [Green Version]
  6. Global Assessment Report on Biodiversity and Ecosystem Services 2019. Available online: https://ipbes.net/global-assessment (accessed on 12 February 2021).
  7. Zhang, X.; Huang, X.; Zhao, X. Calculation of Ecology Service Value of Land Use Change in Jiangsu Coastal Area. Res. Soil Water Conserv. 2015, 22, 252–256. [Google Scholar]
  8. Liu, C.; Yang, M.; Hou, Y.; Xue, X. Ecosystem service multifunctionality assessment and coupling coordination analysis with land use and land cover change in China’s coastal zones. Sci. Total Environ. 2021, 797, 149033. [Google Scholar] [CrossRef]
  9. Peng, J.; Xu, F.X.; Wu, J.; Deng, K.; Hu, T. Spatial Differentiation of Habitat Quality in Typical Tourist City and their Influencing Factors Mechanisms: A Case Study of Huangshan City. Resour. Environ. Yangtze Basin 2019, 28, 13. [Google Scholar]
  10. Liang, X.; Yuan, L.; Ning, L.; Song, C.; Cheng, C.; Wang, X. Spatial pattern of habitat quality and drivingfactors in Heilongjiang Province. J. Beijing Norm. Univ. 2020, 12, 56. [Google Scholar]
  11. Fellman, J.B.; Hood, E.; Dryer, W.; Pyare, S. Stream physical characteristics impact habitat quality for Pacific salmon in two temperate coastal watersheds. PLoS ONE 2015, 10, e0132652. [Google Scholar] [CrossRef] [Green Version]
  12. Löffler, F.; Fartmann, T. Effects of landscape and habitat quality on Orthoptera assemblages of pre-alpine calcareous grasslands. Agric. Ecosyst. Environ. 2017, 248, 71–78. [Google Scholar] [CrossRef]
  13. Zheng, Y.; Zhang, P.T.; Tang, F. The Effects of Land Use Change on Habitat Qualaty in Changli County Based on InVST Model. Chin. J. Agric. Resour. Reg. Plan 2018, 39, 121–128. [Google Scholar]
  14. Wei, L.; Lan, S.; Xiong, H.; Shen, Q.; Lu, D.; Chen, X. Habitat Quality Evaluation of Wuyi Mountain National Nature Reserve in 1988–2018. J. Southwest For. Univ. 2021, 41, 93–102. [Google Scholar]
  15. Zhang, M.; Zhang, F.; Li, X. Evaluation of Habitat Quality Based on InVEST Model: A Case Study of Tongzhou District of Beijing, China. Landsc. Archit. 2020, 27, 95–99. [Google Scholar]
  16. Fahrig, L. Effects of habitat fragmentation on biodiversity in China. J. Ecol. 2017, 36, 2605–2614. [Google Scholar]
  17. Sun, X.; Jiang, Z.; Liu, F.; Zhang, D. Monitoring spatio-temporal dynamics of habitat quality in Nansihu Lake basin, eastern China, from 1980 to 2015. Ecol. Indic. 2019, 102, 716–723. [Google Scholar] [CrossRef]
  18. Chen, T.; Feng, Z.; Zhao, H.; Wu, K. Identification of Ecosystem Service Bundles and Driving Factors in Beijing and its Surrounding Areas. Sci. Total Environ. 2019, 711, 134687. [Google Scholar] [CrossRef]
  19. Yan, S.; Wang, X.; Cai, Y.; Li, C.; Yan, R.; Cui, G.; Yang, Z. An Integrated Investigation of Spatiotemporal Habitat Quality Dynamics and Driving Forces in the Upper Basin of Miyun Reservoir, North China. Sustainability 2018, 10, 4625. [Google Scholar] [CrossRef] [Green Version]
  20. Ju, H.; Zhang, Z.; Zuo, L.; Wang, J.; Zhang, S.; Wang, X.; Zhao, X. Driving forces and their interactions of built-up land expansion based on the GeoDetector–a case study of Beijing, China. Int. J. Geogr. Inf. Sci. 2016, 30, 2188–2207. [Google Scholar] [CrossRef]
  21. Li, S.P.; Liu, J.L.; Lin, J.; Fan, S.L. Spatial and temporal evolution of habitat quality in Fujian Province, China based on the land use change from 1980 to 2018. J. Appl. Ecol. 2020, 31, 4080–4090. [Google Scholar]
  22. Liu, Z.F.; Tang, L.N.; Qiu, Q.Y.; Xiao, L.; Xu, T.; Yang, L. Temporal and spatial changes in habitat quality based on land-Use change in Fujian province. Acta Ecol. Sin. 2017, 37, 4538–4548. [Google Scholar]
  23. Song, Y.; Wang, J.; Ge, Y.; Xu, C. An optimal parameters-based GeoDetector model enhances geographic characteristics of explanatory variables for spatial heterogeneity analysis: Cases with different types of spatial data. GIScience Remote Sens. 2020, 57, 593–610. [Google Scholar] [CrossRef]
  24. Brunsdon, C.; Fotheringham, A.S.; Charlton, M.E. Geographically weighted regression: A method for exploring spatial nonstationarity. Geogr. Anal. 1996, 28, 281–298. [Google Scholar] [CrossRef]
  25. Liu, C.; Wu, X.; Wang, L. Analysis on land ecological security change and affect factors using RS and GWR in the Danjiangkou Reservoir area, China. Appl. Geogr. 2019, 105, 1–14. [Google Scholar] [CrossRef]
  26. Xue, X.; Wang, X.; Duan, H.; Yang, L.; Xie, Y. Analysis on Spatio-temporal Evolution of Habitat Quality in Qilian Mountains Based on Land Use Change. Bull. Soil Water Conserv. 2020, 40, 278–284. [Google Scholar]
  27. Wang, J.F.; Li, X.H.; Christakos, G.; Liao, Y.L.; Zhang, T.; Gu, X.; Zheng, X.Y. GeoDetectors-based health risk assessment and its application in the neural tube defects study of the Heshun Region, China. Int. J. Geogr. Inf. Sci. 2010, 24, 107–127. [Google Scholar] [CrossRef]
  28. Wang, J.F.; Xu, C.D. Geodetector: Principle and prospective. Acta Geogr. Sin. 2017, 72, 116–134. [Google Scholar]
  29. Zhu, Z.; Kasimu, A. Spatial-temporal evolution of habitat quality in Yili Valley based on GeoDetector and its influencing factors. Chin. J. Ecol. 2020, 39, 3408–3420. [Google Scholar]
  30. Lin, S.; Li, Z. City profile: Wenzhou-A model city of transitional China. Cities 2019, 95, 102393. [Google Scholar] [CrossRef]
  31. Wenzhou Municipal People’s Government. Natural Resources. Available online: http://www.wenzhou.gov.cn/art/2019/3/22/art_1633785_31546755.html (accessed on 11 September 2021).
  32. Jian, H. A brief history of water resources in Wenzhou. Zhejiang Water Conserv. Sci. Technol. 1996, 23, 60–64. [Google Scholar]
  33. Wenzhou Bureau of Statistics. 2020 Wenzhou Statistical Yearbook. Available online: http://wztjj.wenzhou.gov.cn/art/2020/11/9/art_1467318_58725689.html (accessed on 11 September 2021).
  34. Sharp, R.; Douglass, J.; Wolny, S.; Arkema, K.; Bernhardt, J.; Bierbower, W.; Chaumont, N.; Denu, D.; Fisher, D.; Glowinski, K.; et al. InVEST 3.10.2.post21+ug.gb784d7e User’s Guide. 2020. Available online: https://storage.googleapis.com/releases.naturalcapitalproject.org/invest-userguide/latest/index.html (accessed on 7 March 2022).
  35. Sulla-Menashe, D.; Friedl, M. MCD12C1 MODIS/Terra+Aqua Land Cover Type Yearly L3 Global 0.05Deg CMG V006. Available online: https://lpdaac.usgs.gov/products/mcd12c1v006/ (accessed on 7 March 2022).
  36. UCL-Geomatics. Land Cover CCI Product User Guide (Version 2.0). 2017. Available online: https://www.esa-landcover-cci.org/?q=webfm_send/84 (accessed on 20 August 2020).
  37. Zhu, C.; Zhang, X.; Zhou, M.; He, S.; Gan, M.; Yang, L.; Wang, K. Impacts of urbanization and landscape pattern on habitat quality using OLS and GWR models in Hangzhou, China. Ecol. Indic. 2020, 117, 106654. [Google Scholar] [CrossRef]
  38. Liao, Y.; Wang, X.Y.; Zhou, J.M. Suitability assessment and validation of giant panda habitat based on GeoDetector. J. Geoifor. Sci. 2016, 18, 767–778. [Google Scholar]
  39. Jia, L.; Yankuo, L.; Lujun, M.; Guangyong, X.; Fangkai, Y.; Yan, H.; Peng, X. Effects of wintering site climatic conditions on the population size of white spoonbills in Poyang Lake Nature Reserve. J. Ecol. 2014, 34, 5522–5529. [Google Scholar]
  40. Qiu, C.; Hu, J.; Yang, F. Analysis of conservation effectiveness of nature reserves based on NDVI in Yunnan Province. Acta Ecol. Sin. 2020, 40, 7312–7322. [Google Scholar]
  41. Wu, J.; Li, X.; Luo, Y.; Zhang, D. Spatiotemporal Effects of Urban Sprawl on Habitat Quality in the Pearl River Delta from 1990 to 2018. Sci. Rep. 2021, 11, 13981. [Google Scholar] [CrossRef]
  42. Bai, L.; Xiu, C.; Feng, X.; Liu, D. Influence of urbanization on regional habitat quality: A case study of Changchun City. Habitat Int. 2019, 93, 102042. [Google Scholar] [CrossRef]
  43. Liu, J.; Meng, P.; Gong, X. Accelerating the New Round Amendment of Land Administration Law: Reviews from the Workshop of “Promoting the Amendment of Land Administration Law in Accordance with the Constitution”. China Land Sci. 2015, 29, 16–21. [Google Scholar]
  44. Zhang, L.; Ren, Z.; Chen, B.; Gong, P.; Fu, H.; Xu, B. A Prolonged Artificial Nighttime-light Dataset of China (1984–2020). Available online: https://data.tpdc.ac.cn/en/data/e755f1ba-9cd1-4e43-98ca-cd081b5a0b3e/?q= (accessed on 7 March 2022).
  45. Huang, J.; Tang, Z.; Liu, D.; He, J. Ecological response to urban development in a changing socio-economic and climate context: Policy implications for balancing regional development and habitat conservation. Land Use Policy 2020, 97, 104772. [Google Scholar] [CrossRef]
  46. Zhong, Q.; Ma, J.; Zhao, B.; Wang, X.; Zong, J.; Xiao, X. Assessing spatial-temporal dynamics of urban expansion, vegetation greenness and photosynthesis in megacity Shanghai, China during 2000–2016. Remote Sens. Environ. 2019, 233, 111374. [Google Scholar] [CrossRef]
  47. Sharma, R.; Nehren, U.M.; Rahman, S.A.; Meyer, M.; Rimal, B.; Seta, G.A.; Baral, H. Modeling Land Use and Land Cover Changes and Their Effects on Biodiversity in Central Kalimantan, Indonesia. Land 2018, 7, 57. [Google Scholar] [CrossRef] [Green Version]
  48. Li, X.; Zhou, Y.; Asrar, G.R.; Mao, J.; Li, X.; Li, W. Response of vegetation phenology to urbanization in the conterminous United States. Glob. Chang. Biol. 2017, 23, 2818–2830. [Google Scholar] [CrossRef] [PubMed]
  49. Pearson, K. Principal components analysis. Lond. Edinb. Dublin Philos. Mag. J. Sci. 1901, 6, 559. [Google Scholar] [CrossRef] [Green Version]
  50. Wang, Y.; Wang, J.; Yao, Y.B.; Wang, J.S. Evaluation of Drought Vulnerability in Southern China Based on Principal Component Analysis. Ecol. Environ. Sci. 2014, 23, 1897–1904. [Google Scholar]
  51. Pan, Y.; Bao, H.; Huang, L.; Zhu, J. Characterizing spatiotemporal dynamics and impacts of coastal urbanization on habitat quality in response to coastal booms. Shanghai Land Resour. 2020, 41, 18–24. [Google Scholar]
  52. Gao, J.X.; Xu, M.J.; Zou, C.X. Development Achievement of Natural Conservation in 70 Years of New China. China Environ. Manag. 2019, 11, 25–29. [Google Scholar]
  53. Wenzhou Local History. Nature Reserve. Available online: http://www.wenzhou.gov.cn/art/2019/3/29/art_1633803_31791118.html (accessed on 11 September 2021).
  54. Gao, C.; Feng, Y.; Tong, X.; Jin, Y.; Liu, S.; Wu, P.; Ye, Z.; Gu, C. Modeling urban encroachment on ecological land using cellular automata and cross-entropy optimization rules. Sci. Total Environ. 2020, 744, 140996. [Google Scholar] [CrossRef]
  55. Wenzhou Bureau of Statistics. 1992–2015 Statistical Yearbook. Available online: http://wztjj.wenzhou.gov.cn/col/col1467318/index.html (accessed on 11 September 2021).
  56. Wenzhou City Land and Resources Bureau Net. Wenzhou City Land Use Master Plan (1997–2010). Available online: http://www.mnr.gov.cn/gk/ghjh/201811/t20181101_2324679.html (accessed on 11 September 2021).
  57. Chen, Y.; Huang, L.; Zhou, M. Assessment of Water Quality of the Main Stream of Tuojiang River based on Principal Component Analysis Method. Sichuan Environ. 2021, 40, 133–137. [Google Scholar]
  58. Lin, L.; Jia, H.; Pan, Y.; Qiu, L.; Gan, M.; Lu, S.; Deng, J.; Yu, Z.; Wang, K. Exploring the Patterns and Mechanisms of Reclaimed cultivated land Utilization under the Requisition-Compensation Balance Policy in Wenzhou, China. Sustainability 2017, 10, 75. [Google Scholar] [CrossRef] [Green Version]
  59. Peng, X.; Xu, R.; He, Y. Analysis on coastline and coastal wetland changes in Yueqing bay in recent 30 years. Mar. Environ. Sci. 2019, 38, 68–74+83. [Google Scholar]
  60. Li, Z.; Xu, Y.; Sun, Y.; Wu, M.; Zhao, B. Urbanization-Driven Changes in Land-Climate Dynamics: A Case Study of Haihe River Basin, China. Remote Sens. 2020, 12, 2701. [Google Scholar] [CrossRef]
  61. Jiang, T.T.; Pan, J.F.; Pu, X.M.; Wang, B.; Pan, J.J. Current status of coastal wet-lands in China: Degradation, restoration, and future management. Estuar. Coast. Shelf Sci. 2015, 164, 265–275. [Google Scholar] [CrossRef]
Figure 1. Changes of the forest land and cultivated land areas in Wenzhou City from 1992 to 2015 (left ordinate: grassland, bare land, construction land, and aquatic environments; right ordinate: forest land and cultivated land).
Land 11 00630 g001
Figure 2. Statistical chart of habitats of different qualities in Wenzhou City from 1992 to 2015.
Land 11 00630 g002
Figure 3. Changes in habitat quality in Wenzhou City from 1992 to 2015.
Land 11 00630 g003
Figure 4. Statistical chart of the changes in the areas of habitat degradation in each county of Wenzhou City from 1992 to 2015.
Land 11 00630 g004
Figure 5. Changes in areas with moderate habitat degradation in each county in Wenzhou City from 1992 to 2015.
Land 11 00630 g005
Figure 6. Results of interaction detection of factors influencing habitat quality in Wenzhou City.
Land 11 00630 g006
Figure 7. Model estimation of the influencing forces of the changes in habitat quality in Wenzhou City.
Land 11 00630 g007
Figure 8. The specific working steps of this article.
Land 11 00630 g008
Publisher’s Note: MDPI stays neutral with regard to jurisdictional claims in published maps and institutional affiliations.

