Abstract
Sudden floods frequently occur in the Himalayas under changing climates. Rapid glacial melt has resulted in the formation of glacial lakes and associated hazards. This research aimed to (1) identify flood-prone houses, (2) determine pedestrian emergency evacuation routes, and (3) analyze their relationships to socioeconomic status in the Seti River Basin. Detailed hazard maps were created using field survey results from unmanned aerial vehicle photogrammetry and the Hydrologic Engineering Center River Analysis System. Questionnaire, focus-group, and key-informant surveys helped identify the socioeconomic situation. Inundation maps revealed that most residents are exposed to future flooding hazards without proper evacuation routes. Highly impoverished and immigrant households were at the highest risk in terms of income inequality and migration rate (p < 0.001) and were located on the riverside. The locations of 455 laborers’ houses were significantly correlated with inundation hazards (p < 0.001). Governmental and associated agencies must develop adequate plans to relocate low-income households. Group discussions revealed the need for stronger adaptive capacity-building strategies for future risk management. Pokhara requires better systematic and scientific land-use planning strategies to address this issue efficiently. A similar approach that combines flood modeling, proper evacuation route access, and socioeconomic survey is suggested for this river basin.
1. Introduction
Climate change has increased the threat of global flooding hazards, as indicated by the rising frequency and greater spatial coverage during the last decade compared with those observed in previous decades [1]. Global warming is generally expected to increase the magnitude and frequency of extreme rainfall events, thus potentially impacting riverine hazards [2]. Furthermore, increases in air temperature and heavy rainfall on a regional scale also influence flooding frequency and intensity [3]. Floods often cause enormous damage to lives, property, crops, and infrastructure, and the number of casualties by floods can increase in the future [4,5,6].
Monsoonal floods are a common hazard in Nepal, where glacial lake outburst floods (GLOFs) also threaten human safety and wellbeing [5]. GLOFs can cause catastrophic flooding in downstream areas, severely damaging property in addition to causing loss of life [7]. Melting glaciers contribute to the development of glacial lakes, which may cause lake outbursts. One-fifth of the world’s population depends on water derived from the Hindu Kush Himalayan region [8]. Minimizing loss of life and property damage is crucial and requires a better understanding of GLOFs and their downstream effects [9]. However, studies on GLOF events, moraine dam failure, peak discharge measurement, and their downstream flooding are limited.
Unmanned aerial vehicles (UAVs) are a helpful tool for monitoring and investigating disasters since they can source data from otherwise inaccessible areas. Many recent studies are based on UAV applications for support and assessment of disaster management [10,11,12,13,14,15,16,17]. Furthermore, UAV platforms are currently considered valuable sources of data for inspection, surveillance, mapping, 3D modeling, and the creation of evacuation routes [14,18,19]. Most UAV applications in hydrological research are used for stream and riverscape flood mapping, all of which require continuous monitoring [11,14]. In particular, UAVs can assist with monitoring the state of dams, disaster tracking [20], provide evacuation guidance, and facilitate damage investigations, bank erosion and volcano observation, flood-hazard modeling, and industrial disasters [10,14,16,21,22,23,24]. Accordingly, UAVs can generate an evacuation map over a relatively short period. However, no research has been conducted on GLOFs and flash floods in the Himalayan region and downstream communities.
As unpreventable urban flood events have been increasing with the advancement of technology, flood-vulnerable areas can be identified through 1D/2D modeling to minimize losses of human life and property [25,26]. The Hydrologic Engineering Center River Analysis System (HEC-RAS) model developed by the U.S. Army Corps of Engineers has been widely employed in studies of risk assessment, hazard risk management, and emergency response guidelines in flood-affected areas [27,28,29,30,31,32,33,34,35,36,37,38,39]. HEC-RAS creates one-dimensional (1D) and two-dimensional (2D) steady and unsteady flow simulations [32], and its joint use with GIS is essential to risk reduction programs [33].
Flood impacts are further exacerbated by increasing urbanization [40,41]. This is especially prevalent in developing countries where populations, economic activities, and housing are often concentrated in less desirable flood-prone areas [36]. Various inaccuracies hamper public understanding; for instance, if a major flood disaster is known to generally occur once in a particular period, this leads to a false sense of security that no significant floods will occur for some time, which then carries over to construction planning for dams and other structures in the surrounding area. Moreover, the low-risk awareness of residents living in flood-prone areas is usually considered one of the main causes of low preparedness, which in turn generates inadequate responses [35]. Thus, understanding disaster risk reduction, awareness, preparedness, and adaptation is a challenge [42,43,44,45].
Notably, a flash flood occurred on the Seti River in Pokhara, central Nepal, on 5 May 2012. The flood killed 32 people, left 40 missing (presumed dead), and displaced community buildings and vital infrastructures such as suspension bridges, electric poles, and potable water pipelines [46]. The discharge rate of the flood at a nearby dam site was estimated to be 1450 m3·s−1 [47]. Since then, many studies have examined the actual causal mechanisms of the flood, which have often been attributed to a fall of ~15 million m3 of rock onto glacier ice at the slope bottom of the Annapurna IV peak [48]. Other researchers suggested that a rockfall blockage of the Seti River Gorge occurred a few weeks before the disaster [46,47,48,49,50,51,52,53,54,55] and that a rock/ice avalanche from the northern part of Annapurna IV (~7500 m) dislodged the previous rockfall dam when being swept into the reservoir; however, studies focused on downstream communities are absent.
Socioeconomic vulnerability assessment is another critical component of comprehensive flood risk assessment, which aims to estimate the loss of life and economic damage [56]. Social vulnerability highlights differences in the capacity to prepare for, respond to, and recover from disasters related to time, social groups, and demographic characteristics [57]. The International Centre for Integrated Mountain Development (ICIMOD) researched the socioeconomic vulnerability of communities potentially affected by GLOFs [58]. In particular, Nepal has experienced multi-hazard risks and socioeconomic losses in the recent decade [59]. Furthermore, riverine floods are one of the major weather-related disasters in Nepal, affecting agriculture production and physical infrastructure [60].
Recently, some researchers have focused on either modeling or social approaches to disaster vulnerability. For example, social scientists have identified many ways in which people respond to rapid onset threats from earthquakes, flash floods, tornadoes, tsunamis, and volcanic eruptions (e.g., [61,62,63,64]). A community-based early alarming system would be more beneficial to be introduced because an effective response to the early warnings greatly reduces casualties and loss of life [65]. Some researchers have focused on tsunami caused flash floods and investigated pre-impact hazard communication, immediate post impact expectation, household’s evacuation, public risk perception, and behavioral intentions, [66,67,68].
However, thus far, the two have not been interconnected [69,70,71,72,73,74]. Researchers have examined socioeconomic issues using community-based early warning systems and adaptive capacity-building strategies [75]. Other studies focused on social vulnerability, disaster risk reduction knowledge, preparedness, and adaptation and awareness programs for downstream communities [44,76,77,78]. Research has also focused on the policy-making process and challenges of implementation [79,80]. While several studies focus on dealing with natural disasters, modeling, and social aspects separately, no study has combined these three aspects. This research identifies vulnerable houses, addresses social issues, and determines safe evacuation routes. We, therefore, believe that our suggested route can save lives in an emergency. This type of combined research is very important for a country such as Nepal. The findings of this research can be used as a decision-making tool to support the local government in long-term planning programs. This research is, therefore, different from previous studies.
The present study aimed to: (1) estimate the probability of flood inundation using HEC-RAS to identify vulnerable locations and houses; (2) create an evacuation route map for emergency use; and (3) analyze the relationship between the socioeconomic status of residents and potential flooding in their area. Three major settlements from Masinabagar to KI-sing were examined (Figure 1) for their close proximity to the river and high population density.
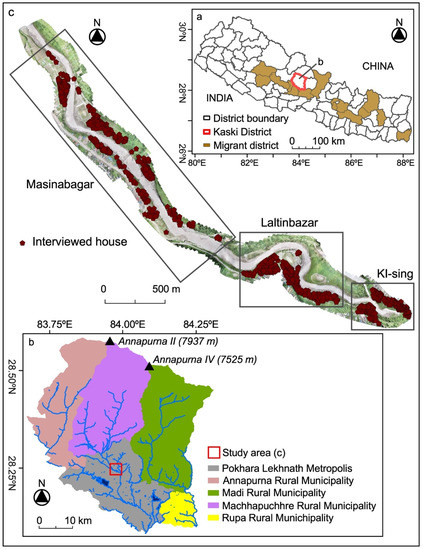
Figure 1.
‘Location of the study area: (a) country of Nepal; (b) Kaski District; and (c) three areas of Masinabagar, Laltinbazar, and KI-sing’. Boxed locations denote the areas shown in Figures 4–6.
2. Materials and Methods
2.1. Study Area
Pokhara (Figure 1) is situated approximately 200 km west of the capital city of Kathmandu and is the second-largest city in Nepal with ~265,000 inhabitants. It is located at an elevational range of 812 m to 1511 m. The Seti River originates from the southern flank of Annapurna Himal. It flows down to the Lesser Himalaya along the steep and narrow Pokhara Valley, which was formed by at least two giant debris-flow events in the past [81,82].
The study area is in the northern part of Pokhara City (Pokhara Lekhnath Metropolis), which is categorized as a high flood risk zone. It is a marginal area close to the populated city center. Recently, the local government introduced a city planning act in Pokhara that strictly prohibited the construction of new houses within 10 m of the riverside; however, no plan exists for those already living in this area. Furthermore, there has been a rapid influx of migrants and the impoverished, thereby pushing legal boundaries to their limits in settlements such as Masinabagar, Laltinbazar, and KI-sing (Figure 1). Thus, vital urban planning and management policies are needed to prevent further damage. Accordingly, three methods have been employed in this study: (1) inundation route mapping, (2) evacuation route mapping, and (3) a socioeconomic survey (Figure 2), which will be detailed in the following sections.
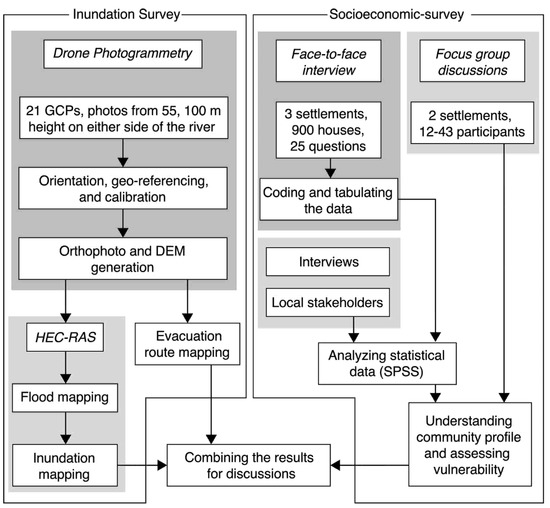
Figure 2.
Conceptual flowchart of the methodology employed.
2.2. UAV (Drone) Photogrammetry
In the first stage of the drone-based aerial survey (DJI Phantom 4 Pro), the ground control point (GCP) locations were finalized. The flight route was planned using Google Earth (v.2.3) to help determine the overall flight number, height, estimated time, and image percentage overlap. GCPs must be visible from the nadir view of the drone and evenly distributed to achieve a uniformly high accuracy throughout the study area. After the 21 GCP locations were identified and finalized, they were marked with a 60 × 60-cm red flag and white enamel cross to assist with drone image identification. The center of the white cross was marked as the GCP, and the kml file of the site was imported into the Drone Deploy software. The flight plan was set for a front overlap of 75% and a side overlap of 70% at the height of 55 m. A total of 25 flights were flown.
A differential GPS survey (Stonex DGPS) of the established GCPs was carried out to identify their proper position. The easting, northing, and elevation of the GCPs were also measured, and 21 points were utilized for 3D georeferencing. After the geotagged images were captured onsite, they were processed to obtain a digital surface model (DSM), contour lines, a digital terrain model (DTM), and orthophoto maps. A DEM is a bare-earth raster where non-ground (man-fabricated) features such as roads and buildings are not included.
DEMs are useful for hydrological modeling, surface analysis, and soil mapping. A DTM is a 3D model visualizing surface elevation data; its structure is based on a TIN composed of vector data. A Triangulated Irregular Network (TIN) represents the terrain surface as a set of interconnected triangular facets. The TIN structure is a vector-based alternative to the traditional raster representation of the terrain surface Digital Elevation Model (DEM). A DTM reinforces a DEM by including man-fabricated features of the bare-earth terrain. Irrelevant images were removed before processing with Agisoft Photoscan (v.1.4.0). The overlapped and geotagged images were processed using image matching algorithms, i.e., the Scale Invariant Feature Transform (SIFT) algorithm. The SIFT algorithm is used to detect and describe local features in digital images. The output data from the initial image processing represent the tie points that were initially matched by the algorithm. These tie points were generated by matching the same features within the overlapped images. Subsequently, point cloud and mesh processing were carried out. The dense stereo matching algorithm generates 3D-textured point clouds to replicate the ground surface. These points were triangulated to obtain the 3D mesh of the project area. The output accuracy of the DSM was modified according to x·Ground Sampling Distance (GSD), where GSD is the distance between the centers of two adjacent pixels in the photo and x is a multiplier. The DTM was generated as per requirement. It is a mathematical model of the ground surface, most often in the form of a regular grid, in which a unique elevation value is assigned to each pixel. The contours derived from the DTM were used to prepare the topographic map. Major and minor contours of 5 and 1 m were used for this research, respectively. A georeferenced orthophoto was also generated (Figure 1). Houses, roads, rivers, and other features were digitized and integrated with the contours to prepare the final topographic map of the project area using ArcGIS (v.10.2).
2.3. Inundation Mapping
2.3.1. HEC-RAS Model
The HEC-RAS model used to calculate the inundation area has a corresponding extension in ArcGIS (HEC-RAS v.4.1.0). Google Earth (GE) was used for the geographic coordinate system with the WGS84 datum. One of the main inputs for the HEC-RAS was a Triangulated Irregular Network (TIN), a type of DTM. A flood inundation map was prepared using both the topographic maps from the drone survey and the DGPS survey at 1-m contour intervals. A DEM map was also prepared at a 1-m contour interval to delineate watershed boundaries. Manning’s Roughness Coefficient (MRC) was employed for different land use types, which can be expressed according to Equation (1):
where Q is the discharge (m3·s−1), A is the cross-sectional area (m2), R is the hydraulic radius (m), S is the friction slope (°), and n is the MRC [83].
2.3.2. Calibration and Model Validation
The channel model was calibrated by adjusting the MRC until the differences between the simulated and observed water levels at channel stations were plotted [39,71,84,85,86]. The observed standard discharge data collected by the Department of Hydrology and Meteorology of Nepal (unpublished) from May 2011 were used as the input. The MRC was iteratively changed within the minimum and maximum values described in [83]. The water surface results in every cross-section from each model were compared with the observed water surface measurements. The MRC value that led to the least discrepancy between simulated and observed values was taken as the calibrated value for the channel (Figure 3). The simulated high flood level was checked against the discharge volumes observed at peak flood levels during the 2012 event for model validation. The selected MRC values were 0.02 (adjusted) for overbanks and 0.035 for the main channel [83]. For inundation mapping, the flood level (peak discharge) was assumed to be the same as that observed on 5 May 2012, i.e., 1450 m3·s−1 [49]. Notably, the measured MRC (n = 0.02) was identical to the modeled value derived by [83].
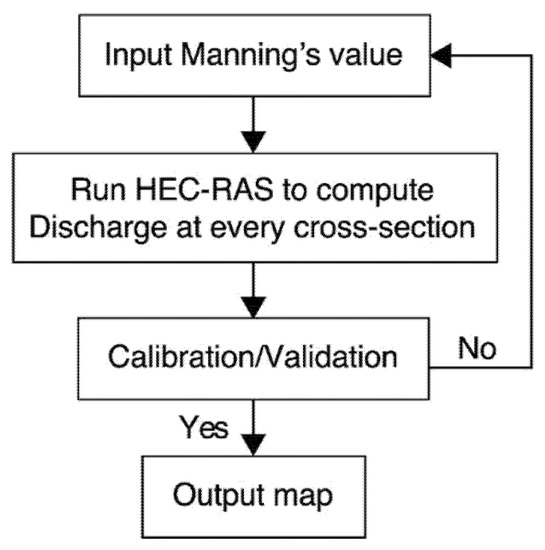
Figure 3.
Conceptual framework of HEC-RAS model calibration.
2.4. Evacuation Route Mapping
2.4.1. Extracting an Existing Road Network
This study extracted the road network (for pedestrians) of three settlements using data from an orthophoto digital map using ArcGIS 10. First, the length and width of each road were obtained and measured from a digital map. Next, the road width and length at some sites were measured again in the field to confirm the data from the digital map. Afterward, the number of people able to use the existing road at once during a flood hazard was determined. Finally, a new evacuation route was suggested, depending on the existing topography and population.
2.4.2. Suggesting a New Route
The evacuation route for pedestrians was based on UAV photogrammetry and the shortest route with respect to the existing road network. During the field survey, local people were asked about the nearest safe site during flood occurrence. At first, existing road conditions were inspected and measured manually in all three settlements (Masinabagar, Laltinbazar, and KI-sing) to identify all possible routes for assisting with the traffic flow from the origin (disaster area) to the destination (safe area). The inundation risk area was initially identified. Afterward, the disaster vulnerability areas that needed evacuation plans were identified. Then, the safe place and exit route were located using the drone photos obtained via ArcGIS. The shortest and easiest route from each house (origin) to a safe location was determined.
2.5. Socioeconomic Survey
Primary and secondary information was used to prepare community profiles and assess vulnerability for the three settlements. Published and unpublished documents containing relevant information were collected and reviewed. The questionnaire survey covered all homes within 100 m of the river area in Masinabagar, Laltinbazar, and KI-sing. Basic income information, migration status, family size, education status, knowledge of hazard risks, evacuation sites, primary occupations of the head of households, and house type (permanent or temporary) were collected from the heads of the households. Migrant or non-migrant statuses were based on a 20-year residency period. Such a survey was necessary for Masinabagar and Laltinbazar, where many families had immigrated from different areas in recent years (Figure 1a). Per capita incomes were categorized based partially on a United Nations criterion [87,88], in which low income (i.e., extreme poverty) was defined as an annual income of ≤1025 USD, lower-middle incomes were those with a per capita gross national income between 1026 USD and 3995 USD, upper-middle incomes were between 3996 USD and 12,375 USD, and high-incomes were those >12,375 USD.
Focus group discussions in two settlements of Masinabagar and Laltinbazar were conducted in November 2015 to collect information on community-level problems faced after the 2012 flood, infrastructure development and other related activities, institutions, hazards, risk evacuation sites, and refugees. Lecturers from Prithivi Narayen Campus, Pokhara, a local primary school teacher, and NGO staff helped as facilitators. There were 12 participants in Laltinbazar and 43 in Masinabagar. The discussions ranged from 1 to 3 h.
Furthermore, teachers, administrative officers, local political leaders, NGOs, international non-governmental organization (INGO) staff, and FM radio employees were interviewed to collect information on flood disaster challenges and future disaster mitigation efforts. These members actively participated in the 2012 relief distribution program. A checklist was prepared to record the information gained through these interviews.
For the statistical analysis, we used the interquartile range (IQR). The IQR is a measurement of the variability of the median. More specifically, the IQR tells us the range of the middle half of the data. Another method we used for this study is the Kruskal–Wallis test. It is a nonparametric approach to one-way ANOVA. The procedure is used to determine if there are statistically significant differences between two or more groups of an independent variable on a continuous or ordinal dependent variable. We used a chi-square test to compare observed results with expected results. A low value of chi-square implies that there is a high correlation between the two sets of data.
All statistical analyses were completed in SPSS v.17. Interquartile ranges (IQRs), Kruskal–Wallis tests, and chi-squared tests were used to compare the inundation values and interview data. Data are presented as medians and IQRs, and p < 0.05 (two-tailed) was considered significant in all analyses.
3. Results
3.1. Inundation Mapping
Flood inundation and evacuation route maps were prepared from Masinabagar to KI-sing. Figure 4, Figure 5 and Figure 6 contain portions of the map for each settlement.
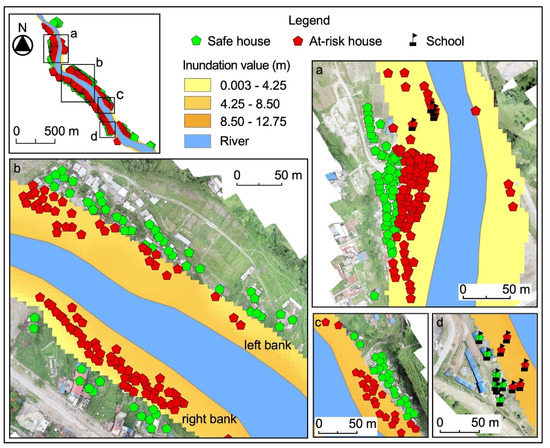
Figure 4.
‘Inundation map in Masinabagar: (a) upper area; (b) central area; (c,d) lower areas.’ Locations of the interviewed households are shown as safe houses and at-risk houses.
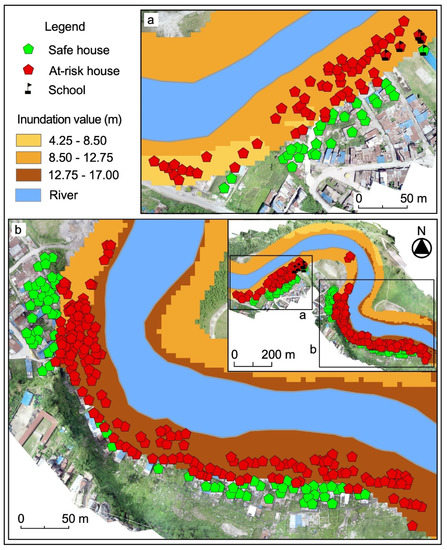
Figure 5.
‘Inundation map in Laltinbazar: (a) western area; and (b) eastern area.’ Locations of the interviewed households are shown as safe houses and at-risk houses.
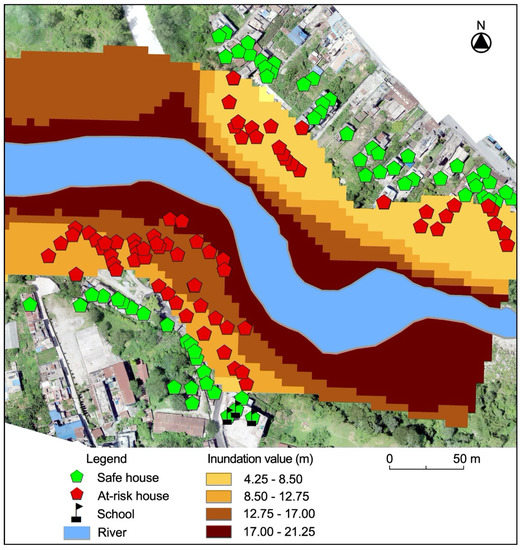
Figure 6.
Inundation map in KI-sing. Locations of the interviewed households are shown as safe houses and at-risk houses.
Figure 4a shows that of the 466 buildings and non-residential structures, 268 are situated within the inundation area in Masinabagar, including one school, two churches, four crematoriums, 13 livestock farms, nine restaurants, and two warehouses. Of the 152 houses (including livestock farms), 95 are situated within the inundation zone. One primary school (Shramik, grades 1–5) is located near the suspension bridge in Masinabagar. The Shramik school is located entirely within the inundation zone. If a flood hazard were to occur during the day on weekdays, the 70 students would be at severe risk. Thus, the immediate relocation of this school is imperative.
In the left bank area shown in Figure 4b, the total number of households was 71 (total population 360), of which 33 houses and a few livestock farms are situated within the inundation zone. There are 59 total households (population 274) in the right bank area in Figure 4b, and all are situated within the inundation zone. Similarly, Figure 4c displays another vulnerable location, where out of the 46 houses, 22 are within the inundation zone (population 247). Lastly, Figure 4d shows a primary school located between the Yamdi Khola and Seti River named Bal Kalyan Basic, which educates 172 students. Five of the school’s buildings are within the inundation zone; thus, they should also be relocated as soon as possible.
Figure 5 shows the interviewed houses in Laltinbazar, where 232 of the 329 houses (population 1800) are located either within the floodplain or along slopes with low heights relative to the river water surface. Such topographic characteristics can lead to extensive flood damage and loss of life or property. In Figure 5a, 59 of the 87 houses are situated in the inundation zone, in addition to one lower secondary-level school (Ratna Basic, grades 1–8). The school has 103 students, and four of its five buildings are within the inundation zone.
Of the 210 houses in KI-sing (population 786), 68 are situated within the inundation zone. A deep gorge starts immediately outside the city (right edge of Figure 6), and if a flood were to occur while the gorge was blocked, the expected area of water inundation would expand. Within the area depicted in the right bank in Figure 6, there are temples, houses, a community center, a research center, and a school. Of the 69 houses on this site, 45 are at risk of inundation. Of the 141 houses shown in the left bank in Figure 6, 23 are within the inundation zone.
Table 1 presents the flooding risk by building type for each location. In Masinabagar, a total of 268 buildings that house a population of 1294 are in danger, including 229 households, 13 livestock farms, 9 school buildings, 9 restaurants, 4 crematoriums, 2 churches, and 2 warehouses. The present routes of these residents are insufficiently prepared for emergency evacuations, as previously stated. The situation in Laltinbazar is similar, where 232 buildings were within the inundation zone and exhibited a population of 1240; these included 225 households, 4 schools, and 3 warehouses. In KI-sing, the situation is slightly better; however, 68 buildings, including 32 households, 18 community centers, 11 temples, 4 crematoriums, and 3 research centers (total population 130), will potentially be inundated in flooding.

Table 1.
Safe and potentially inundated buildings by type.
3.2. Evacuation Route
No flood hazard maps are available in the study area. There are no evacuation routes designated by the city or central government. This study, therefore, identified the existing pedestrian routes, which can be used as evacuation routes by the locals.
There is insufficient route space for all residents in an emergency evacuation situation; therefore, multiple routes were suggested to reduce the traffic flow from houses to safe destinations. Accordingly, this area requires appropriately planned and sufficiently broad evacuation routes. Our suggested evacuation route is for pedestrian use only. Both the existing and suggested routes can be used in emergencies as evacuation routes. Our suggested route is based on population, elevation differences, shortest distance, and total length (see Table A1). The safe destination is situated a little far from the settlement because we suggested a place at an altitude at least 1 m higher than the altitudes of existing houses. We consider the place higher than 1 m as safe for immediate and temporary shelter (Table A1).
3.2.1. Masinabagar
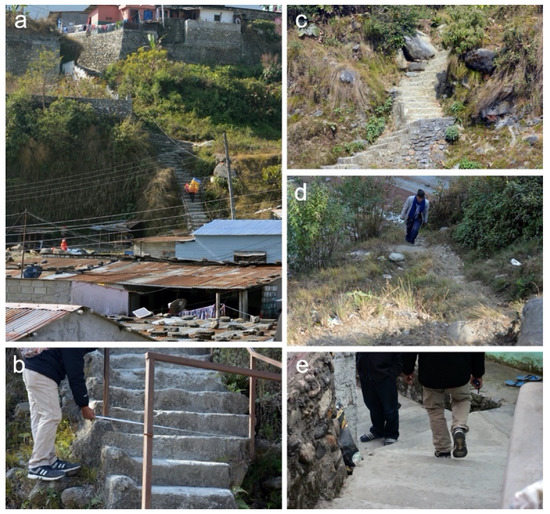
The area displayed in Figure 7a includes 148 houses and a total population of 712 residents, all of whom are dependent on a single existing evacuation route (route number 8), which leads to a single main path to higher (safer) ground (see Figure 7a and Figure 8a,b). Presently, the paths are barely wide enough for two people at the same time (~1 m). The narrow main path (Figure 8a) has staircases, and hence it can be easily clogged with slower children and elderly people. Thus, the evacuation route would be severely inadequate in an emergency.
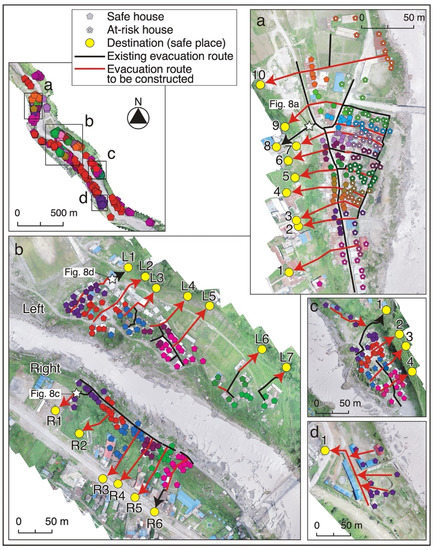
Figure 7.
‘Evacuation route maps in Masinabagar: (a) upper area; (b) central area; and (c,d) lower areas.’ The routes in black show the existing routes, and the routes in red show the evacuation routes to be created. Houses depicted in the same colors present those depending on the same evacuation route. Houses with white dots in the center represent at-risk houses and without dots represent safe houses. Note that some houses where the questionnaire survey was not conducted are also shown here.
Therefore, we suggest that nine other routes be created for emergencies based on the population and distance from each house to an evacuation route (see Table A1). Both the existing route and the additional nine routes to be created can be used for emergencies.
The evacuation routes displayed in the left bank area in Figure 7b and Figure 8c serve a total population of 360 and are sectionally narrow and steep, making them insufficient for the simultaneous use of the residents. The group discussions identified that many people might be unable to evacuate in the future because of their limited knowledge of the impending threat and the challenging evacuation route itself. In this section, seven more potential evacuation routes (L1–L7) were identified, most of which can be connected with the existing routes.
The right bank area in Figure 7b (total population 372) is the most vulnerable of the entire area. There is only one extremely narrow (60–70 cm) and steep exit route (Figure 8c), permitting only one person to walk at a time. This route attains the river terrace (>18 m than the inundated residence zone) but needs to extend more to a safe place (R1). Five more evacuation routes are identified in this section.
Compared with routes at other sites (with a total population of 113), one is slightly better and broader (see Figure 7c). However, if residents cannot quickly receive flood information, lives may be lost because the only exit point (route 1 in Figure 7c) is far from the residence area. Therefore, three new evacuation routes should be created as soon as possible.
Similarly, Figure 7d displays a primary school where five people reside. In total, 172 students are present during the daytime. This location is between the Yamdi Khola and Seti River. We identified one location that is suitable for an evacuation route. There is no evacuation route currently available, and this should be addressed as soon as possible.
3.2.2. Laltinbazar
The area shown in Figure 9a has a total population of 456 households that are safe. As stated earlier, we suggest an altitude difference of more than 1 m as a safe place. We suggest that nine new evacuation routes be created, three of which can be connected with the existing routes (routes 3, 6, and 8). Many houses along routes 4–9 are located in safe places. When evacuation is necessary, the residents in these safe places would also evacuate. Therefore, the width of the evacuation routes should be wide enough.
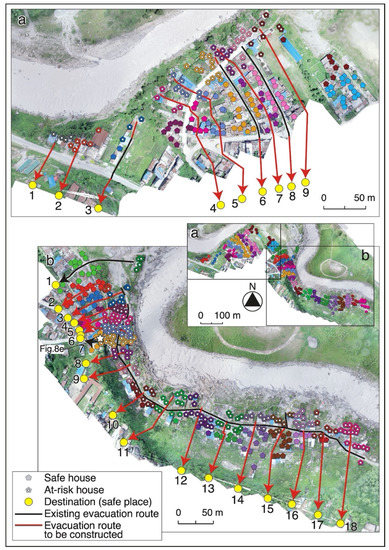
Figure 9.
‘Evacuation route maps in Laltinbazar: (a) western area and (b) eastern area.’ The routes in black show the existing routes, and the routes in red show the proposed evacuation routes. Houses with the same colors present those depending on the same evacuation route. Houses with white dots in the center represent at-risk houses and without dots represent safe houses. Note that some houses where the questionnaire survey was not conducted are also shown here.
The area shown in Figure 9b has a total population of 1335. At present, there are only two routes stretching toward the higher elevation (routes 1 and 7). Route 1 is used only by 40 residents. On the other hand, route 7 is used by many residents. This route is a narrow (0.8–1.1 m wide) passage with a steep exit (Figure 8e). As only one person can pass at a time, this route is inadequate for the residents in the area. Therefore, we recommend seven other alternative routes (routes 2 to 9 excluding route 7) for emergency evacuations. There is no evacuation route in the right half of Figure 9b, where nine evacuation routes should be created.
3.2.3. KI-Sing
The situation in the left bank area shown in Figure 10 (total population 690) is far better than elsewhere, as some routes to a higher place exist; however, we suggest five new routes and four new sections to be connected with the existing routes for emergency evacuations. The evacuation route situation in the right bank area in Figure 10 is similar to most of the other areas above. Only one path to a higher place (R1) is available for 96 residents. Therefore, we suggest three new routes for an emergency. The residents can use both the existing route and the suggested new routes as an evacuation route.
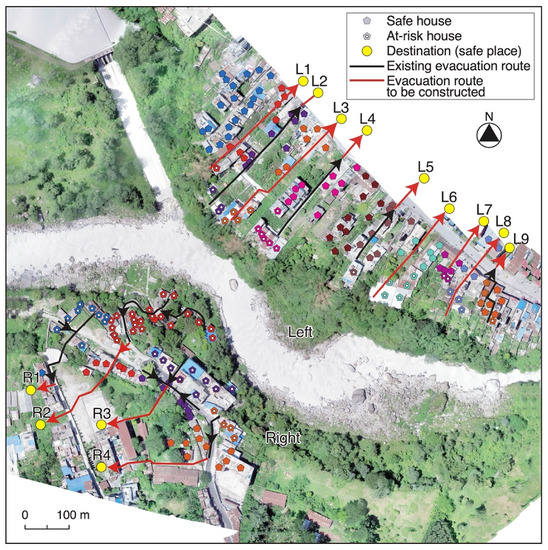
Figure 10.
Evacuation route map in KI-sing. The routes in black show the existing routes, and the routes in red show the suggested evacuation routes. Houses with the same colors present those depending on the same evacuation route. Houses with white dots in the center represent at-risk houses and without dots represent safe houses. Note that some houses where the questionnaire survey was not conducted are also shown here.
3.3. Socioeconomic Survey
The percentages of households with annual incomes categorized as extremely poor were 71%, 74%, and 52% in Masinabagar, Laltinbazar, and KI-sing, respectively (Table 2). In total, 68% of people were in the extreme poverty class. In KI-sing, 3% of the residents belonged to the upper-middle income. However, no residents from any settlement belonged to the high-income group.
Table 2.
Classification based on annual income (USD·person−1) in the three settlements.
Table 3 shows the number and percentage of heads of households engaged in different occupations. The labor industry was the most popular, accounting for 85.4% of the total employment of household heads, including 89.7% in Masinabagar, 96.0% in Laltinbazar, and 54.0% in KI-sing. Agriculture-based households varied from 0.0% in Laltinbazar to 0.2% in Masinabagar and 0.6% in KI-sing. Business-related occupations were 6.0% of the total in Masinabagar, 2.2% in Laltinbazar, and 23.3% in KI-sing. The service sector employed 1.4% of household heads in Masinabagar, 0.6% in Laltinbazar, and 6.1% in KI-sing. Recently, remittances have provided a sustainable form of income for 2.6% of households in Masinabagar, 1.2% in Laltinbazar, and 16.0% in KI-sing.
Table 3.
Major occupations of the household heads.
The percentage of migrants varied greatly; Laltinbazar maintained the highest percentage (100.0%), which was followed by those of Masinabagar (96.4%) and KI-sing (62.6%) (Table 4). Altogether, 91.6% of the residents within the study area had migrated within the last 20 years. The majority of migrants came from nearby districts (Figure 1a) intending to survive off of the river’s resources, and they were generally uneducated and unskilled laborers.
Table 4.
Migration status of the study area’s residents.
4. Discussion
4.1. Inundation and Evacuation Routes
The inundation maps (Figure 4, Figure 5 and Figure 6) revealed that many houses are situated near the riverbank and in the estimated inundation zone. The situation was similar in all three settlements (Table 5). In Masinabagar, Laltinbazar, and KI-sing, 268 (57.5%), 232 (70.5%), and 68 (32.4%) houses are located in the inundation zone. Notably, more houses fall under the at-risk category in Masinabagar and Laltinbazar.
Table 5.
Safe and potentially inundated houses by settlement.
Despite such high rates of at-risk houses in the three settlements, the current routes that can be used for evacuation are narrow, located on steep slopes, and their number was limited, as described earlier. Therefore, increasing the evacuation routes is strongly suggested as shown in Figure 7, Figure 9 and Figure 10. The population density of these areas is relatively high, and thus, adequate evacuation routes must be prioritized for the safety of these >2000 residents. These residents in the three settlements represent the nighttime population. However, none of the evacuation routes have streetlights, which makes evacuation extremely difficult at night. Installing streetlights on the routes is strongly suggested.
Regarding daytime evacuation, all three areas contained primary schools. In Masinabagar and Laltinbazar, the schools are entirely in the inundation zone. In KI-sing, many temples and community centers containing children and the elderly are located in the inundation zone. If a flood were to occur, the current evacuation routes are insufficient for these at-risk age groups to use. Thus, for all three areas, establishing adequate evacuation routes and relocating these schools, temples, and community centers must be prioritized among other short-term and long-term strategies.
4.2. Socioeconomic Survey
Based on the results of hydraulic modeling and socioeconomic survey, the statistical relations between potentially inundated houses, safe houses, and residents’ socioeconomic factors were examined via correlation coefficient analyses (Table 6). Results showed that highly impoverished and immigrant households were at the highest risk in terms of income and migration (p < 0.001). Similarly, 455 laborers’ houses were also significantly correlated with inundation risk (p < 0.001).
Table 6.
Relationship between inundated/safe house locations and socioeconomic factors.
Table 7 shows the relationship between per capita income and horizontal distance to the riverbank (medians and IQRs). In Masinabagar, extremely impoverished and low-income households existed closer to the river (medians = 31.8 and 29.6, respectively) compared with lower-middle-income family houses (p < 0.64). In Laltinbazar, the lower-middle group was the nearest to the river. The low-income and extremely poor groups were the second and third closest to the river, respectively (although all three groups lived in houses significantly close to the river bank; p < 0.004). The situation in KI-sing was similar (p < 0.001). Thus, it was concluded that low-income family houses exist significantly closer to the river across the entire study area (p < 0.046).
Table 7.
Annual household income and horizontal distance of houses to the riverbank.
The interview surveys and focus group discussion suggest that migrants came to Pokhara for a better future. However, owing to their relative lack of skills and money, they were forced into the less desirable riverside area, even though most knew that living in the area was illegal (public property). In Nepal, it is not permitted to build a house for personal use on public land. Public land is land allocated by the general public for paths, ponds, fountains, wells and their banks, grazing land, graveyards, public inns, temples, places for religious practice, memorials, courtyards, sewerage networks, market places, public entertainment, and sporting grounds [89].
Table 8 shows the relationship between household income, migration status, and occupation of the people interviewed. In Masinabagar, 288 of the 295 highly impoverished families were migrants. In Laltinbazar, 236 families existed in extreme poverty, all of which were migrant laborers. In KI-sing, 63 of the 85 families were migrants in extreme poverty, and 71 were laborers. The residents of all five upper-middle-income families in KI-sing received remittances. In total, labor was the primary occupation of 592 extremely impoverished families. Moreover, of 616 families, 587 were migrants, and for 140 households, the major source of income was business. Correlation coefficients were computed among the three settlements based on income, migration status, and occupation (Table 8). The results suggested that the correlation between income and migration was statistically significant for all households (p < 0.001). Similarly, the correlation between income and occupation was also significant (p < 0.001).
Table 8.
Relationship between annual income, migration status, and occupation of the interviewed households of the study area.
Focus group discussions showed that very few people were aware of local disaster risks or could identify safe sites near their houses after the occurrence of the 2012 flood. Indeed, the majority of residents were still not aware of any safe sites near their settlements. In total, 70% of the inhabitants of Masinabagar, 85% in Laltinbazar, and 56% in KI-sing did not know about safe sites near their settlements. As a result of the exposure to radio and other awareness-raising programs, some people from Masinabagar (29%), Laltinbazar (45%), and KI-sing (43%) could identify safe destinations and quickly travel to these places if evacuation routes are constructed. This research identified evacuation routes, and we believe that such routes can save lives when a disaster happens. Evacuation planning is an essential aspect of today’s growing initiative for early warning systems in the study area as well as in Nepal Himalaya. A long-term strategy must be established to increase evacuation preparedness during future flooding disasters [75,90].
4.3. Proposed Evacuation System
This study designed an evacuation system to focus on immediate relief (short-term) and considered the most pertinent factors for alleviating flooding vulnerability to reduce the risk to life and create safe and organized evacuation routes (long-term). Based on research, temporary safe places were identified in the proximity of settlements, even though they do not at present, contain any form of shelters. Land that is outside the inundation area and at a higher altitude was assumed a temporary safe place. The evacuation route was also designed based on that.
Evacuation planning is an essential part of any disaster response strategy in vulnerable areas [91]. Initially, flooding risk awareness must be addressed, in addition to the actions required for safety. Local authorities and government agencies should provide the public with proper preparedness and prevention training. Residents must be aware and well-trained, including evacuation drill practice, for disaster preparedness. Abarquez and Murshed (2004) stated that preparedness is the ability of the community to avoid the negative impacts of an impending hazard [92]. In the following sub-sections, we discuss the proposed flooding risk alleviation system in the study area (Figure 11).
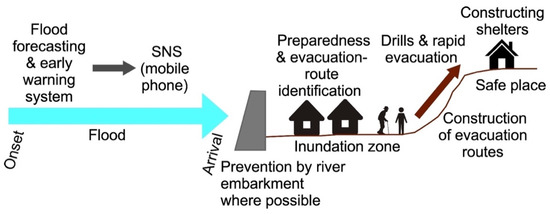
Figure 11.
Proposed immediate flooding risk alleviation system in the study area.
Proper planning for evacuations is an important part of keeping communities safe from the harm caused by disasters. For that purpose, proper evacuation strategies are essential. Planning for evacuations should occur early and involve local governments and communities. Evacuation planning should factor in key issues such as evacuation routes, shelter facilities, messaging to communities, and risks to safe evacuation. Evacuation plans should be regularly reviewed, where necessary, to ensure that they address all relevant issues. Therefore, we propose and categorize short- and long-term evacuation plans for the local government and people.
In the following sections, we discuss (a) short-term strategies for local people and government and (b) long-term strategies for local government.
4.3.1. Short-Term Strategies for Local People
Emergency Plan and Regular Rehearsal Drills
Evacuation planning is an integral part of emergency plans, particularly for regions vulnerable to disasters [91,93]. Evacuation is a complex process consisting of several consecutive phases [91]. The evacuation decision during a flood primarily represents the household’s choice to evacuate or remain in the risk area [94]. Although superficially, this may appear a simple decision, in practice, it involves a complex set of behavioral and external factors at a particularly critical time. Thus, when flash floods occur, people must make quick decisions to protect themselves and their families, which is most often achieved in a rapid evacuation to a safe place or shelter house, if available. Therefore, frequent regular drills are indispensable.
Temporary houses or transitional shelter is the most important factor when no other alternatives are available. Shelters provide immediate and short-term stay for the victims, help them recover from the trauma of a disaster, and provide a base to start the process of rehabilitation [95,96].
Identifying Evacuation Routes, Preparing for Emergency Evacuation, and Essential Kits
Low-risk awareness among the residents living in flood-prone areas is usually considered one of the leading causes of low preparedness, which generates an inadequate response to disasters [97]. This step of spreading awareness should be implemented well-before the onset of floods, and locals must be educated about preparedness. Focus group discussions and interview surveys suggested that knowledge on preparedness was nearly zero in the study area. Authorized persons should provide background information regarding risk mitigation and evacuation techniques to help minimize disasters [98].
Timely identification of a safe evacuation route is essential for successful evacuation. The proposed evacuation maps (Figure 7, Figure 9 and Figure 10) help identify building-specific evacuation routes available within the study area to ensure that people reach the nearest safe destination. It is vital to have broad and alternative routes in case of roadblocks. Prior knowledge of the most appropriate evacuation route can help increase the efficiency of evacuation. Authorities in charge of determining safe places or temporary/permanent shelter locations must aid in minimizing the total evacuation time by aiding evacuees to reach their choice of destination via the corresponding route, as pointed out by [99].
Injuries can happen during disasters. Therefore, it is important to prepare a basic first-aid kit with items such as sterile gloves, gauze, soap, burn ointment, bandages in a variety of sizes, pain relievers, scissors, and tweezers.
4.3.2. Short-Term Strategies for Local Government
Installation of Weather and Hydrological Stations
Nepal is considered one of the most disaster-prone countries in the world. Moreover, apart from flooding, other natural hazards such as earthquakes and landslides pose a recurrent risk to large sections of the population [75].
At present, there is one weather station available between Masinabagar and Laltinbazar, which was damaged by the 2012 flood. If water levels rise and flood hazards occur, Masinabagar will be inundated even before getting information. The installation of a weather station in a proper place near the settlements is required. In addition, a hydrological station for monitoring the water level of the river is needed at an appropriate location. These will be helpful to obtain scientific data and for early warning as well. Careful planning is needed to select the location for establishing weather stations.
Flood Forecasting and Early Warning System
An early warning system is vital for disaster risk reduction [75], and it is important to allow sufficient time for evacuation [100]. In particular, timely warnings, communication, and decision-making are critical [101]. An effective community-based early warning system must use local resources and capacities to prepare effectively and respond to flooding events [75]. In the study area, installing a low-cost warning system for sustainable use is recommended, and it should be connected to the residents’ mobile phones so that they can act quickly. It is essential to understand how people perceive flash flood risks and what influences their response to warning information [74].
People must also understand the importance of flash flood forecasts and early alerts. Accordingly, local authorities should design and establish an upriver weather station with an interconnected early warning system as soon as possible. Appropriate hydrological forecasts can also be used to predict future water levels [102]. The underlying spontaneity of extreme flooding risks creates an extremely dynamic challenge [101]. Appropriate, accurate, and timely communication and an early warning system are essential for saving lives.
Transmission of Early Warning
Flood warning broadcasts from various information sources are very important for individuals to make evacuation decisions [103]. Once a flood risk has been detected, the early warning system will provide the first information. However, this may not be enough in some cases. In crisis communication, trust in the source of information is crucial; therefore, disaster broadcasts, such as TV and radio, and their messages should be trusted by the community [104]. Recently, social media (SNS) has been thought to be a more effective method of communication. In many developing countries, SNS has become the most important means of communication for flood warnings. Using SNS through a mobile phone would be the most effective and quick way for the people in the study area.
The Nepal Government has already introduced advanced early alarm systems, e.g., in the area of Imja and Tsho Rolpa Glacial lakes for future GLOF events. However, a simple and cost-effective way should be adopted to transmit information. The early warning system helps reduce economic losses and mitigate the number of injuries and deaths, allowing the downstream communities to protect their lives and properties. Therefore, we suggest the implementation of a mobile phone-based early alarming system, which is cost-effective and easy for all those areas connected to the network coverage.
In Nepal, mobile coverage and internet connection are available even in remote areas. In 2016, approximately 92% of the population in Nepal had access to a 2G mobile-phone network at the minimum [105]. The World Bank publishes mobile-phone subscription data. Based on that, there were 139.4 mobile-phone handsets available in Nepal in 2018 per 100 people [106]. The research area is an adjoining part of Pokhara city. There is 100% mobile-phone network coverage. Based on the social survey, 98% of the people had a mobile-phone handset.
Results show that among the 15- to 64-year-olds, 98.61%, 98.80%, and 99% in Masinabagar, Laltinbazar, and KI-sing, respectively, have a mobile phone (Table 9). Altogether 98.68% of the 15- to 64-year-old people have a mobile phone. Therefore, an early warning system through mobile phones would be the best solution. Children at school can receive assistance from teachers, and their parents can inform them at night. In Masinabagar, Laltinbazar, and KI-sing, all students go to the local community school. Only about one-fourth of the elderly people (>64-years of age) have direct access to the early warning through a mobile phone. They are most likely to receive assistance from their family members at home, especially at night. However, they need assistance from the community when they are alone during the daytime or live alone.
Table 9.
Mobile phone availability by age group in the three settlements.
Having a mobile phone is a necessity rather than a luxury even among the poor recently. In Gandaki province (Kaski district lies in Gandaki province), 97.6% of the people in rural areas and 97.7% in city areas have access to mobile phones. Prepaid billing systems and the low-priced mobile phone headsets (less than USD 10) are also major factors that have increased its user base.
There is no postpaid system in Nepal. Most mobile companies offer free Subscriber Identity/Identification Module (SIM) cards, low-cost internet data packages, and low-cost voice mail services. The official Nepal Telecom (official service provider) offers the SIM card for NRS 90 (USD 0.80), which comes with NRS 50 (USD 0.45) credit. In total, 88.3% of the poorest people have mobile phones [107,108,109]. Therefore, using mobile phones for early warning is strongly recommended not only in the study area but also in downstream communities in other parts of the country.
Making Safer and Wider Evacuation Routes
Evacuation is an important preparedness measure in disaster management, and it requires careful modeling and planning [110,111]. For safe evacuations, a proper evacuation route is needed. Evacuation route recommendation plays an important role in emergency safety management, especially for natural disasters [112]. The evacuation route should be short, and routes to different shelters cannot present intersection points either in order to allow continuous traffic flow and reduce potential accidents [76]. At present, there is a very narrow, extremely bent, and congested route available (Figure 7, Figure 8, Figure 9 and Figure 10). In the future, evacuation routes should be designed based not only on the shortest traveling distance, but also on the existing population, geomorphological structure, and wider and easy-to-use roads.
Flood Prevention Using River Embankment
Managing and monitoring natural and artificial river levees is crucial to reducing hydrological risks [113]. In addition to these processes that enable quick evacuation, installing a river embankment is one of the important strategies to prevent and reduce flood risk. It would not be realistic to install the embankment at every place in terms of budget. However, if a river embankment is installed where the population is concentrated, it would lead to a longer evacuation time.
4.3.3. Long-Term Strategies
Evacuations must be planned for safe execution, and those plans should be resourced (anticipating all the resources required to complete a project), implemented, and reviewed. Local governments have an important role in evacuation planning, and they need to consider local capacity and capability to manage the evacuation process. This includes preparing a long-term disaster plan, shelter house, and relocation sites.
Long-Term Disaster Preparedness Plan and Policies
Flood disaster plans in developing countries are mostly reactive, responding to prevailing disaster situations (emergency response and recovery) [43]. The reactive response should be changed to a proactive response to increase management effectiveness and reduce loss of life and properties. We suggest that the plan should address installing weather stations in the settlements.
Government and law-making agencies must establish new disaster plans for the downstream communities. The local authority should make long-term sustainable plans for vulnerable settlements such as Masinabagar, Laltinbazar, and KI-sing and implement strict rules and regulations to prevent river encroachment.
Prohibition of Construction of New Buildings
Riverside communities often face situations that require creative short and long-term housing plans. Effectively moving survivors into post-disaster housing is a critical step toward long-term recovery. However, most parts of the country do not have disaster housing plans. While some housing programs were federally introduced not at the national level planning for disaster, housing should occur at all levels of government before a disaster strikes. Recently, the local government introduced a city planning act in Pokhara that strictly prohibited the construction of new houses within 10 m of the riverside. However, a lack of enforcement means that these processes have not yet completely stopped. Furthermore, no planning exists for those already living in the riverside area.
Shelter
When flooding occurs, people should be evacuated safely to designated shelters along the optimal routes to minimize serious damages to lives and properties [114]. An adequate shelter has a significant impact on human survival in the initial stage of a disaster, and that requires more than just a roof for a space to be habitable [95]. Temporary houses or transitional shelters are the most important when no other alternatives are available. Shelters provide immediate and short-term stay for the victims, help them recover from the trauma of a disaster, and provide a base to start the process of rehabilitation [95,96]. Making a shelter and meeting its needs in the pre- and post-disaster stages remain a major challenge for the government. A shelter location may be required for periods that extend for several months or even years after a disaster, but local authorities should prioritize this factor when planning and designing shelters. The government can categorize shelter types, such as emergency, temporary, or permanent shelters [95]. The government should ensure that emergency shelters are accessible and far away from vulnerable slopes, and allow large numbers of people [115]. Therefore, the emergency shelters should have adequate space, basic living requirements, and be located in safe areas [76]. Moreover, there are no shelter houses present in the considered locations, and the local government should consider the design of shelter houses for the future.
Relocation
Relocation implies permanently moving to a new location. Relocation is a process that introduces a newly built area for the displaced community [116]. Population resettlement is a complex process that can create serious social, economic, and cultural problems for the people involved if it is not implemented properly [117].
As per our findings, the population in this area is very poor, and therefore, the relocation plan should be free of cost. To help the resettled households adapt to the new environments, the local government should make development plans, which should include various job opportunities [118]. Therefore, the local government should make a long-term plan for those vulnerable settlements. This research identified many houses, schools, and livestock farms that are within high-risk areas (Figure 4, Figure 5 and Figure 6). Therefore, the local government should take action to relocate these to safe places as soon as possible.
4.4. Significance of the Combined Approach: Modeling and Socioeconomic Survey
Nepal has experienced numerous GLOFs and other water-related disasters in recent years. Thus far, most correlated disaster studies have focused on modeling, while others have adopted a sociological approach. However, these studies have tended to be conducted separately. The present study showed the relationship between the locations of individual buildings and houses, with or without flood-hazard dangers, and the socioeconomic status of these residents. It was revealed that households with the most significant inundation risk did not have access to adequate evacuation routes, nor was there a safe shelter house if a disaster occurred. Based on these findings, it was concluded that the buildings within the inundation risk zone must be relocated; however, this requires the financial support of governmental agencies, NGOs, INGOs, and other related agencies, as the at-risk residents belong to lower-income categories. Furthermore, we identified and suggested detailed evacuation routes and a safe evacuation system, which only became possible with the combined approach applied here.
The focus group discussions revealed a lack of adaptive capacity-building strategies and risk reduction knowledge among the locals. Furthermore, locals must participate in disaster preparedness training and awareness programs to increase their safety. In addition, any relocation strategy put forward by the government would likely require an extended period, during which the construction of a river embankment may be one of the realistic alternatives for decreasing flood disaster risks in the shorter term. These were derived from the combined approach, which can be adapted in other parts of Himalayan countries.
5. Conclusions
The inundation maps created in this study show that the Masinabagar, Laltinbazar, and KI-sing areas are highly susceptible to future flooding. In Masinabagar, 268 of the 466 buildings, including 229 houses, churches, crematoriums, livestock farms, restaurants, warehouses, and schools, were situated in the inundation zone. In Laltinbazar, of 329 buildings, 232 buildings, including 225 houses, warehouses, and a primary school were situated in the estimated flood-prone zone. Similarly, in KI-sing, of the 210 buildings, 68 were located in the inundation zone, including 32 houses, a research center, community centers, and temples. Evacuation routes in the three settlements were either inadequate or absent. Moreover, lower-income residents were at much higher risks, as most houses near the riverside area belonged to impoverished migrants and laborers.
The results highlighted that immigrant households were at the highest risk (p < 0.001 for both factors). Similarly, 455 laborers’ houses by occupation were also significantly correlated with inundation risk (p < 0.001). The correlation between income and migration was statistically significant for all households (p < 0.001). Similarly, the correlation between income and occupation was also significant (p < 0.001).
Most riverside residents remain unaware of the preparation and risk associated with flood emergency evacuation; thus, adaptive capacity-building strategy programs, disaster preparedness training, and evacuation drills must be urgently incorporated. Establishing adequate evacuation routes and shelter houses is the most pressing need. It is suggested that governmental agencies, NGOs, INGOs, and other related agencies prepare an adequate plan that targets the impoverished residents of the inundation zone, as they cannot afford safe lands for relocation. This research contributes to reducing the impact of flood disasters, and the proposed evacuation system will help save lives. This study will be useful for planners with respect to preparedness, early warning systems, and safe evacuation and will serve as a guide for sustainable development in the region. Accordingly, this study recommends applying a combined approach that uses modeling and socioeconomic surveying in other parts of the Himalayan region and impoverished areas around the globe.
Author Contributions
Conceptualization, methodology, validation, formal analysis, investigation, resources, data curation, writing—original draft preparation, and writing—review and editing: B.T, T.W., and D.R.; visualization: B.T. and T.W.; supervision, project administration, and funding acquisition: T.W. All authors have read and agreed to the published version of the manuscript.
Funding
This work was supported by the JSPS KAKENHI (Grant-in-Aid for Scientific Research) Grant Numbers JP16H05641 and JP21H04371 (T.W.).
Institutional Review Board Statement
Not applicable.
Informed Consent Statement
Not applicable.
Acknowledgments
The authors would like to thank Puspa Sharma and Khagendra Raj Poudel for their kind assistance with the fieldwork. Dan Jantzen and Bob Yoder assisted in gathering the UAV footage. City of Pokhara granted a permit to fly the UAV.
Conflicts of Interest
The authors declare no conflict of interest.
Appendix A
Table A1.
Spatial relationships between the destinations (safe places) and the residential section and the population dependent on the evacuation routes.
Table A1.
Spatial relationships between the destinations (safe places) and the residential section and the population dependent on the evacuation routes.
| Settlement | Sections | Destination Number | A: Destination Elevation (m) | B: Residence Elevation (m) | Relative Height between A and B (m) | Horizontal Distance between A and B (m) | Height above the Estimated Inundation Level (m) | Horizontal Distance between Inundation Level and Destination (m) | Dependent Population per Route | Population below the Inundation Level | Houses below Inundation Level |
|---|---|---|---|---|---|---|---|---|---|---|---|
| Masinabagar | a | 1 | 916 | 889 | 27 | 81 | 20 | 52 | 66 | 61 | 11 |
| 2 | 918 | 890 | 28 | 63 | 25 | 43 | 47 | 15 | 4 | ||
| 3 | 918 | 891 | 27 | 68 | 23 | 52 | 50 | 20 | 4 | ||
| 4 | 918 | 892 | 27 | 78 | 23 | 59 | 54 | 21 | 6 | ||
| 5 | 918 | 891 | 27 | 76 | 23 | 51 | 93 | 68 | 14 | ||
| 6 | 916 | 891 | 25 | 92 | 22 | 64 | 90 | 45 | 8 | ||
| 7 | 911 | 892 | 19 | 88 | 16 | 57 | 91 | 60 | 11 | ||
| 8 | 916 | 892 | 25 | 117 | 21 | 81 | 94 | 39 | 8 | ||
| 9 | 911 | 893 | 18 | 109 | 15 | 65 | 85 | 63 | 15 | ||
| 10 | 908 | 895 | 13 | 124 | 11 | 74 | 31 | 0 * | 9 | ||
| b | L1 | 898 | 889 | 9 | 50 | 9 | 36 | 86 | 58 | 10 | |
| L2 | 905 | 887 | 19 | 86 | 19 | 48 | 76 | 52 | 9 | ||
| L3 | 898 | 886 | 11 | 76 | 11 | 55 | 57 | 27 | 4 | ||
| L4 | 893 | 885 | 8 | 72 | 8 | 66 | 38 | 7 | 1 | ||
| L5 | 894 | 885 | 9 | 75 | 9 | 67 | 81 | 40 | 6 | ||
| L6 | 905 | 892 | 13 | 68 | 12 | 55 | 9 | 5 | 2 | ||
| L7 | 902 | 891 | 11 | 52 | 11 | 46 | 13 | 4 | 1 | ||
| R1 | 906 | 888 | 18 | 136 | 4 | 113 | 39 | 39 | 8 | ||
| R2 | 905 | 886 | 19 | 121 | 3 | 87 | 59 | 59 | 12 | ||
| R3 | 901 | 883 | 19 | 109 | 3 | 72 | 78 | 48 | 10 | ||
| R4 | 902 | 883 | 19 | 113 | 3 | 81 | 58 | 58 | 10 | ||
| R5 | 900 | 883 | 18 | 122 | 3 | 88 | 59 | 42 | 9 | ||
| R6 | 900 | 882 | 18 | 117 | 3 | 79 | 79 | 48 | 10 | ||
| c | 1 | 892 | 877 | 14 | 103 | 13 | 77 | 71 | 28 | 6 | |
| 2 | 901 | 877 | 24 | 86 | 22 | 57 | 63 | 48 | 5 | ||
| 3 | 900 | 878 | 23 | 82 | 22 | 53 | 37 | 23 | 4 | ||
| 4 | 894 | 877 | 17 | 61 | 17 | 37 | 76 | 24 | 7 | ||
| d | 1 | 884 | 876 | 8 | 124 | 8 | 90 | 5 | 5 ** | 5 | |
| Laltinbazar | a | 1 | 890 | 871 | 19 | 68 | 10 | 44 | 20 | 20 | 4 |
| 2 | 896 | 871 | 24 | 79 | 16 | 46 | 30 | 30 | 6 | ||
| 3 | 897 | 865 | 32 | 126 | 23 | 93 | 27 | 14 | 3 | ||
| CNN | 867 | 864 | 3 | 122 | 3 | 122 | 52 | 0 | 0 | ||
| 4 | 867 | 861 | 7 | 176 | 2 | 137 | 59 | 26 | 4 | ||
| 5 | 867 | 859 | 9 | 198 | 1 | 142 | 106 | 47 | 8 | ||
| 6 | 867 | 860 | 8 | 188 | 2 | 145 | 128 | 66 | 12 | ||
| 7 | 866 | 858 | 8 | 196 | 1 | 158 | 100 | 56 | 9 | ||
| 8 | 865 | 859 | 6 | 202 | 1 | 168 | 101 | 33 | 7 | ||
| 9 | 865 | 859 | 6 | 219 | 3 | 179 | 46 | 17 | 6 | ||
| b | CNN | 864 | 856 | 9 | 155 | 4 | 192 | 82 | 0 | 0 | |
| 1 | 860 | 853 | 8 | 148 | 5 | 114 | 40 | 21 | 4 | ||
| 2 | 861 | 855 | 6 | 94 | 5 | 75 | 90 | 30 | 6 | ||
| 3 | 861 | 853 | 8 | 101 | 5 | 57 | 80 | 43 | 8 | ||
| 4 | 861 | 852 | 10 | 82 | 5 | 46 | 85 | 66 | 12 | ||
| 5 | 861 | 850 | 11 | 78 | 5 | 31 | 93 | 66 | 12 | ||
| 6 | 861 | 849 | 13 | 84 | 4 | 35 | 94 | 89 | 16 | ||
| 7 | 862 | 849 | 13 | 104 | 3 | 32 | 99 | 75 | 13 | ||
| 8 | 875 | 849 | 26 | 68 | 26 | 38 | 34 | 34 | 7 | ||
| 9 | 881 | 849 | 31 | 77 | 30 | 57 | 32 | 32 | 5 | ||
| 10 | 878 | 848 | 30 | 70 | 28 | 48 | 60 | 40 | 7 | ||
| 11 | 879 | 847 | 33 | 110 | 33 | 80 | 70 | 65 | 11 | ||
| 12 | 856 | 847 | 9 | 110 | 9 | 74 | 77 | 68 | 13 | ||
| 13 | 853 | 846 | 6 | 104 | 5 | 75 | 85 | 48 | 9 | ||
| 14 | 853 | 845 | 8 | 115 | 6 | 89 | 97 | 38 | 7 | ||
| 15 | 854 | 845 | 10 | 132 | 9 | 97 | 105 | 44 | 8 | ||
| 16 | 860 | 843 | 17 | 136 | 16 | 106 | 93 | 57 | 10 | ||
| 17 | 876 | 844 | 33 | 146 | 32 | 116 | 48 | 37 | 7 | ||
| 18 | 877 | 843 | 35 | 146 | 35 | 106 | 78 | 78 | 15 | ||
| KI-sing | Left bank | CNN | 880 | 876 | 4 | 86 | 21 | 103 | 80 | 0 | 0 |
| L1 | 882 | 876 | 6 | 98 | 3 | 94 | 39 | 5 | 1 | ||
| L2 | 883 | 874 | 9 | 121 | 1 | 87 | 46 | 13 | 3 | ||
| L3 | 884 | 876 | 8 | 124 | 1 | 86 | 50 | 21 | 4 | ||
| L4 | 882 | 874 | 8 | 127 | 1 | 94 | 72 | 26 | 6 | ||
| CNN | 882 | 880 | 2 | 85 | 7 | 101 | 51 | 0 | 0 | ||
| L5 | 882 | 874 | 8 | 102 | 4 | 105 | 37 | 4 | 1 | ||
| L6 | 882 | 873 | 9 | 90 | 1 | 62 | 57 | 21 | 5 | ||
| L7 | 881 | 876 | 5 | 97 | 1 | 64 | 39 | 11 | 2 | ||
| L8 | 881 | 875 | 6 | 79 | 2 | 48 | 25 | 8 | 3 | ||
| L9 | 881 | 874 | 7 | 73 | 1 | 48 | 27 | 6 | 1 | ||
| CNN | 879 | 872 | 7 | 55 | 7 | 56 | 27 | 0 | 0 | ||
| Right bank | R1 | 871 | 856 | 15 | 84 | 8 | 49 | 17 | 17 | 9 | |
| R2 | 873 | 841 | 32 | 189 | 17 | 94 | 18 | 4 | 22 | ||
| R3 | 870 | 847 | 23 | 90 | 11 | 64 | 14 | 0 *** | 10 | ||
| R4 | 871 | 839 | 32 | 142 | 3 | 91 | 47 | 9 | 4 |
* Nine buildings are located here. These nice buildings are toilet and canteen for a school, livestock farms and a crematorium. Therefore, construction of an evacuation route is necessary although the nighttime population (residents) is zero. ** There are five nighttime residents here; however, 172 students stay there during daytime. *** The houses below the inundation level are community centers; therefore, there are no residents. CNN: Construction not needed.
References
- Elalem, S.; Pal, I. Mapping the vulnerability hotspots over Hindu-Kush Himalaya region to flooding disasters. Weather Clim. Extrem. 2015, 8, 46–58. [Google Scholar] [CrossRef]
- Dankers, R.; Feyen, L. Climate change impact on flood hazard in Europe: An assessment based on high-resolution climate simulations. J. Geophys. Res. Atmos. 2008, 113, 1–17. [Google Scholar] [CrossRef]
- Field, C.B.; Barros, V.R.; Mach, K.J.; Mastrandrea, M.D. Climate Change 2014: Impacts, Adaptation, and Vulnerability. Part A: Global and Sectoral Aspects. Contribution of Working Group II to the Fifth Assessment Report of the Intergovernmental Panel on Climate Change; Cambridge University Press: Cambridge, UK; New York, NY, USA, 2014. [Google Scholar]
- Hirabayashi, Y.; Mahendran, R.; Koirala, S.; Konoshima, L.; Yamazaki, D.; Watanabe, S.; Kim, H.; Kanae, S. Global flood risk under climate change. Nat. Clim. Chang. 2013, 3, 816–821. [Google Scholar] [CrossRef]
- Mirza, M.M.Q. Climate change, flooding in South Asia and implications. Reg. Environ. Chang. 2011, 11, 95–107. [Google Scholar] [CrossRef]
- Towfiqul Islam, A.R.M.; Talukdar, S.; Mahato, S.; Kundu, S.; Eibek, K.U.; Pham, Q.B.; Kuriqi, A.; Linh, N.T.T. Flood susceptibility modelling using advanced ensemble machine learning models. Geosci. Front. 2021, 12, 101075. [Google Scholar] [CrossRef]
- Mohapatra, P.K.; Singh, R.D. Flood management in India. Nat. Hazards 2003, 28, 131–143. [Google Scholar] [CrossRef]
- Guhathakurta, P.; Sreejith, O.P.; Menon, P.A. Impact of climate change on extreme rainfall events and flood risk in India. J. Earth Syst. Sci. 2011, 120, 359–373. [Google Scholar] [CrossRef]
- Halgamuge, M.N.; Nirmalathas, A. Analysis of large flood events: Based on flood data during 1985–2016 in Australia and India. Int. J. Disaster Risk Reduct. 2017, 24, 1–11. [Google Scholar] [CrossRef]
- Kim, S.S.; Kim, T.H.; Sim, J.S. Applicability assessment of UAV mapping for disaster damage investigation in Korea. Int. Arch. Photogramm. Remote Sens. Spat. Inf. Sci.—ISPRS Arch. 2019, 42, 209–214. [Google Scholar] [CrossRef]
- Restas, A. Drone applications for supporting disaster management. World J. Eng. Technol. 2015, 3, 316–321. [Google Scholar] [CrossRef]
- Barba, S.; Barbarella, M.; Di Benedetto, A.; Fiani, M.; Gujski, L.; Limongiello, M. Accuracy Assessment of 3D Photogrammetric Models from an Unmanned Aerial Vehicle. Drones 2019, 3, 79. [Google Scholar] [CrossRef]
- Garrett, B.; Anderson, K. Drone methodologies: Taking flight in human and physical geography. Trans. Inst. Br. Geogr. 2018, 43, 341–359. [Google Scholar] [CrossRef]
- Langhammer, J.; Vacková, T. Detection and Mapping of the Geomorphic Effects of Flooding Using UAV Photogrammetry. Pure Appl. Geophys. 2018, 175, 3223–3245. [Google Scholar] [CrossRef]
- Hildmann, H.; Kovacs, E. Review: Using Unmanned Aerial Vehicles (UAVs) as Mobile Sensing Platforms (MSPs) for Disaster Response, Civil Security and Public Safety. Drones 2019, 3, 59. [Google Scholar] [CrossRef]
- Backes, D.; Schumann, G.; Teferele, F.N.; Boehm, J. Towards a high-resolution drone-based 3d mapping dataset to optimise flood hazard modelling. Int. Arch. Photogramm. Remote Sens. Spat. Inf. Sci.—ISPRS Arch. 2019, 42, 181–187. [Google Scholar] [CrossRef]
- Restas, A. Water Related Disaster Management Supported by Drone Applications. World J. Eng. Technol. 2018, 6, 116–126. [Google Scholar] [CrossRef]
- Maher, A.; Inoue, M. Generating evacuation routes by using drone system and image analysis to track pedestrian and scan the area after disaster occurrence. In Proceedings of the 10th SEATUC Conference, Tokyo, Japan, 22–24 February 2016. [Google Scholar]
- Remondino, F.; Barazzetti, L.; Nex, F.; Scaioni, M.; Sarazzi, D. UAV photogrammetry for mapping and 3D modeling—current status and future perspectives. Int. Arch. Photogramm. Remote Sens. Spat. Inf. Sci.—ISPRS Arch. 2012, XXXVIII-1, 25–31. [Google Scholar] [CrossRef]
- Redolfi, E.; Buffi, G.; Venturi, S.; Manciola, P. Accuracy analysis of a dam model from drone surveys. Sensors 2017, 17, 1777. [Google Scholar] [CrossRef] [PubMed]
- Katayama, K.; Takahashi, H.; Yokota, N.; Sugiyasu, K.; Kinoshita, T. Cooperation scheme of Multi-UAVs for evacuation guidance support. In Proceedings of the 2018 IEEE 7th Global Conference on Consumer Electronics (GCCE), Nara, Japan, 9–12 October 2018; pp. 79–80. [Google Scholar] [CrossRef]
- Aljehani, M.; Inoue, M. Multi-UAV tracking and scanning systems in M2M communication for disaster response. In Proceedings of the 2016 IEEE 5th Global Conference on Consumer Electronics, Kyoto, Japan, 11–14 October 2016; pp. 2–3. [Google Scholar] [CrossRef]
- Nagatani, K.; Yajima, R.; Kiribayashi, S.; Izu, T.; Kanai, H.; Kanasaki, H.; Minagawa, J.; Moriyama, Y. Field report: UAV-based volcano observation system for debris flow evacuation alarm. In Field and Service Robotics; Hutter, M., Siegwart, R., Eds.; Springer Proceedings in Advanced Robotics; Springer: Berlin/Heidelberg, Germany, 2017; Volume 5, pp. 163–175. [Google Scholar] [CrossRef]
- Xiong, M.; Zeng, D.; Yao, H.; Li, Y. A crowd simulation based UAV control architecture for industrial disaster evacuation. In Proceedings of the 2016 IEEE 83rd Vehicular Technology Conference (VTC Spring), Nanjing, China, 15–18 May 2016. [Google Scholar]
- Rangari, V.A.; Sridhar, V.; Umamahesh, N.V.; Patel, A.K. Floodplain Mapping and Management of Urban Catchment Using HEC-RAS: A Case Study of Hyderabad City. J. Inst. Eng. Ser. A 2019, 100, 49–63. [Google Scholar] [CrossRef]
- Rangari, V.; Umamahesh, N.V.; Bhatt, C. Assessment of inundation risk in urban floods using HEC RAS 2D. Model. Earth Syst. Environ. 2019, 5, 1839–1851. [Google Scholar] [CrossRef]
- Quirogaa, V.M.; Kurea, S.; Udoa, K.; Manoa, A. Application of 2D numerical simulation for the analysis of the February 2014 Bolivian Amazonia flood: Application of the new HEC-RAS version 5. Ribagua 2016, 3, 25–33. [Google Scholar] [CrossRef]
- Huţanu, E.; Mihu-Pintilie, A.; Urzica, A.; Paveluc, L.E.; Stoleriu, C.C.; Grozavu, A. Using 1D HEC-RAS Modeling and LiDAR Data to Improve Flood Hazard Maps Accuracy: A Case Study from Jijia Floodplain (NE Romania). Water 2020, 12, 1624. [Google Scholar] [CrossRef]
- Demir, V.; Kisi, O. Flood Hazard Mapping by Using Geographic Information System and Hydraulic Model: Mert River, Samsun, Turkey. Adv. Meteorol. 2016, 2016, 4891015. [Google Scholar] [CrossRef]
- Aggett, G.R.; Wilson, J.P. Creating and coupling a high-resolution DTM with a 1-D hydraulic model in a GIS for scenario-based assessment of avulsion hazard in a gravel-bed river. Geomorphology 2009, 113, 21–34. [Google Scholar] [CrossRef]
- Pappenberger, F.; Beven, K.; Horritt, M.; Blazkova, S. Uncertainty in the calibration of effective roughness parameters in HEC-RAS using inundation and downstream level observations. J. Hydrol. 2005, 302, 46–69. [Google Scholar] [CrossRef]
- Sarhadi, A.; Soltani, S.; Modarres, R. Probabilistic flood inundation mapping of ungauged rivers: Linking GIS techniques and frequency analysis. J. Hydrol. 2012, 458-459, 68–86. [Google Scholar] [CrossRef]
- Ben, K.C.; Saidi, S. Spatiotemporal floodplain mapping and prediction using HEC-RAS—GIS tools: Case of the Mejerda river, Tunisia. J. African Earth Sci. 2018, 142, 44–51. [Google Scholar]
- Kumar, N.; Lal, D.; Sherring, A.; Issac, R.K. Applicability of HEC-RAS & GFMS tool for 1D water surface elevation/flood modeling of the river: A Case Study of River Yamuna at Allahabad (Sangam), India. Model. Earth Syst. Environ. 2017, 3, 1463–1475. [Google Scholar] [CrossRef]
- Khattak, M.S.; Anwar, F.; Saeed, T.U.; Sharif, M.; Sheraz, K.; Ahmed, A. Floodplain Mapping Using HEC-RAS and ArcGIS: A Case Study of Kabul River. Arab. J. Sci. Eng. 2016, 41, 1375–1390. [Google Scholar] [CrossRef]
- Kumar, N.; Kumar, M.; Sherring, A.; Suryavanshi, S.; Ahmad, A.; Lal, D. Applicability of HEC-RAS 2D and GFMS for flood extent mapping: A case study of Sangam area, Prayagraj, India. Model. Earth Syst. Environ. 2020, 6, 397–405. [Google Scholar] [CrossRef]
- Patel, D.P.; Ramirez, J.A.; Srivastava, P.K.; Bray, M.; Han, D. Assessment of flood inundation mapping of Surat city by coupled 1D/2D hydrodynamic modeling: A case application of the new HEC-RAS 5. Nat. Hazards 2017, 89, 93–130. [Google Scholar] [CrossRef]
- Tate, E.C.; Maidment, D.R.; Olivera, F.; Anderson, D.J. Creating a Terrain Model for Floodplain Mapping. J. Hydrol. Eng. 2002, 7, 100–108. [Google Scholar] [CrossRef]
- Hameed, L.K.; Ali, S.T. Estimating of manning’s roughness coefficient for Hilla river through calibration using HEC-RAS model. Jordan J. Civ. Eng. 2013, 7, 44–53. [Google Scholar]
- Campion, B.B.; Venzke, J.-F. Rainfall variability, floods and adaptations of the urban poor to flooding in Kumasi, Ghana. Nat. Hazards 2013, 65, 1895–1911. [Google Scholar] [CrossRef]
- Mondino, E.; Scolobig, A.; Borga, M.; Albrecht, F.; Mård, J.; Weyrich, P.; Di Baldassarre, G. Exploring changes in hydrogeo-logical risk awareness and preparedness over time: A case study in northeastern Italy. Hydrol. Sci. J. 2020, 65, 1049–1059. [Google Scholar] [CrossRef]
- Boero, R.; Bianchini, L.; Pasqualini, D. Vulnerability and adaptation to severe weather events in the American southwest. Weather Clim. Extrem. 2015, 8, 12–25. [Google Scholar] [CrossRef][Green Version]
- Tingsanchali, T. Urban flood disaster management. Procedia Eng. 2012, 32, 25–37. [Google Scholar] [CrossRef]
- Tuladhar, G.; Yatabe, R.; Dahal, R.K.; Bhandary, N.P. Disaster risk reduction knowledge of local people in Nepal. Geoenvironmental Disasters 2015, 2, 5. [Google Scholar] [CrossRef]
- Miceli, R.; Sotgiu, I.; Settanni, M. Disaster preparedness and perception of flood risk: A study in an alpine valley in Italy. J. Environ. Psychol. 2008, 28, 164–173. [Google Scholar] [CrossRef]
- Kargel, J.; Poudel, L.; Leonard, G.; Regmi, D.; Joshi, S.; Poudel, K.; Thapa, B.; Watanabe, T.; Fort, M. Causes and human impacts of the Seti River (Nepal) disaster of 2012. In Glacial Flooding and Disaster Risk Management; High Mountain Adaptation Partnership: Huaraz, Peru, 2013; pp. 1–9. [Google Scholar]
- Nepal Disaster Report 2015; The Government of Nepal—Ministry of Home Affairs (MoHA) and Disaster Preparedness Network-Nepal (DPNet-Nepal): Kathmandu, Nepal, 2015.
- Petley, D. Understanding the Seti River Landslide in Nepal. Available online: https://blogs.agu.org/landslideblog/2012/05/23/understanding-the-seti-river-landslide-in-nepal/ (accessed on 18 June 2018).
- Kathmandu University Flood Inundation Mapping—Seti River. 2012. Available online: https://reliefweb.int/sites/reliefweb.int/files/resources/Nepal_SitRep-2_May-12.pdf (accessed on 18 June 2018).
- Hanisch, J.; Koirala, A.B.N. The Pokhara May 5th flood disaster in Nepal—A last warning sign sent by nature? J. Nepal Geol. Soc. 2013, 46, 1–10. [Google Scholar]
- Bhandary, N.P.; Dahal, R.K.; Okamura, M. Preliminary understanding of the Seti River debris-flood in Pokhara, Nepal, on May 5th, 2012 A Report based on a Quick Field Visit Program. ISSMGE Bull 2012, 6, 8–18. [Google Scholar]
- Dwivedi, S. Report Submitted by the Committee Formed to Find out the Cause of the Seti Flood of 5th May 2012 to the Chief Secretary; Government of Nepal: Kathmandu, Nepal, 2012.
- Dwivedi, S. Cause and mechanism of the Seti flood of 5th may 2012, Western Nepal. J. Nepal Geol. Soc. 2013, 46, 11–18. [Google Scholar] [CrossRef]
- Kargel, J. One Scientist’s Search for the Causes of the Deadly Seti River Flash Flood. Available online: https://earthobservatory.nasa.gov/blogs/fromthefield/2014/01/24/setiriverclues/comment-page-1/ (accessed on 18 June 2018).
- Evans, S.G.; Delaney, K.B. Catastrophic mass flows in the mountain glacial environment. In Snow and Ice-Related Hazards, Risks, and Disasters; Shroder, J.F., Haeberli, W., Whiteman, C., Eds.; Academic Press: Cambridge, MA, USA, 2015; pp. 563–606. [Google Scholar]
- Khanal, N.R.; Mool, P.K.; Shrestha, A.B.; Rasul, G.; Ghimire, P.K.; Shrestha, R.B.; Joshi, S.P. A comprehensive approach and methods for glacial lake outburst flood risk assessment, with examples from Nepal and the transboundary area. Int. J. Water Resour. Dev. 2015, 31, 219–237. [Google Scholar] [CrossRef]
- Hummell, B.M.D.L.; Cutter, S.L.; Emrich, C.T. Social Vulnerability to Natural Hazards in Brazil. Int. J. Disaster Risk Sci. 2016, 7, 111–122. [Google Scholar] [CrossRef]
- Mool, P.K.; Maskey, P.R.; Koirala, A.; Joshi, S.P.; Wu, L.; Shrestha, A.B.; Eriksson, M.; Gurung, B.; Pokharel, B.; Khanal, N.R.; et al. Glacial Lakes and Glacial Lake Outburst Floods in Nepal; ICIMOD: Kathmandu, Nepal, 2011. [Google Scholar]
- Aksha, S.K.; Juran, L.; Resler, L.M.; Zhang, Y. An Analysis of social vulnerability to natural hazards in Nepal using a modified social vulnerability index. Int. J. Disaster Risk Sci. 2019, 10, 103–116. [Google Scholar] [CrossRef]
- Pathak, S.; Panta, H.K.; Bhandari, T.; Paudel, K.P. Flood vulnerability and its influencing factors. Nat. Hazards 2020, 104, 2175–2196. [Google Scholar] [CrossRef]
- Lindell, M.K.; Arlikatti, S.; Huang, S.-K. Immediate behavioral response to the June 17, 2013 flash floods in Uttarakhand, North India. Int. J. Disaster Risk Reduct. 2019, 34, 129–146. [Google Scholar] [CrossRef]
- Lindell, M.K.; Prater, C.S.; Gregg, C.E.; Apatu, E.J.; Huang, S.-K.; Wu, H.C. Households’ immediate Responses to the 2009 American Samoa Earthquake and Tsunami. Int. J. Disaster Risk Reduct. 2015, 12, 328–340. [Google Scholar] [CrossRef]
- Fraser, S.A.; Doyle, E.; Wright, K.C.; Potter, S.; McClure, J.; Johnston, D.; Leonard, G.; Coomer, M.A.; Becker, J.; Johal, S. Tsunami response behaviour during and following two local-source earthquakes in Wellington, New Zealand. Int. J. Disaster Risk Reduct. 2016, 16, 123–133. [Google Scholar] [CrossRef]
- Makinoshima, F.; Imamura, F.; Oishi, Y. Tsunami evacuation processes based on human behaviour in past earthquakes and tsunamis: A literature review. Prog. Disaster Sci. 2020, 7, 100113. [Google Scholar] [CrossRef]
- Walch, C. Evacuation ahead of natural disasters: Evidence from cyclone Phailin in India and typhoon Haiyan in the Philippines. Geo: Geogr. Environ. 2018, 5, e00051. [Google Scholar] [CrossRef]
- Wei, H.-L.; Wu, H.-C.; Lindell, M.K.; Prater, C.S.; Shiroshita, H.; Johnston, D.; Becker, J. Assessment of households’ responses to the tsunami threat: A comparative study of Japan and New Zealand. Int. J. Disaster Risk Reduct. 2017, 25, 274–282. [Google Scholar] [CrossRef]
- Apatu, E.J.; Gregg, C.E.; Wood, N.J.; Wang, L. Households evacuations charecteristics in American samoa during the 2009 samoa Island tsunami. Disasters 2016, 40, 779–798. [Google Scholar] [CrossRef] [PubMed]
- Buylova, A.; Chen, C.; Cramer, L.A.; Wang, H.; Cox, D.T. Households risk perceptions and evacuation intentions in earth-quake and tsunami in Cascadia subduction zone. Int. J. Disasters Risk Reduct. 2020, 44, 101–155. [Google Scholar] [CrossRef]
- Ghosh, S.; Dutta, S. Impact of climate change on flood characteristics in Brahmaputra basin using a macro-scale distributed hydrological model. J. Earth Syst. Sci. 2012, 121, 637–657. [Google Scholar] [CrossRef]
- Simonović, S.P. Social criteria for evaluation of flood control measures: Winnipeg case study. Urban Water 1999, 1, 167–175. [Google Scholar] [CrossRef]
- Henk, B.A. Social impact assessment. Eur. J. Oper. Res. 2001, 128, 311–321. [Google Scholar]
- Brouwer, R.; Van Ek, R. Integrated ecological, economic and social impact assessment of alternative flood control policies in the Netherlands. Ecol. Econ. 2004, 50, 1–21. [Google Scholar] [CrossRef]
- Penning-Rowsell, C.E.; Pardoe, J. Who loses if flood risk is reduced: Should we be concerned? R Geogr. Soc. 2012, 44, 152–159. [Google Scholar] [CrossRef]
- Morss, R.E.; Mulder, K.J.; Lazo, J.K.; Demuth, J.L. How do people perceive, understand, and anticipate responding to flash flood risks and warnings? Results from a public survey in Boulder, Colorado, USA. J. Hydrol. 2016, 541, 649–664. [Google Scholar] [CrossRef]
- Smith, P.J.; Brown, S.; Dugar, S. Community-based early warning systems for flood risk mitigation in Nepal. Nat. Hazards Earth Syst. Sci. 2017, 17, 423–437. [Google Scholar] [CrossRef]
- Jamrussri, S.; Toda, Y. Available Flood Evacuation Time for High-Risk Areas in the Middle Reach of Chao Phraya River Basin. Water 2018, 10, 1871. [Google Scholar] [CrossRef]
- Mavhura, E.; Manyena, B.; Collins, A.E. An approach for measuring social vulnerability in context: The case of flood hazards in Muzarabani district, Zimbabwe. Geoforum 2017, 86, 103–117. [Google Scholar] [CrossRef]
- Rufat, S.; Tate, E.; Burton, C.G.; Maroof, A.S. Social vulnerability to floods: Review of case studies and implications for meas-urement. Int. J. Disaster Risk Reduct. 2015, 14, 470–486. [Google Scholar] [CrossRef]
- Gentle, P.; Maraseni, T.N. Climate change, poverty and livelihoods: Adaptation practices by rural mountain communities in Nepal. Environ. Sci. Policy 2012, 21, 24–34. [Google Scholar] [CrossRef]
- Jones, S.; Oven, K.J.; Manyena, S.B.; Aryal, K. Governance struggles and policy processes in disaster risk reduction: A case study from Nepal. Geoforum 2014, 57, 78–90. [Google Scholar] [CrossRef]
- Yamanaka, M.; Yoshida, K.; Arita, K. Terrace landform and Quaternary deposits around Pokhara Valley, Central Nepal. J. Nepal Geol. Soc. 1982, 142, 113–142. [Google Scholar] [CrossRef]
- Fort, M. Sporadic Morphogenesis in a Continental Subdcution Setting: An Example from the Annapurna Range, Nepal Himalaya. Zeitschrit Geomorphol. 1987, 63, 9–36. [Google Scholar]
- Chow, V.T.; Maidment, D.R. MLW Applied Hydrology; Tata McGraw Hill Education Pvt Ltd.: New Delhi, India, 2010. [Google Scholar]
- Serede, I.J. A review for hydraulic analysis of irrigation canals using HEC-RAS model: A case study of Mwea irrigation scheme, Kenya. Hydrology 2014, 2, 1. [Google Scholar]
- Parhi, P.K. HEC-RAS Model for Manning’s Roughness: A case study. Open J. Mod. Hydrol. 2013, 3, 97–101. [Google Scholar] [CrossRef]
- Serede, I.J.; Mutua, B.M.; Raude, J.M. Calibration of channel roughness coefficient for Thiba Main Canal Reach in Mwea irri-gation scheme, Kenya. Hydrology 2015, 3, 55–65. [Google Scholar] [CrossRef]
- Kochar, R. A Global Middle Class Is More Promise Than Reality: From 2001 to 2011, Nearly 700 Million Step Out of Poverty, but Most Only Barely; Pew Research Center: Washington, DC, USA, 2015; Available online: http://www.pewglobal.org/2015/07/08/a-global-middle-class-is-more-promise-than-reality/ (accessed on 10 July 2020).
- Imai, K.S.; Gaiha, R.; Bresciani, F. Dynamics of rural transformation and poverty and inequality in Asia and the Pacific. In Handbook of Poverty; Greve, B., Ed.; Routledge: London, UK; Kobe University: Hyogo, Japan, 2019. [Google Scholar]
- Acharya, B.R. Asia Experience Government and Public Land Management in Nepal; FIG/FAO/CNG International Seminar on State and Public Sector Land Management: Verona, Italy, 2008; pp. 1–7. [Google Scholar]
- Lim, J.; Lim, M.; Piantanakulchi, M. A review of recent studies on flood evacuation planning. J. East. Asia Soc. Transp. Stud. 2013, 10, 147–162. [Google Scholar]
- Campos, V.; Bandeira, R.; Bandeira, A. A Method for Evacuation Route Planning in Disaster Situations. Procedia—Soc. Behav. Sci. 2012, 54, 503–512. [Google Scholar] [CrossRef]
- Abarquez, I.; Murshed, Z. Community Based Disaster Risk Management: Field Practitioners’ Handbook; ADCP: Bangkok, Thailand, 2004; Volume 150, pp. 1–163. [Google Scholar]
- Yusoff, M.; Ariffin, J.; Mohamed, A. Optimization approaches for macroscopic emergency evacuation planning: A survey. In Proceedings of the 2008 International Symposium on Information Technology, Kuala Lumpur, Malaysia, 26–28 August 2008; Volume 4. [Google Scholar] [CrossRef]
- Lim, M.B.B.; Lim, H.R.; Piantanakulchai, M. Flood evacuation decision modeling for high risk urban area in the Philippines. Asia Pac. Manag. Rev. 2019, 24, 106–113. [Google Scholar] [CrossRef]
- Bashawri, A.; Garrity, S.; Moodley, K. An Overview of the Design of Disaster Relief Shelters. Procedia Econ. Finance 2014, 18, 924–931. [Google Scholar] [CrossRef]
- Wagemann, E. Need for adaptation: Transformation of temporary houses. Disasters 2017, 41, 828–851. [Google Scholar] [CrossRef]
- Scolobig, A.; De Marchi, B.; Borga, M. The missing link between flood risk awareness and preparedness: Findings from case studies in an Alpine Region. Nat. Hazards 2012, 63, 499–520. [Google Scholar] [CrossRef]
- De Marchi, B.; Scolobig, A. The views of experts and residents on social vulnerability to flash floods in an Alpine region of Italy. Disasters 2012, 36, 316–337. [Google Scholar] [CrossRef] [PubMed]
- Kongsomsaksakul, S.; Yang, C.; Chen, A. Shelter Location-Allocation Model for Flood Evacuation Planning. J. East. Asia Soc. Transp. Stud. 2005, 6, 4237–4252. [Google Scholar]
- Alias, N.E.; Salim, N.A.; Taib, S.M.; Mohd Yusof, M.B.; Saari, R.; Adli Ramli, M.W.; Othman, I.K.; Annammala, K.V.; Yusof, H.M.; Ismail, N.; et al. Community responses on effective flood dissemination warnings—A case study of the December 2014 Kelantan Flood, Malaysia. J. Flood Risk Manag. 2020, 13, 1–13. [Google Scholar] [CrossRef]
- Morss, R.E.; DeMuth, J.L.; Bostrom, A.; Lazo, J.K.; Lazrus, H. Flash Flood Risks and Warning Decisions: A Mental Models Study of Forecasters, Public Officials, and Media Broadcasters in Boulder, Colorado. Risk Anal. 2015, 35, 2009–2028. [Google Scholar] [CrossRef]
- Smith, P.J.; Beven, K.J.; Leedal, D.; Weerts, A.H.; Young, P.C. Testing probabilistic adaptive real-time flood forecasting models. J. Flood Risk Manag. 2014, 7, 265–279. [Google Scholar] [CrossRef]
- Du, E.; Cai, X.; Sun, Z.; Minsker, B. Exploring the Role of Social Media and Individual Behaviors in Flood Evacuation Processes: An Agent-Based Modeling Approach. Water Resour. Res. 2017, 53, 9164–9180. [Google Scholar] [CrossRef]
- Romo-Murphy, E.; Vos, M. The role of broadcast media in disaster preparedness education: Lessons learned in the scientific literature 2002–2012. Media Asia 2014, 41, 71–85. [Google Scholar] [CrossRef]
- Statista. Mobile Network Coverage as Share of Population in Nepal in 2016, by Type. Available online: https://www.statista (accessed on 9 October 2021).
- The World Bank. Available online: https://data.worldbank.org/indicator/IT (accessed on 9 October 2021).
- Government of Nepal. National Planning Commission, Central Bureau of Statistics; Statistical Pocket Book Nepal; Government of Nepal: Kathmandu, Nepal, 2018; Volume 199.
- CBS Nepal. Multiple Indicator Cluster Survey 2019; Survey Findings Report; Government of Nepal: Kathmandu, Nepal, 2020; pp. 96–97.
- CBS Nepal. Statistical Year Book 2019; Government of Nepal: Kathmandu, Nepal, 2019; ISBN 9789845191128.
- Lim, M.B.B.; Lim, H.R.; Piantanakulchai, M.; Uy, F.A. A household-level flood evacuation decision model in Quezon City, Philippines. Nat. Hazards 2016, 80, 1539–1561. [Google Scholar] [CrossRef]
- Shekhar, S.; Yang, K.; Gunturi, V.M.V.; Manikonda, L.; Oliver, D.; Zhou, X.; George, B.; Kim, S.; Wolff, J.M.; Lu, Q. Experiences with evacuation route planning algorithms. Int. J. Geogr. Inf. Sci. 2012, 26, 2253–2265. [Google Scholar] [CrossRef]
- Bi, C.; Pan, G.; Yang, L.; Lin, C.-C.; Hou, M.; Huang, Y. Evacuation route recommendation using auto-encoder and Markov decision process. Appl. Soft Comput. J. 2019, 84, 105741. [Google Scholar] [CrossRef]
- Busato, L.; Boaga, J.; Peruzzo, L.; Himi, M.; Cola, S.; Bersan, S.; Cassiani, G. Combined geophysical surveys for the characterization of a reconstructed river embankment. Eng. Geol. 2016, 211, 74–84. [Google Scholar] [CrossRef]
- Park, S.; Lee, G.; Kim, J.O. Flood Evacuation Mapping Using a Time–Distance cartogram. ISPRS Int. J. Geo-Inf. 2020, 9, 207. [Google Scholar] [CrossRef]
- Liu, Q.; Ruan, X.; Shi, P. Selection of emergency shelter sites for seismic disasters in mountainous regions: Lessons from the 2008 Wenchuan Ms 8.0 Earthquake, China. J. Asian Earth Sci. 2011, 40, 926–934. [Google Scholar] [CrossRef]
- Sridarran, P.; Keraminiyage, K.; Amaratunga, D. Enablers and barriers of adapting post-disaster resettlements. Procedia Eng. 2018, 212, 125–132. [Google Scholar] [CrossRef]
- Bang, H.N.; Few, R. Social risks and challenges in post-disaster resettlement: The case of Lake Nyos, Cameroon. J. Risk Res. 2012, 15, 1141–1157. [Google Scholar] [CrossRef]
- Chen, Y.; Tan, Y.; Luo, Y. Post-disaster resettlement and livelihood vulnerability in rural China. Disaster Prev. Manag. Int. J. 2017, 26, 65–78. [Google Scholar] [CrossRef]
Publisher’s Note: MDPI stays neutral with regard to jurisdictional claims in published maps and institutional affiliations. |
© 2022 by the authors. Licensee MDPI, Basel, Switzerland. This article is an open access article distributed under the terms and conditions of the Creative Commons Attribution (CC BY) license (https://creativecommons.org/licenses/by/4.0/).