1. Introduction
Soil erosion is a severe and complex issue in the agricultural area, and can be defined as a process of detachment of particles that are transported or deposited in other areas by water or wind actions. The Food and Agriculture Organization of the United Nations (FAO) in its main report starts with “Soils are fundamental to life on Earth” [
1], while other research indicates that erosion is endangering several areas such as natural resources, flooding and affecting water reservoirs [
2,
3]. Given this, it is fundamental to assess and control the dimension of erosion and its socio-economic and environmental impacts.
Several environmental factors affect soil erosion rates, such as the characteristics of the soil, the slope, the precipitation, the vegetation coverage and type, etc. The slope is one of the most influential factors in soil erosion estimation [
4].
In Portugal, as in many other countries of the European Mediterranean, soil erosion is one of the main environmental problems affecting the sustainability of agro-forestry systems [
5]. The soil loss problem is concentrated in arable crop areas due to the adopted exploitation of agricultural management practices and intense farming that increases soil loss [
6]. Several studies have been performed in the Mediterranean watersheds, since this region is particularly prone to erosion, due to the long dry periods, heavy erosive rainfall events, steep slopes, low organic matter, low nutrient contents, and rapid land-use changes [
7,
8,
9]. For instance, Rellini et al. [
9] applied the RUSLE model in Portofino regional park, in Italy, presenting several methodological improvements, especially in the Joint Research Center (JRC) modelling assessment of R factor. Rosskopf et al. [
6] assessed the spatial variability of soil properties and erodibility to investigate the relationship between soil features and landscape morphodynamics. This study was also applied in hilly agricultural areas in Italy. The K factor influence in RUSLE results was evaluated. Other studies, such as Lanorte et al. [
10] estimated RUSLE using remote sensing data to build a prediction model of post-fire soil erosion risk. Vieira et al. [
11] used field data and combined different erosion models (RUSLE), semi-empirical (MMF), and physically-based (PESERA), to predict the hydrological and erosive response as well as the effectiveness of different mulching techniques in fire-affected areas and concluded that the three models were reasonably accurate in the hydrological and erosive processes in burned forest areas.
The measurement of soil erosion by direct methods is a complex and demanding process for the assessment of soil losses. Therefore, different models, based on the climatic, topographic characteristics and soil resistivity to erosion, have been used to obtain soil losses. The soil erosion models can be estimated from different methods and consider different input data. Despite the high interest in agriculture and other cognitive fields, there is still no model that is universally accepted. The most widespread method is the Revised Universal Soil Loss Equation (RUSLE; [
12]). The RUSLE method uses the same equation as the Universal Soil Loss Equation (USLE; [
4]), an empirical model frequently used to estimate soil erosion. However, the RUSLE approach includes several improvements in the slope length and slope steepness (LS) factor calculation. The RUSLE equation was modified over time and according to the characteristics of the study cases. Other methods, derived from RUSLE, have been proposed in the literature to estimate soil losses, such as Revised Universal Soil Loss Equation-3D (RUSLE-3D; [
13]), Revised Universal Soil Loss Equation embedding Information Diffusion Model (RUSLE-IDM; [
2]), and a modified version of the USLE (MUSLE) that takes into account the flow load at the outlet considering the biophysical characteristics of the watershed [
14], among other factors. The RUSLE method is considered simple and incorporates easily available and accessible data and represents environmental factors, such as climate, soil topography, slope, organic matter, permeability rate, geomorphic setup, lithology structure, and land use and land cover (LULC), among other factors that affect the soil erosion [
3,
15].
The RUSLE equation and RUSLE-derived methods are composed of several factors related to different sources of information: (i) the R factor, the rainfall-runoff erosivity factor, a measure of the erosive forces of rainfall-runoff; (ii) the K factor, the soil erodibility factor; (iii) the LS factor, which is the combination of slope length (L) and slope steepness (S); (iv) the C factor, the land cover factor; and (v) the P factor which is the practices used for erosion control. There are several methods to estimate each one of these factors. For instance, the LS factor, which describes the influence of topography on soil erosion risk considering the length of a slope and the influence of surface runoff and considering the steepness of a slope, has been estimated by several methods, especially the S factor [
16], since the LS factor is the more complex factor in USLE or RUSLE and it is a particular issue when applied in landscapes and also is the most sensitive parameter of RUSLE in soil loss predictions [
17]. The original method was estimated under the USLE equation by Wischmeier and Smith [
4]. Since 1940, several improved methods for the S factor have been proposed [
18,
19,
20,
21,
22], including Foster [
23], McCool et al. [
24], Moore and Wilson [
17] and Mitasova [
13]. In these improved methods for the LS factor, the slope is always required.
The study of soil loss is related to natural risk prevention areas. Under the scope of the soil erosion risk assessment, some constraints have been identified in the computation of the equation used. The main constraint focused on the conversion of the units in which some of the calculation factors are found, as well as with the differential in the quality of the information available for the different regions of the continental territory, which leads to the fact that it is not always possible to ensure the accuracy of the results obtained.
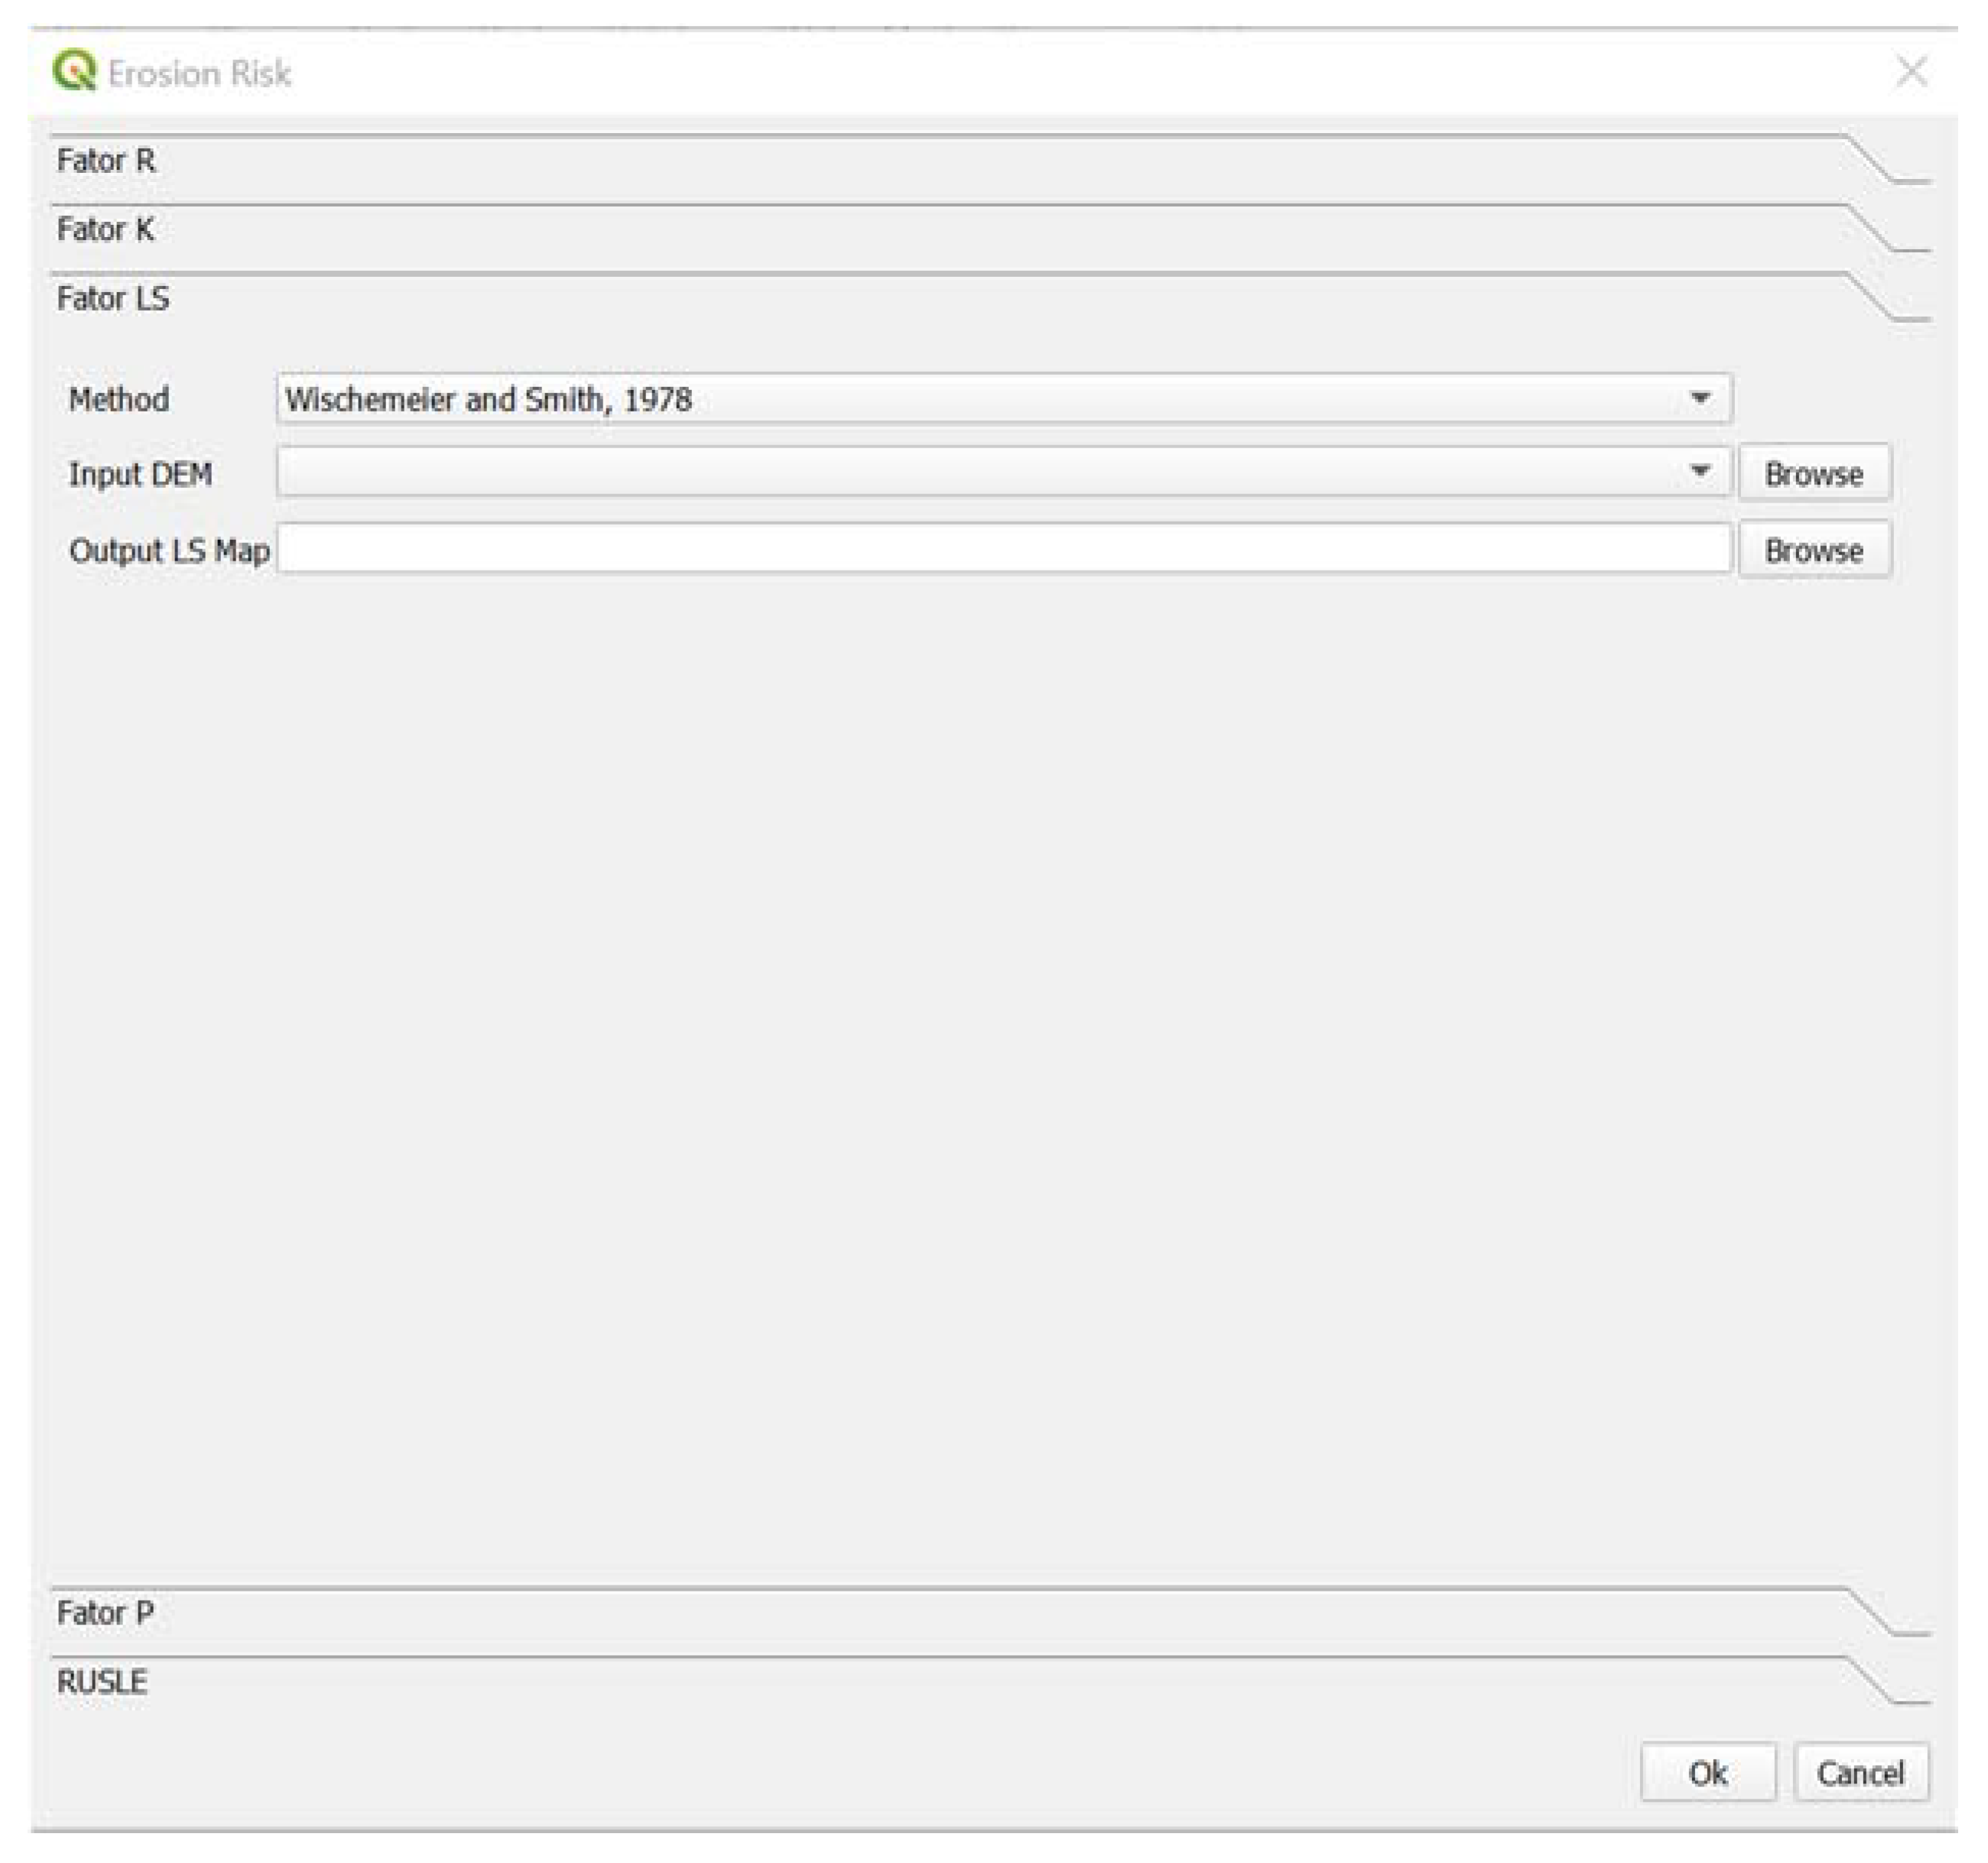
The main objective of this study was to assess the soil loss in two regions with different characteristics, testing different methodologies and combining different factors of the RUSLE equation. To provide the methodologies to other users, an open-source Geographical Information System (GIS) application was developed. In this work, we apply the RUSLE equation with the variation of some factors that compose it, namely the factors LS and P, but also with the use of different sources of information (for R factor). GIS and Remote Sensing (RS) data/techniques have been used to retrieve the different factors. Several studies used GIS software to produce erosion risk maps to assess soil loss [
15,
25,
26,
27,
28,
29,
30].
The different erosion models were applied to two study cases, Montalegre and Alentejo (in Portugal), to compare them, to evaluate the soil loss and answer this question: which methodology is more appropriate to infer soil erosion risk in a rainy mountainous zone (Montalegre) and in a dry and flat zone (Alentejo)?
The open-source GIS application was developed using an open-source programming language, and it can be adapted to other countries by adjusting the rules. The application is free and open-source and available to any user to use and improve it.
3. Case Study
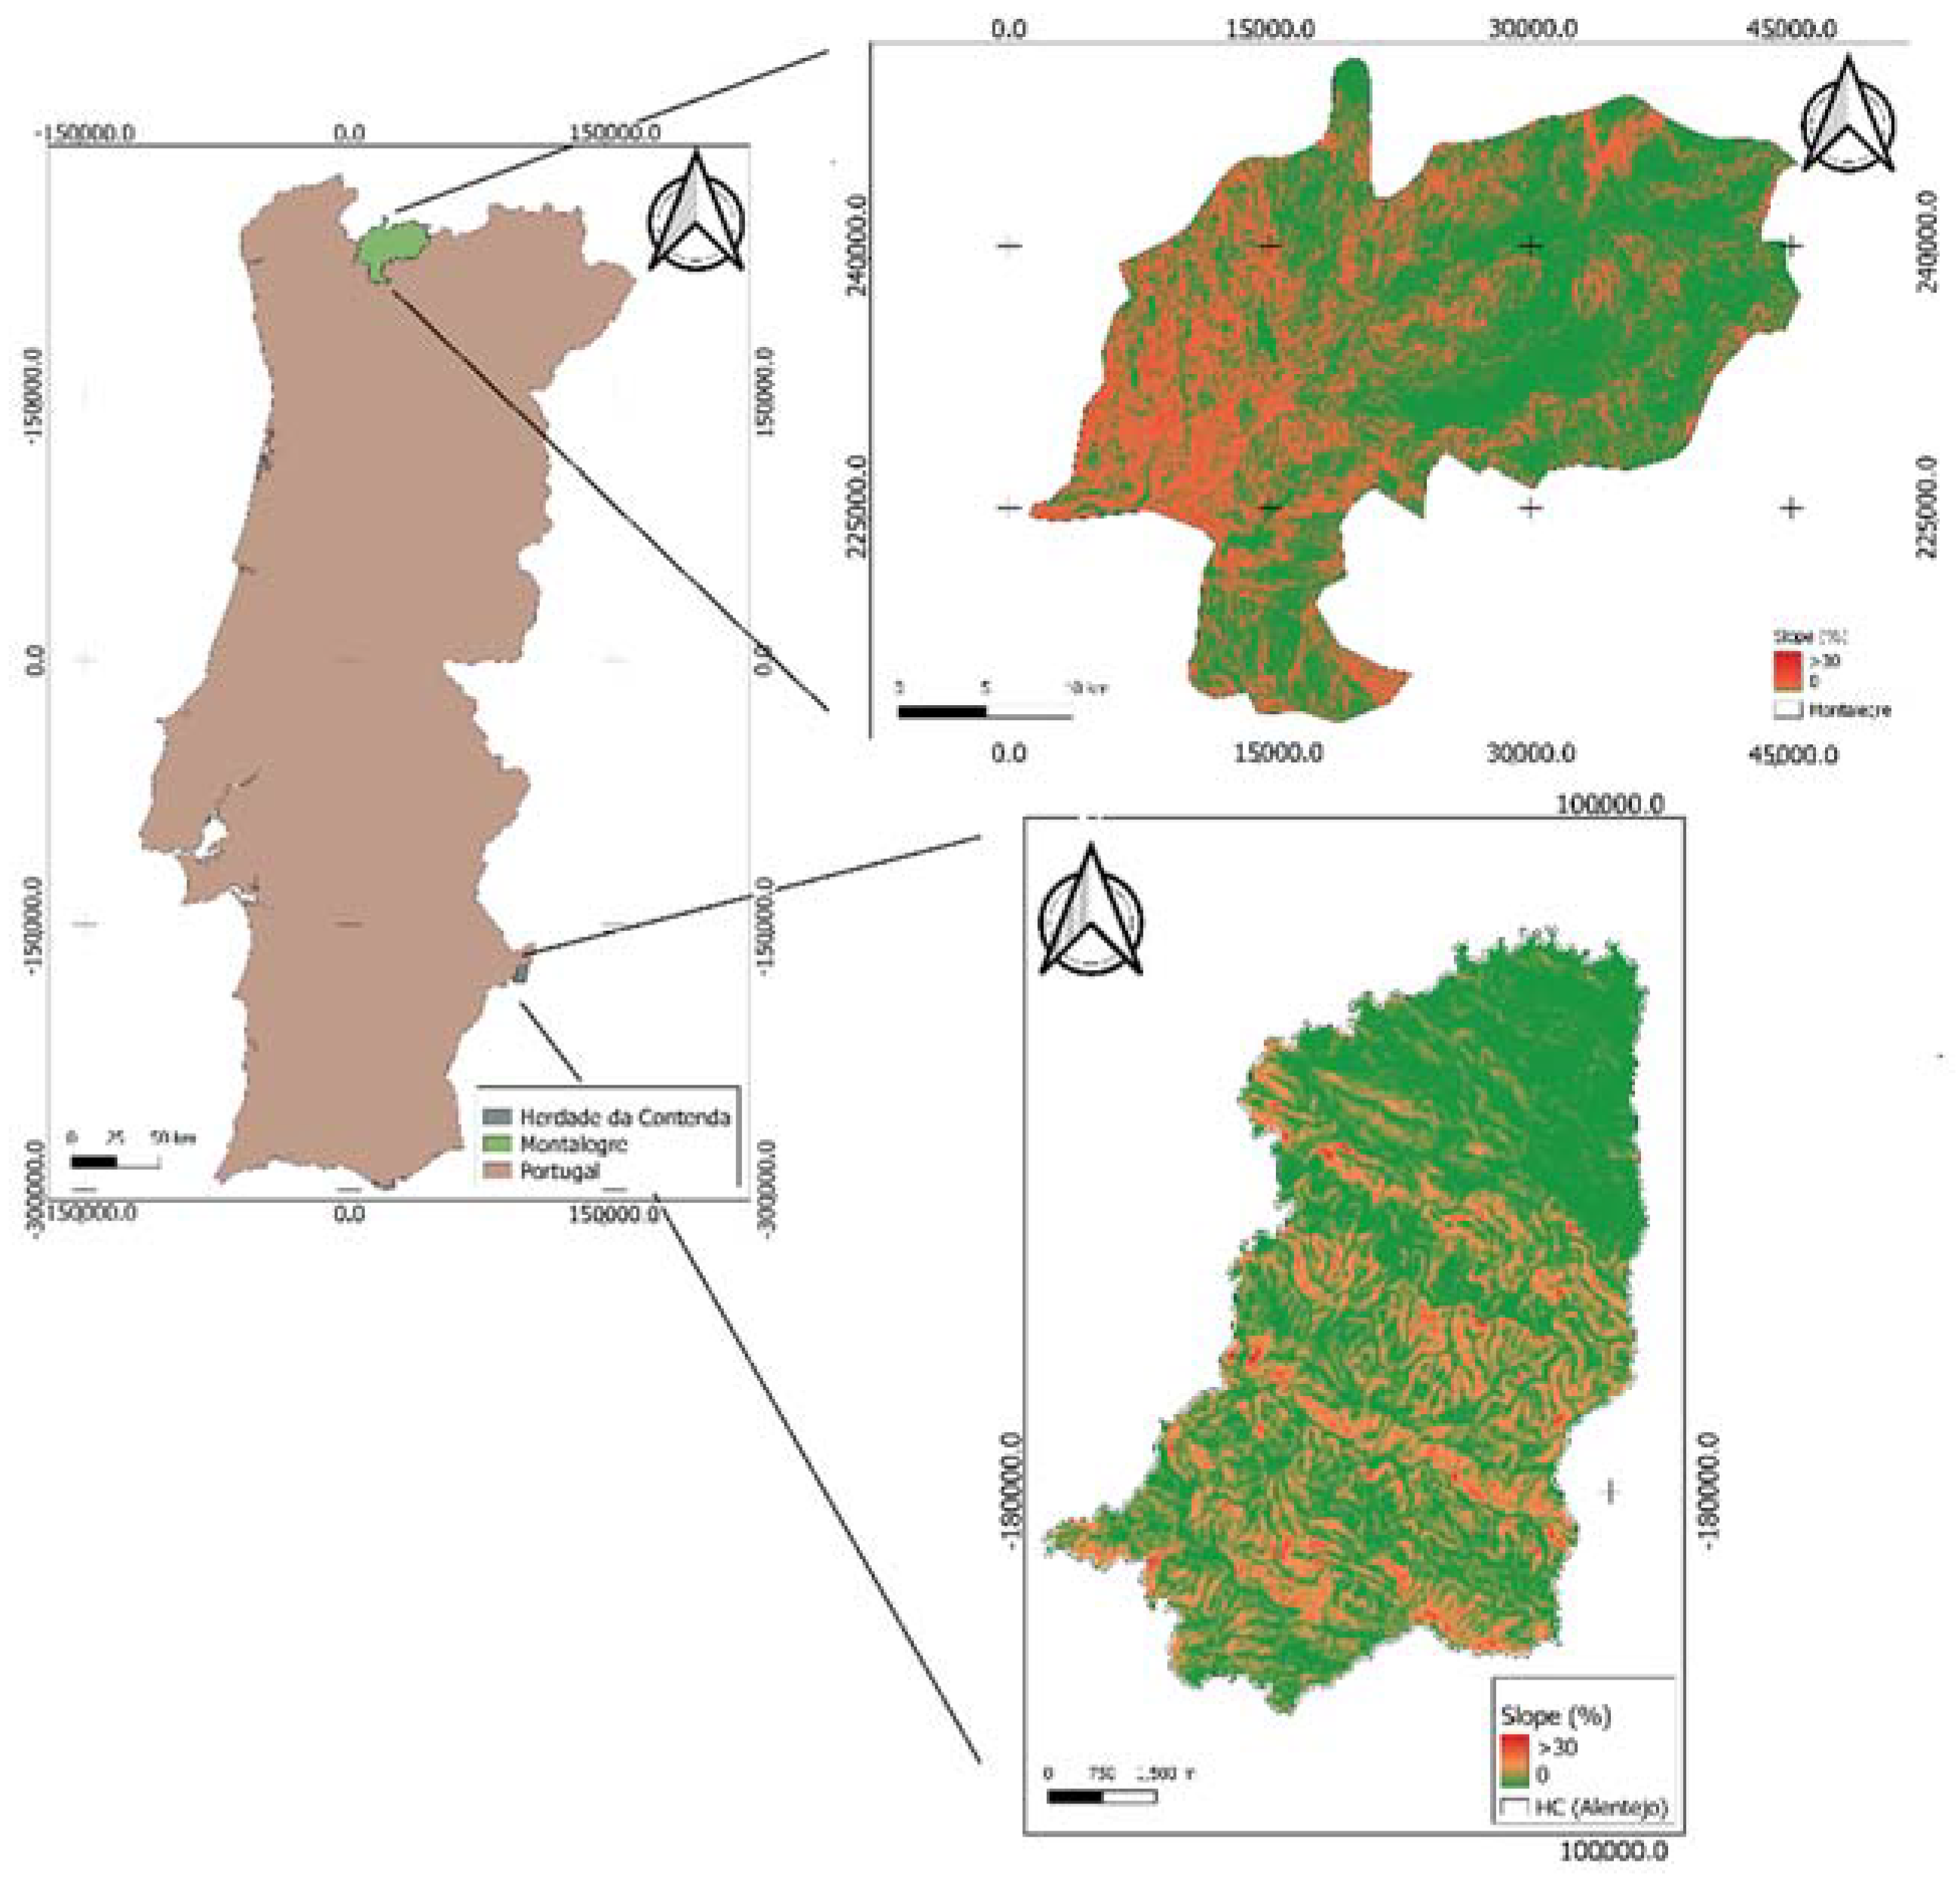
The hydric erosion methodologies involved in the application were tested in two different regions in Portugal: (i) mountainous and rainy region (Montalegre, North of Portugal); and (ii) dry and flat region (Alentejo, South of Portugal;
Figure 2).
The Montalegre municipality is a mountainous region located in the North of Portugal and covering an area of approximately 823.3 km
2. It extends from (8°7′ W, 41°35′ N) to (7°35′ W, 41°56′ N) and the elevation values range from 163 m to 1505 m (
Figure 2). In Montalegre, the grassland system includes permanent semi-natural meadows (called lameiros) and common lands, which represent around 70% of the agricultural area [
41], and bovine livestock is the main agricultural activity. In this region the Atlantic climate favors high precipitation occurrence (1531 mm/year), mainly occurring from autumn to spring, autumn-winter temperatures lower than 12 °C and mean monthly temperatures ranging from 3.5 °C to 17.2 °C. The high precipitation values occurred from autumn to spring, combining with high slope values and promoting soil loss. According to Koppen’s classification [
42] for the period (1980–2010), the region belongs to group
Csb (temperate, with dry summer, which is not very hot but extensive), while Thornthwaite’s rational climate classification [
43] describes it as A B′1 s b′4 super-humid (hydric index 137; A), primer-mesothermic (thermal efficiency index: 622 mm evapotranspiration; B’1), with a moderate shortage of water in the summer (aridity index: 16.8; s) and moderate thermal efficiency summer concentration index: 48%; b′4 (above 20% ≥ typically continental).
The Alentejo study zone was chosen as having opposite characteristics to Montalegre. The study zone is located in the South of Portugal, and it is a protected zone, a National Hunt zone and Forestry Perimeter, that belongs to the western part of the Serra Morena, in the municipality of Moura, Beja District, Portugal (
Figure 2). It is named
Herdade da Contenda (HC), and it extends along 19 km of the Portuguese-Spanish border with an area of 52.7 km
2. In this region, the elevation values range from 246 m to 543 m, with the South and Southeast part presenting the highest elevation values (
Figure 2). The annual average temperature is around 17.0 °C (maximum 24.3 °C and minimum 9.3 °C). The mean annual precipitation value is 729.5 mm with January and February presenting the highest values. During summer, the precipitation presents very low values.
According to Köppen classification [
42], the Alentejo climate is a
Csa (Mediterranean climate, with dry summer, which is not very hot but extensive), while Thornthwaite’s rational climate classification [
43] describes it as: DA′s2sa′ semi-arid (moisture index: −23.8; D), megathermal (thermal efficiency index: 1210 mm evapotranspiration; A), with large summer water deficiency (aridity index: 58%; s2), moderate winter water surplus (humidity index: 11%; s) and summer concentration of thermal efficiency index of 47% (above 20%; typically continental).
The two regions have climates that clearly distinguish themselves, since Montalegre is a humid and rainy region, while Alentejo is a dry and flat region (
Figure 2).
3.1. Data Acquisition
The data were obtained from different sources with different coordinate systems assigned. All the data were projected to the European Terrestrial System 1989 Portugal Transverse Mercator 2006 (ETRS89–PTTM06) coordinate system. The obtained information was also limited to the study zone, using algorithms from QGIS, such as Clip layer by mask. This process was implemented in the application.
In order to obtain the R factor, the raster file with the precipitation erosivity values available in the SNIAmb da Agência Portuguesa do Ambiente, I.P. [
44] was used. The precipitation erosivity was estimated based on 449 udometric stations with rainy events of 50.8 mm. A rainy event is preceded by an interval of at least 6 h without the occurrence of precipitation [
4]. The data is in American tons/acre units. In this case, the units should be converted to the IS corresponding to MJ·mm/ha·h.ano.
Table 3 presents the data sources for R, K and LS factors used in this work.
The K values, corresponding to soil erodibility, can be obtained from the soil map and land suitability map for agriculture, when available. In the cases that this information is not available, the user can assign the P values according to Pimenta [
31] tables, which are available in the GIS application. A Digital Elevation Model (DEM), obtained from Shuttle Radar Topography Mission (SRTM) [
45] with a spatial resolution of 25 m, was used to derive the LS factor. The data was resampled to 25 m in both regions, Montalegre and Alentejo, following the mosaic created from DEM.
3.2. Data Processing
The maps were created using the GIS application and considering the different methodologies adopted for the LS factor, the different sources for R values and with different P values. The final erosion risk maps were classified in three categories: 0–25; 25–55; and >55 (ton/ha·year). In order to evaluate the results obtained, the percentages of each area in each of the three categories were obtained, using the QGIS r.mapcalc.simple tool. Some statistical variables such as average, standard deviation and confidence interval were also estimated. Additionally, to compare the results obtained between the two regions, and between the different categories, several graphics were created and analyzed.
4. Results and Discussion
The different methodologies were applied to each study area to compare them, to evaluate and answer the question “which methodology is more appropriate to study the soil erosion risk in a mountainous and rainy zone such as Montalegre municipality and, on the other hand, which methodology is more appropriate for a dry and flat zone such as Alentejo”?
The final maps were created for the eight methodologies proposed in this study.
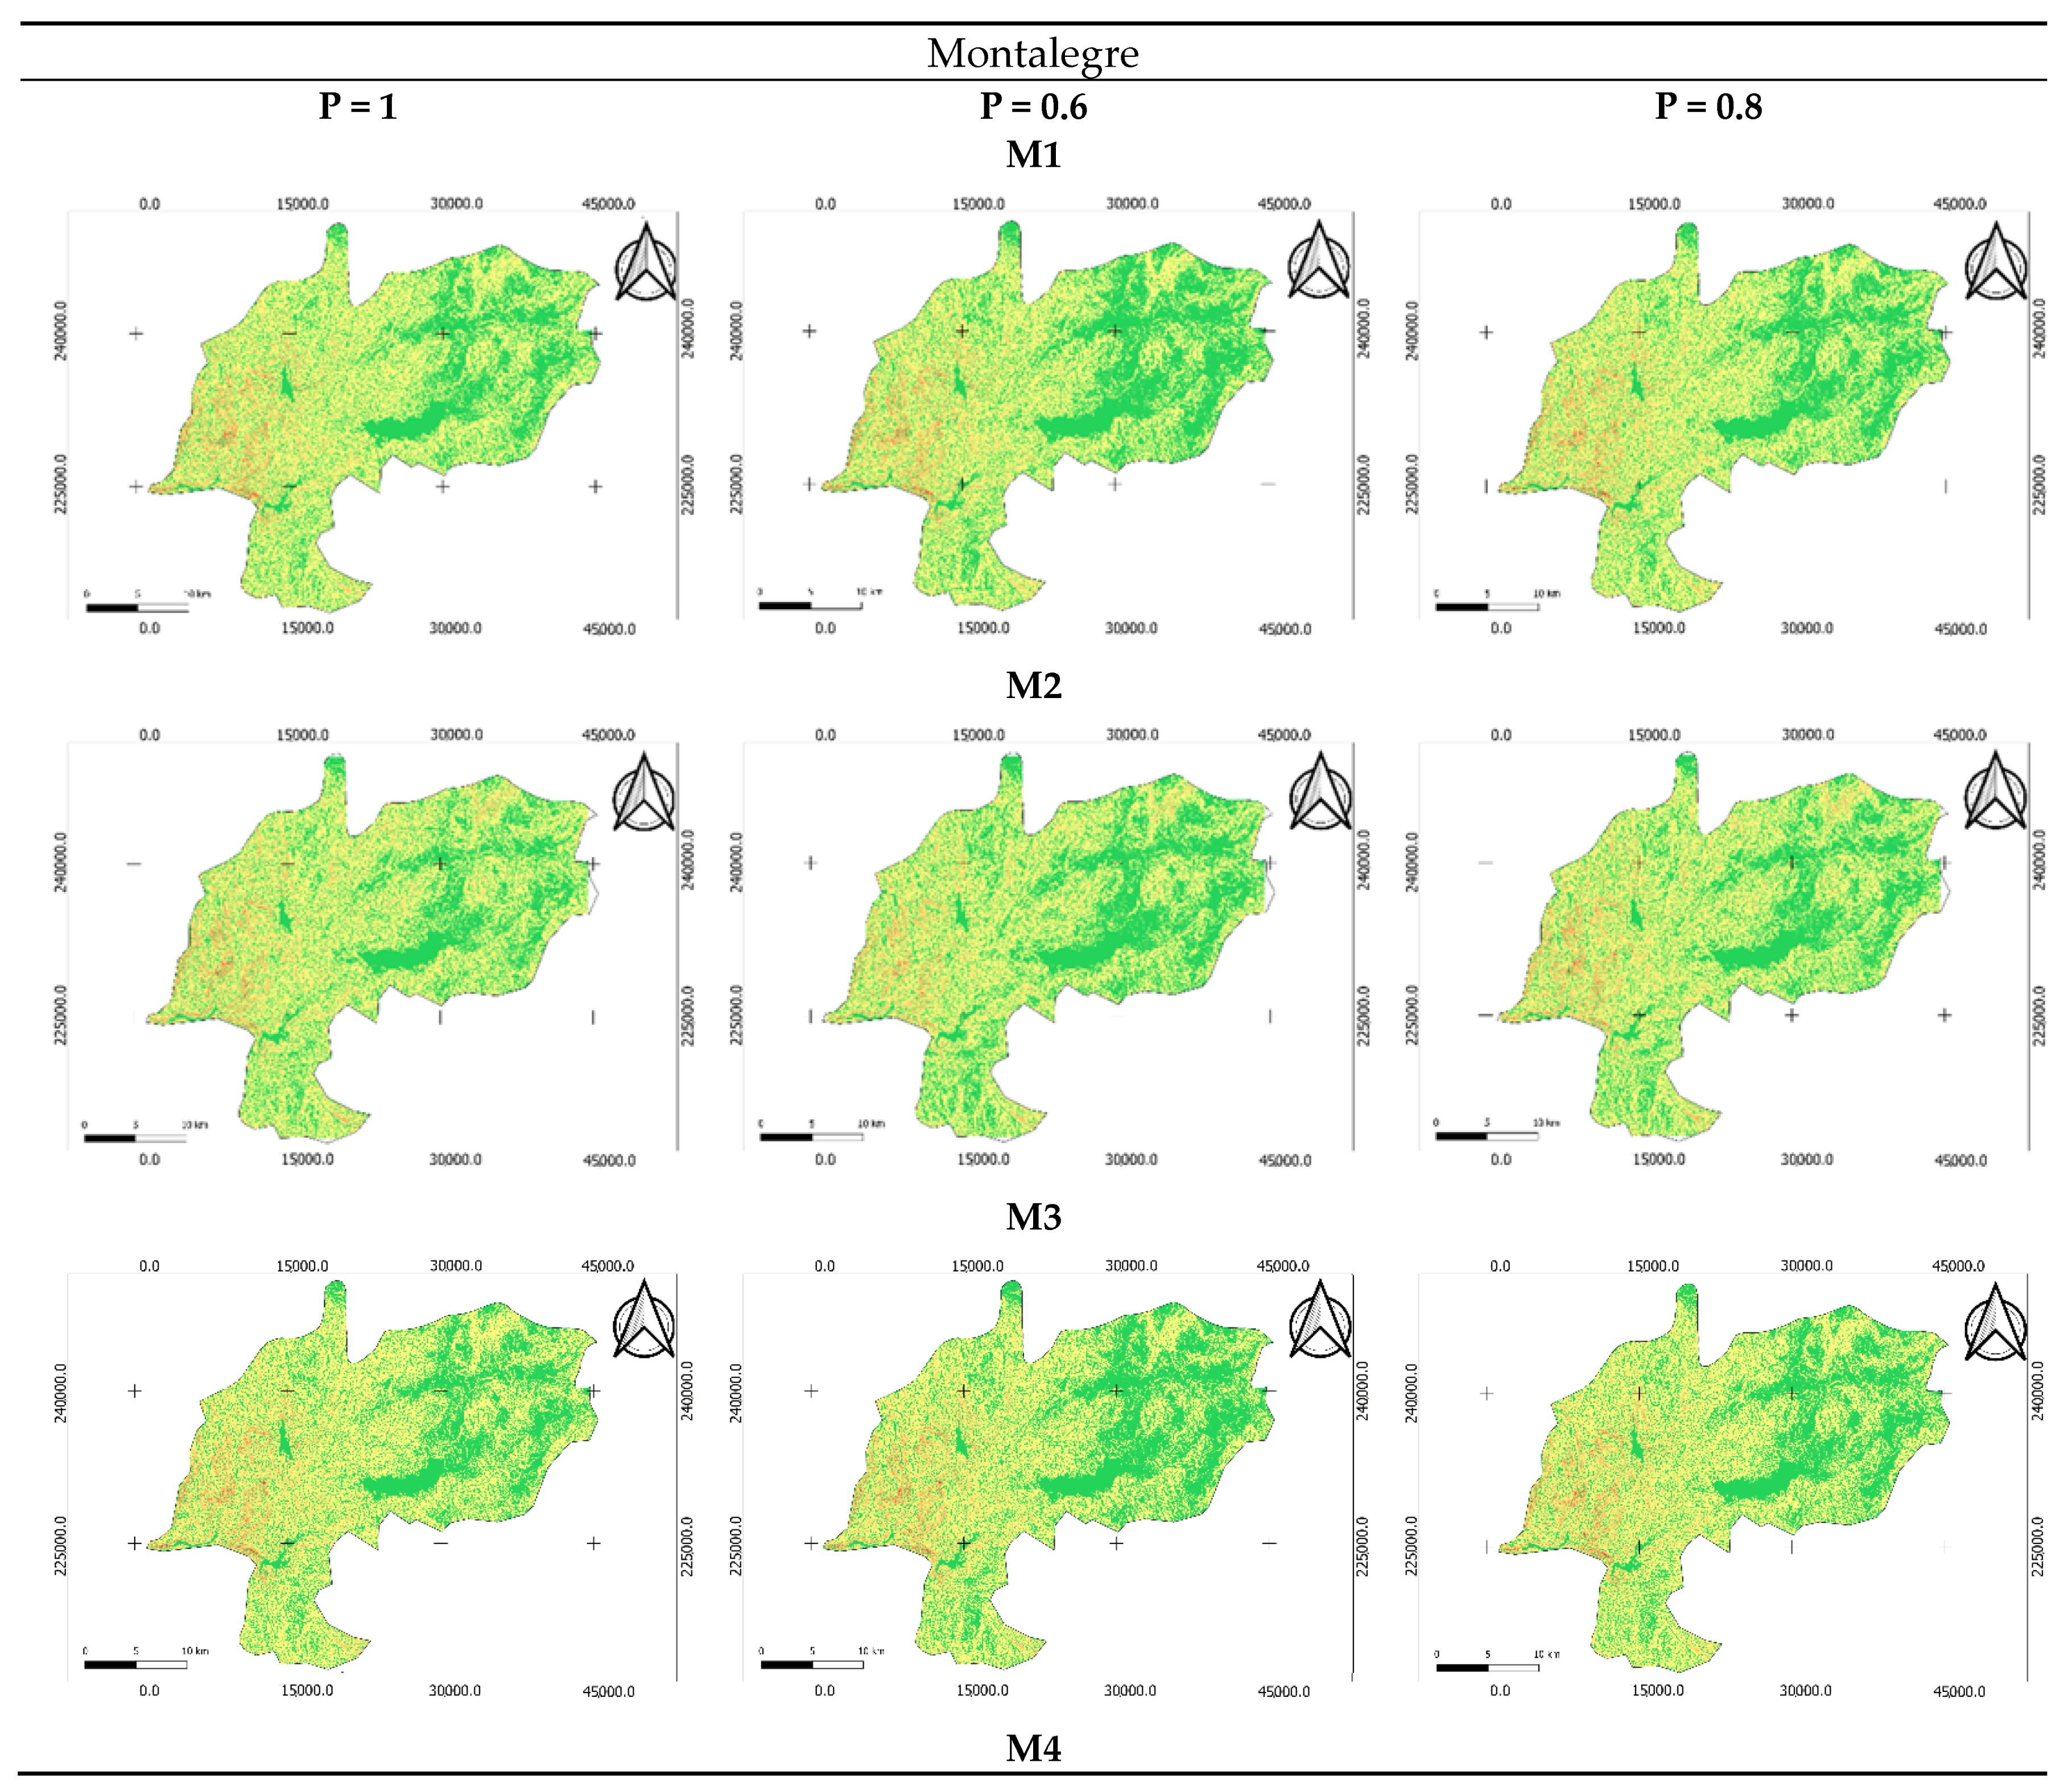
Figure 3 and
Figure 4 present the maps obtained.
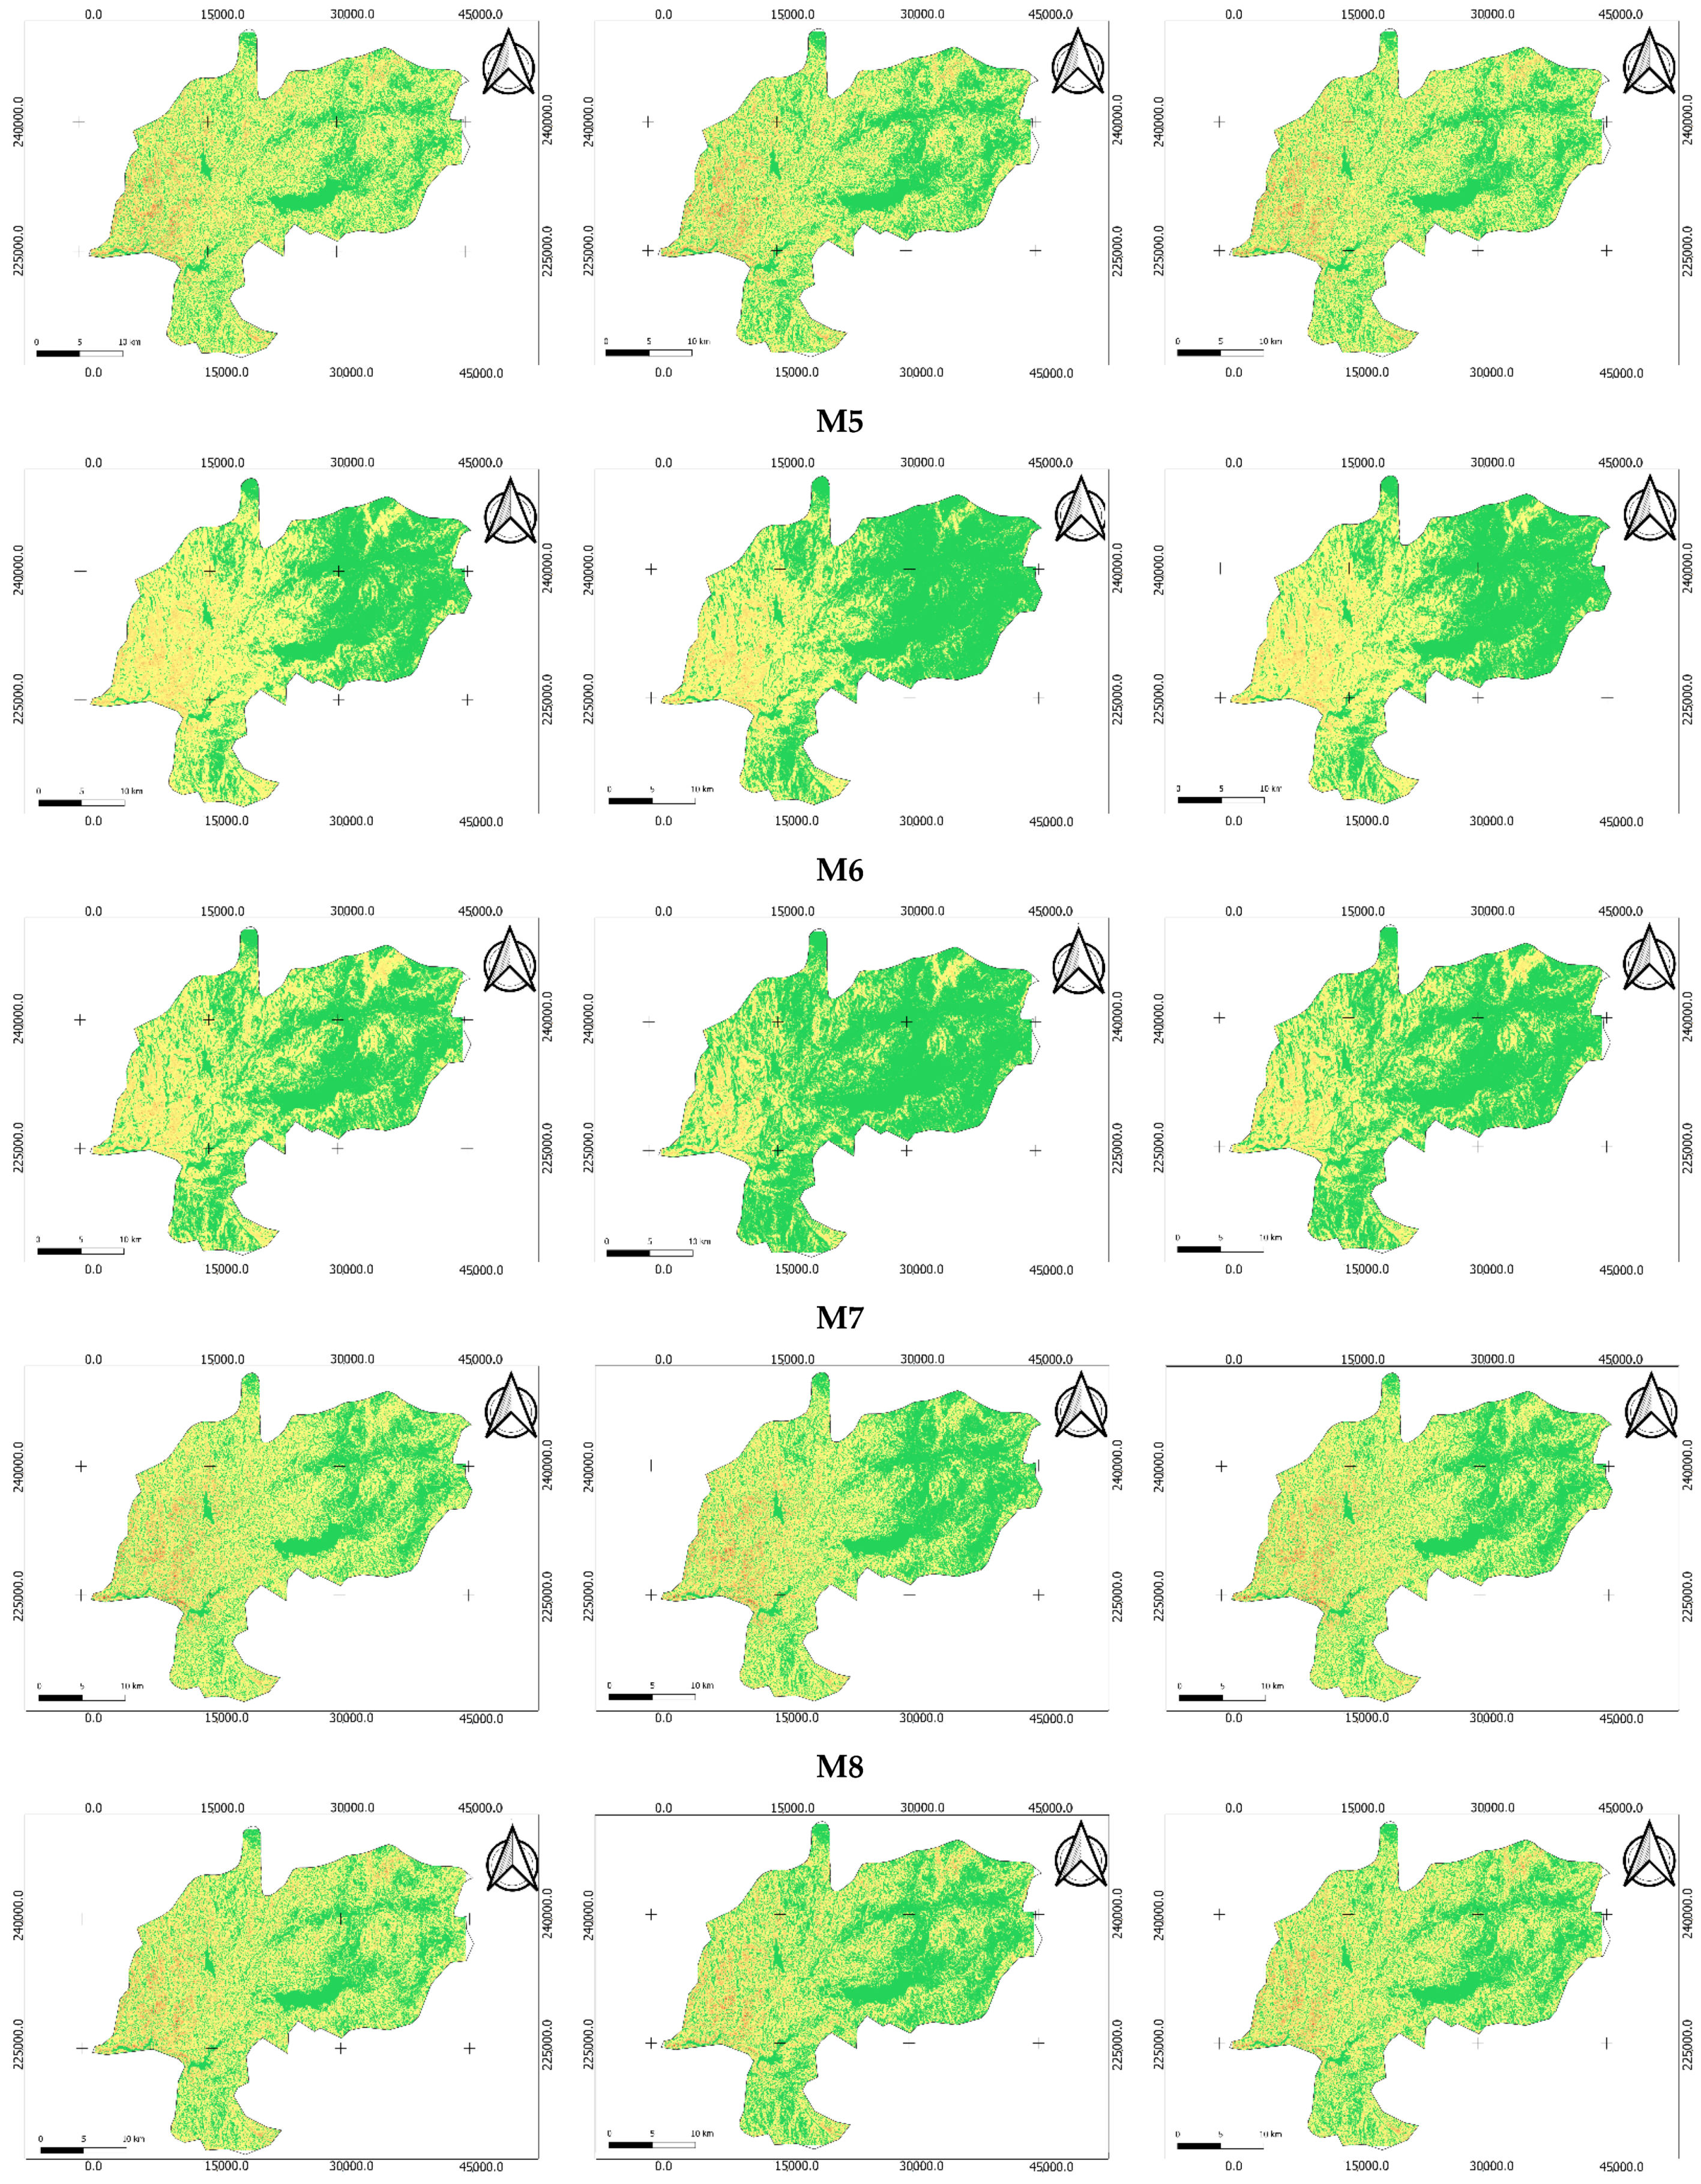
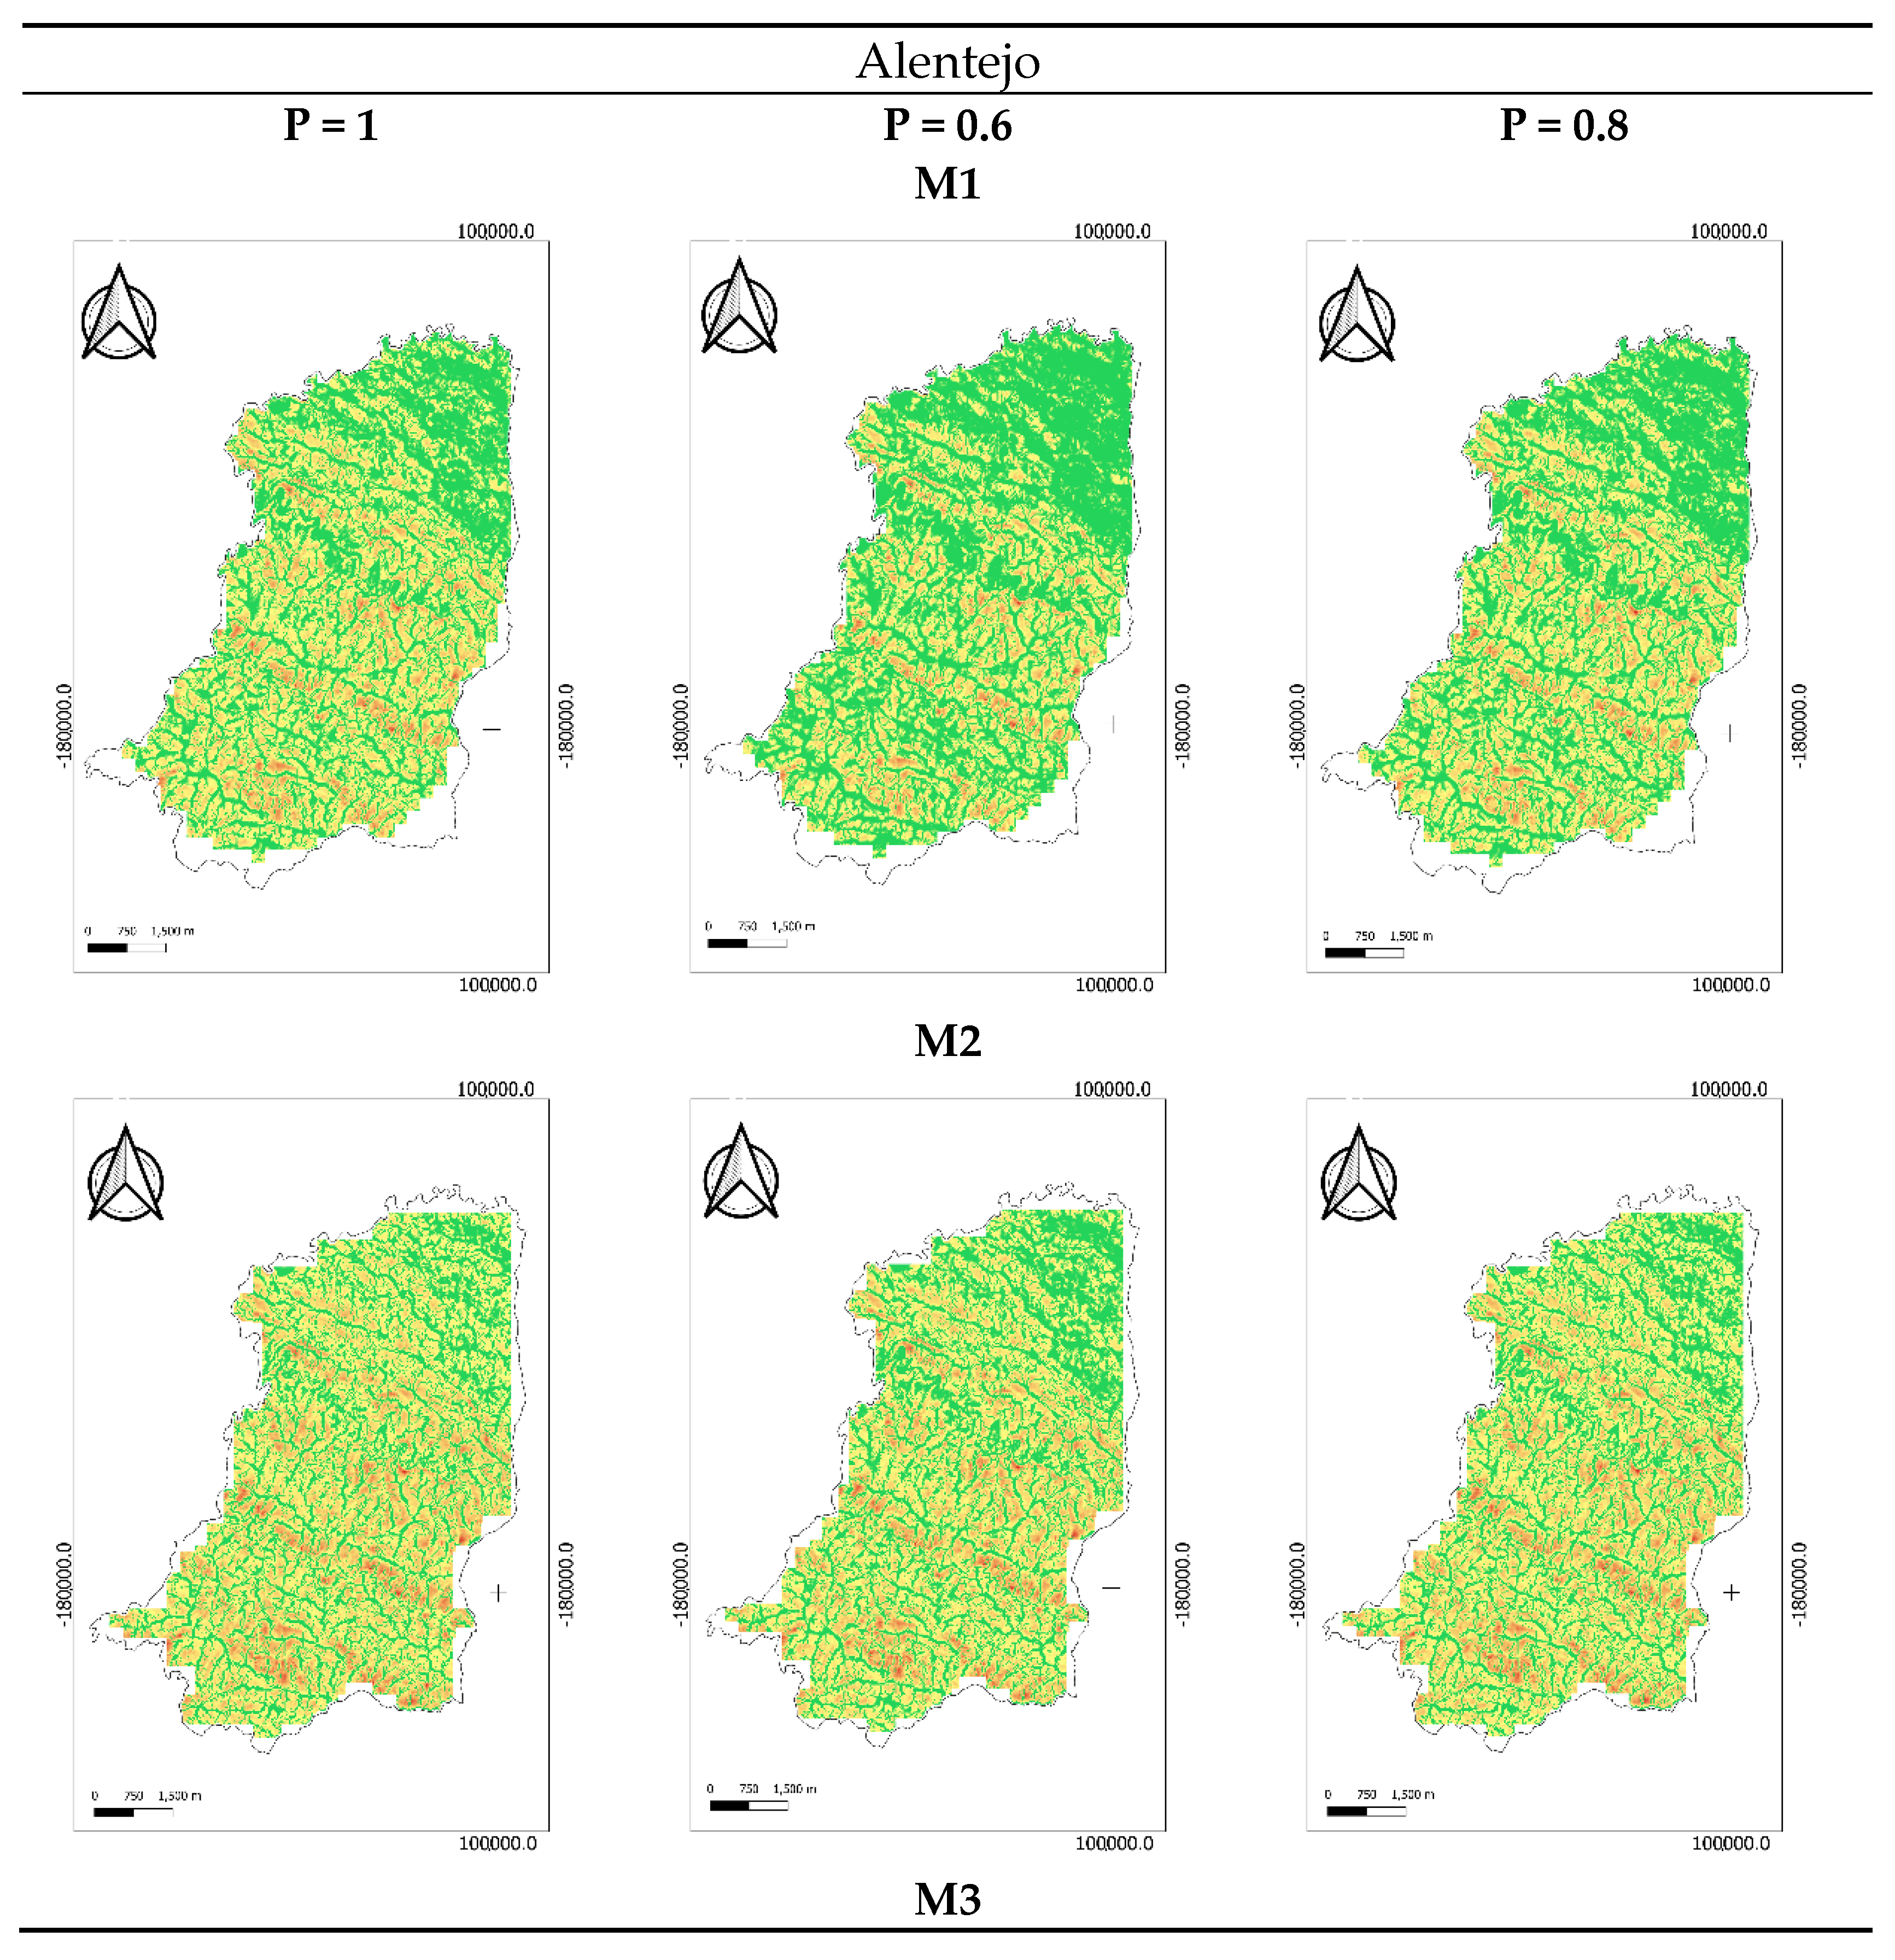
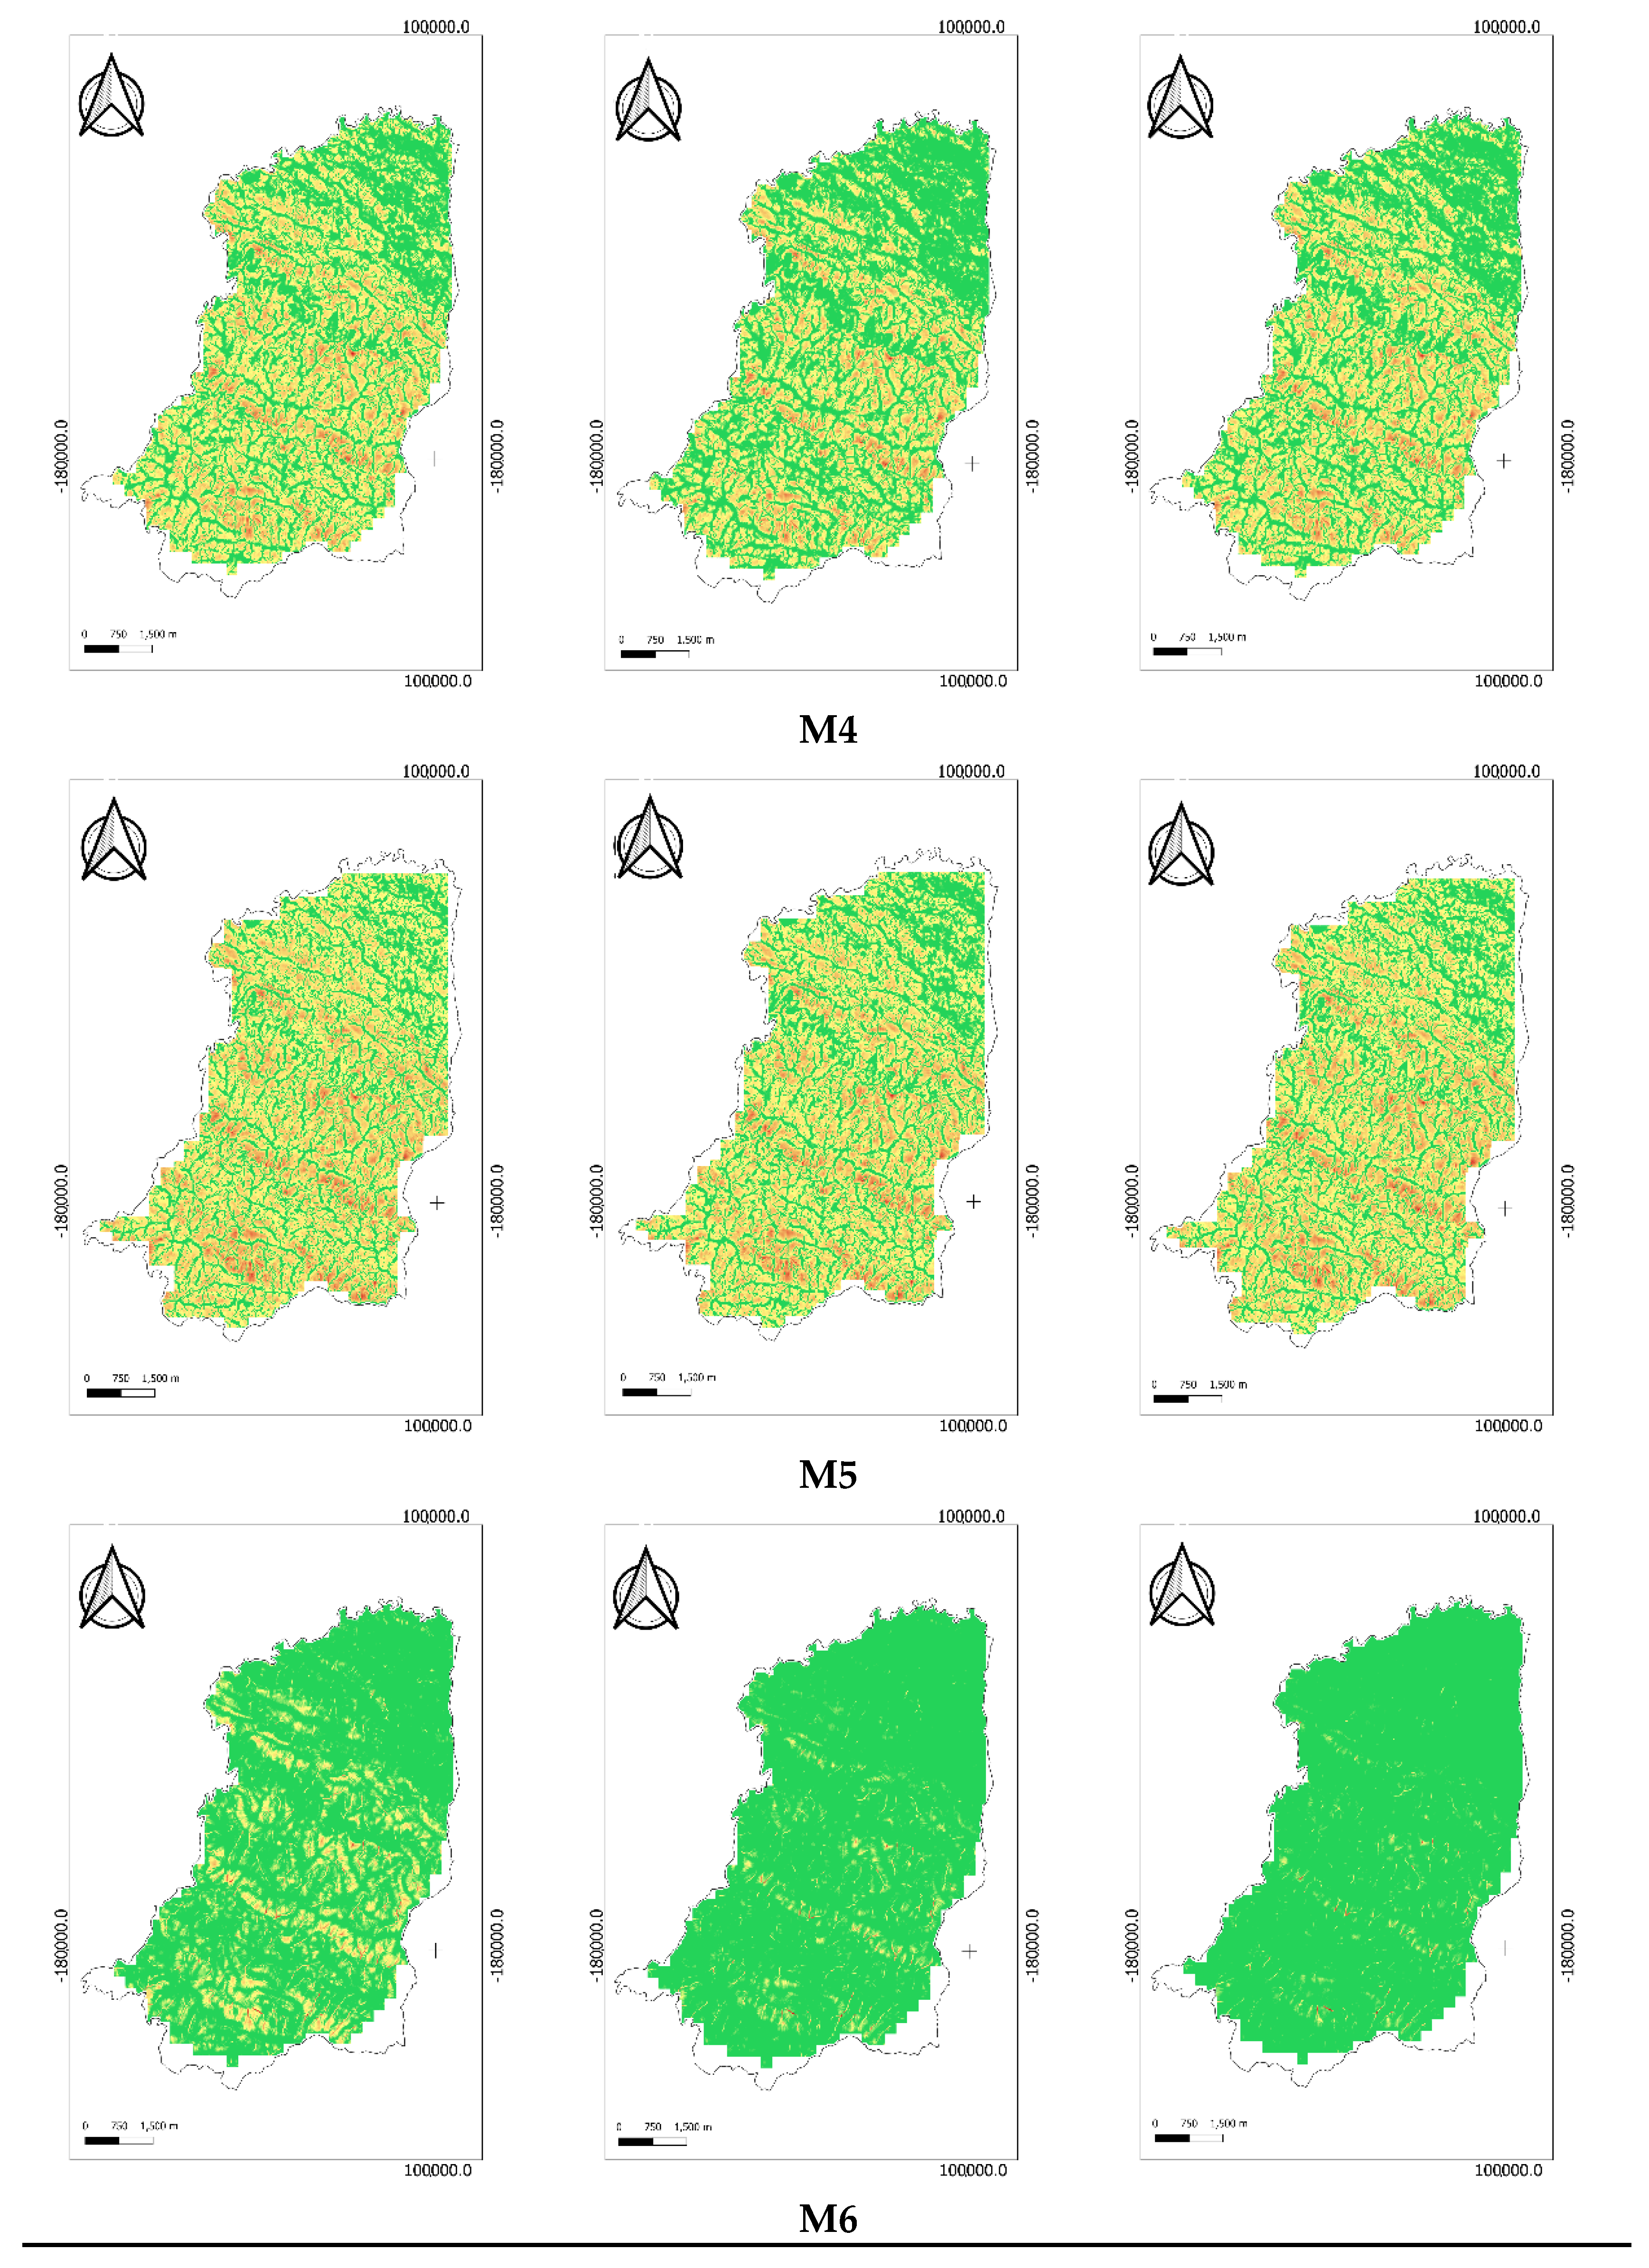
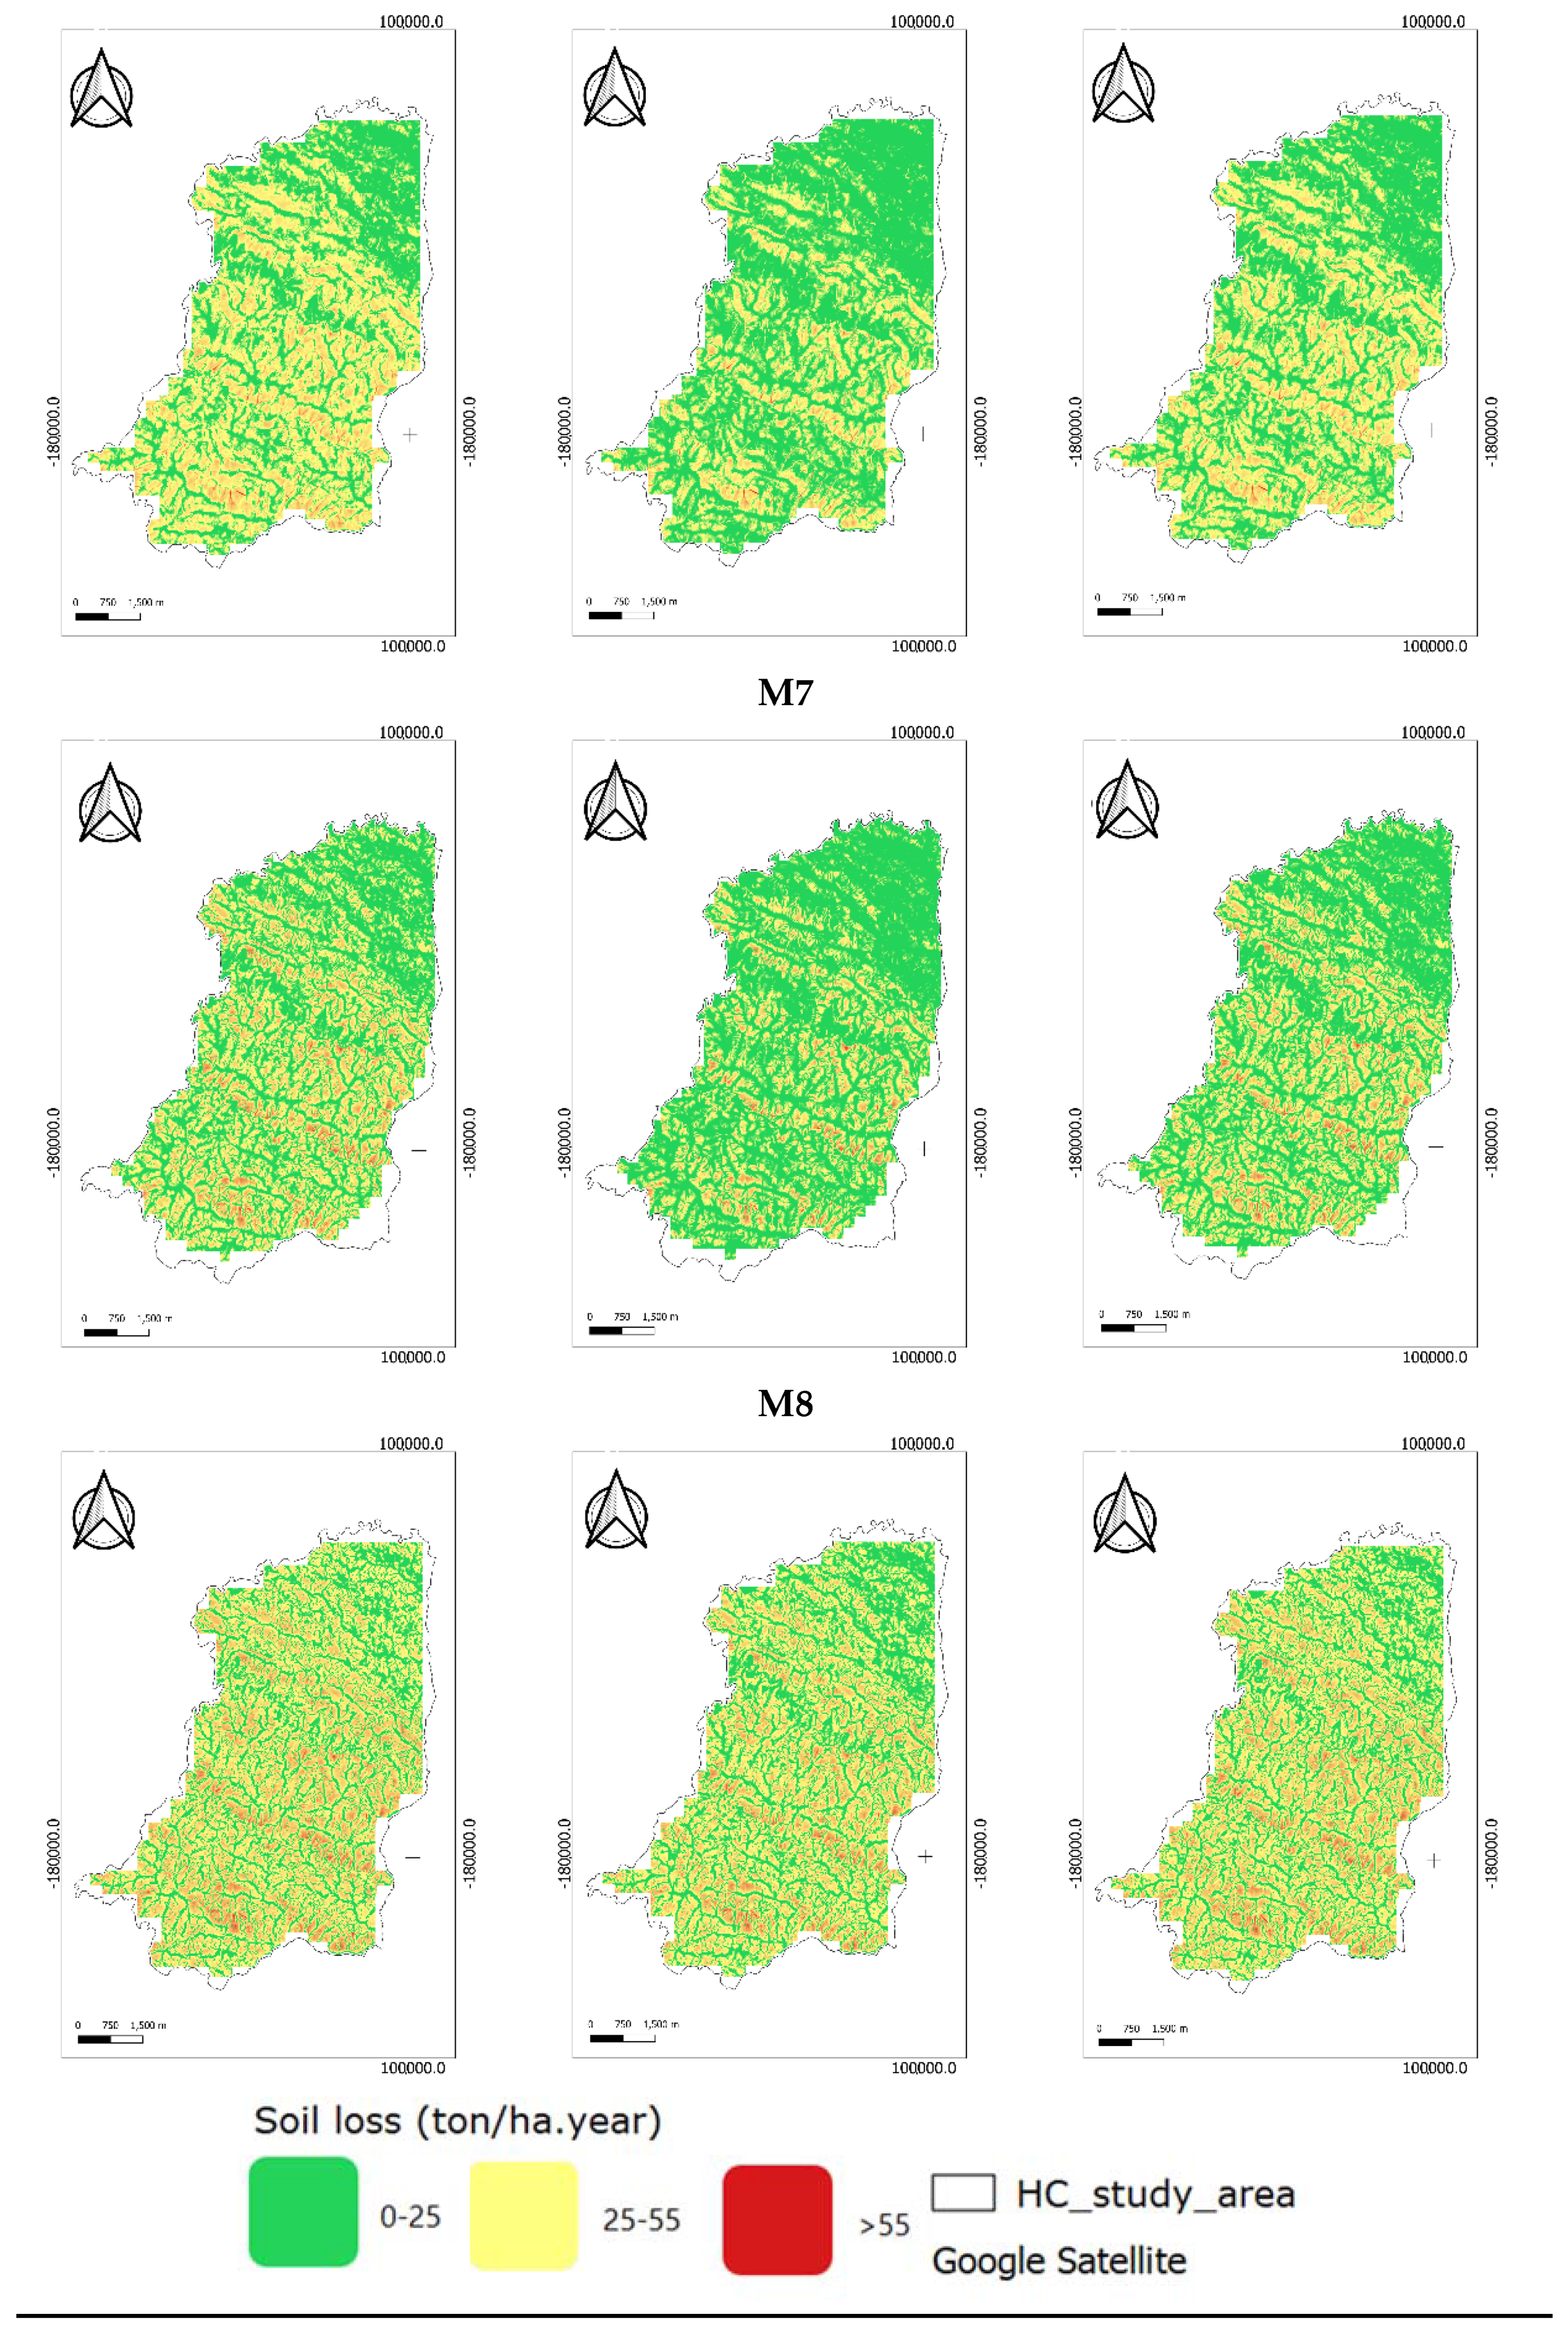
Figure 3 and
Figure 4 illustrate the spatial distribution of the potential soil erosion risk map of Montalegre municipality and Alentejo region, respectively. The annual average soil loss was grouped in three categories: 0–25 (green), 25–55 (yellow) and >55 (red) (ton/ha·year). The maps were created using different combinations between eight methodologies. Additionally, different P values were assigned (1, 0.8, and 0.6). Overall, in the Montalegre municipality, which is characterized as a rainy and sloped region, the category >55 (ton/ha·year) was mainly observed in the Southwest zone of the municipality in all maps of soil erosion rate for all the methodologies, emphasized by the M5 and M6 methodology. This result is expected since these zones are influenced by higher slopes, and areas with high slope values are related to a high level of erosion [
30]. The category with less soil erosion, 0–25 (ton/ha·year), mostly covered the Northeast zone of Montalegre. This was also verified in all the methodologies.
In the Alentejo region, a region with smother slopes when compared to Montalegre, the soil erosion rates were mostly identified in the South/center zone of the area. In methodologies M5, M6 and M7, the area with moderate/high erosion risk is not as evident. In the remaining methodologies, the spatial distribution of the soil erosion rates is similar. As can be observed from
Figure 4 and
Figure 5, the spatial variations in length-slope factors by the different methodologies applied have significant effects on the total erosion estimation.
Table 4 presents the statistical values estimated from the percentage of area, such as average, standard deviation, minimum value, maximum value, and confidence interval, regarding the two different regions.
Considering the average of all tested methodologies, the soil loss in the Montalegre region is 27,830 (33.8 ± 4.8) ton/ha·year, where 33.8% of soil losses occur in the category of 25 to 55 ton/ha·year. In this region and according to all methodologies, between 42.9% (35,320 ha) and 58.3% (47,998 ha) of the total area are at high risk of erosion (>55 ton/ha·year). In Montalegre, the areas with the lowest risk of erosion (class 0 to 25 ton/ha·year) represent 11.3% (9303 ha) to 19.9% (16,384 ha).
Considering the Alentejo region, between 34.4% (1662 ha) and 49.8% (2405 ha) are considered to be in the low erosion risk areas. In the category of moderate soil erosion (25–55 ton/ha·year), 800 (16.6 ± 7.8) ton/ha·year is the amount of soil loss and 27.8% (1343 ha) to 54.8% (2647 ha) of the areas are at high risk of erosion.
Figure 5 presents the graphics generated with the percentage of area in each category in the two different regions (bars) and the average value for each category in the two regions, Montalegre (orange line) and Alentejo (grey line).
Regarding
Figure 3,
Figure 4 and
Figure 5 we considered for evaluation two approaches: (i) for each region, we evaluated the average value (area) in each category, in all methodologies and the methodologies that are above or below the average value, to understand the most appropriate methodology to be used in each region; and (ii) considering both regions, we evaluated if the results present the same tendency/pattern.
Considering the overall tested methodology, in Montalegre (82,330 ha), 33.8% of the land surface was classified as having low soil erosion (0–25 ton/ha·year), 15.6% was classified as having a moderate soil erosion risk (25–55 ton/ha·year) and 50.6% of the area was classified as having high soil erosion risk (>55 ton/ha·year). In the first and in the second categories (
Figure 5a,b), is possible to verify that all the methodologies are above the average value, except for M5 and M6, indicating that these methodologies are more conservative, compared with M1, M2, M3, M4, M7 and M8. Considering the third category (
Figure 5c), where the erosion risk is higher, the opposite of the previous conclusion is observed; M5 and M6 are lower than the average value.
Considering the Alentejo region (4830 ha) and all methodologies, 42.1% of the areas have low soil erosion risk (0–25 ton/ha·year), 16.6% have moderate soil erosion risk (25–55 ton/ha·year) and 43.3% of the area was identified as having high soil erosion risk (>55 ton/ha·year). In the first category (
Figure 5a), M5 is above the average value, indicating that this is a more conservative methodology. Considering the second category (
Figure 5b), M5, M6 and M7 are above the average value, and in the third category (
Figure 5c) the opposite happens, where M5 is below the average, and M6 and M7 are in the line of the average value; the remaining methodologies are above.
Considering the relation between both regions, Montalegre and Alentejo, it is expected that the Alentejo region presents lower erosion values compared to Montalegre, a rainy region, especially in the third category. Considering this category, in M1, M3, M5 and M7, it is observed that its percentage of area in Alentejo is lower than in Montalegre. In the remaining methodologies, this does not happen. In these methodologies, the R values were obtained from the precipitation erosivity values available in the SNIAmb da Agência Portuguesa do Ambiente, I.P [
44] and estimated based on Wischemeier and Smith [
4]. The opposite is expected to be observed in the first category, where the percentage of areas are related to zones with lower soil erosion risk, meaning that Alentejo areas should be higher than Montalegre. Observing
Figure 5a, this hypothesis is confirmed again in the M1, M3, M5 and M7 methodologies. The same situation as before is observed in this category, meaning that the R value source can influence the results in the methodologies.
Regarding all methodologies, in both regions the behavior is similar, indicating that M5 and M6 methodologies are more conservative than the others. The referred methodologies are based on Moore and Wilson [
17] LS factor estimation.
The K factor, which expresses the susceptibility of a soil to erosion, is related to soil properties such as organic matter content, soil texture, soil structure and permeability and stone covers. The mean value of soil erodibility USLE-K factor in the water erosion area was calculated as 0.0321 with a standard deviation of 0.0107 [
46]. However, Mediterranean countries (Italy, Spain, Greece, and Portugal) have mean K factor values between 0.039 and 0.042 (ton·ha·h/ha·MJ·mm), which is higher than the mean erodibility in Europe [
47].
The obtained mean K value of water erosion areas in Montalegre was 0.032 and was concentrated in the range of 0.028–0.036 (from K values obtained from method seen in [
4]) and 0.020 in the range of 0.013–0.035 (from K values obtained from the JRC method). In the Alentejo region, the obtained mean K value was 0.039, which ranged between 0.029–0.039 according to K values obtained with Wishchmeier and Smith [
4], and the mean value 0.040 ranged between 0.034–0.047, according to the JRC method. In the Alentejo region, the K value is higher than in the Montalegre region.
Regarding the two methodologies for calculating the K factor, these present different behaviors of potential erosion according to the regions. The K factor based on JCR methodology, when compared to the Wischemeier and Smith [
4] methodology, presents higher values of potential erosion in the Alentejo region (lower slopes and less rainy), but more conservative erosion values in sloping and rainy regions (Montalegre).
This difference of K values among regions could be related to the incorporation of the protective effect of surface stone cover, which is usually not considered for soil erodibility calculations. The effect of stone covers in K-factor calculations is likely to result in an overestimation of soil erosion, particularly for Montalegre, where the highest percentages of surface stone cover were observed. Soil erodibility, together with management practices (P factor) and vegetation cover (C factor) can be influenced by agricultural practices. Therefore, the K factor estimation can provide important information for mitigation of soil erosion through the implementation of improved conservation practices (e.g., increase or preserve soil organic carbon in areas prone to high levels of soil erosion risk or adaption of soil management at areas of high risk) [
46].
Considering the question proposed in the objectives: which methodology is more appropriated to infer on soil erosion risk in a rainy mountainous (Montalegre) and in a dry and flat zones (Alentejo), within this work it is possible to conclude that the M1, M2, M3, M4 and M8 methodologies present very consistent values in all classes and in both regions. The maps resulting from M5 and M6 were very different from the previous group, with M7 in an intermediate situation.
5. Conclusions
The presented study provides an open-source GIS application, Erosion risk, developed to produce soil erosion maps implementing different methodologies and combinations of factors. The application was developed for QGIS software, using open-source programming language and libraries. The GIS application is free and respects open-source freedoms, providing the possibility to be improved and/or adapted to other methodologies. Four methodologies for the creation of the LS factor were implemented in the application and were tested using two regions with different characteristics: a rainy and mountainous region in the North of Portugal and a dry-flat region in the South of Portugal. The combination with different sources of R and P values allows taking in consideration some scenarios providing options to policy makers for managing soil erosion issues most efficiently for prioritization of regions with different characteristics. The erosion soil maps created allowed us to assess soil loss through the implementation of different methodologies that combined different factors of the RUSLE equation.
In the future, new functionalities will be incorporated in the open-source GIS application, such as: (i) tools that allow the user to dynamically create the maps involved and perform comparisons at the moment of the creation; (ii) new methods for R, K, and LS factors will be added to each page; and (iii) statistical functionalities will also be added to compare, for instance, areas using statistical measures such as average, standard deviation and confidence interval, as performed in this work. After the validation and testing of these methodologies regarding other situations, a web GIS application was developed by the authors and these methodologies will be incorporated in the web GIS application, in order to reach more users.
To conclude, further research in the area of soil erosion estimation (with particular focus on the existent LS estimation methods) using GIS is required.


