Abstract
Urbanization is the development trend of all countries in the world, but it has caused considerable ecological problems that need to be alleviated by building ecological security patterns. This study took Ningbo as an example to construct and optimize an ecological security pattern. We analyzed land use types, normalized difference vegetation index, and landscape connectivity for ecological sources selection. In constructing the resistance surface, we considered natural and socio-economic factors. On this basis, we identified ecological corridors based on a minimum cumulative resistance model. Finally, the ecological security pattern was optimized through space syntax. Results showed that Ningbo has 18 ecological sources, with an area of 3051.27 km2 and 29 ecological corridors, with a length of 1172.18 km. Among them, 11 are first-level, 10 are second-level, and 8 are third-level corridors. After optimization, the area and protection cost of the ecological security pattern were significantly reduced, which can effectively alleviate the trade-off between ecological protection and economic development. This research can provide a reference for the construction and optimization of ecological security patterns and has reference significance for ecological protection in rapidly urbanized areas.
1. Introduction
The “New Urban Agenda”, on 20 October 2016, pointed out that the world’s urban population is expected to nearly double by the middle of this century [1], and China will account for 35% of this increase [2]. Hence, four-fifths of people will live in cities and towns, and urbanization is an inevitable choice for countries globally to achieve economic growth in the 21st century [3,4,5]. However, the increasingly intense high-intensity human activities have caused problems, such as the fragmentation of habitats, the loss of biodiversity, and the decline of ecosystem service supply capabilities. These problems have severely restricted the sustainable development of the region [6,7,8,9]. The Millennium Ecosystem Assessment (MEA) was proposed to promote the protection and sustainable use of ecosystems [10]. Therefore, improving the quality of the ecological environment has become an important demand for balancing rapid urbanization and ecological protection [11,12,13].
Nature-based solution (NbS) is a new term in environmental research and policy practice [14]. NbS advocates understanding the process of natural systems that benefit mankind through the link between the ecosystem structure and process functions and its direct or indirect human welfare and profit gains and losses [15]. In addition, NbS pays attention to multiple goals, such as economy, ecology, and environment, takes ecological protection as a prerequisite, and takes maintenance of biodiversity and ecosystem services as a basic task to formulate a long-term stable plan [16]. The ecological security pattern (ESP) follows the guiding concept of NbS. That is, ESP forms a protection network by identifying points, lines, and areas with key ecological functions to maintain regional ecological security [17,18]. At present, ESP is one of the three major strategies for the development and protection of China’s land space [19]. Moreover, ESP is beneficial to optimize the ecological spatial pattern and promote the construction of ecological civilization [20,21,22].
In recent years, scholars in different fields all over the world have studied the ecological security patterns and related issues in different regions [23,24,25]. Radosław Korneć conducted a research using Poland as an example. Starting from the human understanding of ecological security, the study took the residents of the city center of the largest city as the research object, determined the main factors affecting the ecological security of Poland and put forward suggestions for the sustainable development of cities [26]. Russian scholar N.V Solovjova used two methods to predict ecological risks and put forward effective methods to maintain the ecological security and achieve sustainable development of coastal cities [27]. Gong and colleagues predicted the ecological security of Guangzhou through cellular automata, and proposed a series of urban plans for Guangzhou, such as the overall development plan, which effectively promoted the urbanization of Guangzhou [28]. Urban ecological security issues affect the urban life style, the combination of regional sustainable development planning and ecological security still need further research [25,29]. Up to now, “selection of ecological sources-construction of ecological resistance surfaces-extraction of ecological corridors” has become the basic paradigm for the construction of ESP [30]. Among them, as key ecological patches, the ecological source area can not only promote the ecological process but also maintain the integrity and stability of the ecosystem [31]. In addition, this ecological source area plays a crucial part in maintaining regional ecological security [17]. As the size, type, shape, and distribution of ecological sources affect their ecological functions, the multi-index system is often used to extract ecological sources [32]. The ecological resistance surface reflects the resistance of species migration and energy flow, which has an important impact on species diversity and complexity [33]. Usually, the land use type is used as the dominant factor, and other factors are combined to construct a resistance surface [34,35,36]. Ecological corridors are the structural basis for species migration and energy flow in ecological networks (EN) [37,38] and represent the possible areas for organisms to move from one ecological source to another [39]. Ecological corridors play an important role in enhancing the links between ecological sources [22]. The identification of the direction and width of ecological corridors has always been a key issue in the extraction of these ecological corridors. In direction identification, methods, such as the minimum cumulative resistance (MCR) model [40,41] and circuit theory [42], are usually used. With the application of computer algorithms, such as ant colony algorithm [17] and wavelet transform [43] in ESP, the problem of corridor width identification has been effectively solved.
At present, the technical methods for constructing ESP are relatively mature, but how to optimize the constructed ESP still needs in-depth research. Existing studies mostly used the gravity model for hierarchical optimization [44,45,46], but this model takes a long time to calculate and lacks automation tools [47], so the analysis efficiency is low. From the overall spatial accessibility and relevance, the space syntax abstracts the connections between spaces as axes and then carries out topological analysis on axes according to the basic principles of graph theory, such as global integration and choice. Finally, a series of morphological analysis variables are derived as the basis for spatial optimization [48]. The space syntax has the advantages of fast operation, simple indicators, clear topological relationships, and others, which is an effective tool for optimizing the ESP [49,50].
China has experienced rapid industrialization and urbanization since the reform and opening up, and its urbanization rate has exceeded 60% in 2019. Environmental pollution and ecosystem destruction caused by urban expansion have seriously threatened regional sustainable development and ecological civilization construction. Constructing ESP is an important measure for ecological civilization. Ningbo is the economic center and chemical industry base in the southern wing of the Yangtze River Delta, and one of the economic centers of Zhejiang Province. In the process of urban development and construction, the environment has been damaged. Moreover, the resource environmental bearing capacity has declined, thereby directly affecting the sustainable development of the regional economy and ecology. This study took Ningbo City as the research area and constructed an ESP through the MCR model. On this basis, the space syntax was used to optimize the ESP. This research can provide a basis for the formulation of ecological protection policies in Ningbo and provide a reference for the hierarchical optimization of ESP globally, which is of great significance to regional sustainable development.
2. Study Area and Data Sources
2.1. Overview of the Study Area
The research area selected for this study is Ningbo, China (Figure 1). Ningbo is located in the middle section of the Chinese coastline (120°55′ 122°16′ E, 28°51′ 30°33′ N). Ningbo is an important chemical base in the Yangtze River Delta and one of the important economic centers of Zhejiang Province. The total land area is 9816 km2, and the total sea area is 8355.8 km2. Ningbo has a registered population of 6.03 million and an urbanization rate of 72.9%. This area is located in a plain, and the terrain is high in the southwest and low in the northeast. The main landforms include mountains, hills, basins, and plains. The latitude is moderate, the climate is mild and humid, and the four seasons are distinct. Then, the multi-year average temperature is 16.4 °C, and the multi-year average precipitation is 1480 mm. In addition, the vegetation in the city has little difference between north and south but has an evident difference between east and west. As the altitude changes, coniferous forests, broad-leaved forests, cultivated plants, and coastal plants are distributed from west to east. As an important port city on the southeast coast of China, Ningbo’s development prospects are good. How to protect regional ecological security while achieving economic development has also become an urgent problem to be solved in its development process.
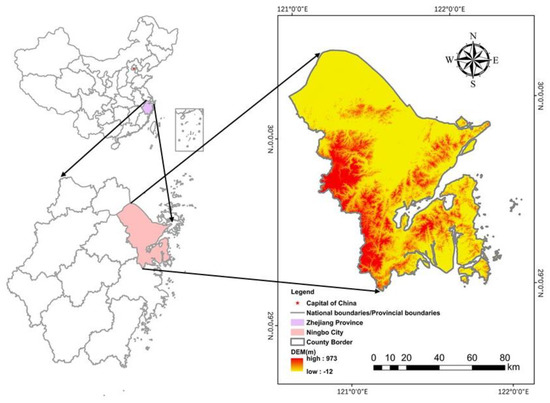
Figure 1.
Geographical location and land use status of Ningbo.
2.2. Data Source
The data used in this study include land use data, normalized difference vegetation index (NDVI), elevation, and slope of Ningbo City in 2015. Among them, the resolution of land use data is 30 m, and the GDP data and land use data are obtained from the Resource and Environmental Science and Data Center of the Chinese Academy of Sciences (http://www.resdc.cn/, 2015, accessed on 10 March 2021). Then, the elevation and NDVI data are from the Geospatial Data Cloud (https://www.gscloud.cn/, 2015, accessed on 10 March 2021), and the resolution is 100 and 30 m, respectively. Based on ArcGIS 10.3, we extracted the distance from the water area, rural residential areas, and other built-up lands, such as factories and mines.
3. Method
This research focuses on the construction and optimization of the ESP and mainly includes the following steps: (1) extraction of ecological sources. Based on the land use type, forests, grasslands and water areas were extracted as alternative land types for ecological sources. Then, we extracted forest and grassland with a NDVI greater than 0.80. Finally, we used the Conefor2.6 software to analyze landscape connectivity and extracted the ecological sources. (2) Construction of ecological resistance surface. We considered natural and man-made interference factors and selected impact factors to construct the resistance surface. (3) Ecological corridors extraction and pattern optimization. The MCR model was used to determine the corridors, and the space syntax was used to judge the priority of the corridor and optimize the ESP. The technical route is shown in Figure 2.
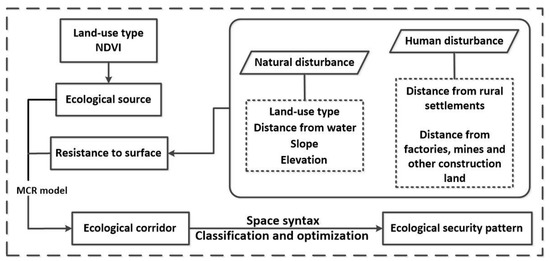
Figure 2.
Technical route.
3.1. Determination of the Source
This study uses the Integral Index of Connectivity (IIC) and Connectivity Probability (PC) to judge the connectivity between the spatial structural units of the landscape. Saura and Pascual-Hortal were the first to introduce PC in 2007 and interpreted PC as the probability of habitat availability, the probability of spread between patches, and the direct discrete probability of graph structure [51]. This study used Conefor2.6 for connectivity analysis. When calculating landscape connectivity, the thresholds of the IIC and PC were both set to 500 m, and the PC was set to 0.5.
where IIC represents the integral index of connectivity, PC represents the probability of connectivity, i and j represent different ecological patches, m refers to the total number of ecological patches (source points) in the landscape, and are patches i and j, is the number of connections between patches i and j, is the largest landscape attribute, and refers to the maximum product probability of all paths between source points i and j [21,52].
3.2. Resistance Surface Construction
The resistance surface reflects the resistance of information transfer and energy flow and has an important impact on species diversity and complexity [33]. Many index selection methods exist for constructing the resistance surface [12,34,35,36,53]. This study referred to previous research methods [24,54] and selected man-made and natural interference factors as the impact factors to construct the resistance surface. Among them, the land use type was the dominant factor, and other resistance factors were used as correction factors. Table 1 shows the resistance values and weights.

Table 1.
Resistance value.
3.3. Preliminary Determination of the Corridor
The traditional method for determining the corridors is to use the MCR model. This study realizes this model through the cost distance and cost path in ArcGIS 10.3. The cost distance reflects the resistance value from one point to another, whereas the cost path reflects the MCR from one point to another [52]. The formula of the MCR model is as follows:
where MCR is the MCR, represents a positive correlation between the resistance from any point in the space and any other point, i and j represent different ecological source points, and represents ecological source point i. The distance from the ecological source point j, represents the land resistance coefficient during the movement of i [38].
3.4. Corridor Classification Based on the Space Syntax
The basis of the spatial syntax analysis is to reflect the relative accessibility of different places in a city or region by measuring the different characteristics of the network. This analysis can be carried out on the axis diagram or part of the map [55]. Using the spatial syntax to measure the accessibility of different corridors in the urban spatial network can help to determine the difference between different corridors [56]. In this study, we used ArcGIS 10.3 to create polyline elements. On the basis of Section 3.3, the inflection point of each corridor was used as a discontinuity point, and the preliminary corridor was determined. A single corridor was divided into multiple axes to construct the axis diagram of the corridor. The Depthmap software was used to analyze the global integration and choice of the axis diagram. According to the global integration and selectivity values, the corridors are prioritized, as shown in the following Table 2.

Table 2.
Corridor priority.
3.5. Buffers Construction
To compare the effects of grading and optimization of corridors before optimization, we referred to previous research [17] and established buffers with a radius of 900 m with the corridor as the center to determine the spatial range of the corridors.
4. Results
4.1. Determination of the Source
By calculating landscape connectivity, 18 patches with IIC > 0.5, PC > 0.5, and patch area greater than 20 km2 are obtained. In addition, the geometric center of each patch is extracted as the ecological source point, as shown in Figure 3. The total patch area is 3051.27 km2, accounting for 31.08% of the total land area in the study area. Among the 18 selected patches, the largest IIC reaches 94.30, and the largest PC reaches 92.58. Ecological patches are mainly distributed in Yuyao City, Fenghua District, Ninghai County, Beilun District, and Ivory County. This distribution is related to the vegetation coverage, climate, and water resources conditions in each region. The analysis results show the following: (1) the main types of ecological sources in the study area are forest land and water area; (2) the cultivated land in the study area is less distributed, the cultivated land is scattered, and the landscape is more fragmented; (3) the distribution area of grassland and unused land is relatively independent and does not have high ecological resource potential.
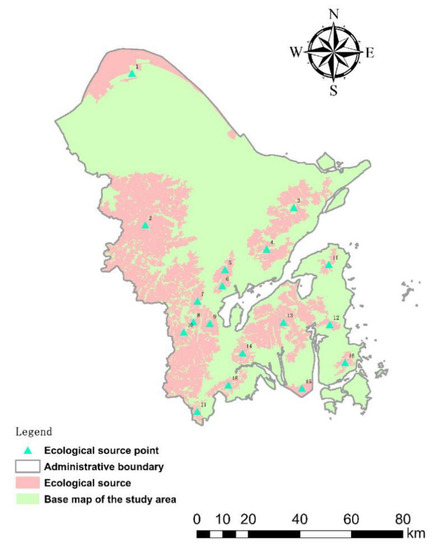
Figure 3.
Ecological source.
4.2. Resistance Surface
According to the method described above, the final resistance surface is determined as shown in Figure 4. Higher resistance values are mainly distributed in the northeast and central north of the study area, involving Cixi City and Zhenhai District. More built-up land weakens the connectivity of the landscape and hinders the migration of species. The high resistance value in the north hinders the reproduction of species and the normal progress of ecological processes.
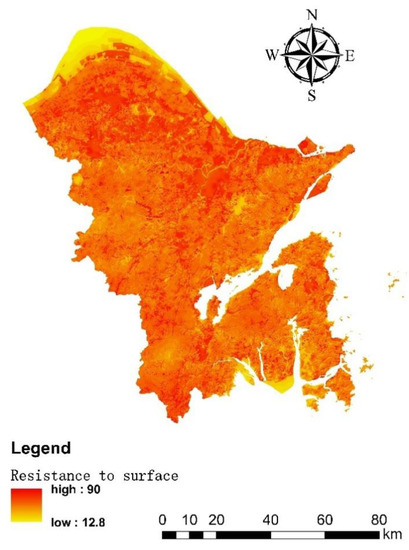
Figure 4.
Resistance surface.
4.3. Preliminary Determination of the Corridor
Based on the MCR model, a total of 153 corridors are extracted. As shown in Figure 5, the longest corridor is 160.96 km, and the shortest corridor is 5.47 km. Most of the ecological corridors are distributed in the middle and south of the study area, involving Fenghua District, Ninghai County, Xiangshan County, and Beilun District. The ecology in the north is more fragile than that in the south, and the corridors are less distributed. The main types of land used in the areas where the corridor passes are woodland, grassland, and water bodies. The preliminarily determined corridors overlap more, and the spatial structure is complicated, making accurately guiding the ecological construction of the study area difficult. In addition, the construction of considerable redundant corridors tends to increase construction costs and has a limited effect on improving landscape connectivity. This case will exacerbate the contradiction between ecological protection and economic development. Therefore, optimizing the initially constructed corridors is necessary.
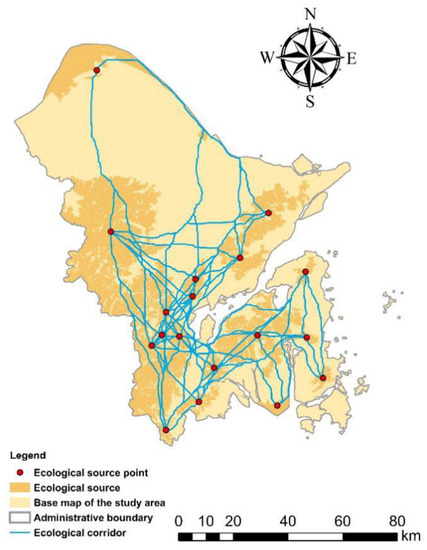
Figure 5.
Preliminary corridor.
4.4. Corridor Classification Based on the Space Syntax
Based on the corridor constructed in Section 4.3, the axis diagram has a total of 239 axes, and Figure 6 depicts the calculated overall integration and selectivity statistics. Among them, in Figure 7, as the color of the overall integration becomes more purple-red, the overall integration is lower. Moreover, as the the color becomes more blue, the overall integration is higher. Then, as the color of the choice becomes more inclined to pink, the choice is lower. Finally, as the color becomes more inclined to fuchsia, the choice is higher. After removing the repeated ecological corridors, a total of 68 corridors are obtained. The graded axis is compared with the corridors determined by the least cumulative resistance model to determine the grade of the ecological corridors. Among them, 14 are first-level, 30 are second-level, and 24 are third-level corridors, as shown in Figure 8. The first-level corridors are regarded as the key protected corridors, and the second and third-level corridors are followed. According to this principle, the corridors are screened, and the final ESP is determined as shown in Figure 8. There are 29 ecological corridors exist. Among them, 11 are first-level, 10 are second-level, and 8 are third-level corridors, with a total length of 1172.18 km.
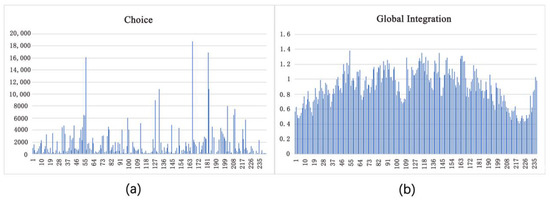
Figure 6.
Column chart of global integration and choice: (a) axis choice; (b) axis global integration.
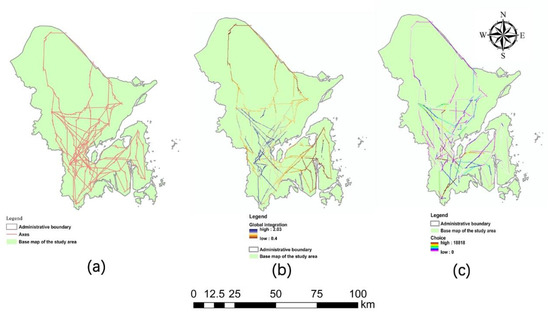
Figure 7.
Spatial layout of global integration and choice: (a) axis of the figure; (b) the global integration spatial distribution of the axis; (c) spatial distribution of axis choice.
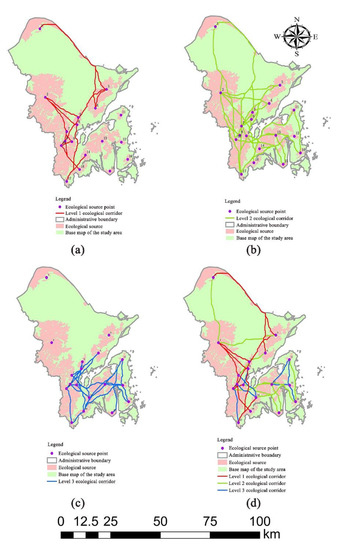
Figure 8.
Ecological security pattern of Ningbo City: (a) primary level 1 ecological corridor; (b) primary level 2 ecological corridor; (c) primary level 3 ecological corridor; (d) optimized ecological security pattern.
5. Discussion
5.1. Advantages of the Method
With the rapid expansion of cities, the ecosystems have been disturbed by human activities, resulting in the decline in ecosystem service supply capacity and the loss of biodiversity [57,58,59]. In addition to providing residents with a high-quality life, cities must also be able to withstand pressure from humans and nature, including dealing with challenges, such as water security, climate change, disaster risks, and economic and social development. To protect the environment and improve human well-being, a landscape-scale protection plan for natural habitat protection and species migration must be formulated [60].
NbS uses services provided by ecosystems, among others, to address social challenges, such as climate change, like global warming or natural disasters, like mudslides [15]. The International Union for Conservation of Nature defines NbS as “The actions to protect and sustainably manage the natural ecology, and restore the natural ecology or improve the ecosystem, so as to effectively and adapt to local conditions to respond to social challenges, while providing human well-being and biodiversity benefits [61].” As a green and sustainable development concept and a solution to contemporary social challenges, NbS has a wide range of applications in the construction and development of cities. NbS can fully explore and exert the value of city’s natural capital, innovate the sustainable development pattern of the city, and realize the ecological, social, and economic coordinated development. With the continuous acceleration of urbanization and the increase efforts in the construction of ecological civilization, various studies, such as “based on nature”, “adapted to nature”, and “utilization of nature”, have received increasing attention. Many world organizations, countries, and cities use the NbS concept in basic research and ecological protection and restoration practices. The emergence of various innovative cities, such as “green cities”, “sustainable cities”, and “low-carbon cities”, developing into “sponge cities”, “resilient cities”, and others, are essentially the NbS concept in urban construction innovative applications.
Green Infrastructure (GI) [62,63], EN [64,65], ESP [12,66], and other ecological protection planning methods take NbS as the guiding concept. Moreover, elements that are critical to regional ecological security (e.g., hubs or sources, links or corridors) are identified and protected to ensure the sustainable supply of regional ecosystem services. Among them, the concepts of GI and EN are widely used in international landscape planning and protection, and the concept of ESP is more common in China [26]. The ESP of different scales is one of the three strategies for the development and protection of China’s territorial space [19]. Moreover, ESP plays an important role in solving the problem of ecological protection in rapidly urbanizing areas.
This study took Ningbo City as the research area to construct and optimize the ESP. We adopted a comprehensive index method in selecting ecological sources and constructing ecological resistance surfaces. This method comprehensively considers factors, such as land use types, topography, and landscape connectivity, and is the basis for constructing an ESP. After extracting the ecological corridor through MCR, this study optimized the ecological corridors based on the space syntax. The relevant parameters of this model fully reflect the mutual influence and role of different nodes in the network. These parameters can also explore the internal laws of the space from the user’s perspective to identify corridor paths based on attractiveness and accessibility. The results showed that 153 ecological corridors were optimized, with a length of 3092.23 km, an area of 5788.65 km2, and a total protection cost of 19,280 million yuan, mainly passing through Fenghua District and Ninghai County, presenting a “spider web” layout. After optimization, 29 ecological corridors were obtained with a length of 1172.18 km, an area of 2245.70 km2, and a total protection cost of 108.015 billion yuan. Compared with the unoptimized ecological corridors, ecological corridors present an “octopus-like” layout, and the total area and protection cost are reduced. The optimized ecological corridors can still meet the needs of maintaining the connectivity of the landscape while reducing the area and protection costs, which helps to ease the trade-off between local urbanization and ecological civilization construction. This study continues the comprehensive index method to construct the ESP and expands the application of space syntax in natural network evaluation. This study also provides ideas for optimizing the ESP, improving the efficiency of ecological protection, and promoting the coordinated development of the economy and ecology.
5.2. Layout Optimization
This research optimized and classified the ecological corridors through the space syntax and determined the final ESP. We proposed an ecological framework composed of ecological corridors and ecological landscapes of “one axis, three centers, and three belts”, which is a landscaped, structured, systematic, functional, and integrated regional ecological security network system. As shown in Figure 9, the “one axis” starts from Lianghuang Mountain in the south to Jiufeng Mountain in the north, and spreads in the east-west direction. The main land type is woodland. As a central hub connecting other sources and corridors, the “one axis” supports the overall ESP; “three centers” is a biodiversity and water conservation protection area centered on Siming Mountain National Forest Park, Xikou Scenic Area, Lilongtan Forest Park, and Sanxin plays an important role in the protection of surrounding biodiversity and water resources. With the “one axis” as the center, three ecological resource protection belts are distributed, involving the Huangxian Forest Tourist Area. As an important protection belt connecting the “one axis” and the “three centers”, “three belts” serve as the hub axis belt for the layout of the regional ESP. They are playing an important role in connecting the overall situation.
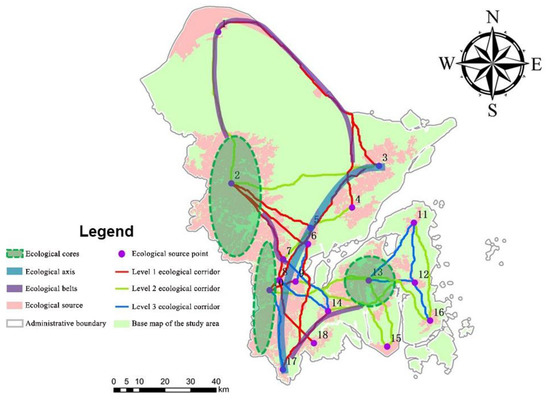
Figure 9.
The optimization pattern of “one axis, three centers, and three belts”.
5.3. Research Limitations
From the perspective of landscape planning and management, this study took Ningbo as an example to construct and optimize the ESP through a comprehensive index method, MCR, and space syntax. However, this research has the following limitations in theory and practice: first, this article only identifies the direction of the ecological corridor, and determines its spatial scope by establishing a buffer zone. In future studies, the spatial scope of corridors can be identified in accordance with local conditions by constructing a comprehensive evaluation system, threshold discrimination, and other methods. Second, this article uses MCR to identify ecological corridors from the overall regional perspective and lacks consideration of spatial scale and species types. Future studies can verify the scale sensitivity and species applicability of the model through empirical verification and field sampling, which can enhance the practical value of the research results.
6. Conclusions
Based on the use of the traditional MCR model to construct an ESP, this study considers the construction of resistance surfaces from multiple angles. In addition, the study uses spatial syntax to classify the corridors and divides the corridors into first, second, and third levels. After grading and optimization, the extracted ecological corridors were cost of 1080.15 billion yuan to protect. Compared with the before optimization, the area is reduced by 61.80%, and the total protection cost is reduced by 45.80%. This case significantly reduces the area and protection costs for building an ecological safety pattern. On the basis of ensuring ecological safety, the area and economic expenditure have been achieved and minimized. This research is a good practice of the NbS concept in the construction of China’s ecological civilization, enriches the application cases of the NbS concept in China, and provides Chinese experience for ecological protection in the process of urbanization in the world.
Author Contributions
Conceptualization, Y.H.; Methodology, Y.H. and C.Y.; Validation, Y.H., Z.F., H.D., C.H., and K.W.; Writing—original draft, Y.H. and C.Y. All authors have read and agreed to the published version of the manuscript.
Funding
This research was financially supported by the National Natural Science Foundation of China (No. 41901261), the Fundamental Research Funds for the Central Universities of China (35832020024) and China University of Geosciences (Beijing) University Student Innovation and Entrepreneurship Training Program (A509).
Institutional Review Board Statement
Not applicable.
Informed Consent Statement
Not applicable.
Data Availability Statement
Not applicable.
Acknowledgments
Thank you to everyone who contributed to this study.
Conflicts of Interest
The authors declare no conflict of interest.
References
- Caprotti, F.; Cowley, R.; Datta, A.; Broto, V.C.; Gao, E.; Georgeson, L.; Herrick, C.; Odendaal, N.; Joss, S. The New Urban Agenda: Key opportunities and challenges for policy and practice. Urban Res. Pract. 2017, 10, 367–378. [Google Scholar] [CrossRef]
- Meng, L.; Sun, Y.; Zhao, S. Comparing the spatial and temporal dynamics of urban expansion in Guangzhou and Shenzhen from 1975 to 2015: A case study of pioneer cities in China’s rapid urbanization. Land Use Policy 2020, 97, 104753. [Google Scholar] [CrossRef]
- Li, F.; Ye, Y.; Song, B.; Wang, R. Evaluation of urban suitable ecological land based on the minimum cumulative resistance model: A case study from Changzhou, China. Ecol. Model. 2015, 318, 194–203. [Google Scholar] [CrossRef]
- Hodson, M.; Marvin, S. ‘Urban Ecological Security’: A New Urban Paradigm? Int. J. Urban Reg. Res. 2009, 33, 193–215. [Google Scholar] [CrossRef]
- Lonsdorf, E.V.; Nootenboom, C.; Janke, B.; Horgan, B.P. Assessing urban ecosystem services provided by green infrastructure: Golf courses in the Minneapolis-St. Paul metro area. Landsc. Urban Plan. 2021, 208, 104022. [Google Scholar] [CrossRef]
- He, C.; Liu, Z.; Tian, J.; Ma, Q. Urban expansion dynamics and natural habitat loss in China: A multiscale landscape perspective. Glob. Chang. Biol. 2014, 20, 2886–2902. [Google Scholar] [CrossRef] [PubMed]
- Adriaensen, F.; Chardon, J.P.; De Blust, G.; Swinnen, E.; Villalba, S.; Gulinck, H.; Matthysen, E. The application of ‘least-cost’ modelling as a functional landscape model. Landsc. Urban Plan. 2003, 64, 233–247. [Google Scholar] [CrossRef]
- Palliwoda, J.; Banzhaf, E.; Priess, J.A. How do the green components of urban green infrastructure influence the use of ecosystem services? Examples from Leipzig, Germany. Landsc. Ecol. 2020, 35, 1127–1142. [Google Scholar]
- Wolch, J.R.; Byrne, J.; Newell, J.P. Urban green space, public health, and environmental justice: The challenge of making cities ‘just green enough’. Landsc. Urban Plan. 2014, 125, 234–244. [Google Scholar] [CrossRef]
- Van der Biest, K.; Meire, P.; Schellekens, T.; D’hondt, B.; Bonte, D.; Vanagt, T.; Ysebaert, T. Aligning biodiversity conservation and ecosystem services in spatial planning: Focus on ecosystem processes. Sci. Total Environ. 2020, 712, 136350. [Google Scholar] [CrossRef]
- Zhang, L.; Peng, J.; Liu, Y.; Wu, J. Coupling ecosystem services supply and human ecological demand to identify landscape ecological security pattern: A case study in Beijing–Tianjin–Hebei region, China. Urban Ecosyst. 2017, 20, 701–714. [Google Scholar] [CrossRef]
- Jin, X.; Wei, L.; Wang, Y.; Lu, Y. Construction of ecological security pattern based on the importance of ecosystem service functions and ecological sensitivity assessment: A case study in Fengxian County of Jiangsu Province, China. Environ. Dev. Sustain. 2020, 23, 563–590. [Google Scholar] [CrossRef]
- Tu, Y.; Chen, B.; Yu, L.; Xin, Q.; Gong, P.; Xu, B. How does urban expansion interact with cropland loss? A comparison of 14 Chinese cities from 1980 to 2015. Landsc. Ecol. 2021, 36, 243–263. [Google Scholar] [CrossRef]
- Nesshöver, C.; Assmuth, T.; Irvine, K.N.; Rusch, G.M.; Waylen, K.A.; Delbaere, B.; Haase, D.; Jones-Walters, L.; Keune, H.; Kovacs, E.; et al. The science, policy and practice of nature-based solutions: An interdisciplinary perspective. Sci. Total Environ. 2017, 579, 1215–1227. [Google Scholar] [CrossRef] [PubMed]
- Turner, R.K.; Daily, G.C. The Ecosystem Services Framework and Natural Capital Conservation. Environ. Resour. Econ. 2008, 39, 25–35. [Google Scholar] [CrossRef]
- Cohen-Shacham, E.; Walters, G.; Janzen, C.; Maginnis, S. Nature-Based Solutions to Address Global Societal Challenges; IUCN: Gland, Switzerland, 2016; p. 97. [Google Scholar]
- Peng, J.; Zhao, S.; Dong, J.; Liu, Y.; Meersmans, J.; Li, H.; Wu, J. Applying ant colony algorithm to identify ecological security patterns in megacities. Environ. Model. Softw. 2019, 117, 214–222. [Google Scholar] [CrossRef]
- Balbi, M.; Petit, E.J.; Croci, S.; Nabucet, J.; Georges, R.; Madec, L.; Ernoult, A. Ecological relevance of least cost path analysis: An easy implementation method for landscape urban planning. J. Environ. Manag. 2019, 244, 61–68. [Google Scholar] [CrossRef] [PubMed]
- Fan, J. Theoretical innovation in optimization of protection and development of China’s territorial space and coping strategy of 13th Five-Year Plan. Bull. Chin. Acad. Sci. 2016, 31, 1–12. [Google Scholar]
- Huang, J.; Hu, Y.; Zheng, F. Research on recognition and protection of ecological security patterns based on circuit theory: A case study of Jinan City. Environ. Sci. Pollut. Res. 2020, 27, 12414–12427. [Google Scholar] [CrossRef]
- Li, S.; Xiao, W.; Zhao, Y.; Lv, X. Incorporating ecological risk index in the multi-process MCRE model to optimize the ecological security pattern in a semi-arid area with intensive coal mining: A case study in northern China. J. Clean. Prod. 2020, 247, 119143. [Google Scholar] [CrossRef]
- Wang, Y.; Pan, J. Building ecological security patterns based on ecosystem services value reconstruction in an arid inland basin: A case study in Ganzhou District, NW China. J. Clean. Prod. 2019, 241, 118337. [Google Scholar] [CrossRef]
- Liang, J.; He, X.; Zeng, G.; Zhong, M.; Gao, X.; Li, X.; Li, X.; Wu, H.; Feng, C.; Xing, W.; et al. Integrating priority areas and ecological corridors into national network for conservation planning in China. Sci. Total Environ. 2018, 626, 22–29. [Google Scholar] [CrossRef] [PubMed]
- Dai, L.; Liu, Y.; Luo, X. Integrating the MCR and DOI models to construct an ecological security network for the urban agglomeration around Poyang Lake, China. Sci. Total Environ. 2021, 754, 141868. [Google Scholar] [CrossRef] [PubMed]
- Fu, Y.; Shi, X.; He, J.; Yuan, Y.; Qu, L. Identification and optimization strategy of county ecological security pattern: A case study in the Loess Plateau, China. Ecol. Indic. 2020, 112, 106030. [Google Scholar] [CrossRef]
- Korneć, R. Ecological Security of Communities in Polish Cities. J. Hum. Secur. 2020, 16. [Google Scholar] [CrossRef]
- Solovjova, N.V. Synthesis of ecosystemic and ecoscreening modelling in solving problems of ecological safety. Ecol. Model. 1999, 124, 1–10. [Google Scholar] [CrossRef]
- Gong, J.Z.; Liu, Y.S.; Xia, B.C.; Zhao, G.W. Urban ecological security assessment and forecasting, based on a cellular automata model: A case study of Guangzhou, China. Ecol. Model. 2009, 220, 3612–3620. [Google Scholar] [CrossRef]
- Liu, D.; Chang, Q. Ecological security research progress in China. Acta Ecol. Sin. 2015, 35, 111–121. [Google Scholar] [CrossRef]
- Fu, B.; Liu, Y. The theories and methods for systematically understanding land resource. Chin. Sci. Bull. 2019, 64, 2172–2179. [Google Scholar]
- Peng, J.; Yang, Y.; Liu, Y.; Du, Y.; Meersmans, J.; Qiu, S. Linking ecosystem services and circuit theory to identify ecological security patterns. Sci. Total Environ. 2018, 644, 781–790. [Google Scholar] [CrossRef]
- Aminzadeh, B.; Khansefid, M. A case study of urban ecological networks and a sustainable city: Tehran’s metropolitan area. Urban Ecosyst. 2010, 13, 23–36. [Google Scholar] [CrossRef]
- Guo, R.; Wu, T.; Liu, M.; Huang, M.; Stendardo, L.; Zhang, Y. The construction and optimization of ecological security pattern in the Harbin-Changchun urban agglomeration, China. Int. J. Environ. Res. Public Health 2019, 16, 1190. [Google Scholar] [CrossRef]
- Zhao, X.Q.; Xu, X.H. Research on landscape ecological security pattern in a Eucalyptus introduced region based on biodiversity conservation. Russ. J. Ecol. 2015, 46, 59–70. [Google Scholar] [CrossRef]
- Fan, F.; Liu, Y.; Chen, J.; Dong, J. Scenario-based ecological security patterns to indicate landscape sustainability: A case study on the Qinghai-Tibet Plateau. Landsc. Ecol. 2020, 1–14. [Google Scholar] [CrossRef]
- Gao, J.; Du, F.; Zuo, L.; Jiang, Y. Integrating ecosystem services and rocky desertification into identification of karst ecological security pattern. Landsc. Ecol. 2020, 1–21. [Google Scholar] [CrossRef]
- Ferretti, V.; Pomarico, S. An integrated approach for studying the land suitability for ecological corridors through spatial multicriteria evaluations. Environ. Dev. Sustain. 2013, 15, 859–885. [Google Scholar] [CrossRef]
- Xu, W.; Wang, J.; Zhang, M.; Li, S. Construction of landscape ecological network based on landscape ecological risk assessment in a large-scale opencast coal mine area. J. Clean. Prod. 2021, 286, 125523. [Google Scholar] [CrossRef]
- Beier, P.; Noss, R.F. Do habitat corridors provide connectivity? Conserv. Biol. 1998, 12, 1241–1252. [Google Scholar] [CrossRef]
- Knaapen, J.P.; Scheffer, M.; Harms, B. Estimating habitat isolation in landscape planning. Landsc. Urban Plan. 1992, 23, 1–16. [Google Scholar] [CrossRef]
- Yu, K. Security patterns and surface model in landscape ecological planning. Landsc. Urban Plan. 1996, 36, 1–17. [Google Scholar] [CrossRef]
- McRae, B.H.; Beier, P. Circuit theory predicts gene flow in plant and animal populations. Proc. Natl. Acad. Sci. USA 2007, 104, 19885–19890. [Google Scholar] [CrossRef]
- Dong, J.; Peng, J.; Liu, Y.; Qiu, S.; Han, Y. Integrating spatial continuous wavelet transform and kernel density estimation to identify ecological corridors in megacities. Landsc. Urban Plan. 2020, 199, 103815. [Google Scholar] [CrossRef]
- Kong, F.; Yin, H.; Nakagoshi, N.; Zong, Y. Urban green space network development for biodiversity conservation: Identification based on graph theory and gravity modeling. Landsc. Urban Plan. 2010, 95, 16–27. [Google Scholar] [CrossRef]
- Zhao, S.M.; Ma, Y.F.; Wang, J.L.; You, X.Y. Landscape pattern analysis and ecological network planning of Tianjin City. Urban For. Urban Green. 2019, 46, 126479. [Google Scholar] [CrossRef]
- Xiao, S.; Wu, W.; Guo, J.; Ou, M.; Pueppke, S.G.; Ou, W.; Tao, Y. An evaluation framework for designing ecological security patterns and prioritizing ecological corridors: Application in Jiangsu Province, China. Landsc. Ecol. 2020, 35, 2517–2534. [Google Scholar] [CrossRef]
- Wanghe, K.; Guo, X.; Wang, M.; Zhuang, H.; Ahmad, S.; Khan, T.U.; Xiao, Y.; Luan, X.; Li, K. Gravity model toolbox: An automated and open-source ArcGIS tool to build and prioritize ecological corridors in urban landscapes. Glob. Ecol. Conserv. 2020, 22, e01012. [Google Scholar] [CrossRef]
- Hillier, B. Spatial sustainability in cities: Organic patterns and sustainable forms. In Proceedings of the 7th International Space Syntax Symposium, Stockholm, Sweden, 8–11 June 2009; Royal Institute of Technology (KTH): Stockholm, Sweden, 2009. [Google Scholar]
- Mahmoud, A.H.; Omar, R.H. Planting design for urban parks: Space syntax as a landscape design assessment tool. Front. Archit. Res. 2015, 4, 35–45. [Google Scholar] [CrossRef]
- Jeong, D.; Kim, M.; Song, K.; Lee, J. Planning a Green Infrastructure Network to Integrate Potential Evacuation Routes and the Urban Green Space in a Coastal City: The Case Study of Haeundae District, Busan, South Korea. Sci. Total Environ. 2021, 761, 143179. [Google Scholar] [CrossRef]
- Saura, S.; Pascual-Hortal, L. A new habitat availability index to integrate connectivity in landscape conservation planning: Comparison with existing indices and application to a case study. Landsc. Urban Plan. 2007, 83, 91–103. [Google Scholar] [CrossRef]
- Cui, L.; Wang, J.; Sun, L.; Lv, C. Construction and optimization of green space ecological networks in urban fringe areas: A case study with the urban fringe area of Tongzhou district in Beijing. J. Clean. Prod. 2020, 276, 124266. [Google Scholar] [CrossRef]
- Tong, H.-L.; Shi, P.-J. Using ecosystem service supply and ecosystem sensitivity to identify landscape ecology security patterns in the Lanzhou-Xining urban agglomeration, China. J. Mt. Sci. 2020, 17, 2758–2773. [Google Scholar] [CrossRef]
- Wang, C.; Yu, C.; Chen, T.; Feng, Z.; Hu, Y.; Wu, K. Can the establishment of ecological security patterns improve ecological protection? An example of Nanchang, China. Sci. Total Environ. 2020, 740, 140051. [Google Scholar] [CrossRef] [PubMed]
- Lebendiger, Y.; Lerman, Y. Applying space syntax for surface rapid transit planning. Transp. Res. Part A Policy Pract. 2019, 128, 59–72. [Google Scholar] [CrossRef]
- Tannous, H.O.; Major, M.D.; Furlan, R. Accessibility of green spaces in a metropolitan network using space syntax to objectively evaluate the spatial locations of parks and promenades in Doha, State of Qatar. Urban For. Urban Green. 2021, 58, 126892. [Google Scholar] [CrossRef]
- Skogen, K.; Helland, H.; Kaltenborn, B. Concern about climate change, biodiversity loss, habitat degradation and landscape change: Embedded in different packages of environmental concern? J. Nat. Conserv. 2018, 44, 12–20. [Google Scholar] [CrossRef]
- Grimm, N.B.; Faeth, S.H.; Golubiewski, N.E.; Redman, C.L.; Wu, J.; Bai, X.; Briggs, J.M. Global change and the ecology of cities. Science 2008, 319, 756–760. [Google Scholar] [CrossRef] [PubMed]
- Cen, X.; Wu, C.; Xing, X.; Fang, M.; Garang, Z.; Wu, Y. Coupling intensive land use and landscape ecological security for urban sustainability: An integrated socioeconomic data and spatial metrics analysis in Hangzhou city. Sustainability 2015, 7, 1459–1482. [Google Scholar] [CrossRef]
- Kukkala, A.S.; Moilanen, A. Ecosystem services and connectivity in spatial conservation prioritization. Landsc. Ecol. 2017, 32, 5–14. [Google Scholar] [CrossRef] [PubMed]
- de Jesús Arce-Mojica, T.; Nehren, U.; Sudmeier-Rieux, K.; Miranda, P.J.; Anhuf, D. Nature-based solutions (NbS) for reducing the risk of shallow landslides: Where do we stand? Int. J. Disaster Risk Reduct. 2019, 41, 101293. [Google Scholar] [CrossRef]
- García, A.M.; Santé, I.; Loureiro, X.; Miranda, D. Green infrastructure spatial planning considering ecosystem services assessment and trade-off analysis. Application at landscape scale in Galicia region (NW Spain). Ecosyst. Serv. 2020, 43, 101115. [Google Scholar] [CrossRef]
- Lanzas, M.; Hermoso, V.; de-Miguel, S.; Bota, G.; Brotons, L. Designing a network of green infrastructure to enhance the conservation value of protected areas and maintain ecosystem services. Sci. Total Environ. 2019, 651, 541–550. [Google Scholar] [CrossRef]
- Sahraoui, Y.; Leski, C.D.G.; Benot, M.L.; Revers, F.; Salles, D.; van Halder, I.; Barneix, M.; Carassou, L. Integrating ecological networks modelling in a participatory approach for assessing impacts of planning scenarios on landscape connectivity. Landsc. Urban Plan. 2021, 209, 104039. [Google Scholar] [CrossRef]
- Fath, B.D.; Scharler, U.M.; Ulanowicz, R.E.; Hannon, B. Ecological network analysis: Network construction. Ecol. Model. 2007, 208, 49–55. [Google Scholar] [CrossRef]
- Luo, Y.; Wu, J.; Wang, X.; Wang, Z.; Zhao, Y. Can policy maintain habitat connectivity under landscape fragmentation? A case study of Shenzhen, China. Sci. Total Environ. 2020, 715, 136829. [Google Scholar] [CrossRef] [PubMed]
Publisher’s Note: MDPI stays neutral with regard to jurisdictional claims in published maps and institutional affiliations. |
© 2021 by the authors. Licensee MDPI, Basel, Switzerland. This article is an open access article distributed under the terms and conditions of the Creative Commons Attribution (CC BY) license (https://creativecommons.org/licenses/by/4.0/).