
MAES_GR: A Web-Based, Spatially Enabled Field Survey Platform for the MAES Implementation in Greece

 ,
,  , ,
, ,  and
and 
Abstract
1. Introduction
2. Materials and Methods
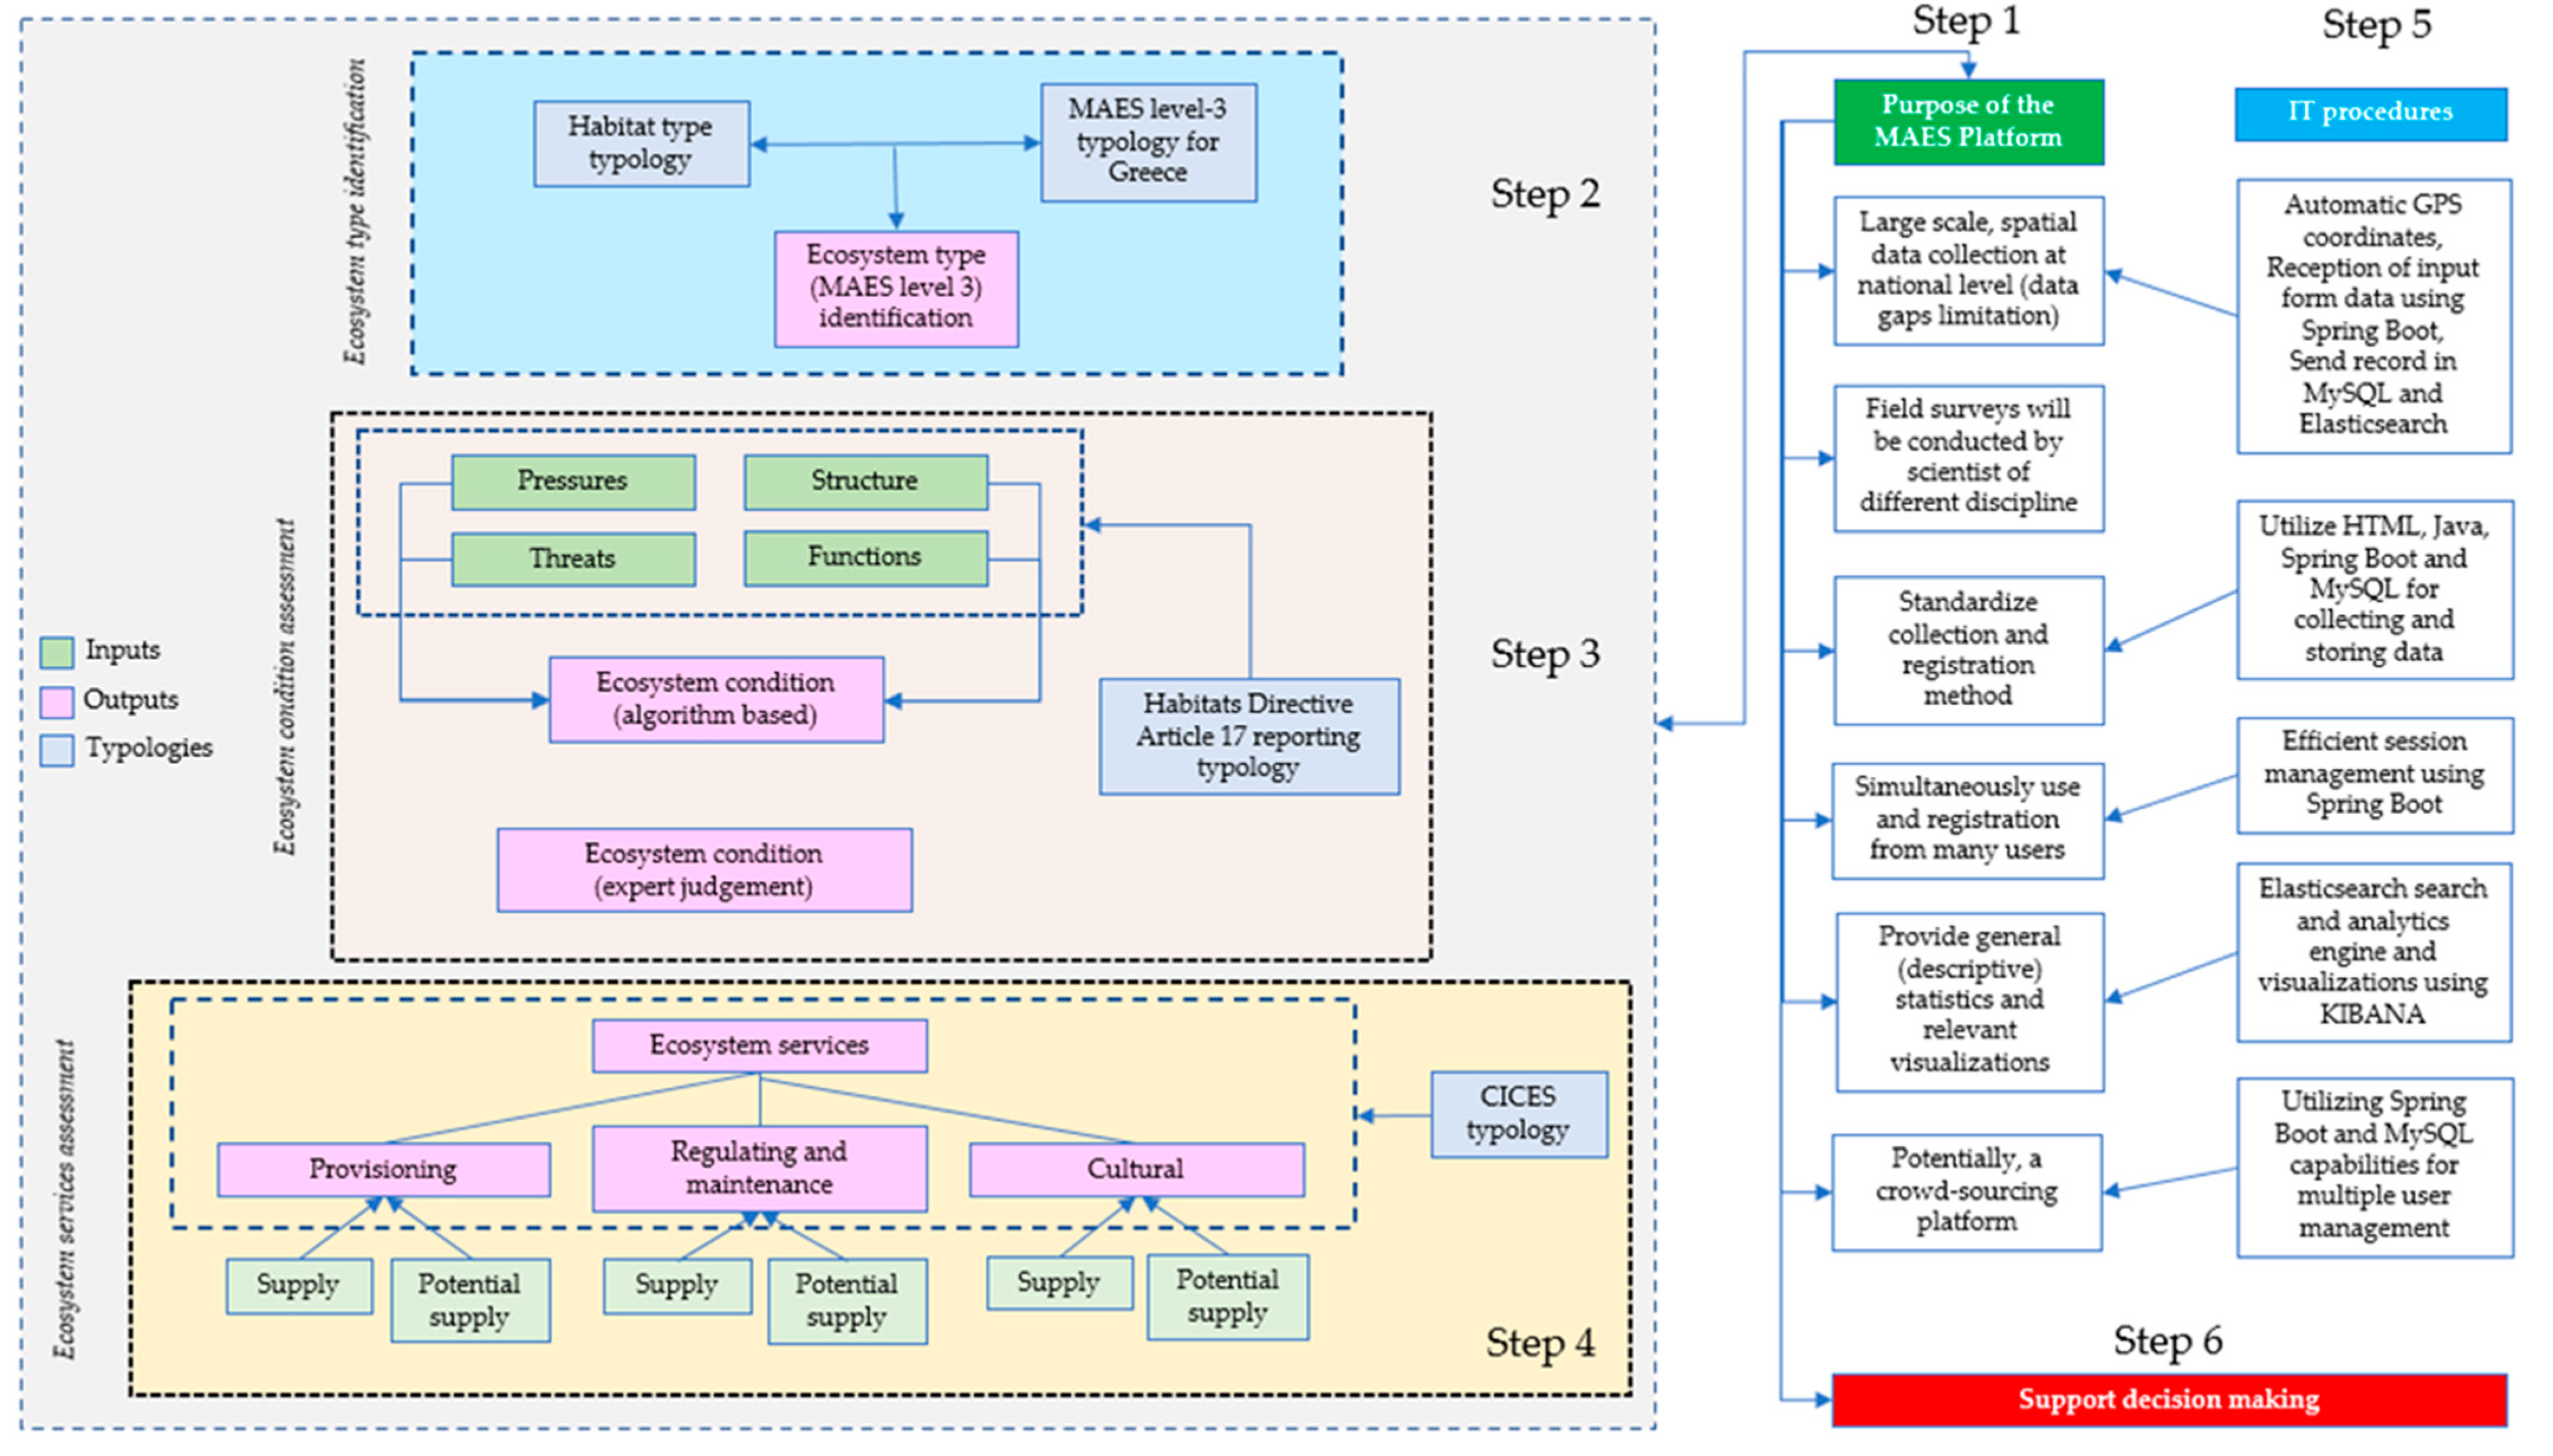
- The MAES conceptual approach for data collection and analysis for both ecosystem condition and ecosystem services.
- The technical development of the platform.
- Step 1: Conceptualization
- Step 2: Ecosystem type identification (includes ecosystem type classification scheme) (input)
- Step 3: Design of the ecosystem condition assessment approach (includes ecosystem condition assessment parameters) (input)
- Step 4: Design of the ecosystem services assessment approach (includes ecosystem services categories, classification scheme and rating scheme) (input)
- Step 5: Development of the web-based platform (includes pilot testing and evaluation)
- Step 6: Outputs to support decision making
2.1. Conceptualization
- Use of open-source, reusable, software both for the front-end (graphical user interface) and the back-end
- Ability to geospatially visualize the ES-relevant data, using up-to-date satellite and GIS base-maps, providing informative context to users
- Ability to implement a variety of visualizations (i.e., pie charts, heat-maps) and spatial/aspatial queries
- Ability to automatically update the central database as new survey data become available without modifying the software code, supporting monitoring and ES spatio-temporal changes detection
- Disaggregation and aggregation of the survey data. Calculation of the respective statistics at various scales and units (e.g., EEA reference grid cell, regional unit, national)
- Ability to extract information using task-specific algorithm
- Ability to survey data relevant to ecosystem types, ecosystem services and ecosystem condition
- Ability to complement concurrent activities and tasks within the project (i.e., providing reliable, accurate reference data for spatial explicit mapping of ecosystem types and services using Earth Observation data)
- Compatibility with a variety of mobile devices and operating systems for data entry
2.2. Ecosystem Type Identification
2.3. Ecosystem Condition
2.3.1. Expert Based Assessment
2.3.2. Ecosystem Condition Calculation Algorithm
- ECi = aPi + bEAi
- ECi = Ecosystem Condition
- Pi = Pressures index
- EAi = Ecosystem Attributes index
- a, b = weights
- a = −1
- b = 0.5
- i = Ecosystem type i
- Pi = aiPIkey + biPIother
- Pi = Pressures index for ecosystem type i
- PIkey = key pressure indicator
- PIother = other pressure indicator
- a = weight for key pressures indicator = 2
- b = weight for other pressures indicator = 1
- EAi = aSkey + bSother + cFkey + dFother
- EAi = Ecosystem Attribute index for ecosystem type i
- Skey = key ecosystem attribute indicator
- Sother = other ecosystem attribute indicator
- a = weight for key ecosystem attribute = 2
- b = weight for other ecosystem attribute indicator = 1
- Fkey = key ecosystem attribute indicator
- Fother = other ecosystem attribute indicator
- c = weight for key ecosystem attribute indicator = 2
- d = weight for other ecosystem attribute indicator = 1
2.4. Ecosystem Services Assessment
2.5. Scale of Interpretation and Analysis
2.6. Technical Information (IT Part)
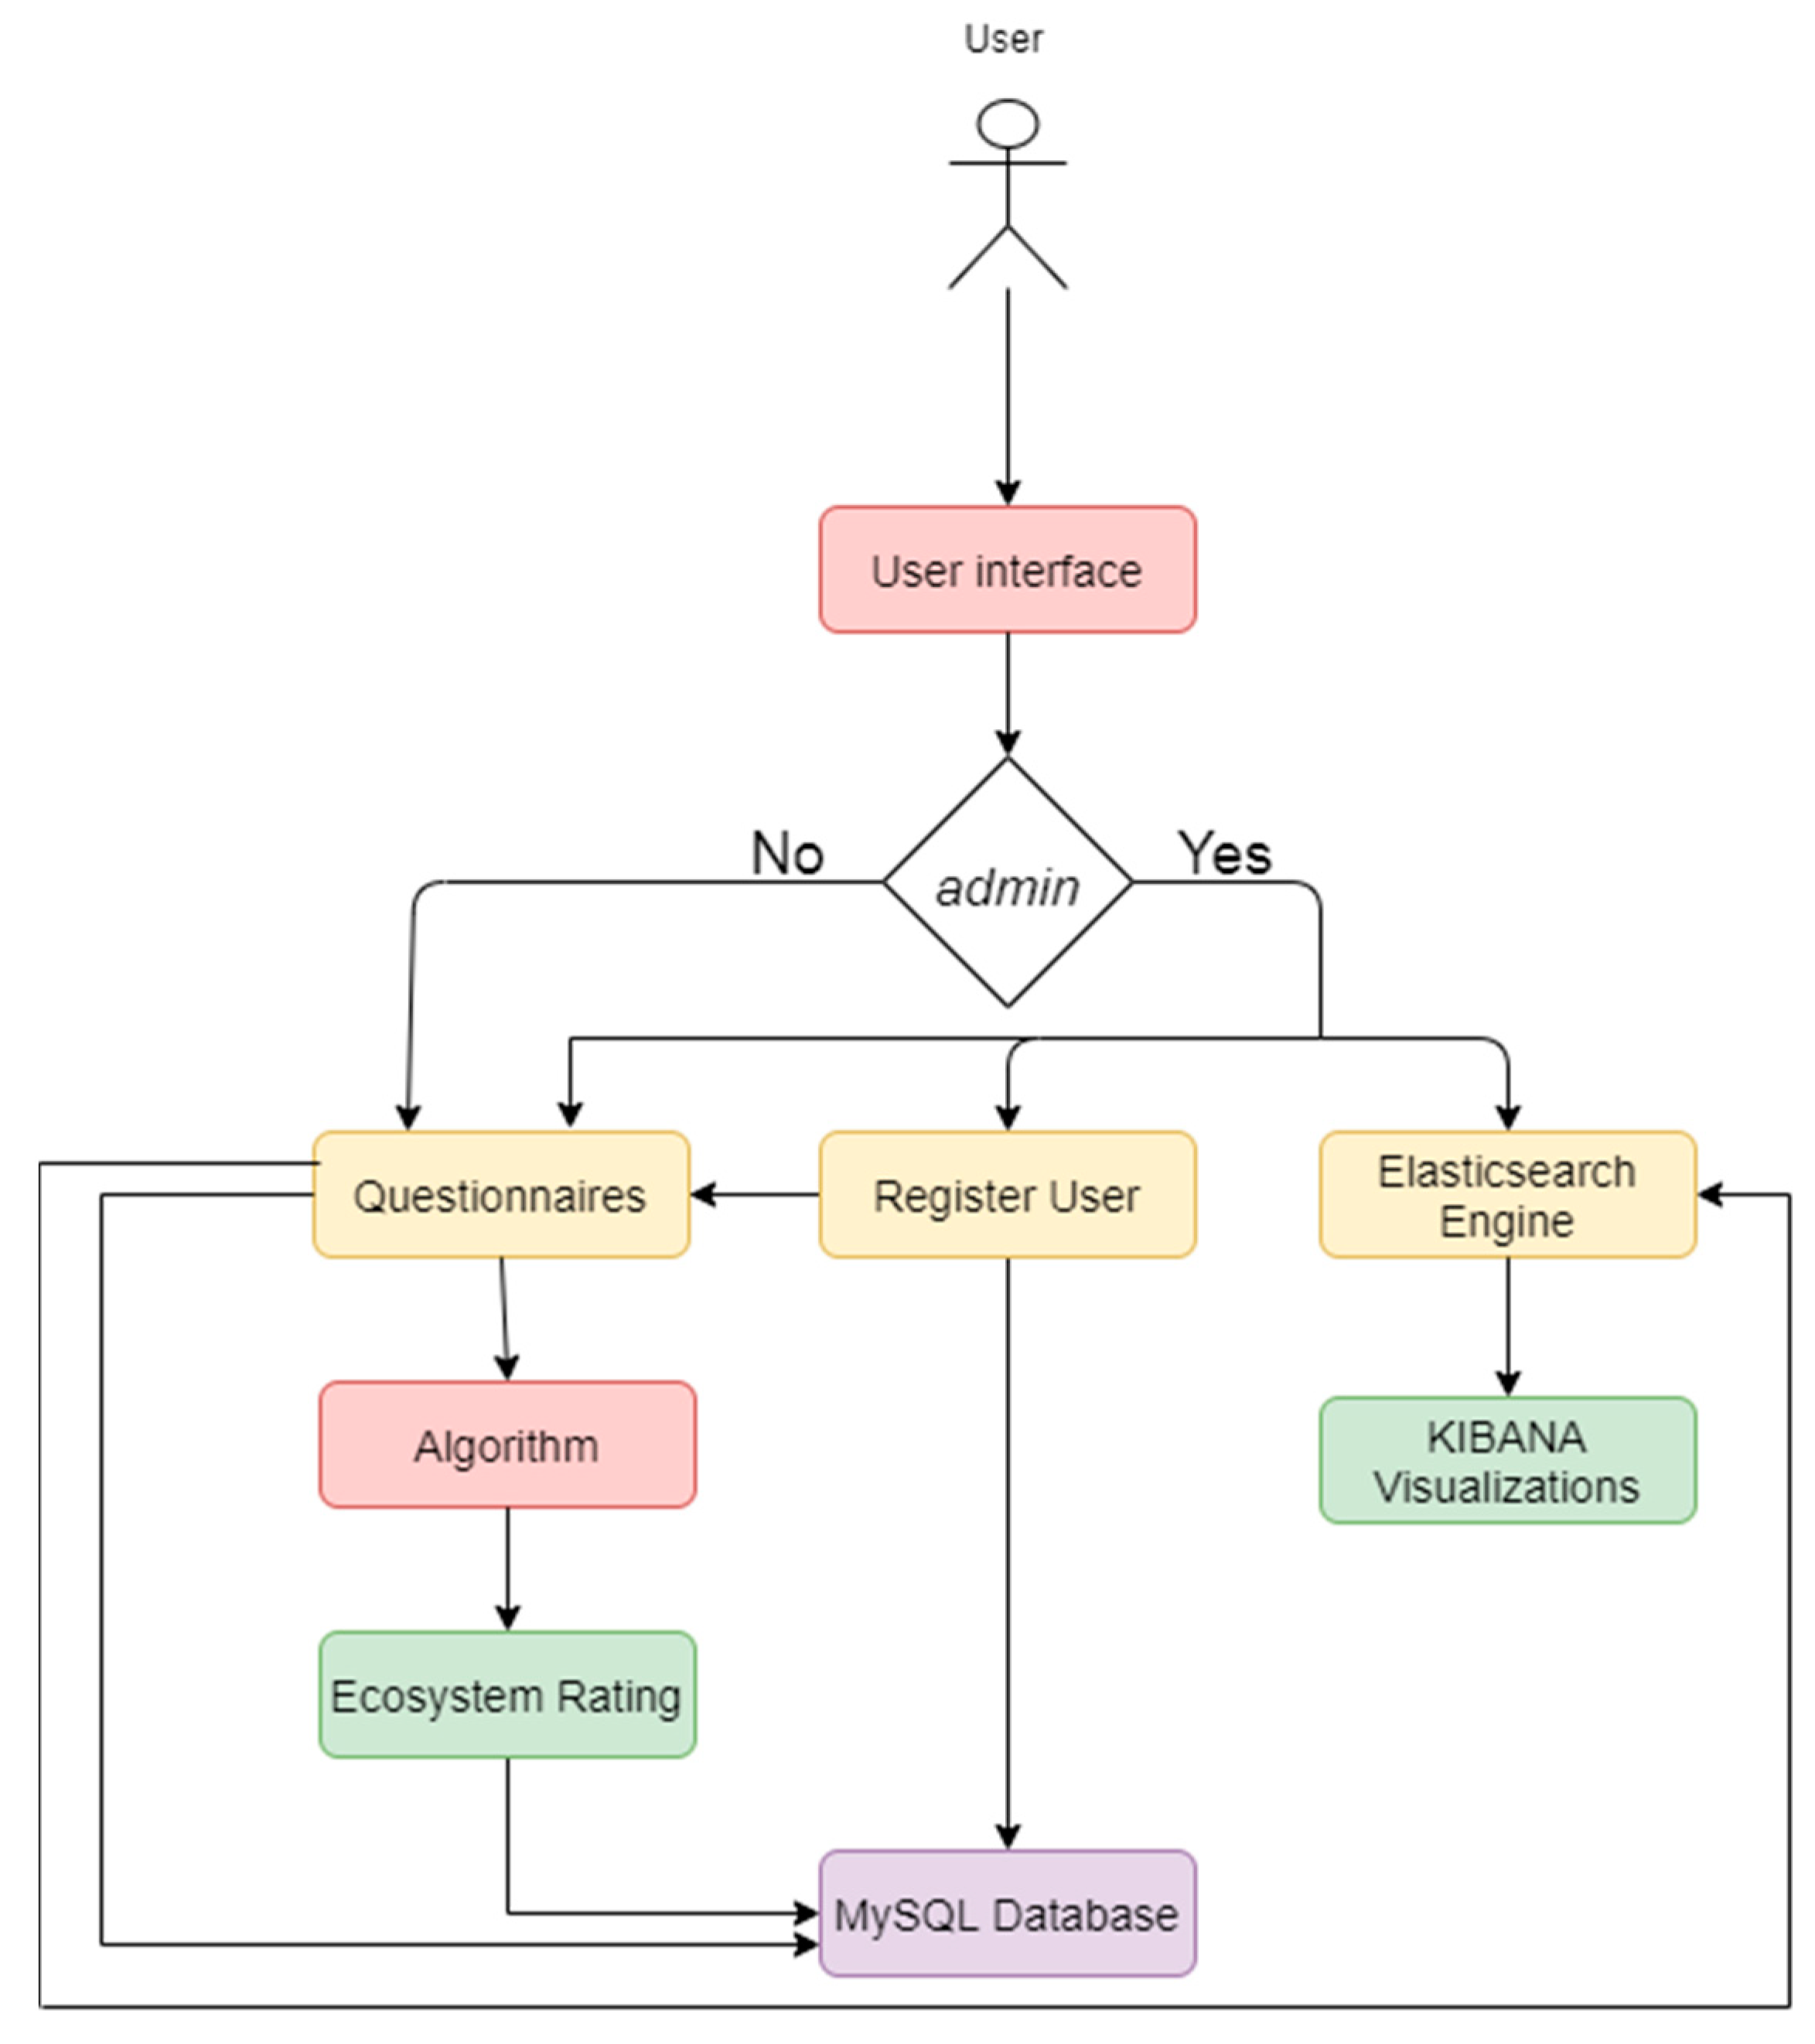
2.6.1. MAES Platform Architecture
2.6.2. MAES_GR Functionality
- User-friendly dashboards that visualize the information received from the Elastic clusters
- Search, view and interact with the stored data in real-time
- Create data queries and visualize information in tables, charts, geo maps, etc.
- The number of structures and functions per MAES level 3
- The (low/medium/high) pressures and threats per MAES level 3
- The (low/medium/high) pressures and threats per MAES level 2
- The ecosystem services supported per MAES level 2
- The biotic and abiotic services per MAES level 2
- The actual and potential supplies of cultural services
- Created data queries and visualized information in tables, charts, geo maps, etc.
2.7. Pilot Testing and Data Collection
3. Results
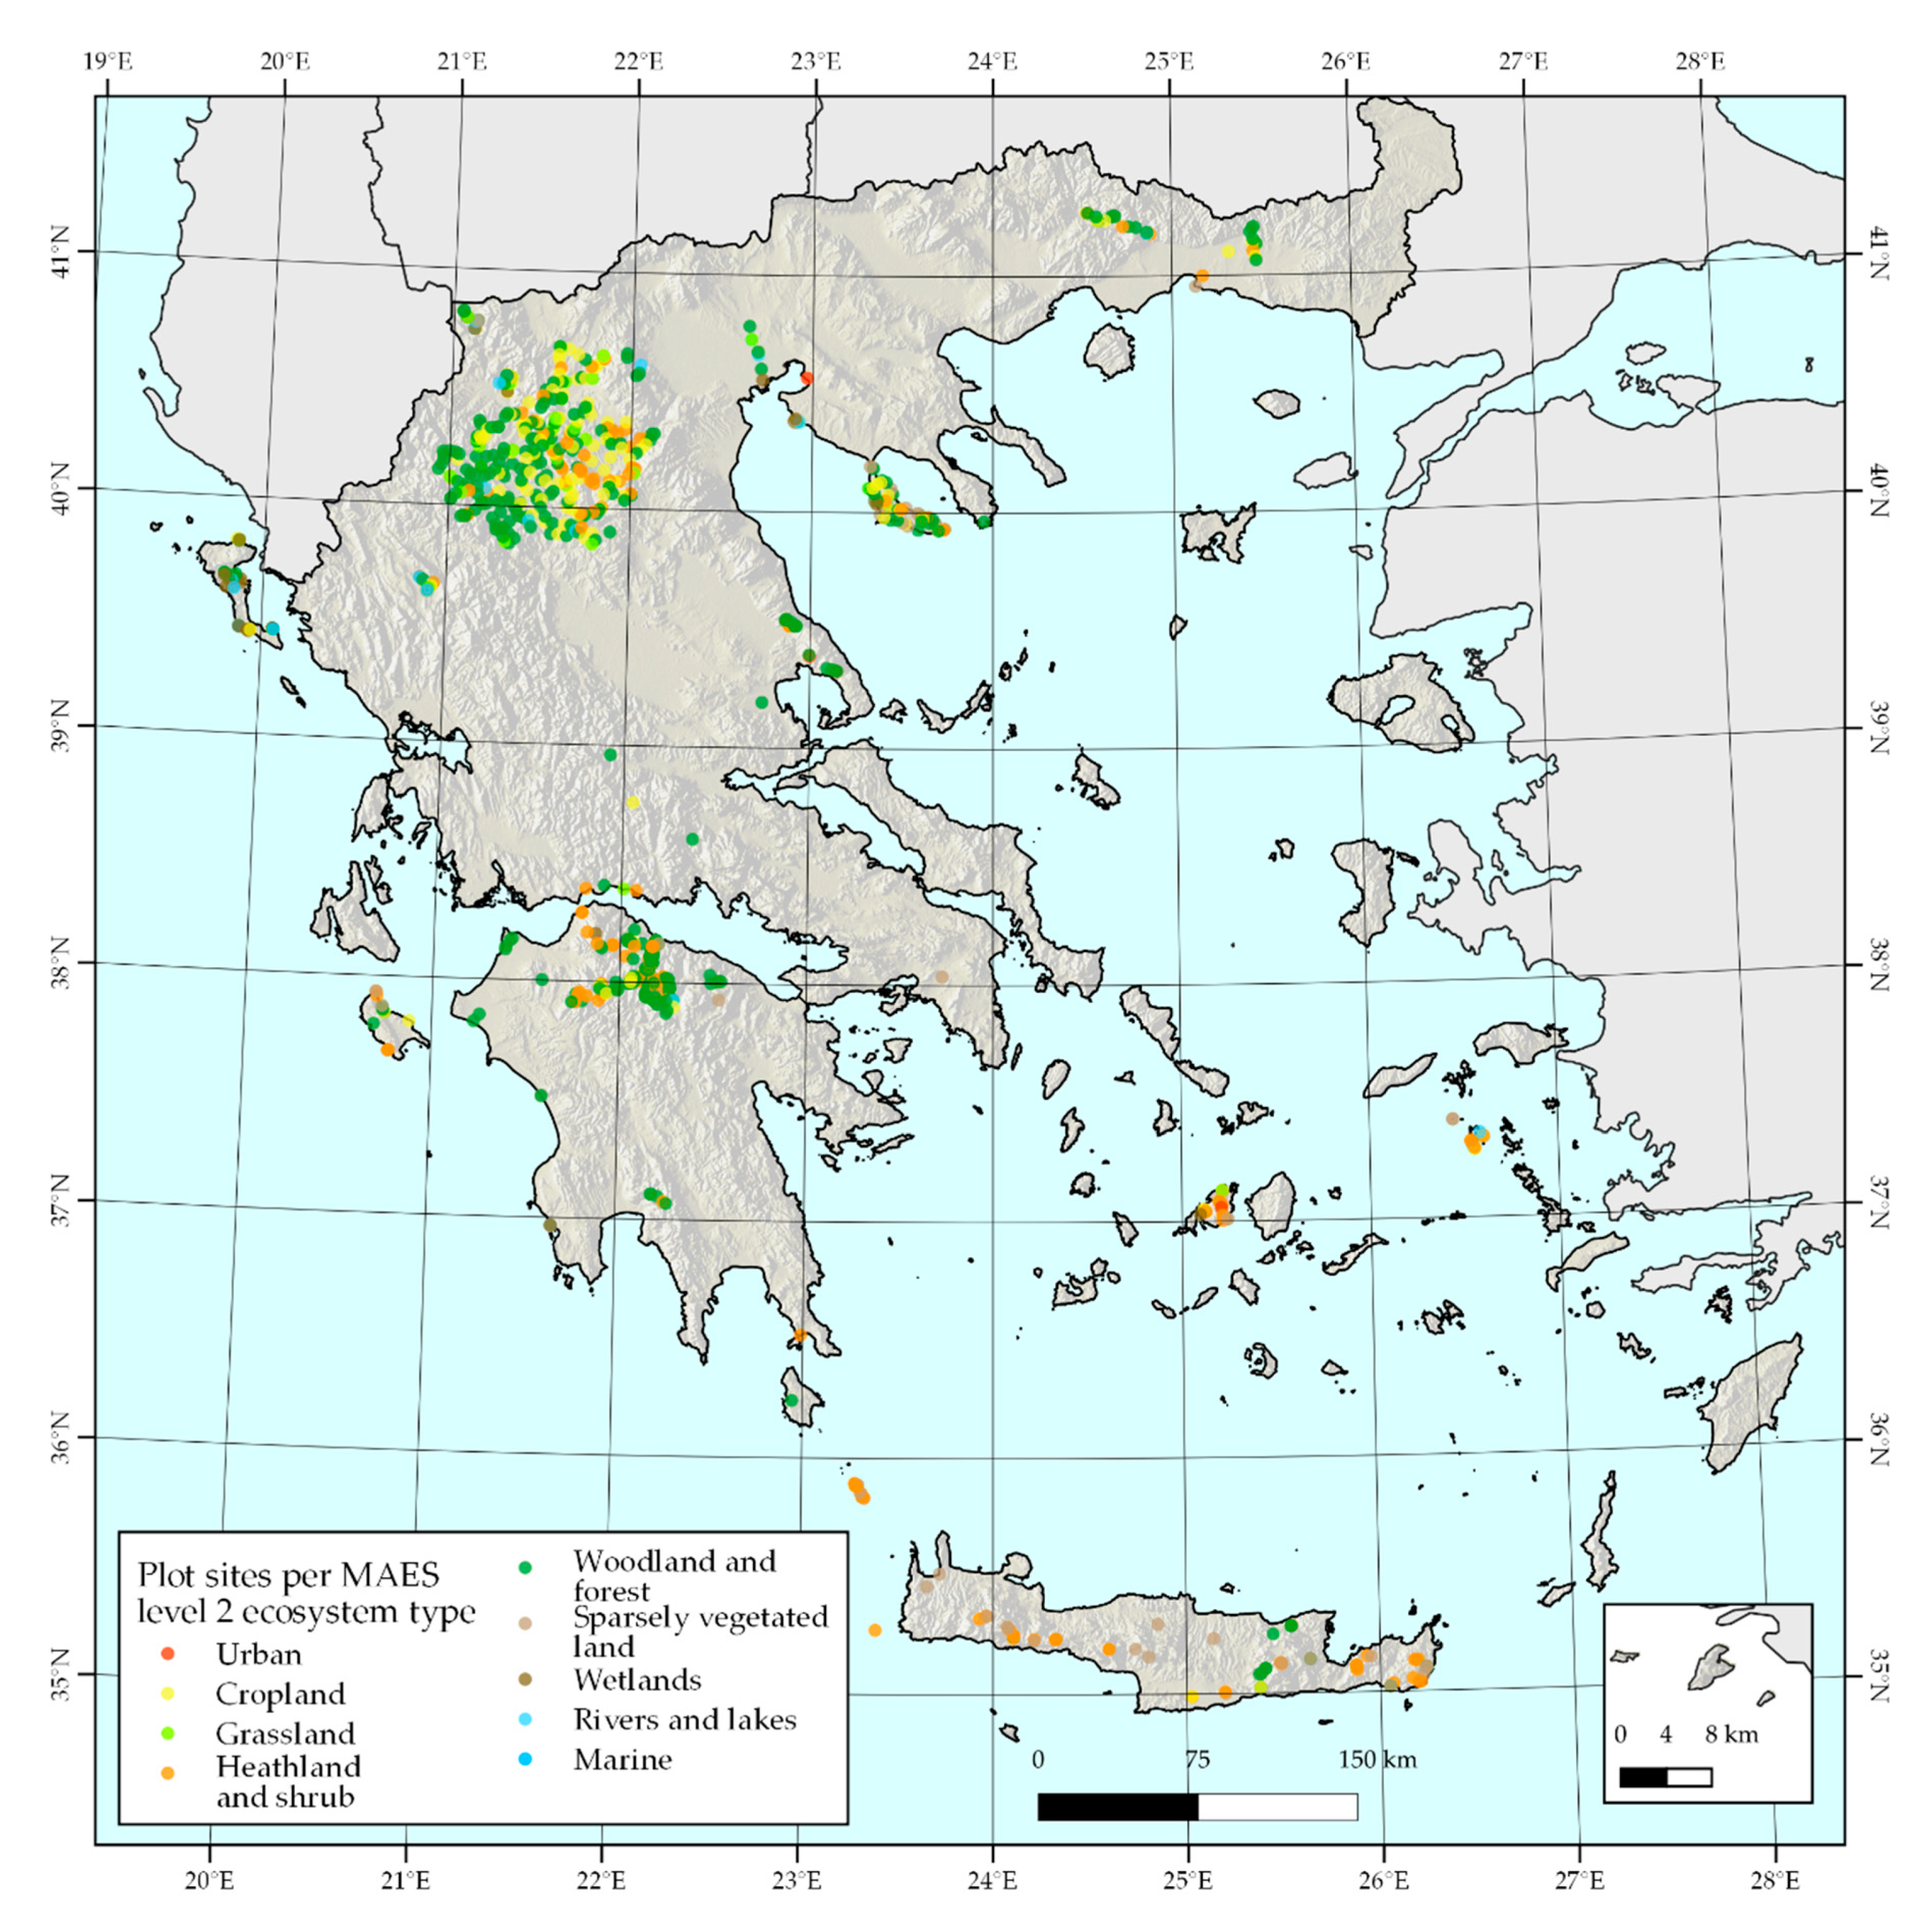
3.1. Field Surveys
3.1.1. Platform Efficiency
- The mean time needed to complete a protocol is 10.2 minutes. Surveys at woodland and forests are the most time consuming (mean 15 minutes); surveys at wetlands and at heathland and shrub follow, with 14 and 11 minutes, respectively.
- Comparing the time needed to submit a completed protocol via the MAES_GR platform, with the respective time needed to complete a paper protocol used for the habitat conservation status assessment [35,38], a significant gain is reported in most cases. More precisely, a time gain of 43% is reported for sparsely vegetated land, followed by the woodland and forest (40%) ecosystem type when using the platform.
3.1.2. Ecosystem Condition
3.1.3. Ecosystem Services
- Urban: The highest (mean) rating of actual supply is recorded for cultural biotic ES (3.68), followed by regulating and maintenance biotic ES (3.11). Highest (mean) rating for potential supply refers to cultural abiotic ES (4.33) and biotic ES (4.32).
- Cropland: The highest (mean) rating of actual supply is recorded for provisioning biotic ES (2.93), followed by regulating and maintenance abiotic ES (2.15). Highest (mean) rating for potential supply refers to provisioning biotic ES (3.46), followed by cultural abiotic ES (2.81).
- Woodland and forest: The highest (mean) rating of actual supply is recorded for regulating and maintenance abiotic ES (2.54), followed by cultural abiotic ES (2.52). Highest (mean) rating for potential supply refers to cultural abiotic ES (3.64), followed by regulating and maintenance abiotic ES (3.28).
- Grassland: The highest (mean) rating of actual supply is recorded for provisioning biotic ES (2.67), followed by regulating and maintenance abiotic ES (2.31). Highest (mean) rating for potential supply refers to cultural ES (both abiotic and biotic) (3.83), followed by provisioning biotic ES (3.19).
- Heathland and shrub: The highest (mean) rating of actual supply is recorded for regulating and maintenance biotic ES (2.59), followed by cultural biotic ES (2.54) and abiotic ES (2.49). Highest (mean) rating for potential supply refers to cultural abiotic ES (3.76) and biotic ES (3.66), followed by regulating and maintenance biotic ES (3.39).
- Sparsely vegetated land: The highest (mean) rating of actual supply is recorded for cultural biotic ES (3.54), followed by regulating and maintenance abiotic ES (3.00). Highest (mean) rating for potential supply refers to cultural biotic ES (4.39), followed by regulating and maintenance abiotic ES (4.27).
- Wetlands: The highest (mean) rating of actual supply is recorded for regulating and maintenance abiotic ES (4.17) and biotic ES (3.95), followed by cultural biotic ES (3.76). Highest (mean) rating for potential supply refers to regulating and maintenance abiotic ES (4.41) and biotic ES (4.36), followed by cultural biotic EC and provisioning abiotic ES (4.21).
- Rivers and lakes: The highest (mean) rating of actual supply is recorded for regulating and maintenance abiotic ES (4.12), followed by provisioning abiotic EC (3.85). Highest (mean) rating for potential supply refers to regulating and maintenance abiotic ES (4.35), followed by provisioning abiotic ES (4.15).
- Marine inlets and transitional waters: The highest (mean) rating of actual supply is recorded for regulating and maintenance abiotic ES (4.38), followed by cultural abiotic ES (4.20). Highest (mean) rating for potential supply refers to regulating and maintenance abiotic ES (4.88) and biotic ES (4.62), followed by cultural abiotic ES (4.60).
4. Discussion
4.1. The Importance of Field Sampling into MAES Implementation
4.2. Pros and Cons of the Platform and Future Steps
4.3. Contribution to MAES and EU Directives Reporting
5. Conclusions
Supplementary Materials
Author Contributions
Funding
Institutional Review Board Statement
Informed Consent Statement
Data Availability Statement
Conflicts of Interest
References
- De Groot, R.S. (Ed.) Functions of Nature: Evaluation of Nature in Environmental Planning, Management and Decision Making; Wolters Noordhoff: Groningen, The Netherland, 1992; p. 315. ISBN 90-01-35594-3. [Google Scholar]
- Daily, G.C. (Ed.) Nature’s services: Societal Dependence on Natural Ecosystems; Island Press: Washington, DC, 1997; 392p, ISBN 1-55963-475-8. [Google Scholar]
- Costanza, R.; d’Arge, R.; deGroot, R.; Farber, S.; Grasso, M.; Hannon, B.; Limburg, K.; Naeem, S.; Oneill, R.V.; Paruelo, J.; et al. The value of the world’s ecosystem services and natural capital. Nature 1997, 387, 253–260. [Google Scholar] [CrossRef]
- Hassan, R.; Scholes, R.; Ash, N. (Eds.) Millenium Ecosystem Assessment: Ecosystems and Human Well-Being: Synthesis; Island Press: Washington, DC, USA, 2005. [Google Scholar]
- IPBS. Global Assessment Report on Biodiversity and Ecosystem Services of the Intergovernmental Science-Policy Platform on Biodiversity and Ecosystem Services; Brondizio, E.S., Settele, S.D., Ngo, H.T., Eds.; IPBES Secretariat: Bonn, Germany, 2019. [Google Scholar]
- European Commission. Our Life Insurance, Our Natural Capital: An EU Biodiversity Strategy to 2020. Communication from the Commission to the European Parliament, the Council the Economic and Social Committee and the Committee of the Regions; Directorate-General for Environment: Brussels, Belgium, 2011. [Google Scholar]
- Hauck, J.; Schweppe-Kraft, B.; Albert, C.; Görg, C.; Jax, K.; Jensen, R.; Fürst, C.; Maes, J.; Ring, I.; Hönigová, I.; et al. The promise of the ecosystem services concept for planning and decision-making. GAIA-Ecol. Perspect. Sci. Soc. 2013, 22, 232–236. [Google Scholar] [CrossRef]
- Maes, J.; Teller, A.; Erhard, M.; Grizzetti, B.; Barredo, J.I.; Paracchini, M.L.; Condé, S.; Somma, F.; Orgiazzi, A.; Jones, A.; et al. Mapping and Assessment of Ecosystems and Their Services: An Analytical Framework for Ecosystem Condition; Publications office of the European Union: Luxembourg, 2018; ISBN 978-92-79-74288-0. [Google Scholar]
- The European Green Deal. Communication from the Commission to the European Parliament, the European Council, the Council, the European Economic and Social Committee and the Committee of the Regions. Brussels, Belgium, 2019. Available online: https://ec.europa.eu/info/sites/info/files/european-green-dealcommunication_en.pdf (accessed on 12 April 2020).
- Willemen, L.; Burkhard, B.; Crossman, N.; Drakou, E.G.; Palomo, I. Editorial: Best practices for mapping ecosystem services. Ecosyst. Serv. 2015, 13, 1–5. [Google Scholar] [CrossRef]
- Haines-Young, R.; Paterson, J.; Potschin, M.; Wilson, A.; Kass, G. The UK NEA Scenarios: Development of Storylines and Analysis of Outcomes; The UK National Ecosystem Assessment Technical Report; United Nations Environment Programme World Conservation Monitoring Centre (UNEP-WCMC): Cambridge, UK, 2011. [Google Scholar]
- Spanish National Ecosystem Assessment. Ecosystems and Biodiversity for Human Wellbeing: Synthesis of Key Findings; Ministerio de Agricultura, Alimentación y Medio Ambiente: Madrid, Spain, 2014.
- Bratanova-Doncheva, S.; Chipev, N.; Gocheva, K.; Stoyan, V.; Fikova, R. Methodological framework for assessment and mapping of ecosystem condition and ecosystem services in Bulgaria. In Conceptual Bases and Principles of Application; Digital Illusions: Clorind, Argentina, 2017; ISBN 978-619-7379-21-1. [Google Scholar]
- Grunewald, K.; Herold, H.; Marzelli, S.; Meinel, G.; Richter, B.; Syrbe, R.U.; Walz, U. Assessment of ecosystem services at the national level in Germany—Illustration of the concept and the development of indicators by way of the example wood provision. Ecol. Indic. 2016, 70, 181–195. [Google Scholar] [CrossRef]
- Palomo, I.; Martín-López, B.; Zorrilla-Miras, P.; García Del Amo, D.; Montes, C. Deliberative mapping of ecosystem services within and around Doñana National Park (SW Spain) in relation to land use change. Reg. Environ. Chang. 2014, 14, 237–251. [Google Scholar] [CrossRef]
- Cortinovis, C.; Geneletti, D. Ecosystem services in urban plans: What is there, and what is still needed for better decisions. Land Use Policy 2018, 70, 298–312. [Google Scholar] [CrossRef]
- Mapping and Assessment for Integrated Ecosystem Accounting (MAIA). Available online: https://maiaportal.eu/ (accessed on 7 November 2020).
- United Nations; European Commission; Food and Agricultural Organization of the United Nations; Organization for Economic Co-operation and Development; World Bank. System of Environmental-Economic Accounting 2012: Experimental Ecosystem Accounting. In World Bank System of Environmental-Economic Accounting 2012: Experimental Ecosystem Accounting; United Nations: New York, NY, USA, 2014; ISBN 9789210559263. [Google Scholar]
- Le Clec’h, S.; Jégou, N.; Decaens, T.; Dufour, S.; Grimaldi, M.; Oszwald, J. From Field Data to Ecosystem Services Maps: Using Regressions for the Case of Deforested Areas Within the Amazon. Ecosystems 2018, 21, 216–236. [Google Scholar] [CrossRef]
- Dimopoulos, P.; Drakou, E.G.; Kokkoris, I.P.; Katsanevakis, S.; Kallimanis, A.; Tsiafouli, M.; Bormpoudakis, D.; Kormas, K.; Arends, J. The need for the implementation of an Ecosystem Services assessment in Greece: Drafting the national agenda. One Ecosyst. 2017, 2, e13714. [Google Scholar] [CrossRef]
- Kokkoris, I.P.; Dimopoulos, P.; Xystrakis, F.; Tsiripidis, I. National scale ecosystem condition assessment with emphasis on forest types in Greece. One Ecosyst. 2018, 3, e25434. [Google Scholar] [CrossRef]
- Kokkoris, I.P.; Mallinis, G.; Bekri, E.S.; Vlami, V.; Zogaris, S.; Chrysafis, I.; Mitsopoulos, I.; Dimopoulos, P. National set of MAES indicators in Greece: Ecosystem services and management implications. Forests 2020, 11, 595. [Google Scholar] [CrossRef]
- Verde, N.; Kokkoris, I.P.; Georgiadis, C.; Kaimaris, D.; Dimopoulos, P.; Mitsopoulos, I.; Mallinis, G. National scale land cover classification for ecosystem services mapping and assessment, using multitemporal copernicus EO data and google earth engine. Remote Sens. 2020, 12, 3303. [Google Scholar] [CrossRef]
- LIFE IP 4Natura—Integrated Actions for the Conservation and Management of Natura 2000 Sites, Species, Habitats and Ecosystems in Greece (LIFE16 IPE/GR/000002). Available online: https://ec.europa.eu/environment/life/project/Projects/index.cfm?fuseaction=search.dspPage&n_proj_id=6520 (accessed on 10 February 2021).
- Vihervaara, P.; Viinikka, A.; Brander, L.; Santos-Martín, F.; Poikolainen, L.; Nedkov, S. Methodological interlinkages for mapping ecosystem services—From data to analysis and decision-support. One Ecosyst. 2019, 4, 1–17. [Google Scholar] [CrossRef]
- Geijzendorffer, I.R.; Roche, P.K. Can biodiversity monitoring schemes provide indicators for ecosystem services? Ecol. Indic. 2013, 33, 148–157. [Google Scholar] [CrossRef]
- Nowak, M.M.; Dziób, K.; Ludwisiak, Ł.; Chmiel, J. Mobile GIS applications for environmental field surveys: A state of the art. Glob. Ecol. Conserv. 2020, 23, e01089. [Google Scholar] [CrossRef]
- Njuguna, H.N.; Caselton, D.L.; Arunga, G.O.; Emukule, G.O.; Kinyanjui, D.K.; Kalani, R.M.; Kinkade, C.; Muthoka, P.M.; Katz, M.A.; Mott, J.A. A comparison of smartphones to paper-based questionnaires for routine influenza sentinel surveillance, Kenya, 2011–2012. BMC Med. Inform. Decis. Mak. 2014, 14, 1–9. [Google Scholar] [CrossRef] [PubMed]
- Ley, B.; Rijal, K.R.; Marfurt, J.; Adhikari, N.R.; Banjara, M.R.; Shrestha, U.T.; Thriemer, K.; Price, R.N.; Ghimire, P. Analysis of erroneous data entries in paper based and electronic data collection. BMC Res. Notes 2019, 12, 4–9. [Google Scholar] [CrossRef] [PubMed]
- EEA Reference Grid. Available online: https://www.eea.europa.eu/data-and-maps/data/eea-reference-grids-2 (accessed on 12 April 2020).
- Linkages of Species and Habitat Types to MAES Ecosystems. Available online: https://www.eea.europa.eu/data-and-maps/data/linkages-of-species-and-habitat#tab-metadata (accessed on 12 April 2020).
- Feio, M.J.; Calapez, A.R.; Elias, C.L.; Cortes, R.M.V.; Graça, M.A.S.; Pinto, P.; Almeida, S.F.P. The paradox of expert judgment in rivers ecological monitoring. J. Environ. Manag. 2016, 184, 609–616. [Google Scholar] [CrossRef] [PubMed]
- Hellenic Ministry of Environment and Energy Conservation Status Assessment of Habitat Types and Species for Terrestrial Areas Protected under the «Νatura 2000» Network at a National Scale; Hellenic Ministry of Environment and Energy: Athens, Greece, 2016.
- European Environment Agency Eionet Central Data Repository—Reference Portal for Reporting under Article 17 of the Habitats Directive. Available online: https://cdr.eionet.europa.eu/help/habitats_art17 (accessed on 10 April 2020).
- Dimopoulos, P.; Tsiripidis, I.; Xystrakis, F.; Kallimanis, A.; Panitsa, M. Methodology for Monitoring and Conservation Status Assessment of the Habitat Types in Greece; National Center of the Environment and Sustainable Development: Athens, Greece, 2018; ISBN 978-960-99033-2-5. [Google Scholar]
- Haines-Young, R.; Potschin, M. CICES Towards a Common Classification of Ecosystem Services. Available online: https://cices.eu/ (accessed on 12 April 2020).
- Development of Large Scale (1:5000) Spatial Data Infrastructure for Terrestrial Areas Protected under the «Νatura 2000» Network at a National Scale 2016. Available online: http://www.ypeka.gr/LinkClick.aspx?fileticket=txXACYhOLPI%3d&tabid=37&language=el-GR (accessed on 10 February 2021).
- Tsiripidis, I.; Xystrakis, F.; Kallimanis, A.; Panitsa, M.; Dimopoulos, P. A bottom–up approach for the conservation status assessment of structure and functions of habitat types. Rend. Lincei 2018, 29, 267–282. [Google Scholar] [CrossRef]
- Van Der Biest, K.; D’Hondt, R.; Jacobs, S.; Landuyt, D.; Staes, J.; Goethals, P.; Meire, P. EBI: An index for delivery of ecosystem service bundles. Ecol. Indic. 2014, 37, 252–265. [Google Scholar] [CrossRef]
- Rangan, H.; Kull, C.A. What makes ecology “political”?: Rethinking “scale” in political ecology. Prog. Hum. Geogr. 2009, 33, 28–45. [Google Scholar] [CrossRef]
- Mapping and Assessment of Ecosystems and Their Services (MAES). Available online: https://biodiversity.europa.eu/ecosystems/mapping-and-assessment-of-ecosystems-and-their-services-maes-1 (accessed on 25 February 2021).
- EC-EEA Ecosystems and Their Services. Available online: https://biodiversity.europa.eu/ecosystems (accessed on 25 February 2021).


| MAES Level 1 | MAES Level 2 | MAES Level 3 | Habitat Type Name | Habitat Type Code |
|---|---|---|---|---|
| Terrestrial | Wetlands | Inland freshwater marshes | Humid dune slacks | 2190 |
| Euro-Siberian annual communities of muddy riverbanks | 32B0 | |||
| Reed thickets | 72A0 | |||
| Rush communities | 72B0 | |||
| Inland saline marshes | Salicornia and other annuals colonizing mud and sand | 1310 | ||
| Mediterranean salt meadows (Juncetalia maritimi) | 1410 | |||
| Mediterranean and thermo-Atlantic halophilous scrubs (Sarcocornietea fruticosi) | 1420 | |||
| Halo-nitrophilus scrubs (Pegano-Salsoletea) | 1430 | |||
| Salt pans | 1440 | |||
| Mediterranean salt steppes (Limonietalia) | 1510 | |||
| Peat bogs | Transition mires and quaking bogs | 7140 | ||
| Calcareous fens with Cladium mariscus and species of the Caricion davallianae | 7210 | |||
| Petrifying springs with tufa formation (Cratoneurion) | 7220 | |||
| Alkaline fens | 7230 |
| Ecosystem Condition | Algorithm Output |
|---|---|
| Excellent | 1.00 to 0.60 |
| Good | 0.59 to 0.20 |
| Moderate | 0.19 to −0.19 |
| Poor | −0.2 to −0.59 |
| Bad | −0.60 to −1.00 |
| Ecosystem Types (MAES Level 2) | Mean Time Needed for Completing the Protocol | |
|---|---|---|
| MAES Platform Assessment (Total Number of Survey Protocol Forms) | Natura 2000 Monitoring with Paper survey Protocol Forms (% Difference from the Platforms’ Performance) | |
| Urban | 8 min (4 protocols) | n/a |
| Cropland | 7 min (134 protocols) | n/a |
| Woodland and forest | 15 min (431 protocols) | 25 min (+40%) |
| Grassland | 10 min (36 protocols) | 10 min (=) |
| Heathland and shrub | 11 min (182 protocols) | 15 min (+27%) |
| Sparsely vegetated land | 7 min (82 protocols) | 15 min (+43%) |
| Wetlands | 14 min (36 protocols) | 20 min (+30%) |
| Rivers and lakes | 10 min (23 protocols) | 15 min (+33%) |
| Marine inlets and transitional waters | 10 min (6 protocols) | 10 min (=) |
| Ecosystem Types (MAES Level 2) | Ecosystem Condition (Expert Judgment/Algorithm) | Total Number of Protocols | ||||
|---|---|---|---|---|---|---|
| Excellent | Good | Moderate | Poor | Bad | ||
| Urban | 3/na | -/na | 1/na | -/na | -/na | 4 |
| Cropland | 48/na | 68/na | 16/na | 2/na | -/na | 134 |
| Woodland and forest | 135/68 | 194/173 | 87/189 | 13/- | 2/1 | 431 |
| Grassland | 10/4 | 22/11 | 2/20 | 2/1 | -/- | 36 |
| Heathland and shrub | 48/27 | 93/127 | 33/26 | 5/- | 3/2 | 182 |
| Sparsely vegetated land | 40/33 | 18/27 | 16/16 | 2/- | 6/6 | 82 |
| Wetlands | 4/3 | 15/20 | 14/13 | 3/- | -/- | 36 |
| Rivers and lakes | 5/3 | 11/5 | 6/15 | 1/- | -/- | 23 |
| Marine inlets and transitional waters | -/- | 3/5 | 2/1 | 1/- | -/- | 6 |
| Ecosystem Services | Urban | Cropland | Woodland and Forest | Grassland | Heathland and Shrub | Sparsely Vegetated Land | Wetlands | Rivers and Lakes | Marine Inlets and Transitional Waters |
|---|---|---|---|---|---|---|---|---|---|
| Provisioning (Biotic) | 1 | 9 | 13 | 9 | 12 | 9 | 6 | 5 | 1 |
| Provisioning (Abiotic) | 1 | 4 | 10 | 4 | 7 | 4 | 4 | 2 | 4 |
| Regulating and Maintenance (Biotic) | 15 | 15 | 21 | 13 | 20 | 15 | 17 | 14 | 9 |
| Regulating and Maintenance (Abiotic) | 4 | 7 | 8 | 7 | 6 | 2 | 8 | 7 | 5 |
| Cultural (Biotic) | 10 | 11 | 11 | 8 | 11 | 10 | 10 | 8 | 4 |
| Cultural (Abiotic) | 3 | 4 | 4 | 1 | 4 | 3 | 3 | 3 | 1 |
| Total | 50 | 42 | 60 | 24 | 39 | 43 | 34 | 48 | 67 |
| Ecosystem Types (MAES Level 2) | Total Number of Protocols | Provisioning (Biotic) | Provisioning (Abiotic) | Regulating and Maintenance (Biotic) | Regulating and Maintenance (Abiotic) | Cultural (Biotic) | Cultural (Abiotic) | ||||||
|---|---|---|---|---|---|---|---|---|---|---|---|---|---|
| Actual Supply | Potential Supply | Actual Supply | Potential Supply | Actual Supply | Potential Supply | Actual Supply | Potential Supply | Actual Supply | Potential Supply | Actual Supply | Potential Supply | ||
| Urban | 4 | 2.00;2; | 3.00;3; | 1.00;1; | 2.00;2; | 3.11;3,5; | 3.44;3,5; | 1.75;2; | 2.50;2.5; | 3.68;4; | 4.32;4; | 3.00;3; | 4.33;4; |
| (1) | (1) | (1) | (2) | (18) | (18) | (4) | (4) | (22) | (22) | (3) | (3) | ||
| Cropland | 134 | 2.93;3; | 3.46;3; | 1.70;1.5; | 2.30;2; | 1.89;1; | 2.43;2; | 2.15;1; | 2.49;2; | 0.98;1; | 2.78;3; | 1.15;1; | 2.81;3; |
| (111) | (111) | (30) | (141) | (264) | (264) | (73) | (73) | (110) | (110) | (26) | (26) | ||
| Woodland and forest | 431 | 2.07;2; | 2.83;3; | 1.99;2; | 2.71;3; | 2.48;2; | 3.20;3; | 2.54;2; | 3.28;3; | 2.31;2; | 3.26;3; | 2.52;2.5; | 3.64;4; |
| (378) | (378) | (108) | (486) | (1404) | (1404) | (315) | (315) | (765) | (765) | (132) | (132) | ||
| Grasslands | 36 | 2.67;3; | 3.19;3; | 1.30;1; | 2.20;2; | 2.24;2; | 2.79;2; | 2.31;1; | 2.69;2; | 1.38;1; | 3.83;4; | 1.33;1; | 3.83;4; |
| (43) | (43) | (10) | (53) | (80) | (80) | (29) | (29) | (42) | (42) | (12) | (12) | ||
| Heathland and shrub | 182 | 2.11;2; | 2.91;3; | 1.85;2; | 2.41;2; | 2.59;2; | 3.39;3; | 2.09;2; | 2.97;3; | 2.54;3; | 3.66;4; | 2.49;3; | 3.76;4; |
| (260) | (260) | (34) | (294) | (695) | (695) | (132) | (132) | (401) | (401) | (75) | (75) | ||
| Sparsely vegetated land | 82 | 2.54;2; | 3.54;3; | 2.30;1.5; | 3.60;3; | 2.94;3; | 3.89;4; | 3.00;3; | 4.27;4; | 3.54;4; | 4.39;5; | 2.59;3; | 3.63;4; |
| (52) | (52) | (10) | (62) | (244) | (244) | (30) | (30) | (186) | (186) | (41) | (41) | ||
| Wetlands | 36 | 3.03;3; | 3.57;4.5; | 3.37;5; | 4.21;5; | 3.95;5; | 4.36;5; | 4.17;5; | 4.41;5; | 3.76;5; | 4.21;5; | 3.35;3; | 4.12;5; |
| (30) | (30) | (38) | (68) | (155) | (155) | (94) | (94) | (38) | (38) | (17) | (17) | ||
| Rivers and lakes | 23 | 2.69;2; | 3,38;3; | 3.85;5; | 4.15;5; | 3.74;4; | 4.09;5; | 4.12;5; | 4.35;5; | 3.56;3; | 4.02;4; | 3.79;4; | 4.00;5; |
| (13) | (13) | (33) | (46) | (76) | (76) | (65) | (65) | (43) | (43) | (14) | (14) | ||
| Marine inlets and transitional waters | 6 | 3.00;3; | 3.00;3; | 3.46;3; | 3.69;3; | 4.13;5; | 4.62;5; | 4.38;5; | 4.88;5; | 4.00;5; | 4.14;5; | 4.20;5; | 4.60;5; |
| (1) | (1) | (13) | (14) | (30) | (29) | (16) | (16) | (7) | (7) | (5) | (5) | ||
Publisher’s Note: MDPI stays neutral with regard to jurisdictional claims in published maps and institutional affiliations. |
© 2021 by the authors. Licensee MDPI, Basel, Switzerland. This article is an open access article distributed under the terms and conditions of the Creative Commons Attribution (CC BY) license (https://creativecommons.org/licenses/by/4.0/).
Share and Cite
Kokkoris, I.P.; Kokkinos, V.; Michos, E.; Kalogeropoulos, R.; Charalambides, M.; Kounelis, A.; Iliadou, E.; Damianidis, C.K.; Mallinis, G.; Bouras, C.; et al. MAES_GR: A Web-Based, Spatially Enabled Field Survey Platform for the MAES Implementation in Greece. Land 2021, 10, 381. https://doi.org/10.3390/land10040381
Kokkoris IP, Kokkinos V, Michos E, Kalogeropoulos R, Charalambides M, Kounelis A, Iliadou E, Damianidis CK, Mallinis G, Bouras C, et al. MAES_GR: A Web-Based, Spatially Enabled Field Survey Platform for the MAES Implementation in Greece. Land. 2021; 10(4):381. https://doi.org/10.3390/land10040381
Chicago/Turabian StyleKokkoris, Ioannis P., Vasileios Kokkinos, Evangelos Michos, Rafail Kalogeropoulos, Marios Charalambides, Agisilaos Kounelis, Eleni Iliadou, Christos K. Damianidis, Giorgos Mallinis, Christos Bouras, and et al. 2021. "MAES_GR: A Web-Based, Spatially Enabled Field Survey Platform for the MAES Implementation in Greece" Land 10, no. 4: 381. https://doi.org/10.3390/land10040381
APA StyleKokkoris, I. P., Kokkinos, V., Michos, E., Kalogeropoulos, R., Charalambides, M., Kounelis, A., Iliadou, E., Damianidis, C. K., Mallinis, G., Bouras, C., & Dimopoulos, P. (2021). MAES_GR: A Web-Based, Spatially Enabled Field Survey Platform for the MAES Implementation in Greece. Land, 10(4), 381. https://doi.org/10.3390/land10040381