Article

Modelling the Impacts of Habitat Changes on the Population Density of Eurasian Skylark (Alauda arvensis) Based on Its Landscape Preferences

Department of Geoinformatics, Physical and Environmental Geography, University of Szeged, Egyetem utca 2-6, H-6722 Szeged, Hungary
*
Author to whom correspondence should be addressed.
Land 2021, 10(3), 306; https://doi.org/10.3390/land10030306
Submission received: 15 February 2021 / Revised: 15 March 2021 / Accepted: 16 March 2021 / Published: 17 March 2021
(This article belongs to the Special Issue Multiple Roles for Landscape Ecology in Future Farming Systems)

Abstract

:
The dramatic decline of the abundance of farmland bird species can be related to the level of land-use intensity or the land-cover heterogeneity of rural landscapes. Our study area in central Europe (Hungary) included 3049 skylark observation points and their 600 m buffer zones. We used a very detailed map (20 × 20 m minimum mapping unit), the Hungarian Ecosystem Basemap, as a land-cover dataset for the calculation of three landscape indices: mean patch size (MPS), mean fractal dimension (MFRACT), and Shannon diversity index (SDI) to describe the landscape structure of the study areas. Generalized linear models were used to analyze the effect of land-cover types and landscape patterns on the abundance of the Eurasian skylark (Alauda arvensis). According to our findings, the proportions of arable land, open sand steppes, closed grassland patches, and shape complexity and size characteristics of these land cover patches have a positive effect on skylark abundance, while the SDI was negatively associated with the skylark population. On the basis of the used statistical model, the abundance density (individuals/km*) of skylarks could be estimated with 37.77% absolute percentage error and 2.12 mean absolute error. We predicted the skylark population density inside the Natura 2000 Special Protected Area of Hungary which is 0–6 individuals/km* and 23746 ± 8968 skylarks. The results can be implemented for the landscape management of rural landscapes, and the method used are adaptable for the density estimation of other farmland bird species in rural landscapes. According to our findings, inside the protected areas should increase the proportion, the average size and shape complexity of arable land, salt steppes and meadows, and closed grassland land cover patches.

1. Introduction

In the terrestrial ecosystems of the world, the dominant land-cover category is agriculture (38%), including the arable-land use type [1]. In Europe, this value is much higher, at 45% (EBCC, 2015). The agricultural land-cover category contains various land-use types with different levels of human impact. The heterogeneity and spatial structure of these land-use/land-cover (LULC) patches vary greatly across rural areas, which has strong impact on farmland-bird diversity in Europe [2,3]. Many articles have determined that the decreasing trend of farmland birds is strongly connected with the intensity of agricultural management (level of use of fertilizers etc.) [4,5,6,7]. Very few studies have investigated the dramatic decline of the abundance of farmland birds, and its connection with change in landscape structure and land-cover heterogeneity [7,8,9]. There are some regional (country)-scale studies that analyze the connection between land-cover types and farmland-bird population data [10,11,12,13,14,15]. These studies have indicated that the abundance of farmland birds is significantly connected with the intensity of agricultural cultivation, crop heterogeneity, and land-use change. Most articles focus on small, local study areas and analyzing the connection between Eurasian skylark (Alauda arvensis) abundance, and the proportions of crop type, height, coverage and heterogeneity [4,6,10,16,17,18,19]. The skylark does not prefer the fragmented landscapes by urbanized area, road network, hedgerows and heterogeneous land cultivation areas [7,20]. The agriculture is the dominant land use (matrix) of the European NATURA 2000 network, where the size and shape characteristics of different LULC patches, and the land cover heterogeneity can be essential for the protection of farmland bird species. Therefore, we hope that our results can be adding some new suggestions for the landscape planning and habitat design of national parks, NATURA 2000, and other protected areas. Our research also can provide important component for achieving the goals of the EU Birds directive [21].
The skylark is one of the most common farmland bird of rural landscapes in Eurasia, including Hungary. In the European Union, the Eurasian skylark has a declining trend in population between 2000 and 2018: Norway −47%, Lithuania −41%, France −38%, Czech Republic −29%, Hungary −24% and Germany −17%. Most individuals that breed in Central Europe spend the winter in the Mediterranean region, but small groups can stay in Hungary for winter [22]. This bird species have been introduced into the Nearctic, Australia and New Zealand [23,24]. From large-scale studies, habitat preferences, including for crop structure and heterogeneity are well-known. On the basis of small-scale regional-level studies, the regional-scale habitats and land-cover heterogeneity preference of a given species can be understood [10]. However, the connection between the spatial pattern of LULC patches (described with landscape indices), and skylark abundance is not clear.
In this study, we describe the landscape structure of rural landscapes with a very detailed (20 × 20 m minimal mapping unit) LULC map, the Hungarian Ecosystem Basemap (HEB). Comparing skylark abundance data with the HEB, we could identify preferred and nonpreferred skylark habitats, and calculate their landscape indices. The preferred habitat was separated into arable lands and grasslands because we wanted to analyze the effect of arable land and grassland landscape metrics on the skylark population. According to the pattern and process paradigm, which analyze the relationship between the landscape patterns spatial distribution and landscape processes, landscape indices are widely used as indicators of biodiversity and habitat changes [13,25,26,27,28]. After we identified preferred and non-preferred habitats for skylarks, we could calculate shape- and size-related class-level landscape metrics, and land-cover heterogeneity, and estimate the collective impact of these variables on skylark abundance [9,10,11,13,29,30].
The main goals of this study were to:
  • identify skylark land-cover preferences on the basis of the local-scale LULC map;
  • analyze the impact of landscape patterns of preferred and nonpreferred land-cover classes (habitats), and estimate the impact of all LULC-related variables (proportions, shape, and size characteristics of patches, heterogeneity) on skylark abundance; and
  • estimate, based on our findings, the skylark population density inside the Natura 2000 Special Protection Area (SPA) of Hungary based on the HEB land cover categories.
According to our hypotheses the population density of skylark is predictable based on the preferred LULC categories of skylark and landscape indices (proportion of LULC categories and shape and size related landscape metrics). The methodology is adaptable for analyzing the impact of landscape composition on other farmland-bird populations, and for predicting the population density of the skylark, in protected areas, where field observation-based datasets are not available.

2. Materials and Methods
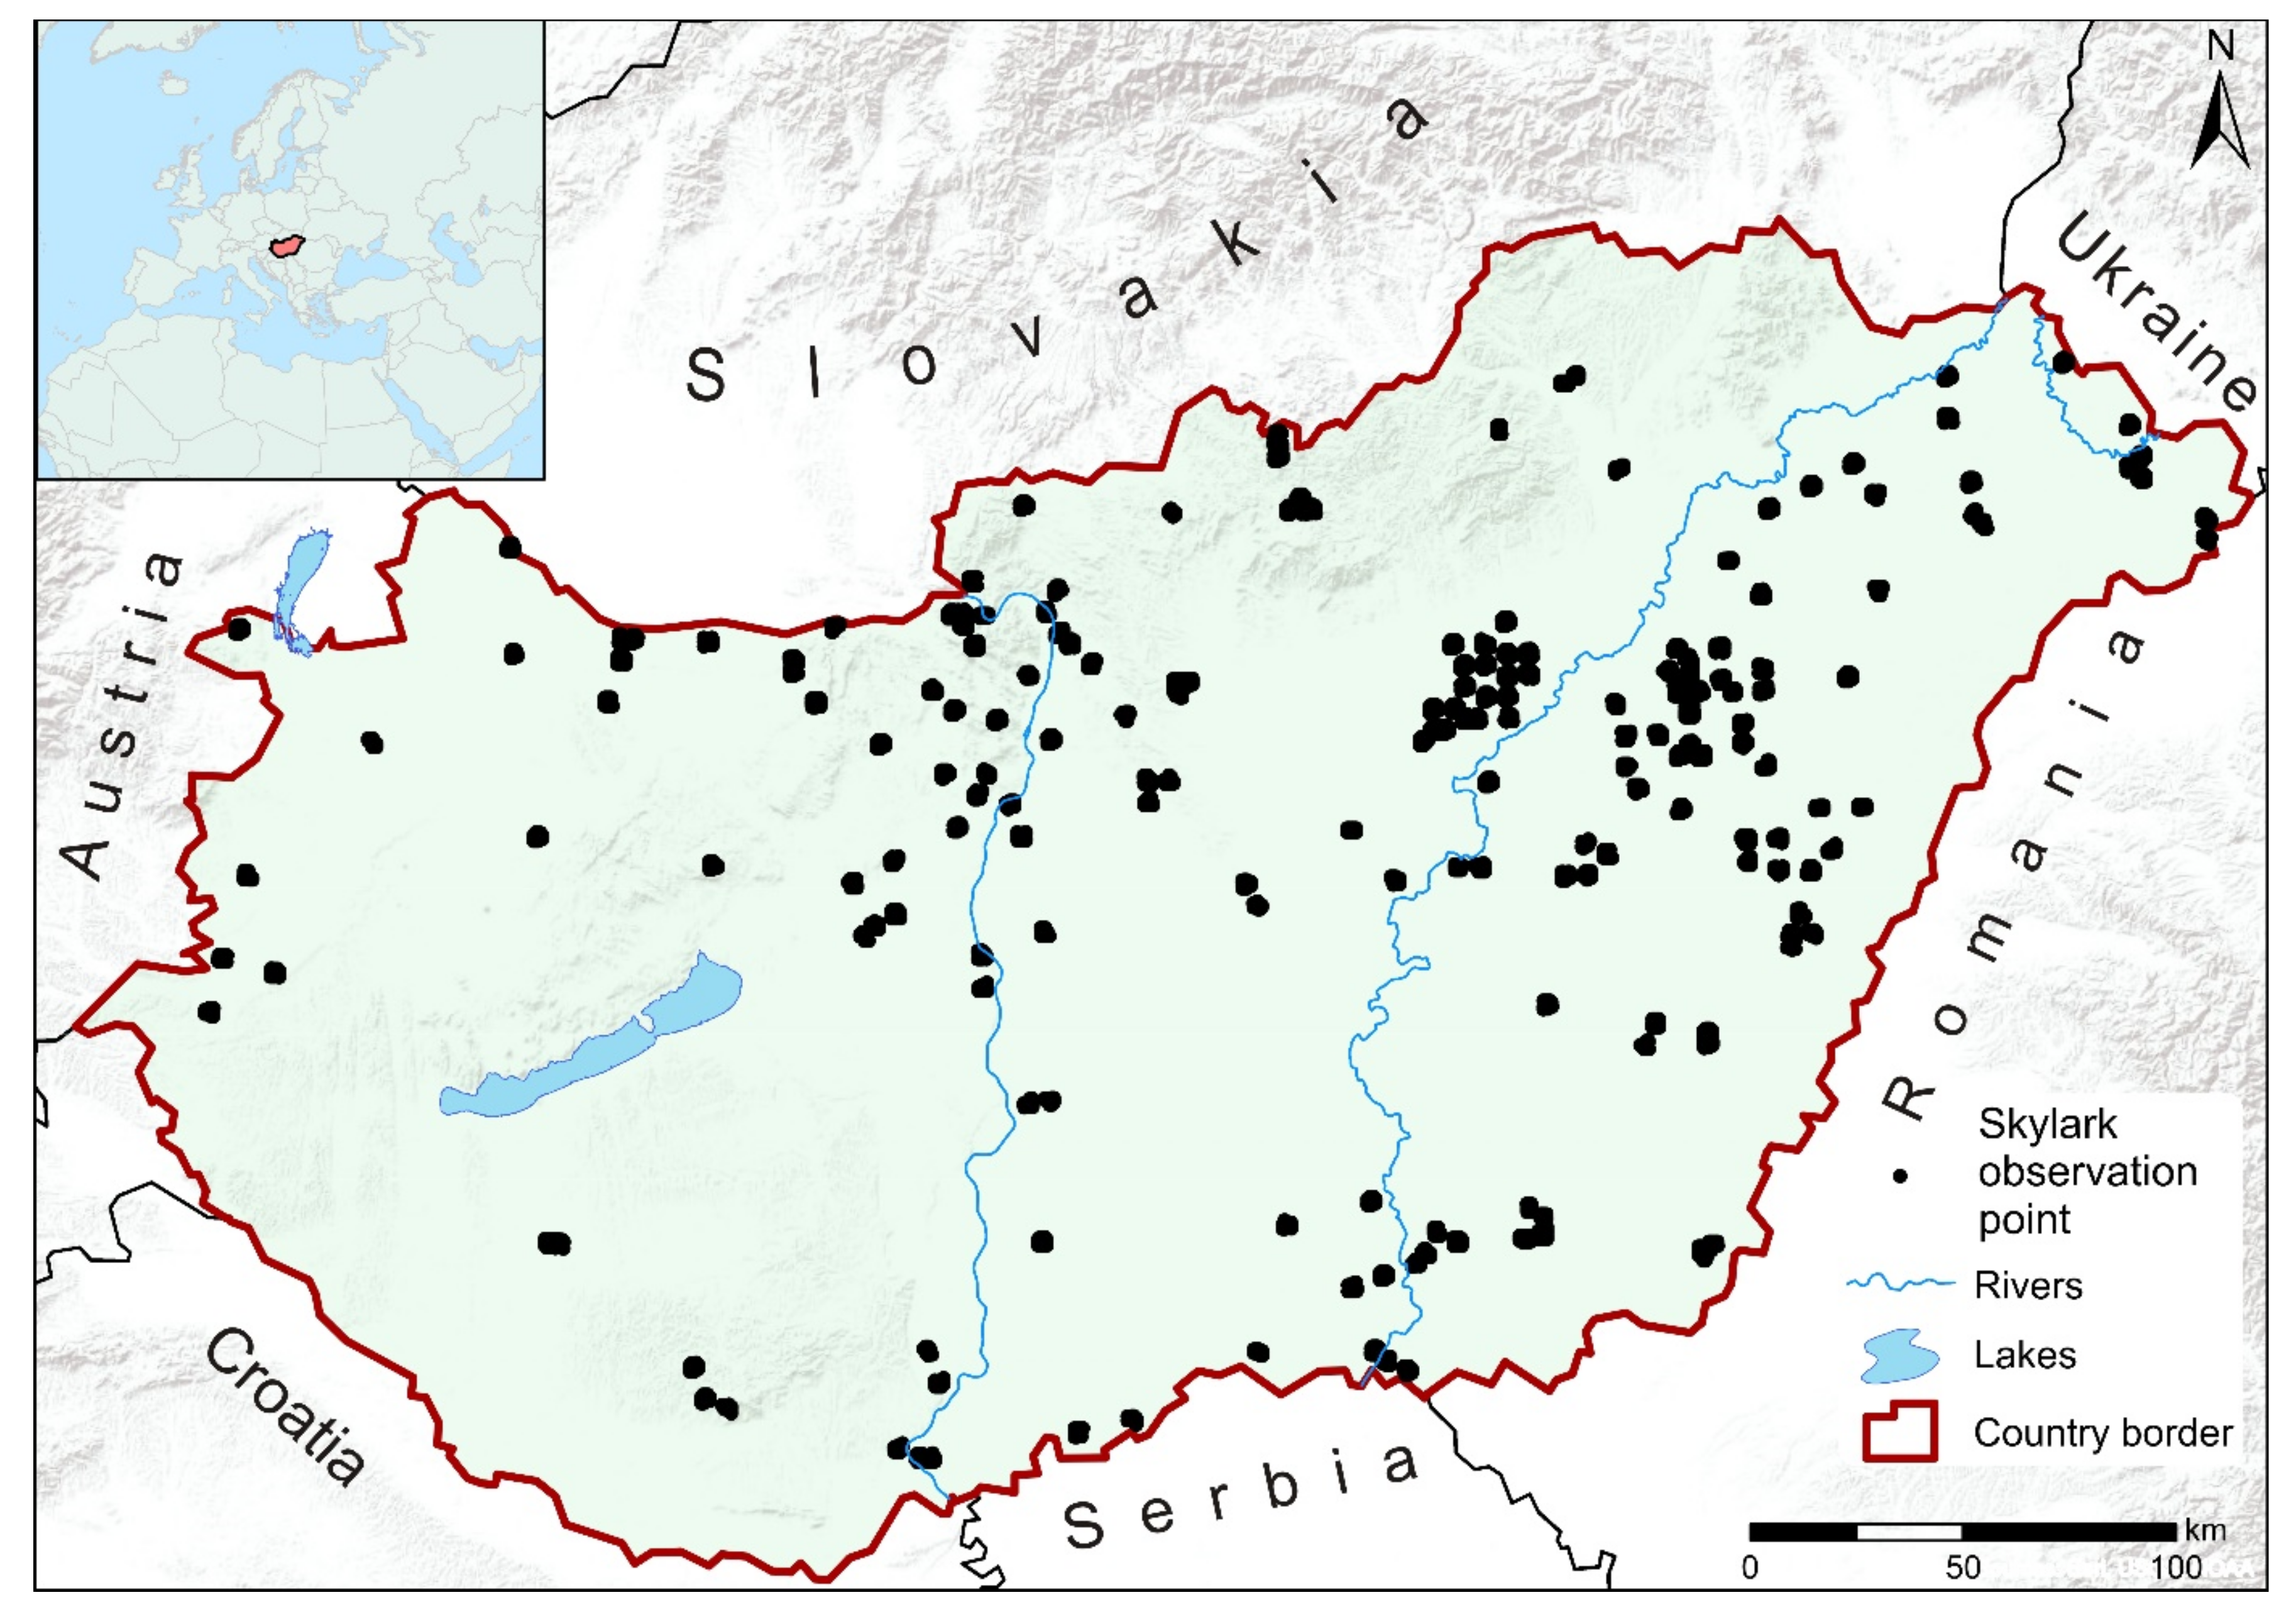
2.1. Study Area

Hungary is located in the Carpathian basin (45°43′ to 48°35′N and 16°06′ to 22°53′E) in central Europe, and is part of the Pannonian biogeographical region (Figure 1). The total area is 93,033 km*, and its elevation ranges from 77 to 1014 m a.s.l. The most important land-cover type (61%) is agricultural land [31]. A further 20.7% is natural and seminatural grasslands and forest, and 5.5% is built-up area. In the 1990s, a dramatic landscape change was mainly caused by land privatization. Agricultural lands with low quality and poor agroecological conditions were abandoned [32]. The common agricultural policy of the EU (strong decline of grazing livestock) and land abandonment caused the transformation of arable lands into non-cultivated lands, and the fast and spontaneous reforestation of open grasslands [33].

2.2. Databases

2.2.1. Skylark-Abundance Data

In Hungary, a countrywide bird-monitoring survey has been conducted every year (like in 2015) by approximately 800 field surveyors who add their field-observation datasets into the Hungarian Common Bird Monitoring Database (MMM) [34,35,36]. The volunteers were not randomly distributed across Hungary. The survey allowed that the observers choose their area of observation. Each observation point received two spring visits, and the abundance of birds was observed (by hearing and visually) within a 100-m radius of each point. There is a minimum 500 m distance between the observation points. The surveyors left a minimum of two weeks between visits in mid-April and mid-June. The count was accomplished between 5:00 and 10:00, when wind speed was less than 5 m/s and there was no rain. Each observation point contains the average number of observed birds which were counted at the point in the two spring visits [34,35]. In 2015, surveyors counted 6763 skylark individuals across 3049 field observation points (mean value: 2.22, maximum: 34, standard deviation: 4.38.). We used MMM survey points from 2015 in the study area because the HUB land-cover map was also available from that time scale. We analyzed the proportion and spatial configuration of the landscape in the 600 m radius surrounding of the MMM observation points. 600 m buffer zone was chosen, because many author found that landscape composition and land cover types have the highest impact on the abundance of this species within this radius [10,37]. Land use types also have an effect on abundance of skylark population within 600 m buffer radius [38]. We used a very detailed (20 × 20 m mapping units) country scale LULC HEB maps [39] for analyses of the LULC characteristics inside these buffer zones. Unfortunately, the more detailed country scale statistical datasets about the crop structure surroundings of the observation points were not available. Most of the MMM observation points (43%) is situated inside the NATURA 2000 SPA Protected areas, where the grasslands are mowed one-time every year after 15th of June.

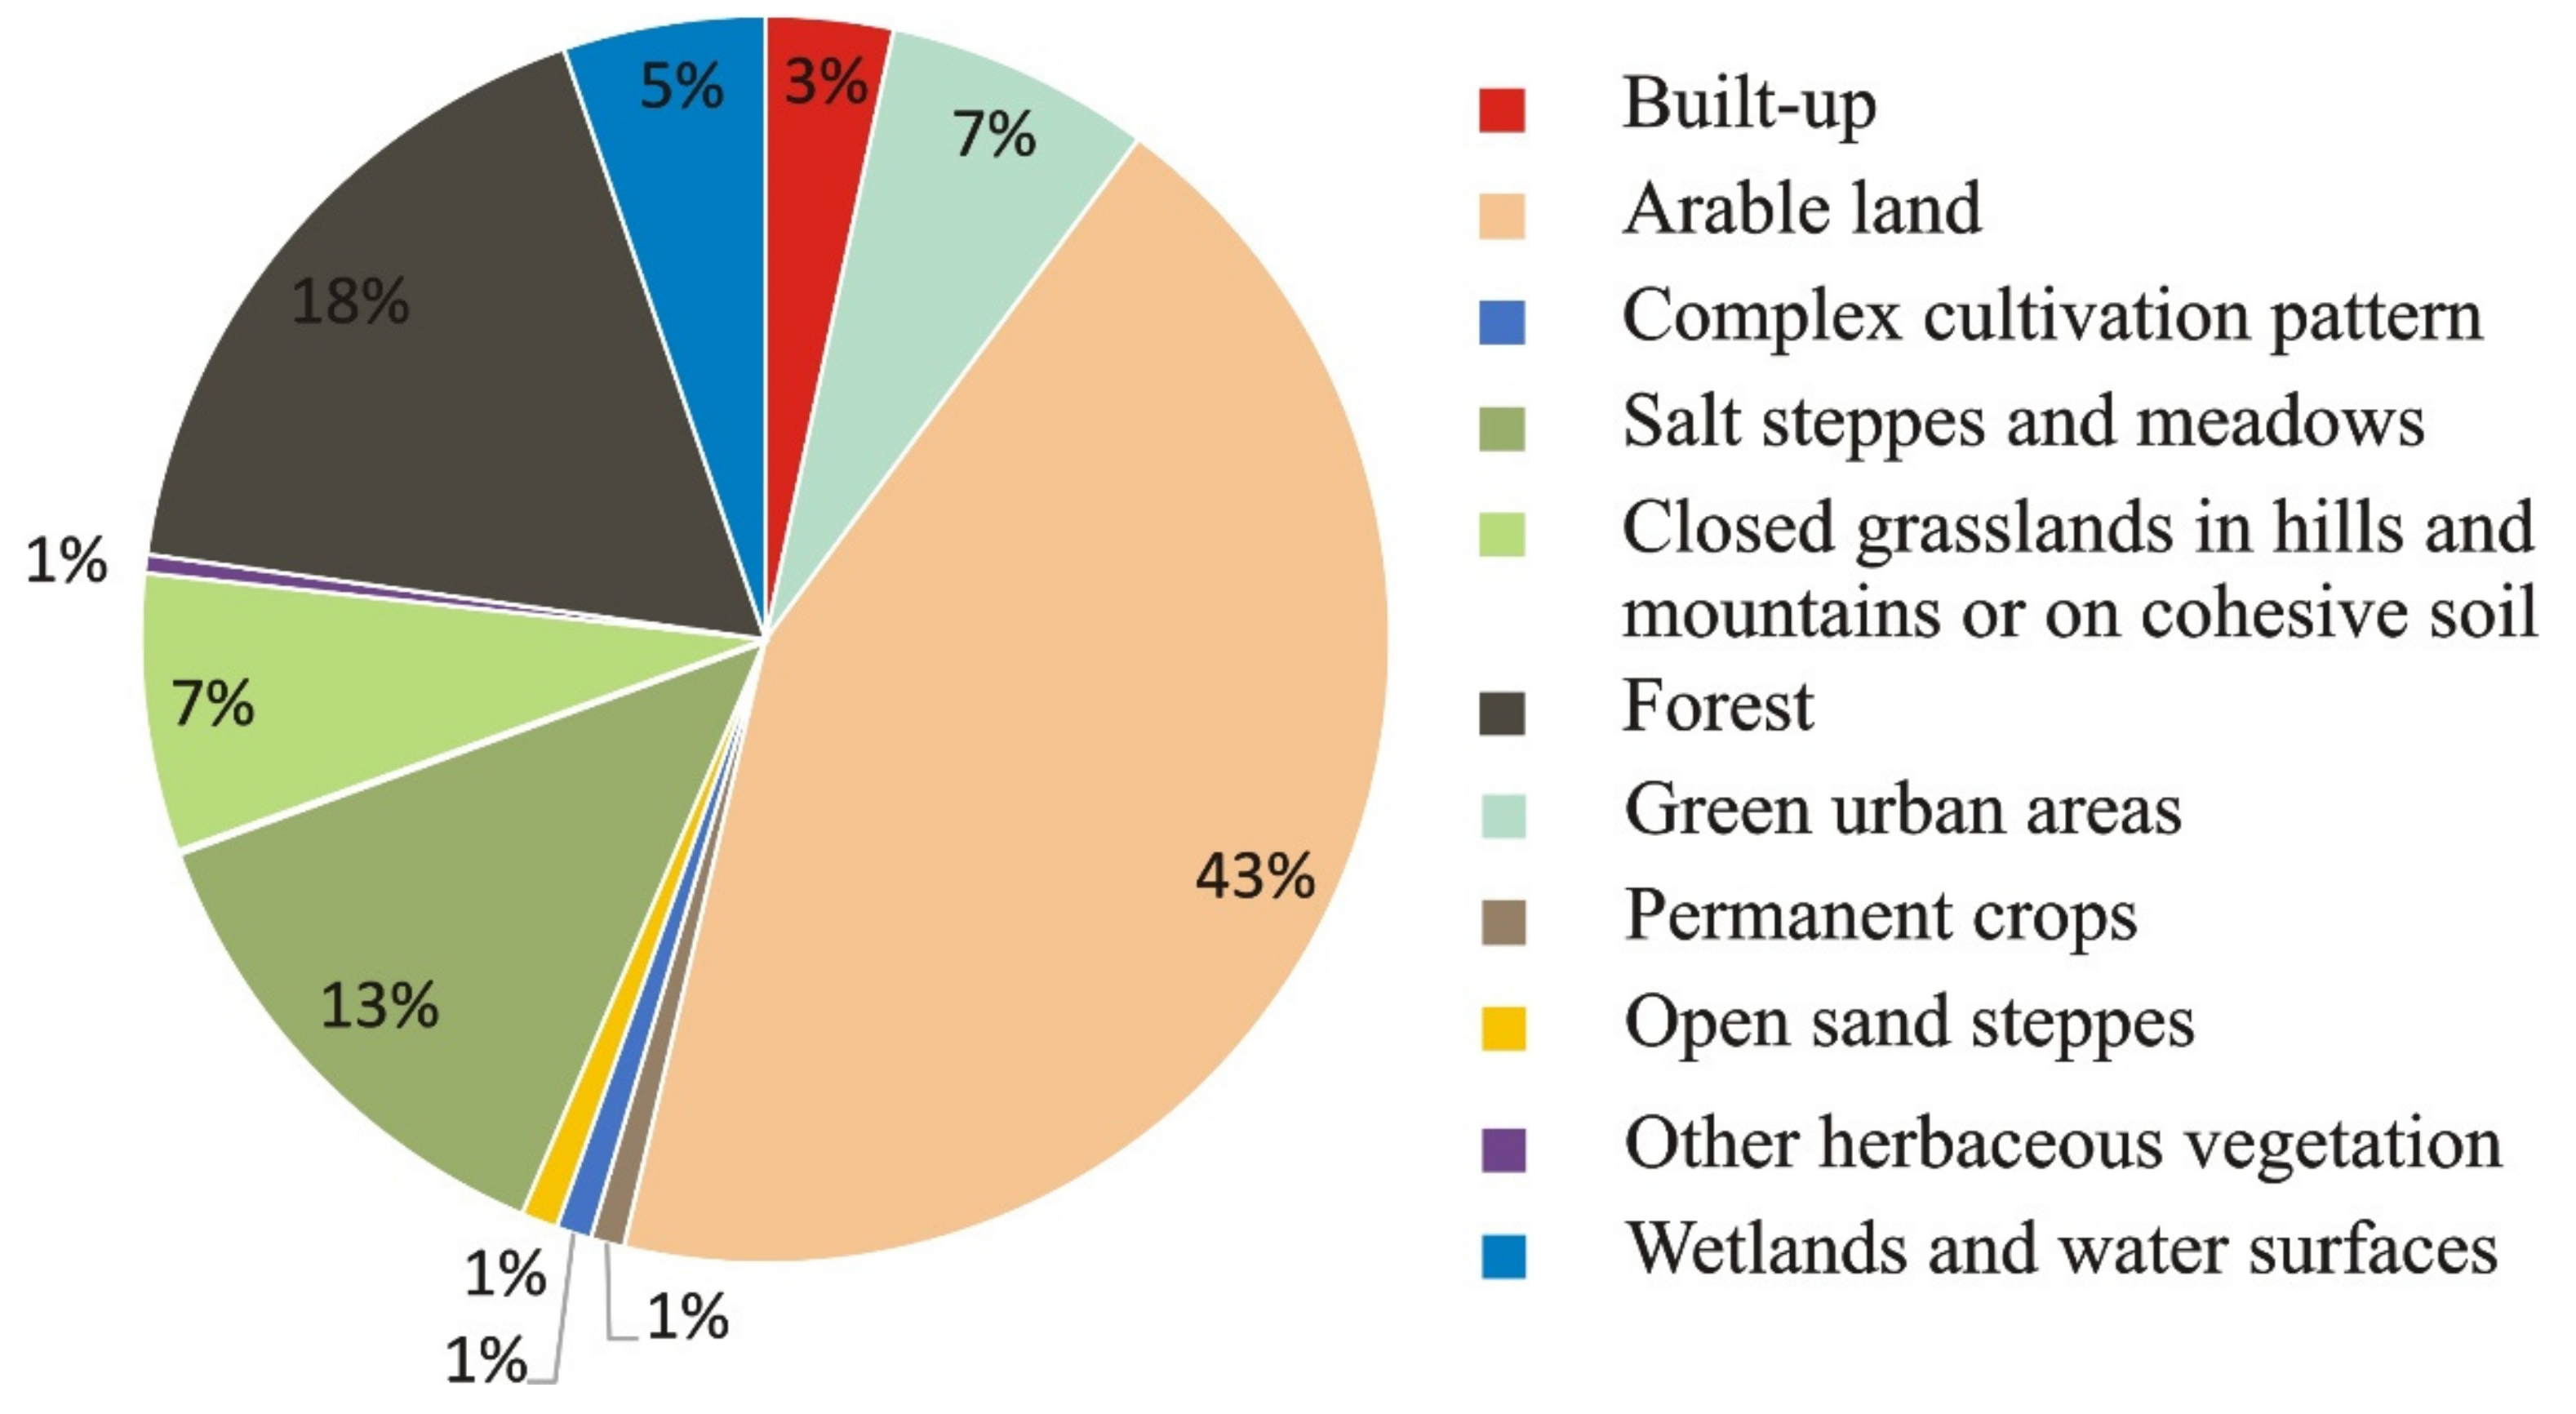
2.2.2. Land-Cover Database—Hungarian Ecosystem Basemap

The digital LULC HEB was created by the Hungarian Ministry of Agriculture. The basis year of this database is 2015. This very high resolution LULC dataset was based on other LULC maps of the European Copernicus Program, such as Urban Atlas, Corine Land Cover and High-Resolution Layers, and Sentinel-2 images. The dataset has a 20 × 20 m resolution (minimal mapping unit) and three category levels. Six classes in Level 1, 22 classes in Level 2, and 56 classes in Level 3 (see Appendix A Table A1). The database also contained three additional LULC categories in Level 4. We used the second level for analysis, and regrouped the LULC classes to reduce the number and the likelihood of autocorrelation between them. Our dataset for statistical analyses contained the following main LULC categories inside the buffer zones (Figure 2.):
In our investigations, we aggregated the LULC categories of the HEB database, such as “forest”, “wetlands and water surfaces” LULC categories (Table A1). The HEB web map and its documentation are freely available (downloadable) on this website: http://alapterkep.termeszetem.hu/ (accessed on 15 February 2021). [39]. 46% of the country is arable land and cereals take the 62% of the arable lands. According to the country scale statistical datasets, the proportion of the crop structure in Hungary is 23% wheat, 26% grain maize, 14% sunflower, 7% barley, 5% rape and 7% fodder crops inside the arable lands (Hungarian Central Statistical Office [40]).

2.3. Landscape Metrics

The HEB database was applied to calculate size- and shape-related landscape metric parameters. Patch-level landscape indices were calculated for each LULC patch of the HEB database with the V-LATE 2 extension of Arc GIS 10.3 software [41]. Patch level metrics, created for individual land cover patches, characterize the spatial character and context of patches. These patch metrics serve primarily as the computational basis for developing a landscape metric. During our landscape metrics analyses, we calculated the following patch-level landscape metrics, which represent size and shape characteristics of land-cover patches (Table 1). The mean patch size (MPS) has been widely applied in landscape ecology, since it is commonly agreed that the occurrence and abundance of different species and species richness strongly correlates with the mean patch size. The shape complexity of individual LULC types was quantified by using landscape metrics (MFRACT). We applied the Shannon Diversity Index (SDI) to determine the landscape heterogenety [25]. We calculated these landscape indices (MPS, MFRACT, SDI) inside the 600 m radius buffer zones.

2.4. Statistical Analyses

To understand the relationship between LULC types and skylark abundance, first we had to identify those LULC categories which are selected (used as habitat) by skylark or are avoided. We applied a preliminary test to identify the group of correlated land-cover and landscape index variables using variance inflation factors (VIFs), and the explanatory variables were not linearly related. VIF values were between 0 and 1.9, which shows that the multicollinearity is low between the variables (LULC types and indices). The arable-land category was ignored from statistical analyses (model) because in Hungary and other European countries, the agricultural land is the matrix (dominant LULC type) in the landscape, so the proportion of this category shows strong autocorrelations with other LULC types. We used generalized linear models (GLM) to determine the impact of land cover and landscape structure (composition) on skylark abundance. We applied negative binomial models (link = log) to account the overdispersion of skylark-abundance data (tested by overdispersiontest function of AER package in R). Models with all possible combinations of explanatory variables were generated, and we established Akaike’s information criterion to rank them with the “dredge” function from the MuMin package in R [44]. We used model averaging for competitive models (delta AICc < 2) to include uncertainty arising from the high number of candidate models (Table A3) [45]. The significance of the variables was estimated by the LmerTest package [46]. We constructed two groups from the LULC categories of the HEB database based on GLM results, namely, preferred (significant positive relation) and nonpreferred (significant negative relation) land-cover types. We analyzed the relationship between the landscape metrics of the preferred (as habitats) and nonpreferred land-cover types, and the skylark abundance data with negative binominal GLM and model averaging. In the next step in our investigation, we analyzed the shape and size characteristics of those LULC types which showed significant positive relation with skylark abundance. These land-cover types were separated into arable lands and grasslands because we wanted to analyze the effect of arable land and grassland landscape metrics on the skylark population. In this model, the arable land category has been used. The distribution of landscape metric variables was not normal, so logarithmic transformation was used to normalize the data. These variables were in different dimensions, so we created a range function in R that transformed the variable values into a number between 0 and 1:
R a n g e   f u n c t i o n = x min x , n a . r m = T max x , n a . r m = T min x , n a . r m = T ,
where Range function is a number that describes the given number between 0 and 1, na.rm = T means that NA values were removed, min is the minimal value of the list, and max is the maximal value of the list. On the basis of the output of the statistical model, we could describe the optimal landscape configurations for this species.

2.5. Model Validation

We calculated the predicted marginal effects (ggeffects package in R) of the preferred land-cover types and their landscape metrics on the skylark population [47]. To validate our model, we set up a training and a testing group (66.6% and 33.3% proportion, respectively) with random sampling (sample.split function from caTools 1.17 package) on the basis of our dataset in R statistics software. We used the predict function from the car package to calculate the estimated skylark-abundance data. Model accuracy was measured by three indices: Spearman’s rank correlation to show the relationship between observed and predicted values, mean absolute error to show the distance of the predicted values from the observed values [48], and mean absolute percentage error to show the percentage of error between observed and predicted values [49].

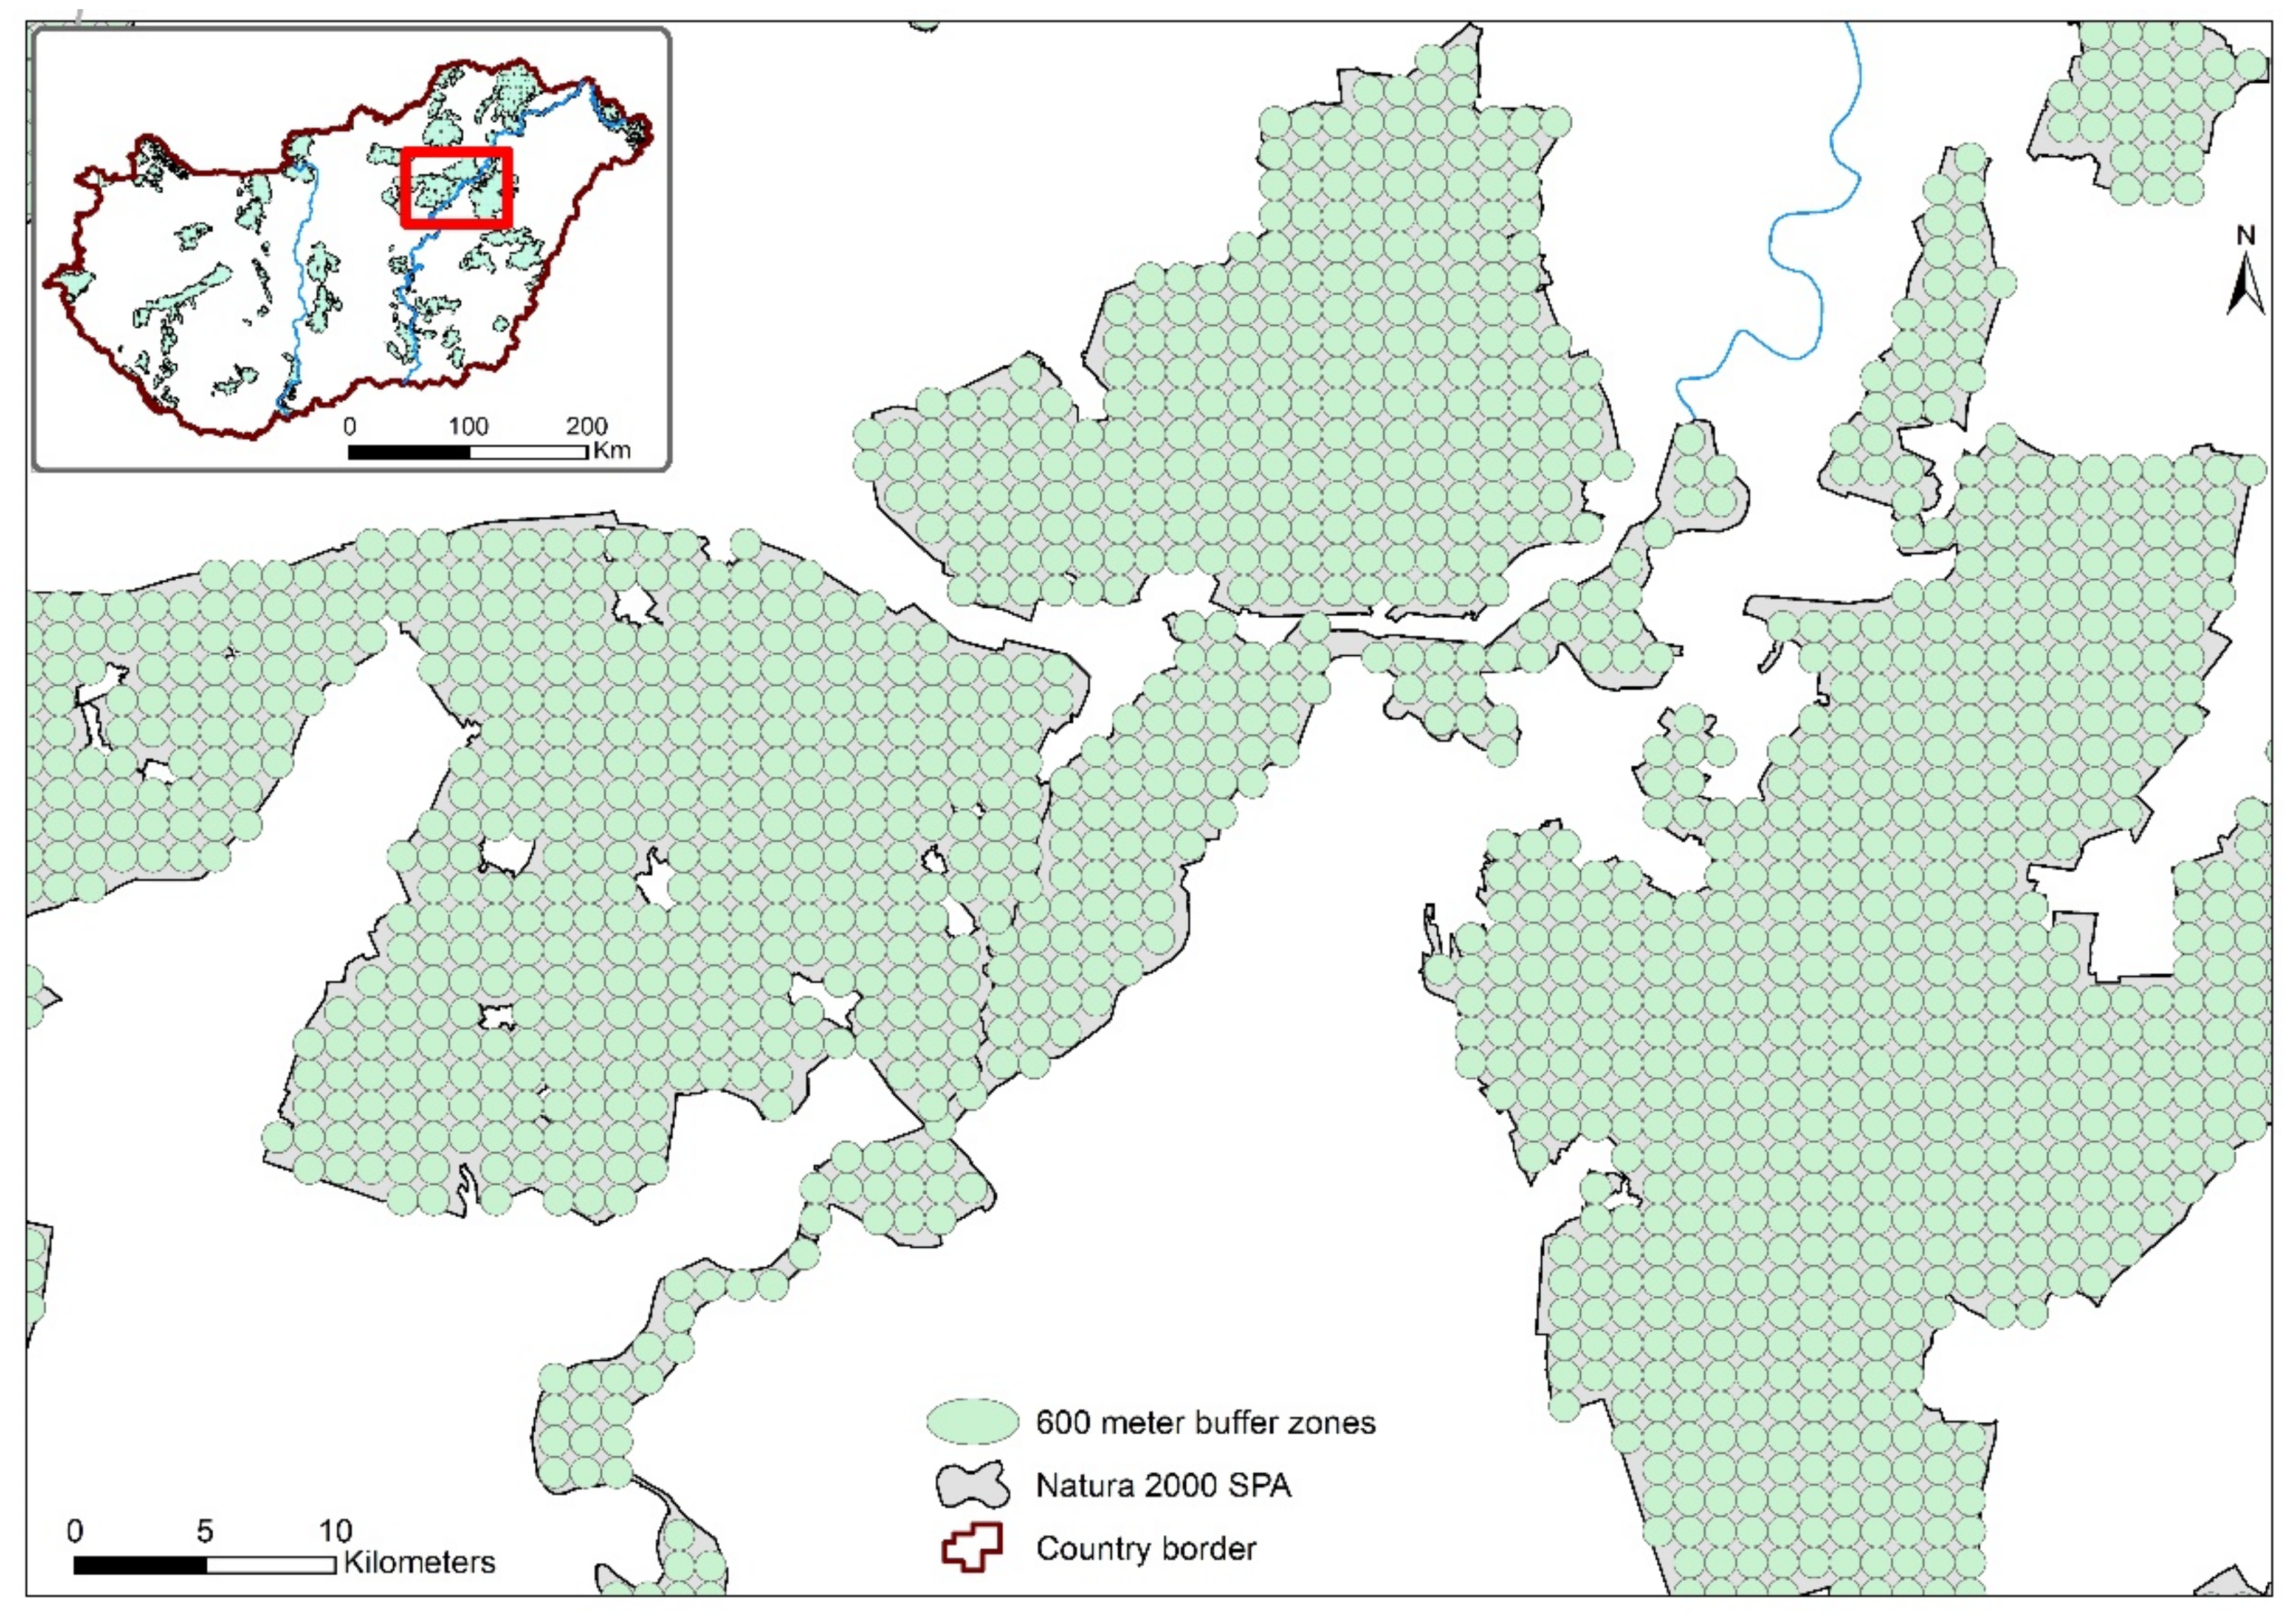
2.6. Prediction of Skylark Population in Natura 2000 SPAs

We could estimate skylark population density using the 600 m buffer areas and the HEB dataset. The centers of the buffer zones were in a regular grid (1200 × 1200 m) inside the Natura 2000 SPA dataset. We used the Natura 2000 SPA areas as the basis of our prediction site, because of the Eurasian skylark is a very common indicator species of agrarian landscapes (Natura 2000 Annex I. list). In Hungary the Natura 2000 SPA areas are typical agrarian landscapes which contain Urban areas (1.5%), Croplands (31.7%), Grasslands and other herbaceous vegetation (21.7%), Forest and woodlands (27.8%) and wetland and water surfaces (17.2%). Mowing of the grasslands inside the Natura 2000 sites is regulated by the law. The mowing machine should cut the grass 10 cm above the soil surface. Mowing should not begin before 1 of July, to protect the ground nesting birds. The number of the animals and the method (it is different based on the grassland type) are also regulated by the law. Prediction was performed based on the model results that analyzed the connection between the preferred area and the landscape metrics. Landscape indices were calculated inside the Natura 2000 SPAs. The estimated skylark population was calculated by the predict function in R software. Figure 3 shows the spatial distribution of the 600 m buffer zones.

3. Results

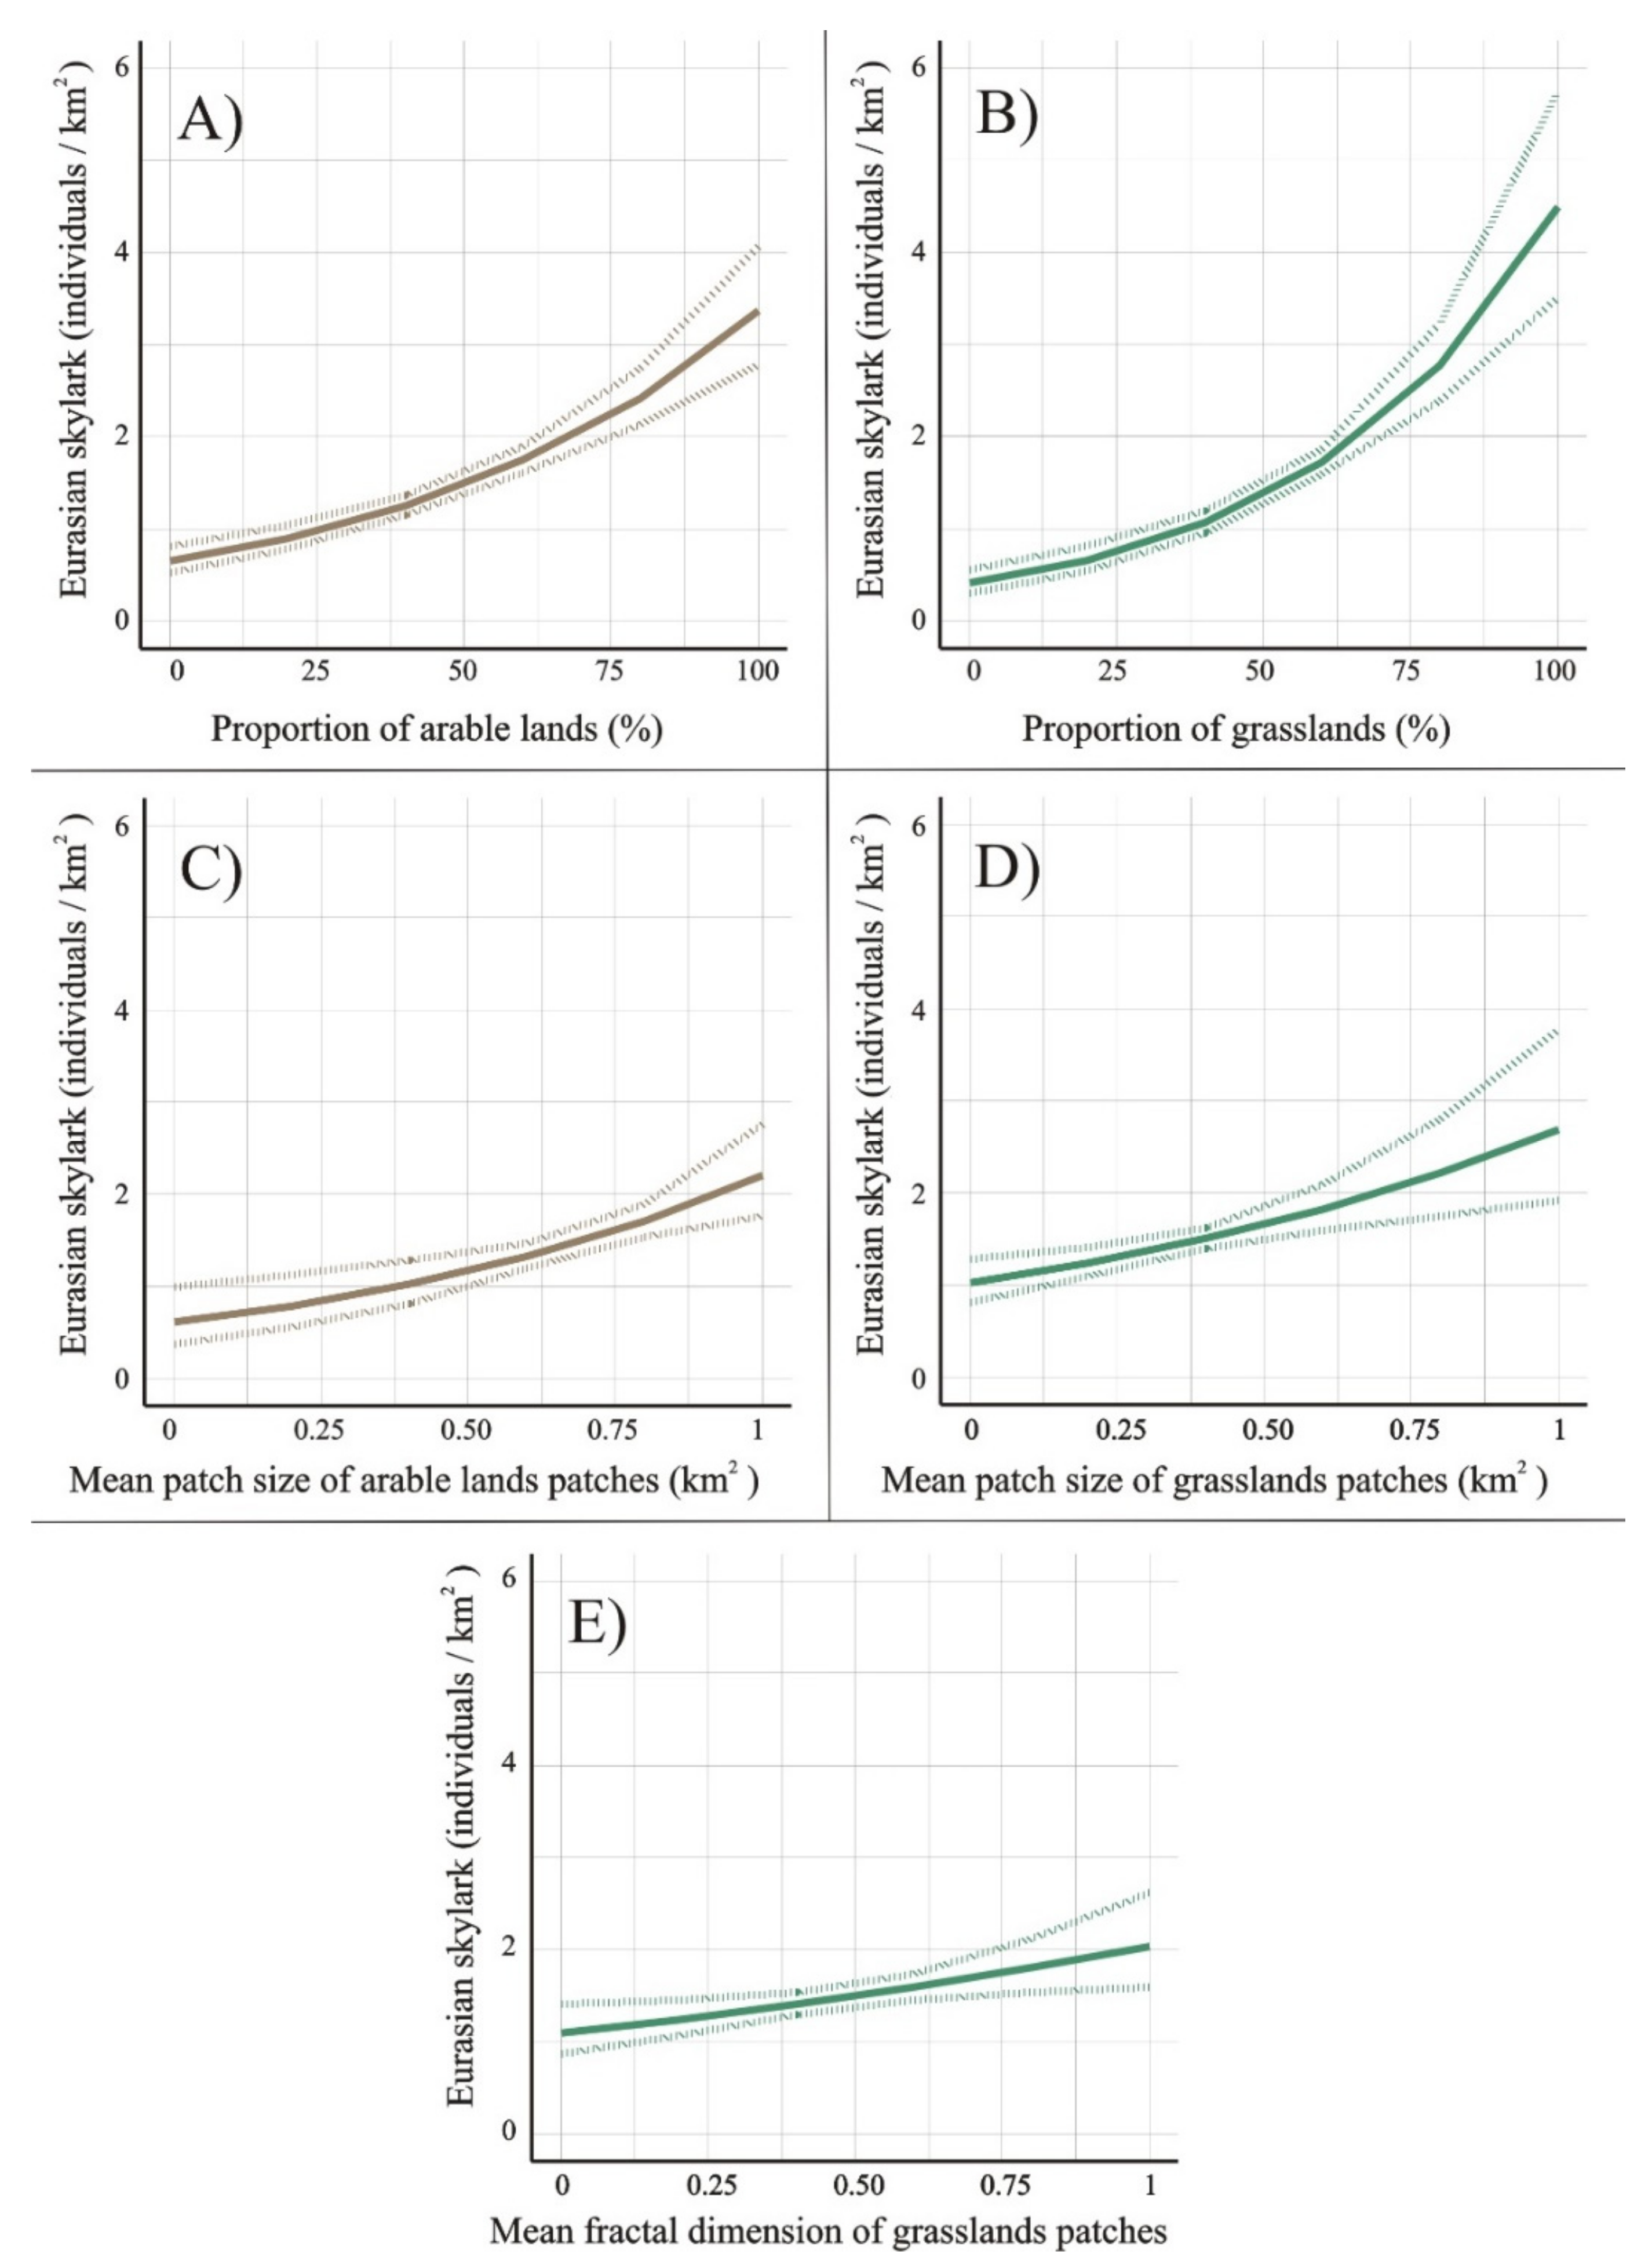
3.1. Relationship between Land-Cover Proportions and Skylark Abundance

Based on GLM results, we identified two main groups (classes) of the LULC categories of the HEB database. Preferred LULC categories that were considered the habitats of the Eurasian skylark because they showed significant positive relation with skylark abundance were those such as salt steppes and meadows, and closed grasslands in hills and mountains. The closed-grasslands LULC category showed the highest significant relation, thereby having the most important effect on skylark abundance. The arable-land LULC category is also a preferred category according to the literature [11,18,29,50]. The nonpreferred group (class) of LULC categories contains land-cover types with significant negative relations with skylark abundance: built-up land, green urban areas, complex cultivation patterns, forests, and wetlands and water surfaces. The complex-cultivation-pattern LULC category had the strongest negative association with the skylark population, followed by wetland and water surfaces, and green urban areas. The relative importance of the significant variables was 100% in all cases (Table 2).

3.2. Relationship between Landscape Structure (Compositon) and Skylark Abundance

The landscape metrics that describe the shape and size characteristics of the preferred and nonpreferred LULC classes showed different directions of significant relation with skylark abundance (Table 3). The metrics that describe the shape complexity and size of the LULC patches of preferred LULC categories of the HEB database showed significant positive relations with skylark abundance. The shape complexity (MFRACT index) of the preferred LULC patches has stronger influence on the skylark abundance than the mean patch size (MPS). The shape complexity and size of the nonpreferred LULC categories had significant negative relation with skylark abundance in this case, MPS had higher association with skylark abundance. (Table 3). Land-cover heterogeneity, described with SDI, had a significant negative effect on skylark abundance, which showed that this species prefers a homogeneous landscape.

3.3. Impact of Preferred Land-Cover Categories and Their Landscape Metrics

Total grassland proportion had the highest association with skylark abundance, as shown in Table 2; the average size of arable-land patches (MPS) was more important from an abundance point view of this species than the mean patch size (MPS) of grassland patches. The complexity of grassland patches (MFRACT) had a significant positive association with skylark abundance, while the shape characteristics of arable land had no significant relationship with skylark abundance. The predicted marginal-effect graphs visualize the above-described connections between proportions of LULC categories, size- and shape-related landscape indices, and the estimated population density changes of the skylarks (Figure 4). According to the modeled population density changes, in the case of 100% grassland coverage of a hypothetical landscape, we could find about 4–6 skylark individuals/km*. While the connection between the change in proportions of different land-cover types showed a near exponential curve, landscape metrics showed almost flat linear connections with estimated skylark abundance.
On the basis of our results (Table A2), we could create an equation that describes and estimates the skylark population in a given landscape:
S k y l a r k p o p u l a t i o n =   3.24 + 1.29 M P S a r a b l e   l a n d + 0.97 M P S g r a s s l a n d +
0.63 M F R A C T g r a s s l a n d + 1.65 A r e a a r a b l e   l a n d + 2.4 A r e a g r a s s l a n d
where S k y l a r k p o p u l a t i o n is the skylark number density (individual/km*), MPSarable land is the mean patch size of arable land, MPSgrassland is the mean patch size of grasslands, MFRACTgrassland is the mean fractal dimension of grasslands, Areaarable land is the proportion of arable land, and Areagrassland is the proportion of grasslands.

3.4. Model Validation

According the validation of our results, there was a significant Spearman’s correlation between the observed and predicted skylark abundance values. Mean absolute error shows the distance between the predicted and observed abundance values of this species, which is +– 2.12. Mean absolute percentage error (MAPE) shows the prediction accuracy of the model in percentage; in this case, it was 37.77%. The accuracy of this model based on the MAPE was 62.23% (Table 4). If the model contains just the land cover types, the MEA is 2.95; MAPE is 46.56% and the Spearman correlation coefficient is 0.493.

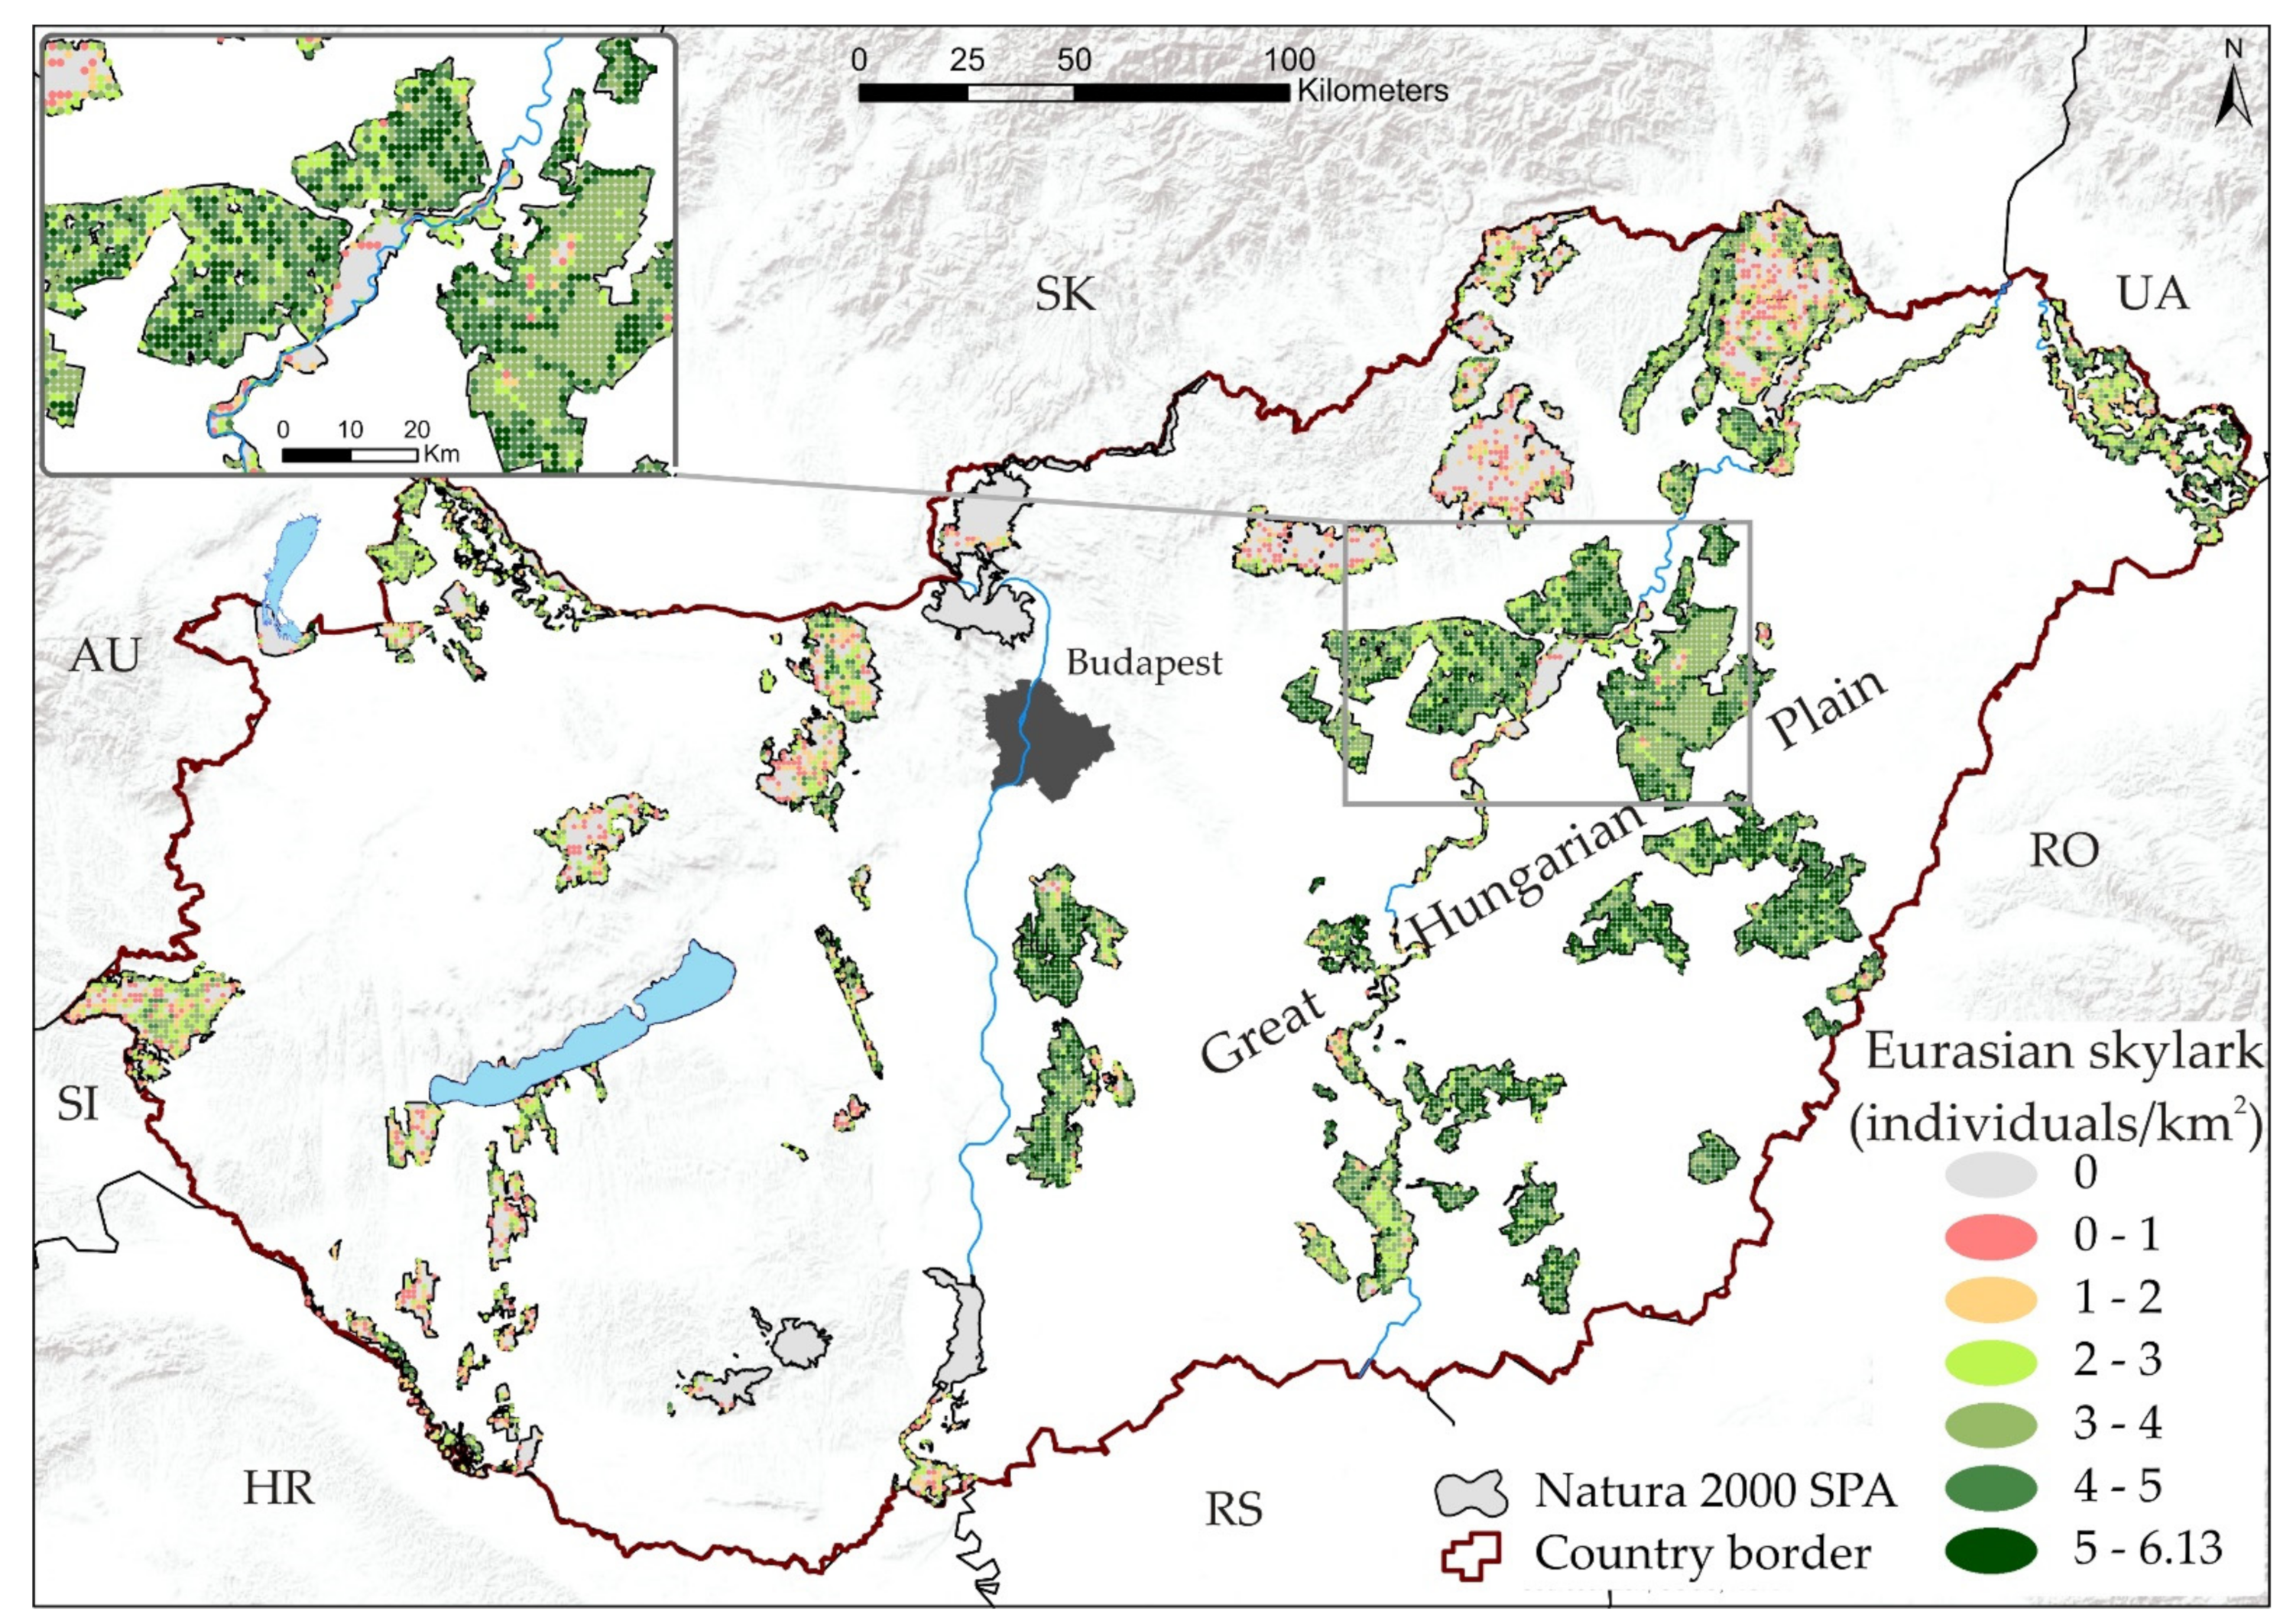
3.5. Prediction of Skylark Population of Natura 2000 Special Protection Areas of Hungary

The spatial distribution of the predicted skylark population in each 600-m zone of the Natura 2000 SPAs of Hungary was very diverse (Figure 5). The total investigated Natura 2000 SPA was 13,514 km** which cover the most valuable agroecosystems and rural landscapes of Hungary. Based on model prediction (predict function in R) inside these protected areas, approximately 23,746 skylark individuals were predicted. The density of this species is the highest in the agricultural-landscape-dominated areas of the great Hungarian plain.

4. Discussion

There are several publications analyzing the relationship between skylark and LULC [4,51,52,53,54] in local small study areas, but our very detailed LULC dataset (HEB) offers a unique opportunity to obtain regional (country)-scale information about this relationship In our study, we considered both datasets describing proportions of LULC categories and landscape indices that describe the shape and size characteristics of preferred (habitat) and nonpreferred LULC categories. Based on our research findings, population density (individuals/km*) could be estimated because there was a significant statistical relationship between proportions, the shape and size characteristics of different LULC types, and the abundance of this farmland bird. One new finding from our research is that, for the estimation of skylark population density, it is necessary to consider landscape indices together with the proportions of different LULC categories because shape (mean fractal dimension) and size (mean shape size) characteristics of these LULC categories also have significant association with skylark abundance. Based on our finding we have predicted the number skylarks inside the Natura 2000 SPA areas in Hungary.

4.1. Impact of Proportions of LULC Categories on Skylark Abundance

We could select two LULC groups (classes) from the land-cover types of a very detailed (20 × 20 m resolution) LULC map. Nonpreferred types had negative significant relation with skylark abundance. These were built-up and green urban areas, which negatively affected the population because of the lack of openness and the high proportion of constructed surfaces. Our findings are confirmed by other international publications [4,6,10]. The complex cultivation pattern land-cover type has negative significant relation with skylark data. Other authors underlines that the skylarks do not prefer heterogeneous agricultural lands because this rural landscape contains many different LULC patches, including also those that are not preferable to the skylark, like vineyards, fruit and berry plantations (because of its height, they obscure the view) [10,11,16,17]. Small parcels of, annual crops, city gardens pastures, fallow lands and/or permanent crops somewhere with scattered houses. Forest and wetland LULC categories are well-known nonpreferred land-cover types of the skylark. The skylark is a typical farmland bird; therefore, it is not a surprise that wetland areas, water bodies, and water courses are not suitable habitat types for this species. The main reason of the negative significant relation of the forest is the lack of openness, which is very important for the skylark [10,11,16,55]. In our research we were not take difference between the type of forests, because according to previous studies every types of forest areas are not habitats of this species.
In the estimation of skylark population density, the preferred land-cover types had higher weights (were more important) than those of the nonpreferred LULC categories. Arable land is a well-known habitat type of this farmland bird species according to the international literature [11,18,19,56,57]. Unfortunately, in Hungary is no available detailed country scale spatial statistical data about the cultivated crop types inside the arable lands (cropland) areas. According to the available most detailed Hungarian LULC dataset, the HEB dataset the 57% of Hungary is covered by agricultural fields and its 81% is arable land (Cropland). Grassland and pasture areas are also preferred LULC categories for skylark, [7,8,10,11,58,59,60,61]. The HEB dataset allow us to analyze the impact of different types of grassland on skylark abundance. We did not find significant statistical relations with open sand steppes and open rocky grasslands because the number of 600 m circle radius observation points of LULC categories have been low, and these landscape conditions (too-fragmented grassland areas with very short and very sparse vegetation) are not suitable for breeding skylarks [57,62]. There was a significant positive relation between skylark abundance, and the LULC categories of salt steppes and meadows, and closed grasslands. Each LULC category is suitable for nesting breeding skylarks because of the medium vegetation height and optimal proportion inside the 600 m radius circles. Our results are similar with those of others, who described strong relationship between closed grasslands and meadows and skylark abundance, the reason of this relation could be the larger amount of food [63,64,65,66]. According to our findings for the prevention of the farmland bird habitats, the EU agri-environmental policy should pay more attention to the management of salt steppes and meadows, and closed grasslands. To increase the population density of skylark, the mean patch size and the proportion of these land cover types (compare to all) in the landscape should increase. In case of the protected grassland areas, one of the biggest ecological problem is the spontaneous spreading of the bush vegetation, which can reduce the skylark habitats. If we want to stop this process, and keep the openness of the landscapes, we should reduce the size and the shape of the bush and forest patches inside these grassland areas. Therefore, we must eradicate the spontaneously spread bush vegetation (which often full of invasive species) by the proper way of grazing or haymaking, the grasslands can keep its size, shape, and openness characteristics in the protected landscapes. This kind of management of protected areas can preserve not only the vegetation diversity of grasslands but it has also important key factor in the skylark habitat protection.

4.2. Impact of Land-Cover Categories and Their Landscape Metrics

The landscape metrics of the preferred LULC classes showed positive significant relation with skylark abundance, meaning that, if arable-land and grassland proportion and shape complexity was higher, then the skylark population would also be higher. The landscape metrics of the nonpreferred LULC classes showed negative significant relation with the skylark population, meaning that, in landscapes with small size and in compact-shape nonpreferred LULC categories, skylark population density (abundance) would be higher.
LULC landscape heterogeneity has a negative effect on the skylark in this scale, where one land cover patch can contain more parcels. If landscape heterogeneity increases, the skylark population declines. This species prefer the homogenous LULC structures, which is in accordance with the results of other authors [10,11,16,17,62].
The grassland proportion had the highest association with the skylark population. This species usually nests and feeds in grasslands. The proportion of arable land has a high association with skylark abundance, but the level of its significance is lower. In the case of the MPS, the opposite phenomenon was observed: the MPS of arable lands (arable land patches of HEB) had a higher effect on skylark abundance than that of grassland. The skylark does not prefer small size arable lands (parcels) and grassland fields in that scale, where one arable land patch can contain more parcels [7,51,60,64]. According to Uuemaa et al. 2009 most bird species react more strongly to the composition land cover than to the configuration of landscapes [25]. Our results also show that the LULC proportions and mean patch sizes have stronger impacts on the abundance of this species, than the shape (fractal dimension index) characteristics of the habitat patches. The mean-absolute-percentage-error value (37.77%) was acceptable since, for a more precise prediction, we would have to use more variables (e.g., species and quantity of insects, used pesticides, parcel management) that are not accessible in country-scale analysis. We can determine that the landscape indices improved the model accuracy, based on the Table 4.

4.3. Predicted Population Inside the Natura 2000 SPAs

In Hungary, the latest estimated country-wide Eurasian skylark population is from 1999–2002. There is no spatially detailed population estimate. This study is the first estimate for Natura 2000 protected areas in Hungary. There some early 2000s studies about the skylark densities in Europe (Table 5).
The studies listed above do not use the shape and size related landscape indices for estimation of the skylark abundance (density). With the combination of the detailed point-based bird census data, detailed country-wide LULC dataset and landscape indices we can get a more precise prediction of skylark population. Our results are comparable with these previous estimations and the density values are similar [63,67,68,69].

5. Conclusions

Landscape composition (proportions, and shape and size characteristics of LULC categories) has significant association with the skylark population. The salt steppes and meadows, and closed grassland serve as habitat for the Eurasian skylark. This study provides new information about the relationship between landscape metrics of the habitat types (shape and size characteristics of patches) and skylark abundance. Fractal dimension index, which describes the shape complexity of grassland patches has a positive impact on the skylark abundance, while the shape complexity of non-habitat types shows opposite relationships with the skylark density. We analyzed them together and could estimate the association of these landscape composition variables (proportions, shape and size characteristics of LULC classes) with skylark abundance. We could estimate skylark population density inside Natura 2000 SPAs in Hungary.
The outcomes of this study can be used for further land use planning, and the habitat design of Natura 2000 SPAs and other protected areas of the rural landscapes. According to our findings, inside the protected areas should increase the proportion, the average size and shape complexity of those LULC types (arable land, salt steppes and meadows, and closed grassland), which shows positive relations with the abundance data of skylark. It is feasible by stopping the spontaneous reforestation and eradicating the spontaneously spread vegetation (especially invasive bush species). The grazing or mowing, the protected grasslands can preserve the size, shape and openness characteristics of these skylark habitats. This kind of environmental management forms help to conserve the habitat types of skylark. The skylark is an area sensitive species and it is an indicator species of farmlands, so the shown methodology is adaptable for analyzing the impact of landscape composition on other farmland bird populations [56,70,71,72]. The skylark is considered as indicator for monitoring of agricultural landscapes, because its abundance shows strong relationships with other farmland bird species [73].

Author Contributions

Conceptualization, N.C. and P.S.; methodology, N.C.; validation, N.C.; writing—original draft preparation, N.C. and P.S.; writing—review and editing, N.C. and P.S.; visualization, N.C.; supervision, P.S.; All authors have read and agreed to the published version of the manuscript.

Funding

This research was funded by the “UNKP-20-3-SZTE-515 New national excellence program of the Ministry for Innovation and Technology”.

Institutional Review Board Statement

Not applicable.

Informed Consent Statement

Not applicable.

Acknowledgments

We thank the anonymous referees for their valuable recommendations and suggestions. We also thank Károly Nagy and MME (Bird Monitoring Centre, MME/BirdLife Hungary) for data provision.

Conflicts of Interest

The authors declare no conflict of interest.

Appendix A

Table A1. The LULC categories of the Hungarian Ecosystem Basemap, and the investigated LULC categories.
HEB LULC CategoriesThe Investigated LULC Categories
Level 1Level 2 CodeLevel 2 (~EUNIS 2)Level 2 CodeLevel 2
Urban11Buildings10Built-up
12Roads and railways
13Other paved or non-paved artificial areas
14Green urban areas14Green urban areas
Croplands21Arable land21Arable land
22Permanent crops22Permanent crops
23Complex cultivation pattern23Complex cultivation pattern
Grasslands and other herbaceous vegetations31Open sand steppes31Open sand steppes
32Salt steppes and meadows32Salt steppes and meadows
33Open rocky grasslands33Open rocky grasslands
34Closed grasslands in hills and mountains or on cohesive soil34Closed grasslands in hills and mountains or on cohesive soil
35Other herbaceous vegetation35Other herbaceous vegetation
Forests and woodlands41Forests without excess water40Forest
42Natural riverine (gallery) forests
43Other forests with excess water
44Plantations
45Non-wooded areas registered as forest, or areas under reforestation
46Other ligneous vegetation, woodlands
Wetlands51Herbaceous-dominated wetlands50Wetlands and water surfaces
52Woodland-dominated wetlands (uncertain translation)
Rivers and lakes61Water bodies
62Water courses
Table A2. Summary table for landscape metrics and LULC categories, which shows the GLM results after multimodel averaging of best candidate models showing relative importance of each explanatory variable on Skylark abundance, estimated parameter values ± Standard deviation. MPS is Mean Patch Size and MFRACT is Mean Fractal dimension.
PredictorsEstimateStandard deviationConf. Int (95%)p-ValueRelative importance (%)
(Intercept)−3.2352 ***0.3579−3.9005–−2.5772<0.001
MPS of arable lands1.2850 ***0.35880.6528–1.9195<0.001100
MPS of Grasslands0.9689 ***0.27550.4145–1.5358<0.001100
MFRACT of arable lands−0.17190.2928−0.7136–0.37450.55731
MFRACT of grasslands0.6255 **0.24090.1657–1.08450.009100
Total area of arable lands1.6482 ***0.19161.2788–2.0202<0.001100
Total area of grasslands2.4023 ***0.27311.8781–2.9262<0.001100
Number of MMM observations (data pairs): 1897, * p < 0.05, ** p < 0.01, *** p < 0.001.
Table A3. Summary table of component models from model averaging.
VariablesdflogLikAICcDeltaWeight
1/2/4/6/7/8/9/10/1111−4658.479339.0200.38
1/2/3/4/6/7/8/9/10/1112−4657.99339.910.890.24
1/2/4/5/6/7/8/9/10/1112−4658.149340.391.370.19
1/2/4/6/7/8/10/1110−4660.29340.481.460.18
1 Built-up, 2 Green urban areas, 3 Permanent crops, 4 Complex cultivation pattern, 5 Open sand steppes, 6 Salt steppes and meadows, 7 Open rocky grasslands, 8 Closed grasslands in hills and mountains or on cohesive soil, 9 Other herbaceous vegetation, 10 Forest, 11 Wetlands and water surfaces.

References

  1. FAO. World Reference Base for Soil Resources 2014 International Soil Classification system for Naming Soils and Creating Legends for Soil Maps; Update 2015; World Soil Resources Reports; FAO: Rome, Italy, 2014. [Google Scholar]
  2. Morelli, F.; Benedetti, Y.; Callaghan, C.T. Ecological specialization and population trends in European breeding birds. Glob. Ecol. Conserv. 2020, 22, e00996. [Google Scholar] [CrossRef]
  3. Toth, G.; Huzui-Stoiculescu, A.; Toth, A.-I.; Stoiculescu, R. How Do Natura 2000 Areas Intersect with Peoples’ Livelihood Strategies in High Nature Value Farmlands in Southern Transylvania? Land 2020, 9, 484. [Google Scholar] [CrossRef]
  4. Guerrero, I.; Morales, M.B.; Oñate, J.J.; Geiger, F.; Berendse, F.; de Snoo, G.; Eggers, S.; Pärt, T.; Bengtsson, J.; Clement, L.W.; et al. Response of ground-nesting farmland birds to agricultural intensification across Europe: Landscape and field level management factors. Biol. Conserv. 2012, 152, 74–80. [Google Scholar] [CrossRef]
  5. Verhulst, J.; Báldi, A.; Kleijn, D. Relationship between land-use intensity and species richness and abundance of birds in Hungary. Agric. Ecosyst. Environ. 2004, 104, 465–473. [Google Scholar] [CrossRef]
  6. Gottschalk, T.K.; Dittrich, R.; Diekötter, T.; Sheridan, P.; Wolters, V.; Ekschmitt, K. Modelling land-use sustainability using farmland birds as indicators. Ecol. Indic. 2010, 10, 15–23. [Google Scholar] [CrossRef]
  7. Moreira, F.; Beja, P.; Morgado, R.; Reino, L.; Gordinho, L.; Delgado, A.; Borralho, R. Effects of field management and landscape context on grassland wintering birds in Southern Portugal. Agric. Ecosyst. Environ. 2005, 109, 59–74. [Google Scholar] [CrossRef]
  8. Piha, M.; Pakkala, T.; Tiainen, J. Habitat preferences of the Skylark Alauda Arvensis in southern Finland. Ornis Fenn. 2003, 80, 97–110. [Google Scholar]
  9. Gil-Tena, A.; De Cáceres, M.; Ernoult, A.; Butet, A.; Brotons, L.; Burel, F. Agricultural landscape composition as a driver of farmland bird diversity in Brittany (NW France). Agric. Ecosyst. Environ. 2015, 205, 79–89. [Google Scholar] [CrossRef]
  10. Szilassi, P.; Csikos, N.; Galle, R.; Szep, T. Recent and Predicted Changes in Habitat of the Eurasian Skylark Alauda arvensis Based on the Link between the Land Cover and the Field Survey Based Abundance Data. Acta Ornithol. 2019, 54, 59. [Google Scholar] [CrossRef]
  11. Csikós, N.; Szilassi, P. Impact of Energy Landscapes on the Abundance of Eurasian Skylark (Alauda arvensis), an Example from North Germany. Sustainability 2020, 12, 664. [Google Scholar] [CrossRef] [Green Version]
  12. Link, P.M.; Schleupner, C. Agricultural land use changes in Eiderstedt: Historic developments and future plans. Coastline Rep. 2007, 9, 928–2734. [Google Scholar]
  13. Borges, F.; Glemnitz, M.; Schultz, A.; Stachow, U. Assessing the habitat suitability of agricultural landscapes for characteristic breeding bird guilds using landscape metrics. Environ. Monit. Assess. 2017, 189, 166. [Google Scholar] [CrossRef] [Green Version]
  14. Moser, D.; Zechmeister, H.G.; Plutzar, C.; Sauberer, N.; Wrbka, T.; Grabherr, G. Landscape patch shape complexity as an effective measure for plant species richness in rural landscapes. Landsc. Ecol. 2002, 17, 657–669. [Google Scholar] [CrossRef]
  15. Schindler, S.; von Wehrden, H.; Poirazidis, K.; Wrbka, T.; Kati, V. Multiscale performance of landscape metrics as indicators of species richness of plants, insects and vertebrates. Ecol. Indic. 2013, 31, 41–48. [Google Scholar] [CrossRef]
  16. Berg, Å.; Wretenberg, J.; Zmihorski, M.; Hiron, M.; Pärt, T. Linking occurrence and changes in local abundance of farmland bird species to landscape composition and land-use changes. Agric. Ecosyst. Environ. 2015, 204, 1–7. [Google Scholar] [CrossRef] [Green Version]
  17. Redlich, S.; Martin, E.A.; Wende, B.; Steffan-Dewenter, I. Landscape heterogeneity rather than crop diversity mediates bird diversity in agricultural landscapes. PLoS ONE 2018, 13, e0200438. [Google Scholar] [CrossRef] [Green Version]
  18. Praus, L.; Weidinger, K. Breeding Biology of Skylarks Alauda arvensis in Maize and Other Crop Fields. Acta Ornithol. 2015, 50, 59–68. [Google Scholar] [CrossRef]
  19. Hoffmann, J.; Wittchen, U.; Berger, G.; Stachow, U. Moving window growth—A method to characterize the dynamic growth of crops in the context of bird abundance dynamics with the example of Skylark (Alauda arvensis). Ecol. Evol. 2018, 8, 8880–8893. [Google Scholar] [CrossRef] [Green Version]
  20. Loretto, M.C.; Schöll, E.M.; Hille, S. Occurrence of Eurasian Skylark Alauda arvensis territories in relation to urban area and heterogeneous farmland. Bird Study 2019, 66, 273–278. [Google Scholar] [CrossRef]
  21. The Birds Directive—Environment—European Commission. Available online: https://ec.europa.eu/environment/nature/legislation/birdsdirective/index_en.htm (accessed on 15 February 2021).
  22. Csörgo, T.; Karcza, Z.; Halmos, G.; Magyar, G.; Gyurácz, J.; Szép, T.; Bankovics, A.; Schmidt, A.; Schmidt, E. Hungarian Bird Migration Atlas; Kossuth Kiadó: Budapest, Hungary, 2009; ISBN 978-963-09-5865-3. [Google Scholar]
  23. Cramp, S. The Birds of the Western Palearctic; Oxford University Press: Oxford, UK, 1988. [Google Scholar]
  24. Campbell, R.W.; Van Damme, L.M.; Johnson, S.R.; Donald, P.; Garcia, E. Eurasian Skylark (Alauda arvensis). In Birds of the World; Cornell Lab of Ornithology: Ithaca, NY, USA, 2020. [Google Scholar]
  25. Uuemaa, E.; Antrop, M.; Roosaare, J.; Marja, R.; Mander, Ü. Landscape Metrics and Indices: An Overview of Their Use in Landscape Research. Living Rev. Landsc. Res. 2009, 3, 28. [Google Scholar] [CrossRef]
  26. Uuemaa, E.; Mander, Ü.; Marja, R. Trends in the use of landscape spatial metrics as landscape indicators: A review. Ecol. Indic. 2013, 28, 100–106. [Google Scholar] [CrossRef]
  27. Szilassi, P.; Bata, T.; Szabó, S.; Czúcz, B.; Molnár, Z.; Mezősi, G. The link between landscape pattern and vegetation naturalness on a regional scale. Ecol. Indic. 2017, 81, 252–259. [Google Scholar] [CrossRef] [Green Version]
  28. Walz, U. Landscape structure, landscape metrics and biodiversity. Living Rev. Landsc. Res. 2011, 5, 3. [Google Scholar] [CrossRef]
  29. Schlager, P.; Ruppert-Winkel, C.; Schmieder, K. Assessing the potential impacts of bioenergy cropping on a population of the ground-breeding bird Alauda arvensis: A case study from southern Germany. Landsc. Res. 2020, 45, 1000–1017. [Google Scholar] [CrossRef]
  30. Vögeli, M.; Serrano, D.; Pacios, F.; Tella, J.L. The relative importance of patch habitat quality and landscape attributes on a declining steppe-bird metapopulation. Biol. Conserv. 2010, 143, 1057–1067. [Google Scholar] [CrossRef] [Green Version]
  31. Farkas, J.Z.; Lennert, J. Modelling and predicting of the land use change in Hungary. In Climate Change—Society—Economy: Long-Term Processes and Trends in Hungary; Czirfusz, M., Hoyk, E., Suvák, A., Eds.; Publikon: Pécs, Hungary, 2015; pp. 193–221. ISBN 978-615-5457-62-3. [Google Scholar]
  32. Tryjanowski, P.; Hartel, T.; Bldi, A.; Szymański, P.; Tobolka, M.; Herzon, I.; Goławski, A.; Konvička, M.; Hromada, M.; Jerzak, L.; et al. Conservation of farmland birds faces different challenges in Western and Central-Eastern Europe. Acta Ornithol. 2011, 46, 1–12. [Google Scholar] [CrossRef] [Green Version]
  33. Báldi, A.; Faragó, S. Long-term changes of farmland game populations in a post-socialist country (Hungary). Agric. Ecosyst. Environ. 2007, 118, 307–311. [Google Scholar] [CrossRef]
  34. Szép, T.; Gibbson, D. Monitoring of common breeding birds in Hungary using a randomised sampling design. RING 2000, 22, 45–55. [Google Scholar]
  35. Szép, T.; Nagy, K. The GIS UTM Quadrants based Hungarian Bird Monitoring database of the BirdLife Hungary. Természetvédelmi Közlemények 2001, 9, 31–37. [Google Scholar]
  36. Szép, T.; Nagy, K.; Nagy, Z.; Halmos, G. Population trends of common breeding and wintering birds in hungary, decline of long-distance migrant and farmland birds during 1999–2012. Ornis Hungarica 2012, 20, 13–63. [Google Scholar] [CrossRef] [Green Version]
  37. Engel, J.; Huth, A.; Frank, K. Bioenergy production and Skylark (Alauda arvensis) population abundance—a modelling approach for the analysis of land-use change impacts and conservation options. GCB Bioenergy 2012, 4, 713–727. [Google Scholar] [CrossRef]
  38. Miguet, P.; Gaucherel, C.; Bretagnolle, V. Breeding habitat selection of Skylarks varies with crop heterogeneity, time and spatial scale, and reveals spatial and temporal crop complementation. Ecol. Modell. 2013, 266, 10–18. [Google Scholar] [CrossRef]
  39. NÖSZTÉP. Available online: http://alapterkep.termeszetem.hu/ (accessed on 15 February 2021).
  40. STADAT–4.1.21. Harvested Area, Total Production and Average Yield of Main Field Crops (1990–). Available online: https://www.ksh.hu/docs/eng/xstadat/xstadat_annual/i_omn007a.html (accessed on 15 February 2021).
  41. Lang, S.; Tiede, D. vLATE Extension for ArcGIS 2003. Available online: https://sites.google.com/site/largvlate/gis-tools/v-late (accessed on 15 February 2021).
  42. Blaschke, T. The role of the spatial dimension within the framework of sustainable landscapes and natural capital. Landsc. Urban Plan. 2006, 75, 198–226. [Google Scholar] [CrossRef]
  43. Forman, R.T.T. Land Mosaics: The Ecology of Landscapes and Regions; Cambridge University Press: Cambridge, UK, 1995; ISBN 0521479800. [Google Scholar]
  44. Barton, K. Package MuMIn, Version 1.43.15; 2015. Available online: https://cran.r-project.org/web/packages/MuMIn/MuMIn.pdf (accessed on 15 March 2021).
  45. Burnham, K.P.; Anderson, D.R. Model Selection and Multi-Model Inference: A Practical Information—Theoretical Approach; Springer: Berlin/Heidelberg, Germany, 2002; Volume 3, pp. 2–3. [Google Scholar]
  46. Kuznetsova, A.; Brockhoff, P.B.; Christensen, R.H.B. Package ‘lmerTest.’. R Found. Stat. Comput. 2020, 3, 1. [Google Scholar]
  47. Lüdecke, D. ggeffects: Tidy Data Frames of Marginal Effects from Regression Models. J. Open Source Softw. 2018, 3, 772. [Google Scholar] [CrossRef] [Green Version]
  48. Willmott, C.; Matsuura, K. Advantages of the mean absolute error (MAE) over the root mean square error (RMSE) in assessing average model performance. Clim. Res. 2005, 30, 79–82. [Google Scholar] [CrossRef]
  49. De Myttenaere, A.; Golden, B.; Le Grand, B.; Rossi, F. Mean Absolute Percentage Error for regression models. Neurocomputing 2016, 192, 38–48. [Google Scholar] [CrossRef] [Green Version]
  50. Chamberlain, D.E.; Wilson, A.M.; Browne, S.J.; Vickery, J.A. Effects of habitat type and management on the abundance of skylarks in the breeding season. J. Appl. Ecol. 1999, 36, 856–870. [Google Scholar] [CrossRef]
  51. Perkins, A.J.; Whittingham, M.J.; Bradbury, R.B.; Wilson, J.D.; Morris, A.J.; Barnett, P.R. Habitat characteristics affecting use of lowland agricultural grassland by birds in winter. Biol. Conserv. 2000, 95, 279–294. [Google Scholar] [CrossRef]
  52. Nagy, S.; Nagy, K.; Szép, T. Potential Impact of EU Accession on Common Farmland Bird Populations in Hungary. Acta Ornithol. 2009, 44, 37–44. [Google Scholar] [CrossRef]
  53. Gevers, J.; Høye, T.T.; Topping, C.J.; Glemnitz, M.; Schröder, B. Biodiversity and the mitigation of climate change through bioenergy: Impacts of increased maize cultivation on farmland wildlife. GCB Bioenergy 2011, 3, 472–482. [Google Scholar] [CrossRef]
  54. Wretenberg, J.; Lindström, Å.; Svensson, S.; Pärt, T. Linking agricultural policies to population trends of Swedish farmland birds in different agricultural regions. J. Appl. Ecol. 2007, 44, 933–941. [Google Scholar] [CrossRef]
  55. Sauerbrei, R.; Ekschmitt, K.; Wolters, V.; Gottschalk, T.K. Increased energy maize production reduces farmland bird diversity. GCB Bioenergy 2014, 6, 265–274. [Google Scholar] [CrossRef]
  56. Hoffmann, J.; Wittchen, U.; Stachow, U.; Berger, G. Moving Window Abundance - A method to characterise the abundance dynamics of farmland birds: The example of Skylark (Alauda arvensis). Ecol. Indic. 2016, 60, 317–328. [Google Scholar] [CrossRef]
  57. Dietzen, C.; Edwards, P.J.; Wolf, C.; Ludwigs, J.-D.; Luttik, R. Focal species of birds in European crops for higher tier pesticide risk assessment. Integr. Environ. Assess. Manag. 2014, 10, 247–259. [Google Scholar] [CrossRef]
  58. Csikós, N. Impact of land cover change on the abundance of farmland birds. In Proceedings of the 26th International Symposium on Analytical and Environmental Problems; Alapi, T., Berkecz, R., Ilisz, I., Eds.; University of Szeged: Szeged, Hungary, 2020; pp. 113–117. [Google Scholar]
  59. Koleček, J.; Reif, J.; Weidinger, K. The abundance of a farmland specialist bird, the skylark, in three European regions with contrasting agricultural management. Agric. Ecosyst. Environ. 2015, 212, 30–37. [Google Scholar] [CrossRef]
  60. Hamer, T.L.; Flather, C.H.; Noon, B.R. Factors associated with grassland bird species richness: The relative roles of grassland area, landscape structure, and prey. Landsc. Ecol. 2006, 21, 569–583. [Google Scholar] [CrossRef]
  61. Reif, J.; Hanzelka, J. Grassland winners and arable land losers: The effects of post-totalitarian land use changes on long-term population trends of farmland birds. Agric. Ecosyst. Environ. 2016, 232, 208–217. [Google Scholar] [CrossRef]
  62. Báldi, A.; Batáry, P.; Erdos, S. Effects of grazing intensity on bird assemblages and populations of Hungarian grasslands. Agric. Ecosyst. Environ. 2005, 108, 251–263. [Google Scholar] [CrossRef]
  63. Suárez, F.; Garza, V.; Morales, M.B. The role of extensive cereal crops, dry pasture and shrub-steppe in determining skylark Alauda arvensis densities in the Iberian Peninsula. Agric. Ecosyst. Environ. 2003, 95, 551–557. [Google Scholar] [CrossRef]
  64. Donald, P.F.; Green, R.E.; Heath, M.F. Agricultural intensification and the collapse of Europe’s farmland bird populations. Proc. R. Soc. B Biol. Sci. 2001, 268, 25–29. [Google Scholar] [CrossRef] [PubMed]
  65. Wolff, A.; Paul, J.-P.; Martin, J.-L.; Bretagnolle, V. The benefits of extensive agriculture to birds: The case of the little bustard. J. Appl. Ecol. 2001, 38, 963–975. [Google Scholar] [CrossRef] [Green Version]
  66. Brotons, L.; Wolff, A.; Paulus, G.; Martin, J.L. Effect of adjacent agricultural habitat on the distribution of passerines in natural grasslands. Biol. Conserv. 2005, 124, 407–414. [Google Scholar] [CrossRef]
  67. Browne, S.; Vickery, J.; Chamberlain, D. Densities and population estimates of breeding skylarks alauda arvensis in britain in 1997. Bird Study 2000, 47, 52–65. [Google Scholar] [CrossRef] [Green Version]
  68. Eraud, C.; Marie Boutin, J. Density and productivity of breeding Skylarks Alauda arvensis in relation to crop type on agricultural lands in western France. Bird Study 2002, 49, 287–296. [Google Scholar] [CrossRef]
  69. Copland, A.S.; Crowe, O.; Wilson, M.W.; O’Halloran, J. Habitat associations of Eurasian Skylarks Alauda arvensis breeding on Irish farmland and implications for agri-environment planning. Bird Study 2012, 59, 155–165. [Google Scholar] [CrossRef] [Green Version]
  70. Butler, S.J.; Freckleton, R.P.; Renwick, A.R.; Norris, K. An objective, niche-based approach to indicator species selection. Methods Ecol. Evol. 2012, 3, 317–326. [Google Scholar] [CrossRef]
  71. Wakeham-Dawson, A. Hares and Skylarks as Indicators of Environmentally Sensitive Farming on the South Downs, Open Research Online. Ph.D. Thesis, The Open University, Kents Hill, UK, 1995. [Google Scholar]
  72. Achtziger, R.; Stickroth, H.; Zieschank, R. Nachhaltigkeitsindikator für die Artenvielfalt–ein Indikator für den Zustand der Natur und Landschaft in Deutschland. Angew. Landschaftsökologie 2004, 63, 137. [Google Scholar]
  73. Gippoliti, S.; Battisti, C. More cool than tool: Equivoques, conceptual traps and weaknesses of ecological networks in environmental planning and conservation. Land Use Policy 2017, 68, 686–691. [Google Scholar] [CrossRef]
Figure 1. The spatial distribution of the MMM survey observation points in Hungary, where the Skylark occurred in 2015 (3049 observation points).
Land 10 00306 g001
Figure 2. Proportion of the main land cover categories in the 600-m buffer zones, where the Skylark abundance were detected (3049 observation points) based on Hungarian Ecosystem Basemap.
Land 10 00306 g002
Figure 3. Example the spatial distribution of the 600-m buffer zones inside a Natura 200 Spa protected area of Hungary.
Land 10 00306 g003
Figure 4. Predicted marginal effects between the skylark individuals / km2 proportions and landscape metrics of arable and grasslands. The confidence intervals (95%) of the prediction are shown between the dotted lines. ((A), Connection between the proportion of arable land and estimated population density of skylark, (B), Connection between the proportion of grassland and estimated population density of skylark, (C), Connection between the MPS of arable land and estimated population density of skylark, (D), Connection between the MPS of grassland and estimated population density of skylark, (E) Connection between the MFRACT of grassland and estimated population density of skylark).
Land 10 00306 g004
Figure 5. Predicted Eurasian skylark population (individuals/km*) in the 600 m buffer zones inside the Natura 2000 SPA area.
Land 10 00306 g005
Table 1. Descriptions and calculations of the applied landscape indices [26,42,43].
Structural FeatureIndexName and DescriptionCalculation
Size and shape related metricsMPSMean patch size is computed by dividing the area of the patches of the total landscape (or class) by the number of patches. M P S = j = 1 n a i j n i
where aij represents the area of the j** patch in the i** class, ni represents the number of patches in the i** class, n represents the number of patches (>0).
MFRACTMean fractal dimension index equals 2 times the logarithm of the patch perimeter (m) divided by the logarithm of patch area (m*). M F R A C T = j = 1 n 2 ln p i j ln a i j n i
where pij represents the perimeter of the j***patch in class i**, aij represents the area of the j***patch in class i**, ni represents the number of patches in the i** class, n represents the number of patches (1–2).
Landscape HeterogeneitySDIThe Shannon diversity index (SDI) provides more information about area composition than simply area richness (i.e., the number of land-cover types present). S D I = i m P i ln P i
where (m) represents the number of different land-cover types, Pi = the relative abundance of different land-cover types in each BMMU quadrant or LUCAS transect.
Table 2. Summary table for LULC categories, which shows the GLM results after multimodel averaging of best candidate models showing relative importance of each explanatory variable on Skylark abundance, estimated parameter values ± Standard deviation. (For detailed descriptions of the LULC categories see Table A1).
VariableEstimatesStandard DeviationConf. Int (95%)p-ValueRelative Importance (%)VIF
Built-up−0.019 *0.008−0.035–0.0030.0221001.88
Green urban areas−0.024 ***0.005−0.034–0.014<0.0011001.93
Permanent crops−0.0140.013−0.040–0.0130.308241.03
Complex cultivation pattern−0.034 *0.015−0.064–0.0050.0211001.05
Open sand steppes−0.0140.012−0.037–0.0090.228191.02
Salt steppes and meadows0.059 ***0.0020.054–0.063<0.0011001.17
Open rocky grasslands−0.0450.114−0.269–0.1800.6971001.06
Closed grasslands in hills and mountains or on cohesive soil0.067 ***0.0040.058–0.076<0.0011001.03
Other herbaceous vegetation−0.0190.075−0.165–0.1280.805801.07
Forests−0.021 ***0.002−0.025–0.016<0.0011001.11
Wetlands and water surfaces−0.030 ***0.006−0.041–0.018<0.0011001.02
Number of MMM observations (data pairs): 3049, * p < 0.05, ** p < 0.01, *** p < 0.001, Land 10 00306 i001 Positive significant relation with skylark abundance, Land 10 00306 i002 Negative significant relation with skylark abundance, Land 10 00306 i003 No significant relation with skylark abundance.
Table 3. Summary table for landscape metrics, which shows the GLM results after multimodel averaging of best candidate models showing relative importance of each explanatory variable on Skylark abundance, estimated parameter values ± Standard deviation.
VariableEstimatesStandard DeviationConf. Int (95%)p-Value
Shape and size related landscape metricsMPS of preferred LC types0.4345 ***0.00010.2324–0.6156<0.001
MFRACT of preferred LC types1.1635 ***0.33490.5072–1.81990.001
MPS of non-preferred LC types−1.9126 ***0.0004−2.7145–1.1237<0.001
MFRACT of non-preferred LC types−1.1993 **0.4205−2.0236–0.37510.004
Landscape heterogeneityShannon Diversity Index of landscape−1.3711 ***0.1639−1.6923–1.0500<0.001
Number of MMM observations (data pairs): 3049, * p < 0.05, ** p < 0.01, *** p < 0.001.
Table 4. Summary table of the correlation and error indices, which show the accuracy of the predicted values, based on land cover types and land cover types + landscape indices.
Spearman’s RhoMean Absolute ErrorMean Absolute
Percentage Error
Number of
Data Pairs
Land cover types + landscape metrics0.504 **2.1237.77%949
Land cover types0.493 **2.9546.56%
** p < 0.01.
Table 5. Summary table of studies, which predicted the Eurasian skylark density inside European study areas.
Study AreaEstimated Skylark Density
(Individuals/km *)
Reference
Natura 2000 SPA in Hungary0–6.13This study
Great Britain1.97–7.45Browne et al. 2000 [67]
Small study area in France3.28–3.69Eraud and Boutin 2002 [68]
Spain~5.21Suárez et al. 2003 [63]
Ireland1.72Copland et al. 2012 [69]
Northwest Ireland4.87Copland et al. 2012 [69]
Publisher’s Note: MDPI stays neutral with regard to jurisdictional claims in published maps and institutional affiliations.

