Abstract
Coastal areas have been growing massively worldwide. The fast growth also affects the land value in either a positive or a negative way. Many scholars have studied land value and the factors that affect it in areas prone to sudden-onset disasters. In contrast, studies on urbanized coastal areas that suffer from slow-onset disasters are still lacking. Using a case study from Semarang City in Indonesia, this research aims at ameliorating this limitation. To comprehensively understand the aim, two research questions are addressed: (1) What is the distribution of land value in urbanized coastal areas? (2) How do the different distribution factors determine the land value? Based on in-depth interviews with key persons, map analyses, and desk studies, this research discovers that land value is distributed randomly among coastal areas. The dynamics of land value are determined by road access, distance, and accessibility to the city center and CBD, public facilities, transportation facilities, population composition, physical environment, and disasters. Surprisingly, the coastal areas in Semarang that experience combined disasters showed that disasters could not decrease the land value; the value in some areas is constant or even increasing. This shows the different impacts of disasters on land value for slow-onset disasters and sudden-onset disasters.
1. Introduction
Statistics indicate a swift increase in annual world population. In the middle of 2019, the global population was about 7.7 billion, an increase of about 1 billion in 12 years. This number is projected to be 8.5 billion in 2030, 9.7 billion in 2050, and 10.9 billion in 2100 [1]. In 2050, about 68 percent of the world population will concentrate in urban areas, predominantly urban coastal areas [2,3].
In most countries, the population growth in coastal areas is higher than that in non-coastal ones [4]. Small and Nicholls [5] even showed that around one-fifth of the global population, i.e., 1.2 billion people, lived within 100 km from a coast. This number is predicted to become half of the global population in 2030. In 2025, around 6 billion people will live in areas within 200 km from a coast [4]. This demonstrates that coastal areas will potentially grow rapidly.
The growth of coastal areas has triggered various problems. The increase in the number of people and their activities combined with the massive increase in economic activities and environmental changes has made coastal cities experience environmental damages and various kinds of disasters [6,7]. Adger et al. [8] and Marfai et al. [9] show that coastal areas are constantly exposed to different environmental and disaster hazards. The problems are varied, interrelated, and complex [10]. Land subsidence, for example, in combination with other coastal-area threats, such as sea-level rise, storm surge, coastal erosion, damage caused by mangrove ecosystems, and being upstream of a river, has multiplied the risks of the coastal areas [9,10,11,12,13,14].
Indonesia’s coastal cities also face the same issues. Increasing population, massive physical growth, and economic activities generate problems [15,16,17,18]. A report from the United Nations (2019) mentions that in the next 30 years, Indonesia, along with eight other countries, will be the locus for half of the world’s population. The increase in population and activities might be followed by risks of environmental damage and disaster.
The dynamics and growth of coastal areas also affect land value. Various factors may increase or decrease the value. Some factors which increase land value involve an increase in access to coastal areas [19,20,21,22], development of infrastructure and facilities to meet the needs of people [23,24,25], externality, topography, land use, built environment around the place, and policy on land-use planning [25,26,27,28,29]. Growth of urban areas, human activities, and various external factors are determinants for the increase in land value.
However, the individual growth of coastal areas is not always able to increase land value. Some factors might also cause lower value. The increased proneness of an area to disaster and environmental damage is one of some examples which lead to decreasing land value. For instance, the areas with earthquake experience, within the radius of nuclear radiation, and under the threat of flooding and inundation tend to have low land value [29,30,31]. Land values in different areas may vary due to various factors.
Information and knowledge about land values are crucial for numerous purposes, including disaster management. This knowledge can be an essential support in every stage of disaster management, i.e., mitigation, preparedness, response, and recovery [32,33,34]. In the prevention and mitigation stage, the combination of disaster risk information and land value data has assisted measuring the legal, economic, and physical potential lost due to disasters. Information about land values can help the recovery process and compensation distribution, which is one of the significant issues in land administration in disaster management [34]. Thus, the study of land values as part of disaster management study is unquestioned [32,35].
Numerous scholars have studied land value and the factors that affect it from various aspects and approaches in the areas prone to disasters. Most of the studies were based on sudden-onset disasters, such as earthquake, nuclear explosion, and landslide [29,30,31,36]. In contrast, studies in urbanized coastal areas that suffer from slow-onset and complex interrelated disasters are still lacking. Using a case study from Semarang City, which is one of the areas most prone to coastal disasters and environmental damages in Indonesia, this research aims to contribute to the study of the urbanized coastal areas susceptible to slow onset and complex interrelated disasters by understanding the factors affecting the land value in that type of area. To comprehensively understand the aim, two research questions are addressed: (1) What is the distribution of land value in urbanized coastal areas? (2) How do the different distribution factors determine the land value? The first question is expected to give an understanding of how the distribution of land value is in different localities and morphological settings. It is also crucial as a basis to explain the factors that affect and determine land value, which is the second question of this research. The example from this area is expected to benefit other areas with similar geographical and development characteristics.
To elaborate the analysis on the research questions, this paper is divided into five sections. Section 2 briefly describes the theoretical review of coastal area development and the factors that affect the land value. Section 3 explains the study area, and Section 4 describes the research methods. In Section 5, the findings are discussed and then concluded in the Section 6.
2. Theoretical Review
2.1. Coastal Area Development and Problems
Populated coastal areas worldwide have grown significantly [37]. There has been a massive migration of people from urban fringe areas to coastal areas in the last five decades, which has caused a concentration of growth in coastal areas [38]. The economic advantages and beautiful landscapes have attracted people [37,39], who also benefit from global inter-island trading activities and port developments that stimulate more people to come and develop the coastal areas into big coastal cities and metropolitan areas [4,8,38,40]. Thus, it is reasonable that about two-fifths of the total global population is predicted to be concentrated in coastal areas [5,38].
Unfortunately, the development of coastal areas also causes many problems. Rapid coastal growth and human activities can easily affect the areas [8,37]. Such development has led to massive environmental problems and increased disaster risks [6,7,41,42] in the last few decades. For example, in Jakarta, massive economic growth has triggered numerous environmental problems, such as coastal erosion, saltwater intrusion into freshwater supply, land subsidence, and deterioration of the coastal ecosystem [39]. In the US, the combination of the development practices, land subsidence, and sea-level rise has caused the loss of about 34 thousand hectares of wetlands in five years, mainly through conversion to open water [43]. In some areas, these problems have become worse and complicated as more than one type of interrelated disaster has often affected an area [10,44,45]. The increase in disaster risk and environmental damages in coastal areas is in line with the increase in the exposure of coastal areas to human activities [8].
Physical environment and coastal development activities also result in various socioeconomic problems for coastal people and coastal areas. For instance, due to massive development in coastal areas, fishers have lost access to fishing grounds, especially concerning mooring boats and sea lanes, giving way to settlements, factories, and hotels [10,38,46]. Massive development and uncontrolled groundwater extraction also generate land subsidence that causes damage to houses and infrastructure and increases the affected people’s expenditures on dealing with the problems [42]. This becomes even worse as the value of land and properties affected continuously decreases [47,48].
2.2. Factors Affecting Land Value
Various factors can affect the value of land in either a positive or a negative way [25,31]. Land value may increase because of several factors, i.e., quality of the environment, improvement of the facilities and buildings, and supportive land-use policy [19,20,21,22,23,25]. Land value has been massively increasing within the green area (Figure 1) with good air quality, social environment security, and beautiful scenery [49]. The close proximity and better land access to transportation facilities and networks also generate the growth of the areas and transform them into centers of economic activities, which leads to an increase in land value [50,51].
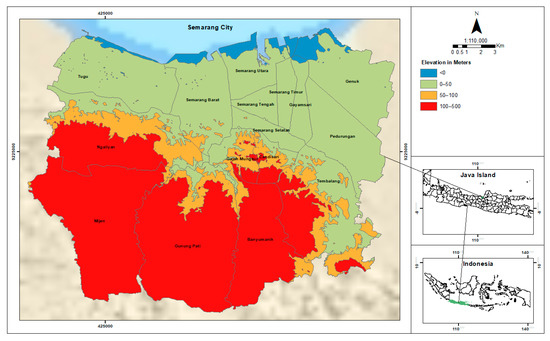
Figure 1.
Research area, Semarang City: Variety of elevations between the northern and southern parts.
Land value is also influenced by land cover, externality, topography, land use, land-use policy, and quality of the environment built on the land [25,26,27]. The growth of the built environment increases the density of the areas with the prevalence of buildings and other facilities that increase the land value [29,51]. When these areas grow to have a concentration of economic activities, the value of the land multiplies [29]. Furthermore, the land value can also rise due to supportive land-use policies. Such policies have been proved to significantly boost land value [28,29]. In many countries, spatial planning policy that allocates land into particular built areas has sped up the growth of the areas, correlating with an increase in land value [52,53]. Therefore, the growth of urban and coastal areas often increases land value.
Some factors can also decrease land value, like poor quality of the environment, radiation and pollution, damage in coastal ecosystems, and different types of disasters [9,29,30,31]. Exposure of an area to different disaster risks has been proved to decrease the land value. Nakagawa et al. [30] showed that the land value of the areas prone to earthquake were eight percent lower than those of safe areas. Moreover, the value of land in areas within the radius of a recorded nuclear explosion drastically declined because the land could not be entirely habitable due to high-level radiation [31]. Similarly, areas exposed to flooding, inundation, and land subsidence are under the threat of decreasing land value [29,42]. Hence, disaster has a significant impact on lowering the value of land.
3. Research Area
This research was conducted in the coastal areas of Semarang City. Semarang City, on the northern coast of Java Island, is one of the big cities in Indonesia, the capital city of Central Java Province. This research area was chosen for two reasons: (1) Urban and coastal areas of Semarang have been growing rapidly in the last few decades which makes Semarang one of the fastest-growing coastal cities in Indonesia, and (2) Semarang has been suffering from complex and interrelated disasters [10,54]. These reasons meet the research expectation to comprehensively understand the distribution of land value and the factors affecting it.
Semarang City covers an area of 37,370 hectares with a 13.6-km-long coastline. In 2019, the population of Semarang was about 1.81 million; it grows by about 1.57% annually [54]. Semarang City is divided into two morphological types: Fluvial plain in the northern part and hilly areas in the southern part [55]. The areas for multi-purpose activities dominate the northern part, i.e., transportation (ports, airport, bus station, and train station), industrial areas, dense settlement areas, ponds, and agricultural areas. The southern part is dominated by green areas, open spaces, and settlements [56] (see Figure 1).
Urban and coastal areas of Semarang have been growing quickly in various aspects: Population, economic, and physical development [54]. The massive growth of the population in the last few decades is determined by the development of Tanjung Emas Port, which attracts people to come to the coastal areas, thus arousing various economic activities [57]. The status of Semarang as the capital city has also pushed the city to grow as a place that can provide minimum basic needs for people, including housing. The significant growth of the city is also determined by the spatial planning policy of Central Java Province, which sets Semarang as part of the economic development corridor of Kedungsepur (Kendal-Demak-Ungaran-Semarang) areas and the strategic area of urban development [10]. As an impact of the increases in development activities and built areas, the land value in this area also positively increases [50,51].
The increase in the development activities and population growth has also intensified the land pressure that triggers the increase in disaster hazards [9]. Along with the other determinants, Semarang coastal areas have been suffering from various disasters and environmental damages. For more than a century, Semarang has been suffering from land subsidence at a massive rate, from 6 to 19 cm per year [17,18,55,58,59,60,61,62]. Besides, development also causes various interrelated disasters and hazards, such as coastal erosion, flooding, coastal flooding, and damage on mangrove ecosystems [61,63,64,65]. These hazards and damages have deteriorated the coastal environment by widening the coverage area of coastal flooding, increasing the salinization of freshwater, increasing permanently inundated areas, and damaging coastal settlements, basic facilities, and infrastructure. On top of that, the value of land in these damaged areas is significantly decreasing [42,47,48].
4. Research Methods
4.1. Research Approach
In this research, a qualitative method was used. This method was chosen as it allowed the researcher to understand the object of the research, i.e., using a case study [66].
4.2. Data Collection
The data were collected using four techniques, i.e., field survey, in-depth interviews with key persons, map analysis, and desk study. During the field survey, the transect method was used to observe the phenomena in all areas of Semarang. Before the field research, four transect areas were designed (see Figure 2). These transects were decided on based on the study of the land-use map and some considerations: Different distances from the coastal areas, uniqueness of the land use, different elevation, and different access to the city center and smaller central business districts. Each transect line was divided into survey points that were separated by about four kilometers. In total, 19 survey points were decided on as the centers to delineate the survey areas. Next, the radii of the observations were drawn about two kilometers from each point to ensure that all areas surrounding the transects were covered. These survey points and the radii were used as a guidance area for conducting in-depth interviews with key persons. The key persons were chosen randomly and interviewed using guidance from a list of questions prepared before the survey and expanded during the interviews.
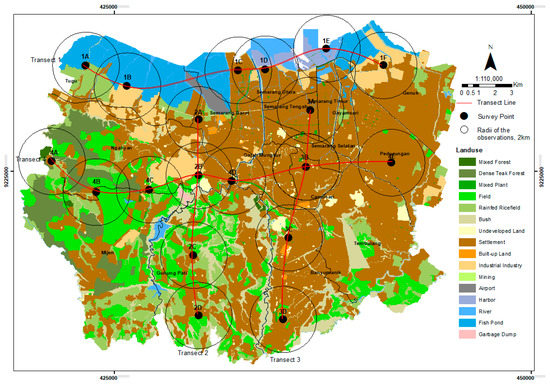
Figure 2.
Transect lines, survey points, and radius of observation used in the data collection.
Furthermore, the spatial data were extracted from various maps, such as basic spatial data, land-use map, and spatial planning maps published by the central and local government institutions. Finally, to complete data gathered from the field and map analysis, a desk study was conducted. Various published works in the academic literature, government policies, government official reports, and official government websites were explored to discover the data used for the analysis.
4.3. Data Presentation and Analysis
The research applied content analysis to scrutinize the data gathered from the field surveys, in-depth interviews, map analysis, and desk study. For details, the data were analysed based on the research aims. To identify the land value and its distribution, some steps were performed: (1) Designing the basic survey map, (2) determining four transect lines and plotting them into a map, (3) setting up the locations of surveys and radius of observation in each transect line, (4) plotting and mapping the data of land values gathered from the surveys and interviews in all locations, and (5) analysing the land value of each transect area by exploring their geographical phenomena.
The spatial data on land prices that represented each node along the transects were obtained from the interviews with the key persons. Most of the spatial data on the factors that affected land value, such as road networks, facilities of education, health, and public services, transportation facilities and infrastructure, physical environment, and disaster hazards, were collected from the One Map Semarang website which is an official Geoportal managed by Semarang City Government through the Spatial Planning Service. The identification of environmental physical factors and disaster-hazard-prone areas was carried out through the transfer of the attributes using the intersection method from the data of influencing factors to 19 observation points. The data related to population demographics and disaster history were obtained from Semarang City Statistics Agency and the Regional Disaster Management Agency, respectively. Meanwhile, the other data, such as the distribution of CBD and location of the city center were extracted from the spatial structure plan map, spatial plan of the Semarang City area, distance of the observation point to the nearest CBD, city center, and other basic urban infrastructure details were obtained from the results of network analysis by identifying the road segments as travel routes.
Furthermore, a series of steps was taken to understand the factors that affected the land value. First, the data, information, and maps produced by the investigation on the first research question were used as the basis of the analysis. Second, the information gathered from the key persons was inventoried and grouped. Third, the land value maps were overlayed with the factors that affected the land values. ArcMap software was used to overlay various layers including land values and their affected factors. Finally, the land value of each location was analysed by considering its distribution and factors that affected the value.
5. Results and Discussion
5.1. The Rate and Distribution of Land Value in Urbanized Coastal Areas
This research found that the value of land in Semarang urbanized coastal areas was distributed randomly. The range of the values is from USD 17 to USD 564. The value of land in different morphological settings was not similar. In the lowland areas in the northern part of Semarang, the value was mostly higher than that in the hilly areas in the southern part (see Figure 3).
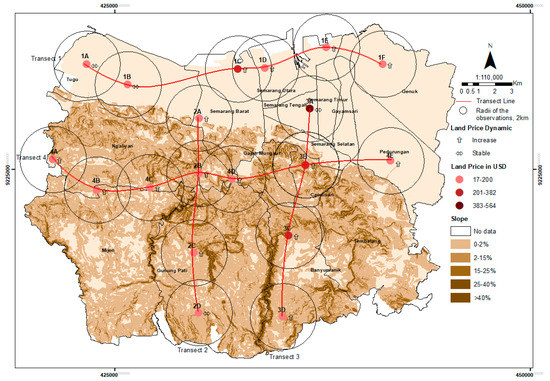
Figure 3.
Land values and their dynamics.
The figure shows that in transect line 1, which stretched from the coastal areas in the west to the east, the land value was very diverse, i.e., from USD 17 to USD 280 per square meter. Land value in this transect line was also the lowest of all the survey areas in Semarang, i.e., in 1A. The second transect line spreading from the northern to the southern part on the west side also showed unique land value. However, the difference in the land values among the observation areas was not significant. The highest value was about USD 140 per square meter in 2A and 2D, while the lowest was approximately USD 70 per square meter in 2C.
Furthermore, the transect line stretched from the city center in the north to the areas in the south. In the areas around this transect line, the land value was significantly higher than in other areas of Semarang; the areas in the lowlands and low elevation have a higher value. Lastly, in the most diverse morphological setting, i.e., in transect line 4, the variety of land value was low. The highest value was about USD 140 per square meter, while the lowest was about USD 70.
The observation also showed that the land value in Semarang was dynamic. In almost all areas (i.e., 15 points), the land value increased steadily, while that of the remaining points was stable. For instance, the value of the four areas in the north, west, south, and east, namely 1C, 2A, 3C, and 4F, showed an increasing trend, while the other four areas, namely 1A, 1B, 2D, and 3A, had a stable value (see Figure 3). The land value is not always high in the lowland and low in the prone areas of disasters. For instance, in some lowland areas dominated by agriculture-purposed land use, land value is low, while in several disaster-prone areas in the north, the value of land is high. In disaster-prone areas, the level of intensity and the impact influence the value.
5.1.1. Transect Line 1: The Coastal Areas
Transect line 1 stretched from the coastal areas in the west to the east. These survey areas were in the lowland with a maximum elevation of about 50 m and a slope of from 0 to 8 percent. Land use in these areas was dominated by open space, ponds, reservoirs, irrigation lines, drainage, canals, rivers, and settlements. At the same time, the areas were also associated with the roads that connect the collector roads with a toll road and some major industrial areas in Semarang.
The land value was very diverse, i.e., from USD 17 to USD 280 per square meter. The value of the four areas in the west, namely 1C, 1D, 1E, and 1F, showed a trend of gradual increase, while the other two areas in the eastern part had a stable value (see Figure 3). The highest value, which also increased steadily, was found in the area of 1C, i.e., in Semarang Barat District. Two reasons, at least, that affect the increase in the land values of this area are: (a) That this area is near the airport, about 4.4 km away, as calculated from the map, and 10 min travel time, and (b) that this area is dominated by fishery-purposed areas located nearby a vast industrial area, surrounded by trading and service facilities, and within an elite settlement area. One of the interesting findings is that even though this area is prone to inundation, the value of the land is not negatively affected. The low intensity, small coverage area, and low impact of the rob are the explanation for this condition. Moreover, the inundation only covers a small number of ponds and agricultural areas, not the houses.
At the same time, the lowest land value of all the surveyed areas in Semarang, USD 17 per square meter, was also found in this transect line, i.e., in 1A. This area, located in Tugu District, is surrounded and dominated by agricultural-purposed land, namely food crop farming and aquaculture. This district is where the extreme damages caused by inundation and coastal erosion can be found. Inundation occurs daily; water easily enters and inundates the paddy fields, ponds, and houses; meanwhile, the coastal erosion is intense, destroying mangrove ecosystems. Because of the high risks, the productivity of the local people who depend on the agricultural areas and the land is lower.
5.1.2. Transect Line 2: From Coastal to Hilly Areas in the West
The second transect line spreads from the northern to the southern part of Semarang on the west side. Unlike the first transect line in the lowlands, this transect was in the areas that were morphologically different. Two points of observation in the northern part, i.e., 2A and 2B, were in the lowlands with an elevation of about 0 to 50 m and a slope of between 0 and 8 percent. These areas were dominated mainly by high-density to medium-density settlements. Then, the other two points, i.e., 2C and 2D, were in the hilly area with an altitude of from 100 to 500 m and a slope between 15 and 25 percent. Unlike the first two points on the lowlands, the areas around these survey points were dominated by agricultural lands like horticultural fields, food crop farming, and low-density settlements.
The difference in the land values among the observation areas was not significant, i.e., from about USD 70 per square meter to about USD 140 per square meter (Figure 3). Two areas with the highest land value were in Semarang Barat and Gunung Pati districts, with an elevation of from 0 to 500 m and a slope less than 8 percent. From these two areas, the value of land in 2A increases annually, while the value in 2D is stable. These areas have been growing extensively as settlements for the local people and migrant workers. The good access to education facilities, airports, terminals, and green areas is indicated as the reason why these areas have been growing for various purposes. In contrast, the area within a radius of 2 km from 2C has the lowest land value. In addition to the use of the area for agriculture, i.e., horticulture, food crop farming, and low-density settlements, this area is also located on a slope of from 15 to 25 percent, an elevation of about 100 to 500 m, and a narrow path.
5.1.3. Transect Line 3: From the Coastal to the Hilly Areas in the East
The transect line stretched from the city center in the north to the areas in the south with mixed land uses, such as settlement, office complex, education, and trading. This transect was divided by two major slopes and elevation, i.e., the areas in the elevation from 0 to 50 m and slope of from 0 to 40 percent in the northern part, and those that had an elevation of from 100 to 500 m and a slope between 8 and 15 percent in the southern part.
The land value in this transect area was significantly higher than that in other areas of Semarang. The highest value was also found in this area, namely in 3A. This area is well-known as one of the first planned settlements in Semarang, which is now dominated by high-density settlements and trading and service areas with excellent access to the city center, airport, train station, and education facilities. While the land value is high, its value is relatively stable at a high standard.
The lowest value of the land in this transect area was in 3D. This area is in Banyumanik District with an elevation between 100 and 500 m and a slope between 8 and 15 percent. With this slope, this area is also prone to landslides. The value of the land in this area tends to increase even though it is in the risk areas of landslides, surrounded by military areas, and has limited plain areas to be easily developed. Beyond this limitation, this area may grow because many people from the lowlands of Semarang moved to this area to escape from the bad environment quality in the coastal area and city center and get closer to the education facilities, especially universities, and to respond to the tendency of the growth of Semarang to the southern part.
5.1.4. Transect Line 4: Hilly Middle Area
This transect line was the most diverse in terms of morphological setting. Looming from the east to the western part around the middle area of Semarang, this transect comprised the lowlands and hilly areas. Three survey points, namely 4A, 4B, and 4C, were in an elevation from 100 to 400 m and dominated by the forest and agricultural areas, while the other two points, i.e., 4D and 4E, were in an elevation between 0 and 100 m and dominated by the high and medium density settlements.
In this transect area, the variety of land value was low. The range of the values is from USD 70 to USD 140 per square meter. The lowest price was found in the areas within 4A and 4B in the western part of Semarang, dominated by agricultural areas, with the same dominant land use as the area around 1A. At the same time, the highest value was found in the eastern part of Semarang in Pedurungan District, i.e., in 4E. As this area is within the high-density and low-density settlements, it has good access to the city center and main corridor of Pandanaran, one of the major lines to the central business district (CBD). Unlike the tendency of land value in other transect areas, the land value of all areas in this transect line tends to increase.
5.2. Factors Affecting Land Value
Many factors determine the value of land. Various physical environmental and socioeconomic factors positively or negatively affect land value [25,31,67,68]. Based on the observations and interviews with key persons, this research has revealed that the value of land in Semarang is affected by various determinants: Access to road, distance and accessibility to the city center and CBD, education, health, and public service facilities, transportation facilities and infrastructure, population composition, physical environment, and disaster hazards and events. However, this research also noticed that a particular factor did not have the same impact on the land value in each area.
Four factors, namely the existence and density of roads, good access to the CBD, the availability of education, health, and public service facilities, and the transportation facilities and infrastructure, have positively increased land value. In contrast, physical environment constraints, like steep slopes, have limited the increase of land value. An interesting finding is that disasters, especially long-term and small-affected disasters, have not consistently decreased the value of land. For instance, in some areas in the northern Semarang that experience complex disasters, land value tends to be stable or even increase.
5.2.1. Access to Roads
Roads, especially their prevalence and quality, are one factor that determines the value of land in numerous urban and coastal cities [49,51]. This research has proved the same result. Land with more roads and land located near roads have been demanded and chosen by people more than land with fewer roads and land far from roads. The land with high value is concentrated in the areas with high road density, such as in 3A, which is associated with the CBD, and 3C which is near the universities and main arterial road which connects Semarang and other regencies (see Figure 4). In line with the growth of road density, the value of the land in almost all areas also increases, except in the areas dominated by the agricultural areas.
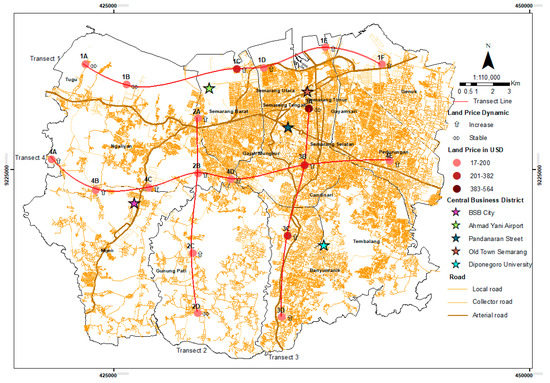
Figure 4.
The distribution of land values and roads in Semarang City.
The morphological setting is related to the density of road. The lowland and sloping areas that are mostly easier to develop will have higher road density and more diverse classes of roads than the hilly areas [51,69]. Consequently, the land value of the areas in the northern part of Semarang rises more rapidly than in the other areas of Semarang.
Various research shows that the class and quality of roads are also crucial in determining the value of land [70,71]. The wider road covered by asphalt offers higher accessibility to the land, thus increasing the value of the land [71]. However, this research has found that it is not the case that in all areas the class and quality of the road increases the value of the land. For instance, in 1A, 1B, 2D, and 3A, the roads are wide, smooth, and covered by asphalt or concrete, but the land values are stable. In contrast, the land value has increased significantly in the last few years in 2A and 4B areas, where the roads are narrow and middling in quality. The areas within 2A are near the city center and include the old settlement areas, and the areas within 4B are located close to the new urban development area, i.e., BSB City and the arterial road plan. Thus, the individual factor of road quality does not affect the land value as the other factors [72].
5.2.2. Distance and Accessibility to the City Center and CBD
Distance and accessibility of land from the city center and CBD can also affect the land value [25,51]. Topçu [25] showed that the closeness of the land to CBD was the factor that effected the most increases in land value. This research has also revealed the same finding. The city center could attract an increase in land value. For instance, the value of the land in 3A and 1C which is close to the city center and central business district, i.e., Simpang Lima, Pandanaran Street, and Old Town, is higher than that far from the center of activities.
Besides, this research also found that the land value of the areas near the new CBD, namely BSB City, had increased significantly. The development of BSB City has attracted people, especially migrant workers and business sectors, to come to the area. Furthermore, BSB City has also attracted the development of middle-up-income settlement and its basic need facilities and infrastructure within and surrounding the area. As the development and growth of the area continues, the land previously isolated from the center of activities is now within or near the area. This reduced distance has doubled the land value in a couple of years. This finding supports some research showing that the reduced land distance to economic activities generated by new city development increases the land values in some areas, especially the areas used for commercial and mixed purposes [73].
In addition to horizontal distance, the land value is also affected by the degree of land access from the city center and various CBDs. By looking at the shortest travel time from the land to the city center and CBD, this research found that the land with a shorter travel time was more expensive. For instance, the average land value in transect line 3, whose travel time was about 8 to 23 min to the main CBD, was higher than the value of the land in other areas. In contrast, the areas within transect line 4, with the longest travel time, showed the lowest average land value in Semarang. The same finding is also shown by Du and Mulley [74].
5.2.3. Education, Health, and Public Service Facilities
The basic needs facilities play an essential role in determining the growth of an area. Three basic facilities, namely education, health, and public service, often attract people to the areas close to these facilities [75]. In line with the growth of the facilities, the agglomeration of the facilities is formed within the new city. Consequently, the agglomeration pulls other activities and attracts more people to move to the new city, which later increases the land value [76].
This research found that educational and health facilities were distributed in almost all areas in Semarang. The concentration of these facilities was found in the city center and the northeast and southeast parts of the city (see Figure 5a,b). The figures show that educational facilities at any level can be found in all areas in Semarang. However, the majority of schools and universities are distributed from the northeast into the southeast parts of the city. Like the concentration of educational facilities, most health facilities could also be found in the same areas. The essential facilities like hospitals, public health centers (puskesmas), health clinics, universities, schools, and public offices that offer basic services grow rapidly in these areas. Consequently, the land value becomes more expensive due to the increase in demand for the land. The tendency of people to buy the land near the facilities has boosted its value. For instance, the land in 3C, close to Diponegoro University and health facilities, tends to increase in value due to the need for housing from the university students and workers. Thus, the land value is high in the area with good access to educational and health facilities.
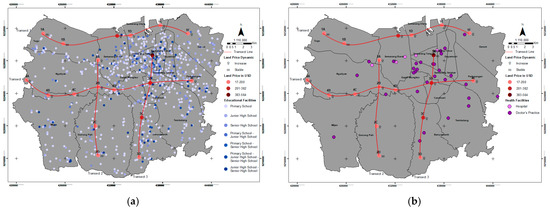
Figure 5.
The distribution of basic facilities contributing to the values of land in Semarang City: (a) Educational facilities; (b) Health facilities.
5.2.4. Transportation Facilities and Infrastructure
Numerous scholars had proved that the presence and quality of transportation facilities and infrastructure positively affects land and property values [25,77,78,79]. Transportation facilities and infrastructure, such as public transportation, airports, terminals, and train stations, supported by good road quality and other transportation networks, are crucial to support people’s daily activities. The better the transportation facilities and networks, the more effective the movement of people and goods. This effectiveness is vital for people choosing an area to live in [77]. This is why the areas with the highest quality of transportation facilities and infrastructure are the most demanded [25,80,81]. The higher the demand for the land, the higher its value.
In Semarang, almost all areas can be reached using public transport. The urban areas are served by bus rapid transit, and the rural areas are served by feeder buses and rural transport. Additionally, Semarang has a complete network of all transportation modes. However, the availability and affordability of the facilities and infrastructure among transect lines are different. From all areas within four transect lines, three of them are served by good transportation facilities, while the other one has a moderate level of transportation service. The areas within transect line 1, namely Mangkang Terminal, Terboyo Terminal, International Airport of Ahmad Yani, and Tanjung Emas Port, are served by all transport facilities. As all transportation modes and facilities serve these areas, the movement of people and goods is also high. Consequently, the economic activities grow massively, which causes an increase in land value. Similarly, the areas around transect lines 2 and 3 also experience a massive increase in land value because of the increase in the quantity and quality of transportation facilities and infrastructure. For years, the facilities and infrastructure like Gunung Pati Terminal, Poncol Train Station, Tawang Train Station, and Sukun Terminal have increased the land value.
5.2.5. Population Composition and Its Economic Activities
People come to and move out of Semarang City for extended periods. The growth of economic activities and numerous opportunities to generate income have attracted people, especially workers, to come to Semarang. The increase in the population positively affects the city’s land value. For instance, a key person in Ngaliyan District, an area grouped in 4C, reported that migrant workers in manufacturing mostly occupied the surrounding settlement areas. As this area is mainly designated as the business area, and due to the concentration of workers’ settlements, the value of the land tends to increase. This finding supports the research of [51,82], which revealed the same conclusion.
The dynamics and composition of the population in Semarang also determine the land utilization and changes. The areas near the industrial neighbourhoods and the destinations for migrants are more dynamic than those dominated by the local settlements. The local migrants who mostly work in the industrial areas prefer to live next to their workplaces to minimize the cost of transportation and mobility. This phenomenon has increased the possibility of the land being shifted from an individual to a business-related purpose. Once the areas have changed from having a domestic purpose, e.g., local settlement, into having a business one, the value of the land increases [82].
This research has found four areas based on population composition, namely areas dominated by local people, areas dominated by local migrants, areas with a combination of local people and local migrants, and areas with a mixture of local people and commuters. In the areas where local people are dominant, most of the areas are occupied by individual houses. Moreover, the dynamics in land-use change is insignificant, and the value of the land slightly increases gradually. In contrast, in the areas where there is a mix of local people and local migrants, the level of the mixture of land uses for individual settlements, rental houses, and small economic business activities is also high. In this type of land use, the potential increase in land value is also high. The areas along transect line 1, especially 1F, showed this fact.
5.2.6. Physical Environment
Physical environment also affects the value of land. Two physical-environment factors that always determine the value of land are slope and elevation [83]. The land value of the residential areas located on the lower slope is higher than that of the residential areas on the steep slope as the land on the plain areas can be developed more easily and economically [27]. Even though for some people technology development and the capacity to exploit land have been shifting their perceptions on utilizing and changing the land in all conditions, for some other common people, the land that is on the steep slope and with high elevation has reduced their interest in buying the land, except for the limited number of people that are keen on spending money for more expensive development costs [83].
In Semarang, slope and elevation also affect the land value (see Figure 3). The northern part, with a slope between 0 and 2 percent, is the densest developed area for various uses, like settlements, offices for government and non-government institutions, trading and service activities, educational and health facilities, and transport facilities. As the areas are categorized as highly developed, the demand for and the value of the land also increase. Conversely, the land in the middle and southern parts of Semarang, dominated by the hilly areas and with a slope of from 2 to over 40 percent, has lower levels of dynamics and demand. In most cases, people avoid buying land in these areas because the cost to construct housing, for instance, is high. However, for some certain yet limited number of people, i.e., the rich and/or the people who look for land with panoramic scenery, the hilly area is not a big problem to develop. Here, on the land surrounding the high-end hilly settlement areas, the value of the land is also pulled up (for instance, see points of observation 3B and 3C).
This research also showed that different elevations also had different land values (Figure 6). Two of the four areas with the highest land value in Semarang, i.e., 3A and 1C, are located on the lowlands, less than 50 m above sea level. In most cities with coastal areas, the lowland part of the city is mainly the area where the city’s economic activities are concentrated [29]. In Semarang, the history of the city, as it grew from the coastal areas to the hilly southern areas, has also determined the value of the land in the city. As long as the lowland areas can support the people’s need for land, people mainly tend to live in these areas for different reasons. This condition causes the value of land in the lowlands to grow quickly.
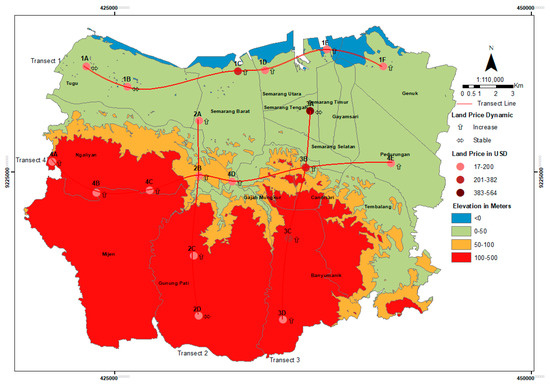
Figure 6.
Land value distribution in different elevations.
5.2.7. Disaster Hazards and Events
Numerous scholars have proven that disasters decrease land value because they can increase the exposure of an area and people to further disasters [29,31]. Disasters often make the damaged land uninhabitable. For instance, the areas that were exposed to nuclear radiation for an extended period of time in Fukushima have long been abandoned by people and the land value is low [30]. Moreover, Sritarapipat [29] proved that the land value of the areas prone to flooding also decreased.
Semarang is a city accompanied with multi-hazards and disasters [9,10]. For a long time, the coastal areas of Semarang have been experiencing numerous interrelated disasters, i.e., flooding, coastal flooding, inundation, and land subsidence [9,59]. The disasters originated from the sea and landslides. Some areas in the eastern coast have been experiencing more than two hazards at the massive rates with impacts on the areas and people, namely the combination of land subsidence, flooding, and inundation [10,42,44]. All disasters are interrelated and exacerbated by each other [9,10].
Two different morphologies of Semarang City, i.e., the fluvial plain in the northern part and the hilly areas in the southern part [55], also take various disaster risks to the city. The fluvial plain is the epicenter of land subsidence. Many studies show that northern Semarang has been sinking quickly from 6 to 19 cm per year [57,58]. The continuous sinking of the land has also caused wider coverage areas and more intense tidal flooding and inundation [8]. These hazards have deteriorated the coastal environment, permanently inundated the coastal areas, and damaged coastal settlements and ponds, which are people’s source of income [9]. At the same time, southern Semarang is at risk of landslides. Heavy rainfall and development expansion have increased landslide incidents [8].
This research found that many survey areas in the eastern part of Semarang suffered not only from land subsidence but also from flooding and tidal flooding (see Figure 7a,b). However, the intensity of disasters in each area is different. For instance, the area in 1E has been suffering from land subsidence, flooding, and inundation at the highest level. Similarly, the areas around 1A and 1B have also been experiencing land subsidence, flooding, and inundation but at a lower level. This different status also causes the different values of land.
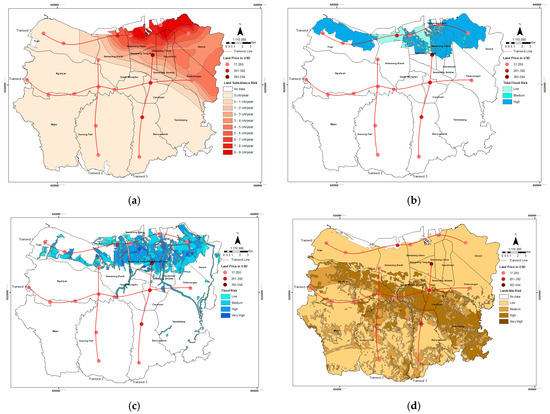
Figure 7.
Distribution of land values and disaster risks: (a) Land subsidence; (b) tidal flood; (c) flood; and (d) landslides.
Numerous scholars proved that disasters decreased the value of land [9,29,30,31]. However, this research has found different findings. Not all areas that are affected by disasters have low land value. For instance, the land value in 1C is categorized as medium to high, i.e., about USD 280 per square meter, even though the land in this area is sinking rapidly. Besides, key persons in areas 1D and 1E also reported that the land value was increasing even though the areas were sinking. Thus, this example shows that land subsidence, accompanied by flooding and inundation with massive impacts, cannot directly decrease the land value in all coastal areas.
Similarly, the hilly areas in the middle to the southern parts of Semarang with a slope of from 2 to over 40 percent are also prone to landslides. The middle part is the most prone to landslides because of the steep slope and high intensity of land development for the built areas (see Figure 7d). Figure 7d also shows that the coverage area of landslides is vast, with different intensities and risks for various areas. Like coastal areas which are prone to various disasters, the land value in these areas with the risk of landslide is still growing. For instance, the land value tends to grow in the area around 3D which is at a high risk of landslide. Thus, this finding differs from [36], explaining that land value in the area with landslide risk will tend to decrease.
6. Conclusions
There is a growing discussion in the literature on land value in urbanized coastal and disaster-prone areas. Semarang City, with its status as one of the cities in Indonesia most prone to complex disasters, which happen daily, provides an opportunity to understand the factors affecting land value in an urbanized coastal area prone to interrelated disasters.
This research generates the findings as follows. First, land values are distributed randomly among the areas in Semarang. The land values in almost all areas increase, while the values in the areas associated with agricultural areas are stable. The range of the values is also broad, i.e., from USD 17 to USD 564 per square meter. The lowest value is associated with the agricultural districts in the coastal area, while the highest one is associated with the mixed area in the city center. Thus, this finding supports [25,51], which shows that the city center area tends to have high land value.
Second, land value is determined by various factors: Road access, distance and accessibility to the city center and CBD, educational, health, and public service facilities, transportation facilities and infrastructure, population composition, and physical environment, as well as disaster hazards and events. Except for the factors of disaster hazards and events and physical environments—for example, steep slope—other factors speed up the land value increase.
It is widely known that disasters rarely increase land value. Many scholars [29,30,31] explain that land that is prone to disaster or damaged because of disasters has low value and tends to depreciate further. Nakagawa et al. [30] provide an example that the value of the land in the areas with a history of earthquake decreased about eight percent. Sritarapipat and Takeuchi [29] also prove that the areas prone to flooding, especially on the lowlands, are valued low due to the risk. However, some disaster-prone areas in Semarang show different findings. The coastal areas that experience the combination of land subsidence, flooding, and inundation simultaneously indicate that these disasters could not decrease the value of the land; the value in some areas is constant or even increases. Therefore, it shows a different impact of disasters on land value between a single-shock or sudden-onset disaster and a slow-onset disaster like land subsidence. The impacts of land subsidence that do not suddenly hit an area increased the awareness of the people that their areas are at risk [10]. What is worse is that some people who understand that their areas are at risk and who have experienced the impacts of the complex coastal hazards still impose themselves to stay in their land. As more people tend to stay in the areas, this makes the land value in this disaster-prone area stable or even increase.
To conclude, it is unquestionable that urban coastal areas have attracted people and economic activities. The growth of coastal city increases various economic opportunities, while at the same time increasing the risk of various disasters. These two opposite phenomena can affect the value of land either positively or negatively. Understanding the distribution of land values and the factors affecting them is crucial for the direction of the coastal area growth and the management of various coastal disasters based on the land administration approach.
Author Contributions
E.S. and R.A.G. conceived the research design and methods. E.S., R.A.G., I.S.A. and M.S.I.F. all contributed to designing the research localities, collecting data, and visualizing data. E.S., R.A.G., I.S.A. and M.S.I.F. contributed to writing original draft preparation. E.S. contributed to writing the reviewed and edited article. All authors have read and agreed to the published version of the manuscript.
Funding
This research was funded by the Faculty of Geography, Universitas Gadjah Mada, Indonesia, grant number 1532/UN1/FGE/KPT/SETD/2021.
Institutional Review Board Statement
Not applicable.
Informed Consent Statement
Not applicable.
Data Availability Statement
Not applicable.
Acknowledgments
We thank the key persons for their time and information support. We also would like to acknowledge the Faculty of Geography Universitas Gadjah Mada for their financial support. Finally, we also thank anonymous reviewers for their constructive input to the final version.
Conflicts of Interest
The authors declare no conflict of interest.
References
- United Nations. World Population Prospects 2019: Highlights; Department of Economic and Social Affairs; Population Division: New York, NY, USA, 2019. [Google Scholar]
- United Nations. World Urbanization Prospects: The 2018 Revision, Key Facts; Technical Report 2018; United Nations: New York, NY, USA, 2018. [Google Scholar]
- Adger, W.N.; Hughes, T.P.; Folke, C.; Carpenter, S.R.; Rockstrom, J. Social-ecological resilience to coastal disasters. Science 2005, 309, 1036–1039. [Google Scholar] [CrossRef]
- Creel, L. Ripple Effects: Population and Coastal Regions; Population Reference Bureau: Washington, DC, USA, 2003; pp. 1–9. [Google Scholar]
- Small, C.; Nicholls, R.J. A global analysis of human settlement in coastal zones. J. Coast. Res. 2003, 19, 584–599. [Google Scholar]
- Blaikie, P.; Cannon, T.; Davis, I.; Wisner, B. At Risk: Natural Hazards, People’s Vulnerability and Disasters; Routledge: New York, NY, USA, 2014. [Google Scholar]
- Turner, B.L.; Kasperson, R.E.; Matson, P.A.; McCarthy, J.J.; Corell, R.W.; Christensen, L.; Eckley, N.; Kasperson, J.X.; Luers, A.; Martello, M.L.; et al. A framework for vulnerability analysis in sustainability science. Proc. Natl. Acad. Sci. USA 2003, 100, 8074–8079. [Google Scholar] [CrossRef]
- Marfai, M.A.; King, L.; Singh, L.P.; Mardiatno, D.; Sartohadi, J.; Hadmoko, D.S.; Dewi, A. Natural hazards in Central Java Province, Indonesia: An overview. Environ. Earth Sci. 2008, 56, 335–351. [Google Scholar] [CrossRef]
- Saputra, E. Land Subsidence as a Sleeping Disaster: Case Studies from Indonesia; Utrecht University: Utrecht, The Netherlands, 2020. [Google Scholar]
- Chen, C.; Tfwala, S.S. Impacts of Climate Change and Land Subsidence on Inundation Risk. Water 2018, 10, 157. [Google Scholar] [CrossRef]
- Wang, J.; Gao, W.; Xu, S.; Yu, L. Evaluation of the combined risk of sea level rise, land subsidence, and storm surges on the coastal areas of Shanghai. China. Clim. Chang. 2012, 115, 537–558. [Google Scholar] [CrossRef]
- Phien-Wej, N.; Giao, P.H.; Nutalaya, P. Land subsidence in Bangkok, Thailand. Eng. Geol. 2006, 82, 187–201. [Google Scholar] [CrossRef]
- World Bank. Bangladesh: Climate Change and Sustainable Development; Report No 21104 BD; World Bank: Washington, DC, USA, 2000. [Google Scholar]
- Sarah, D.; Hutasoit, L.M.; Delinom, R.M.; Sadisun, I.A.; Wirabuana, T. A Physical Study of the Effect of Groundwater Salinity on the Compressibility of the Semarang-DemakAquitard, Java Island. Geosciences 2018, 8, 130. [Google Scholar] [CrossRef]
- Abidin, H.Z.; Andreas, H.; Gumilar, I.; Brinkman, J. Study on the risk and impacts of land subsidence in Jakarta. Proc. Int. Assoc. Hydrol. Sci. 2015, 372, 115–120. [Google Scholar] [CrossRef]
- Chaussard, E.; Amelung, F.; Abidin, H.; Hong, S.-H. Sinking cities in Indonesia: ALOS PALSAR detects rapid subsidence due to groundwater and gas extraction. Remote Sens. Environ. 2013, 128, 150–161. [Google Scholar] [CrossRef]
- Saputra, E.; Hartmann, T.; Zoomers, A.; Spit, T. Fighting the Ignorance: Public Authorities’ and Land Users’ Responses to Land Subsidence in Indonesia. Am. J. Clim. Chang. 2017, 06, 1–21. [Google Scholar] [CrossRef]
- Cho, S.-H.; Lambert, D.M.; Kim, S.G.; Roberts, R.K.; Park, W.M. Relationship between value of open space and distance from housing locations within a community. J. Geogr. Syst. 2011, 13, 393–414. [Google Scholar] [CrossRef]
- Bajic, V. The effects of a new subway line on housing prices in metropolitan Toronto. Urban Stud. 1983, 20, 147–158. [Google Scholar] [CrossRef]
- Mozolin, M. The geography of housing values in the transformation to a market economy: A case study of Moscow. Urban Geogr. 1994, 15, 107–127. [Google Scholar] [CrossRef]
- Richardson, H.W.; Gordon, P.; Jun, M.; Heikkila, E.; Peiser, R.; Dale-Johnson, D. Residential property values, the CBD, and multiple nodes: Further analysis. Environ. Plan. A 1990, 22, 829–833. [Google Scholar] [CrossRef]
- Duranton, G.; Puga, D. Urban land use. In Handbook of Regional and Urban Economics; Duranton, G., Henderson, J.V., Strange, W.C., Eds.; Elsevier: Amsterdam, The Netherlands, 2015; pp. 467–560. [Google Scholar] [CrossRef]
- McDonald, J.F.; Bowman, H.W. Land value functions: A reevaluation. J. Urban. Econ. 1979, 6, 25–41. [Google Scholar] [CrossRef]
- Topçu, M. Accessibility effect on urban land values. Sci. Res. Essay 2009, 4, 1286–1291. [Google Scholar]
- Mathur, S. Impact of urban growth boundary on housing and land prices: Evidence from King County, Washington. Hous. Stud. 2014, 29, 128–148. [Google Scholar] [CrossRef]
- Cho, S.; Poudyal, N.; Lambert, D.M. Estimating spatially varying effects of urban growth boundaries on land development and land value. Land Use Policy 2008, 25, 320–329. [Google Scholar] [CrossRef]
- Jaeger, W.K.; Plantinga, A.J.; Grout, C. How has Oregon’s land use planning system affected property values? Land Use Policy 2012, 29, 62–72. [Google Scholar] [CrossRef]
- Sritarapipat, T.; Takeuchi, W. Estimating land value and disaster risk in urban area in Yangon, Myanmar using stereo high-resolution images and multi-temporal Landsat images. In Proceedings of the 36th Asian Conference on Remote Sensing 2015, Quezon City, Metro Manila, Philippines, 19–23 October 2015; ISBN 978-1-5108-1721-0. [Google Scholar]
- Nakagawa, M.; Saito, M.; Yamaga, H. Earthquake risks and land prices: Evidence from the Tokyo metropolitan area. Jpn. Econ. Rev. 2009, 60, 208–222. [Google Scholar] [CrossRef]
- Tanaka, K.; Managi, S. Impact of a disaster on land price: Evidence from Fukushima nuclear power plant accident. Singap. Econ. Rev. 2016, 61, 1640003. [Google Scholar] [CrossRef]
- Mitchell, D.; Myers, M. Land valuation and taxation: Key tools for disaster risk management. In Proceedings of the International Federation of Surveyors Working Week 2013, Abuja, Nigeria, 6-10 May 2013. [Google Scholar]
- Enemark, S. Sustainable Land Administration Infrastructures to Support Natural Disaster Prevention and Management. Paper Presented at The United Nations Regional Cartographic Conference for the Americas, New York, United States, 2009. Available online: http://unstats.un.org/unsd/geoinfo/9th-UNRCC-A/IP/IP%206%20Enemark.pdf (accessed on 2 July 2021).
- Park, J.H.; Park, S.H.; Kim, K.A. Disaster management and land administration in South Korea: Earthquakes and the real estate market. Land Use Policy 2019, 85, 52–62. [Google Scholar] [CrossRef]
- Charoenkalunyuta, C. Land Tenure in Disaster Risk Management: Case of Flooding in Nepal. Master’s Thesis, University of Twente, Twente, The Netherlands, 2011. [Google Scholar]
- Zumpano, V.; Pisano, L.; Malek, Ž.; Micu, M.; Aucelli, P.P.C.; Rosskopf, C.M.; Balteanu, D.; Parise, M. Economic Losses for Rural Land Value Due to Landslides. Front. Earth Sci. 2018, 6, 97. [Google Scholar] [CrossRef]
- Fuchs, R.; Conran, M.; Louis, E. Climate Change and Asia’s Coastal Urban Cities Can they Meet the Challenge? Environ. Urban. Asia 2011, 2, 13–28. [Google Scholar] [CrossRef]
- Tibbetts, J. Coastal cities: Living on the edge. Environ. Health Perspect. 2002, 110, A674–A681. [Google Scholar] [CrossRef]
- Li, H. Management of coastal mega-cities—a new challenge in the 21st century. Mar. Policy 2003, 27, 333–337. [Google Scholar] [CrossRef]
- Barragán, J.M.; de Andrés, M. Analysis and trends of the world’s coastal cities and agglomerations. Ocean Coast. Manag. 2015, 114, 11–20. [Google Scholar] [CrossRef]
- Marfai, M.A. The hazards of coastal erosion in Central Java, Indonesia: An overview. Geogr. Malays. J. Soc. Space 2017, 7, 1–9. [Google Scholar]
- Saputra, E.; Spit, T.; Zoomers, A. Living in a bottomless pit: Households Responses to Land Subsidence, an Example from Indonesia. J. Environ. Prot. 2019, 10, 1–21. [Google Scholar] [CrossRef][Green Version]
- Burkett, V. Coastal Impacts, Adaptation, and Vulnerabilities; A Technical Input to the 2013 National Climate Assessment; Island Press: Washington DC, USA, 2012. [Google Scholar]
- Saputra, E. Kompleksitas Permasalahan Masyarakat Kota Pesisir: Covid-19, Bencana, dan Perubahan Iklim. In Rembug Pageblug: Dampak, Respons dan Konsekuensi Pandemi Covid-19 Dalam Dinamika Wilayah, 1st ed.; Rijanta, R., Baiquni, M., Eds.; Badan Penerbit Fakultas Geografi UGM: Yogyakarta, Indonesia, 2021. [Google Scholar]
- Lin, B.B.; Khoo, Y.B.; Inman, M.; Wang, C.-H.; Tapsuwan, S.; Wang, X. Assessing inundation damage and timing of adaptation: Sea level rise and the complexities of land use in coastal communities. Mitig. Adapt. Strat. Glob. Chang. 2014, 19, 551–568. [Google Scholar] [CrossRef]
- Harwitasari, D.; van Ast, J. Adaptation Responses to Tidal Flooding in Semarang, Indonesia. Master’s Thesis, Erasmus University, Rotterdam, The Netherlands, 2008. [Google Scholar]
- Yoo, J.; Perrings, C. An externality of groundwater depletion: Land subsidence and residential property prices in Phoenix, Arizona. J. Environ. Econ. Policy 2017, 6, 121–133. [Google Scholar] [CrossRef]
- Yoo, J.; Frederick, T. The varying impact of land subsidence and earth fissures on residential property values in Maricopa County–a quantile regression approach. Int. J. Urban Sci. 2017, 21, 1–13. [Google Scholar] [CrossRef]
- Lahoz, A.E.P. An Analysis of How Geographical Factors Affect Real Estate Prices. Master’s Thesis, School of Architecture and the Built Environment Royal Institute of Technology (KTH), Stockholm, Sweden, 2007. [Google Scholar]
- Cervero, R. Effects of Light and Commuter Rail Transit on Land Prices: Experiences in San Diego County; UC Berkeley: University of California Transportation Center: Berkeley, CA, USA, 2006. [Google Scholar]
- Rakhmatulloh, A.R.; Buchori, I.; Pradoto, W.; Riyanto, B.; Winarendri, J. What is The Role of Land Value in The Urban Corridor? IOP Conf. Ser. Earth Environ. Sci. 2018, 123, 012033. [Google Scholar] [CrossRef]
- Han, W.; Zhang, X.; Zheng, X. Land use regulation and urban land value: Evidence from China. Land Use Policy 2020, 92, 104432. [Google Scholar] [CrossRef]
- Hlanfeldt, K.R. The effect of land use regulation on housing and land prices. J. Urban Econ. 2007, 61, 420–435. [Google Scholar] [CrossRef]
- BPS-Statistics of Semarang Municipality. Semarang Municipality in Figures 2020; BPS-Statistics of Semarang Municipality: Semarang, Indonesia, 2020. [Google Scholar]
- Lubis, A.M.; Sato, T.; Tomiyama, N.; Isezaki, N.; Yamanokuchi, T. Ground subsidence in Semarang-Indonesia investigated by ALOS–PALSAR satellite SAR interferometry. J. Asian Earth Sci. 2011, 40, 1079–1088. [Google Scholar] [CrossRef]
- Putranto, T.; Hidajat, W.; Susanto, N. Developing groundwater conservation zone of unconfined aquifer in Semarang, Indonesia. IOP Conf. Ser. Earth Environ. Sci. 2017, 55, 1–9. [Google Scholar] [CrossRef]
- Setioko, B.; Pandelaki, E.E. Towards Sustainable Urban Growth: The Unaffected Fisherman Settlement Setting (with Case Study Semarang Coastal Area). Procedia Environ. Sci. 2013, 17, 401–407. [Google Scholar] [CrossRef][Green Version]
- Marfai, M.A.; King, L. Monitoring land subsidence in Semarang, Indonesia. Environ. Geol. 2007, 53, 651–659. [Google Scholar] [CrossRef]
- Sarah, D.; Soebowo, E. Land subsidence threats and its management in the North Coast of Java. IOP Conf. Ser. Earth Environ. Sci. 2018, 118, 012042. [Google Scholar] [CrossRef]
- Andreas, H.; Abidin, H.Z.; Pradipta, D. Insight look the subsidence impact to infrastructures in Jakarta and Semarang area. Key for adaptation and mitigation. In Proceedings of the MATEC Web of Conferences, Batumi, Georgia, 24 June 2021. [Google Scholar] [CrossRef]
- Pujiastuti, R. The Initial Step for Developing Sustainable Urban Drainage System in Semarang City-Indonesia. Procedia Eng. 2017, 171, 1486–1494. [Google Scholar]
- Andreas, H.; Abidin, H.Z.; Gumilar, I. Adaptation and mitigation of land subsidence in Semarang. AIP Conf. Proc. 2017, 1857, 060005. [Google Scholar] [CrossRef]
- Marfai, M. Impact of coastal inundation on ecology and agricultural land use case study in Central Java, Indonesia. Quaest. Geogr. 2011, 30, 19–32. [Google Scholar] [CrossRef]
- Wahyudi, S.I.; Ni’am, M.F. Problems, causes and handling analysis of tidal flood, erosion and sedimentation in northern coast of Central Java: Review and recommendation. Int. J. Civil. Environ. Eng. 2012, 12, 65–69. [Google Scholar]
- Nugraha, S.B.; Sidiq, W.A.B.N.; Setyowati, D.L.; Martuti, N.K.T. Analysis of extent and spatial pattern change of mangrove ecosystem in Mangunharjo Sub-district from 2007 to 2017. J. Phys. Conf. Ser. 2018, 983, 012175. [Google Scholar] [CrossRef]
- Yin, R.K. Case Study Research: Design and Methods; Sage Publications: New York, NY, USA, 2014. [Google Scholar]
- Yuan, F.; Wu, J. Policy change, amenity, and spatiotemporal dynamics of housing prices in Nanjing, China. Land Use Policy 2018, 75, 225–236. [Google Scholar] [CrossRef]
- Yunus, H.S. Struktur Tata Ruang Kota; Pustaka Pelajar: Yogyakarta, Indonesia, 2000. [Google Scholar]
- Petković, V.; Potočnik, I. Planning Forest road network in natural forest areas: A case study in northern Bosnia and Herzegovina. Croat. J. For. Eng. J. Theory Appl. For. Eng. 2018, 39, 45–56. [Google Scholar]
- Chicoine, D.L. Farmland values at the urban fringe: An analysis of sale prices. Land Econ. 1981, 57, 353–362. [Google Scholar] [CrossRef]
- Pramana, A.Y. Analisis Faktor Yang Berpengaruh Terhadap Nilai Lahan di Kawasan Perkotaan Yogyakarta Studi Kasus Kecamatan Ngaglik, Kabupaten Sleman, Daerah Istimewa Yogyakarta. ReTII; ITNY: Yogyakarta, Indonesia, 2017. [Google Scholar]
- Merry, F.; Amacher, G.; Lima, E. Land Values in Frontier Settlements of the Brazilian Amazon. World Dev. 2008, 36, 2390–2401. [Google Scholar] [CrossRef]
- McMillen, D.P.; McDonald, J.F. Land Values in a Newly Zoned City. Rev. Econ. Stat. 2002, 84, 62–72. [Google Scholar] [CrossRef]
- Du, H.; Mulley, C. Relationship between Transport Accessibility and Land Value. Transp. Res. Rec. J. Transp. Res. Board 2006, 1977, 197–205. [Google Scholar] [CrossRef]
- Kato, H. How Does the Location of Urban Facilities Affect the Forecasted Population Change in the Osaka Metropolitan Fringe Area? Sustainability 2021, 13, 110. [Google Scholar] [CrossRef]
- Li, L.; Prussella, P.; Gunathilake, M.; Munasinghe, D.; Karadana, C. Land Valuation Systems using GIS Technology Case of Matara Urban Council Area, Sri Lanka. Bhumi Plan. Res. J. 2015, 4, 7. [Google Scholar] [CrossRef]
- Ryan, S. Property Values and Transportation Facilities: Finding the Transportation-Land Use Connection. J. Plan. Lit. 1999, 13, 412–427. [Google Scholar] [CrossRef]
- Debrezion, G.; Pels, E.; Rietveld, P. The Impact of Railway Stations on Residential and Commercial Property Value: A Meta-analysis. J. Real Estate Finance Econ. 2007, 35, 161–180. [Google Scholar] [CrossRef]
- Bagloee, S.A.; Heshmati, M.; Tavana, M.; Di Caprio, D. A logit-based model for measuring the effects of transportation infrastructure on land value. Transp. Plan. Technol. 2016, 40, 1–24. [Google Scholar]
- Cervero, R.; Kang, C.D. Bus rapid transit impacts on land uses and land values in Seoul, Korea. Transp. Policy 2011, 18, 102–116. [Google Scholar] [CrossRef]
- Du, H.; Mulley, C. Transport accessibility and land value: A case study of Tyne and Wear. RICS Res. Pap. Ser. 2007, 7, 52. [Google Scholar]
- Lawanson, T.; Yadua, O.; Salako, I. Environmental challenges of peri-urban settlements in the Lagos megacity. In Proceedings of the 17th International Conference on Urban Planning, Regional Development and Information Society, Schwechat, Austria, 14–16 May 2012. [Google Scholar]
- Peiser, R.B. Density and Urban Sprawl. Land Econ. 1989, 65, 193. [Google Scholar] [CrossRef]
- Tyas, W. Living in Prone Flooding Area: In Coastal Areas of Semarang. IOP Conf. Ser. Earth Environ. Sci. 2018, 123, 012010. [Google Scholar] [CrossRef]


Publisher’s Note: MDPI stays neutral with regard to jurisdictional claims in published maps and institutional affiliations. |
© 2021 by the authors. Licensee MDPI, Basel, Switzerland. This article is an open access article distributed under the terms and conditions of the Creative Commons Attribution (CC BY) license (https://creativecommons.org/licenses/by/4.0/).