Abstract
Greenspace ecological networks (GENs) optimization is an effective way to prevent landscape fragmentation and promote ecological processes. Built land sprawl is an important factor affecting this optimization. However, few studies have specifically analyzed the encroachments caused by existing built land on GENs. Given the insights from China’s total built land control policy, this study proposed a new idea of linking GENs optimization into urban expansion planning through land transformation. This idea was implemented in the Su-Xi-Chang area and integrated a series of methods, emphasizing the importance of built land encroachments removal for restoring the connectivity and quality of GENs. We identified that the built land encroached on GENs. Furthermore, we proposed to transfer the scattered rural/industrial land, whose amount was set as the land quota for urban expansion planning. Four scenarios of urban expansion were simulated based on China’s land use policies/practices and assessed by landscape metrics. The land transformation happened between rural and urban land. The main findings indicated that more inclusive urban expansion planning with consideration of the GENs optimization can be obtained. This study has practical contributions regarding GENs optimization and urban expansion planning for policymakers and our ideas of land transformation provide a reference for similar studies.
1. Introduction
Land use and land cover changed significantly due to the rapid development of urbanization []. Urban expansion characterized by ever-increasing built land aims to support an increasing human population and their activities []. However, it has widely fragmented landscape patterns and substantially isolated the greenspace ecological networks (GENs), surroundings, and urban areas [,]. As an inherent part of urban ecological security patterns, GENs play an important role in promoting various ecological processes and resisting the negative effects of human activities []. However, the built land sprawl encroaching on GENs is particularly serious, weakening the connectivity of ecological processes and constraining spatial movements of species.
For decades, China’s rapid urbanization process was characterized by inordinate built land growth. This process led to a low-density and scattered land use pattern in space (especially in suburban and rural areas) []. In 2014, the Chinese central government enacted a land use policy to control the total built land with no net change even to reduce [,,]. The policy aimed to improve the land use efficiency of existing built land, especially for the spatial adjustments of the scattered rural/industrial land through land transformation [,]. At the same time, using the built land quota as a tool for urban expansion management in China encouraged the reduction of scattered rural land that could be transferred to the newly-added urban land quota approved in urban planning. Eastern coastal China, with a relatively high density of population and rate of urbanization, was selected as a pioneer area for this policy implementation []. However, due to the vast loss of farmland and continued population growth in China’s urbanization context, the land transformation mainly focused on food security as well as land quota access in urban expansion planning [,,], while ignoring the restoration of the connectivity of GENs and the quality of corridors between important ecological sources. The policy background and practical experience allowed us an interface to link GENs optimization into urban expansion planning in the process of land transformation.
Previous studies have extensively explored the establishment and optimization of GENs for obtaining a relatively safe ecosystem and sustainable landscape pattern. For example, methods including the indicator assessment system [] and morphological spatial pattern analysis (MSPA) [,,] were applied to identify ecological sources, the gravity model [,], and circuit theory [,], and the least-cost paths (LCPs) [,] were applied to extract corridors of GENs, making them the priority of protection and optimization areas. However, the beneficial practice of those methods was mainly to delimit the landscape compositions/configurations of GENs one-way under the background of the increase of built land, with less consideration of the encroachments already on GENs from the existing built land. Indeed, removing encroachments is crucial for those fragile corridors that connect ecological sources of GENs and maintain ecological processes. Meanwhile, it becomes more difficult and even impossible to identify sizeable protection areas in urbanized areas []. Thus, the spatial adjustments of current land use patterns for improving the effectiveness of GENs are necessary. Few studies have specifically analyzed the encroachments on GENs and focused on restoring their connectivity and quality through the mentioned land transformation.
On the other hand, urban expansion has dramatically influenced the spatial characteristics of landscape patterns. Simulating urban expansion has been proven effective to formulate multiple scenarios of sustainable urban planning [,]. Present simulation approaches may consist of three procedures: (a) to predict the land demand for urban expansion during a set period, using various approaches such as regression analysis [] and the Markov-chain model [,]; (b) to identify the spatially explicit distribution of land plots as the supply for urban expansion under the constraints of predicted land demand as well as variables from natural and/or socioeconomic aspects. The cellular automata (CA) model and its extensions, such as the FLUS model [,] and CLUE-S model [] were most extensively applied in identifying the distribution of those newly-added land plots; (c) to assess the spatial patterns of urban expansion scenarios and recommend the optimal scenario for urban planning according to a set of indicator systems []. The balance of the land demand and supply for urban expansion was the discussion hotspot and many concerns revolved around how to solve both their spatial and quantitative conflicts. Apparently, most of the studies were based on the background of the total built land increase, and insufficient attention was paid to the potential adjustment of existing built land, especially in terms of land transformation for optimizing the connectivity and quality of GENs.
The objective of this study is to link the GENs optimization into urban expansion planning through a land transformation process under the precondition of the total built land with no net change. For this reason, a series of methods were applied in the Su-Xi-Chang area which experienced a rapid urbanization process. A combination of the MSPA and LCPs methods was used to establish GENs based on a comprehensive landscape resistance surface. The circuit theory incorporated corridor buffer analysis which was used to visualize and identify the encroachments on GENs. To optimize the connectivity and quality of GENs, those encroachments in particular caused by the scattered rural/industrial land were proposed to be transferred. Meanwhile, four scenarios for urban expansion simulation which were realized by a CA-based FLUS model were set based on China’s land use policies and management. In the land transformation process, the removal amount of encroachments as the constraint of the simulation was the key point. This study explored a new idea of improving the effectiveness of GENs in landscape and provided the reference for policymakers to make more inclusive planning of urban expansion with consideration of maintaining the connectivity of ecological processes.
2. Study Area and Data
2.1. Study Area
The Su-Xi-Chang area (an urban agglomeration consisting of three cities of Suzhou, Wuxi, and Changzhou) is the core region of the Yangtze River Delta Economic Zone and is located in the south of Jiangsu Province (30°46′–32°04′ N, 119°08′–121°20′ E), eastern coastal China (Figure 1). It covers an area of 17,658 km2 (Suzhou 8658 km2, Wuxi 4628 km2, and Changzhou 4372 km2) and has an average elevation below 50 m above sea level. This area is mainly plain and has abundant water bodies (up to 27%) but lacks forests (only 5.27%). It is rich in wild animals with over 200 species, including birds, amphibians, and reptiles, among which over 170 are birds and water birds are superior species. The northern subtropical monsoon climate dominates this region year-round, with an average annual temperature of 15.3 °C, and a mean annual rainfall of 1092.4 mm.
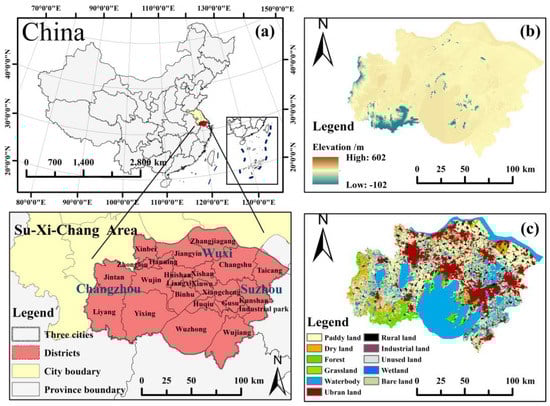
Figure 1.
Map (a) shows the location Su-Xi-Chang area and maps (b,c) show its elevation as well as land use and land cover in 2018.
The area has experienced a rapid urbanization process since the reform and opening-up of the late 1980s. Till 2015, the urbanization rate of the area was up to 74% (21.8 million permanent residents and a population density of 1236/km2). The total size of built land including urban, rural, and industrial land has expanded over tenfold in the past thirty years. Those encroachments of built land have caused great damage to ecosystems, including landscape and habitat fragmentation and ecological networks connectivity loss.
2.2. Data Source and Processing
The basic data used in this study and their sources are listed in Table 1. According to study purposes and regional landscape characteristics, land use and land cover were divided into paddy land, dry land, forest, grassland, waterbody, urban land, rural land, industrial land, wetland, bare land, and unused land (the details are described in Appendix A, Table A1). Based on regional context, the built land in this paper includes urban, rural, and industrial land. All data were transferred into a 90 m × 90 m resolution raster layer in ArcGIS 10.5.

Table 1.
The data and sources description.
3. Methodology
3.1. Greenspace Ecological Networks (GENs) Establishment and Encroachment Identification
3.1.1. Greenspace Ecological Networks (GENs) Establishment Based on MSPA and LCPs
The morphological spatial pattern analysis (MSPA) method was applied to identify ecological sources of GENs. Based on a series of morphological transformations, such as erosion, dilation, and anchored skeletonization, MSPA can measure, identify, and segment the spatial patterns of raster images []. These operations transfer the original binary image into a pixel-level map and allocate each foreground pixel to one of the mutually exclusive landscape classifications defined as core, islet, perforation, edge, bridge, loop, and branch [,]. Thereby, the core patches which are important for maintaining landscape connectivity and biodiversity were extracted as candidates of ecological sources. MSPA performed in Guidos Toolbox can be applied to analyze any size images while some parameters are required. In this study, forests as the major habitats and green spaces of regional species were set as foreground with a value of one, and the other land use types were set as background with a value of two. Those values were transformed into raster maps with a spatial resolution of 90 m, and an eight-neighborhood rule was selected.
The least-cost paths (LCPs) method was adopted to extract ecological corridors. It has been one of the principal ways of analyzing and simulating the potential corridors for spatial movements of species [,]. LCPs analysis was based on graph theory and used a raster-based algorithm that weighed the minimal cost distance between ecological sources and destinations. Its core step was creating a resistance surface that was weighted and combined from different spatially explicit factors according to their facilitating and hindering impacts on the movement process. In this study, we mainly considered improving landscape connectivity for regional species movement. According to related literature [,], factors including land use/land cover, distance to main roads, elevation, and vegetation were used to set resistance values and generated a comprehensive landscape resistance surface (Table 2). Each indicator was classed into several factors at the secondary level, and each factor was assigned a value of 1-9. We used the method of expert scoring to determine the weight of each factor. The cost-weighted distance (CWD) and LCPs were calculated by the linkage paths tool in Linkage mapper 2.0.0 based on the platform of ArcGIS 10.5.
Table 2.
Resistance value assignment in LCPs simulation.
3.1.2. Encroachment Identification Based on Circuit Theory and Buffer Analysis
We used circuit theory based on Linkage Mapper to map the connectivity among the GENs. This theory refers to the characteristic of an electron’s random walk in the circuit in physics to simulate the migration and movement process of ecological flow. It has been extensively applied in mapping networks such as GENs in heterogeneous landscapes [,]. Accordingly, we used two tools (i.e., Pinchpoint Mapper and Barrier Mapper) in Linkage Mapper to identify the pinch points and barriers, that is encroachments, to maintain the integrity and connectivity of GENs.
Pinchpoint Mapper, which is based on electrical current flow models, can identify the pinch points, i.e., bottleneck or chokepoints in LCPs, which constrain the ecological processes including species movement due to human disturbance and the associated unfavorable land use/cover changes [,]. Those areas with higher current density indicate the possibility of ecological flows and even a small encroachment can present a serious impact on connectivity. Before running the tool, a user-specified CWD cut-off width needs to be assigned. Due to no impact on the spatial distribution of pinch points, we were interested in the spatial relationships between such areas and built land, and thus, assigned a value of 30000 according to []. The All-to-One mode was selected for raster centrality calculations. Barrier Mapper detects important barriers that affect the quality of the corridors by analyzing the CWD surface with a moving window. A supposed radius of detection needs to be set. This study set a variable radius from 200 m to 800 m based on our study purposes and regional landscape heterogeneity, with an interval of 200 m.
Buffer analysis was also conducted since the LCPs failed to give an idea of actual corridor width and visualize the degree of built land encroachment on GENs. Indeed, the width of the corridor that constituted a part of GENs was often abstract and had inconsistent setting criteria in previous studies. For example, the criteria of width setting normally considered the characteristics of regional focal species and landscape patterns in the species movement process []. Our study area is abundant with birds/waterbirds species diversity. Factors such as size, intelligence, and flight initiation distance of the bird have been stated to influence their requirements of corridor width [,]. Based on the above considerations, this study set a 200 m threshold buffer analysis distance to express our ideas that GENs were encroached by built land. A spatial overlap tool was additionally used to identify those encroachments in ArcGIS 10.5.
Finally, according to the circuit model and buffer analysis, the encroachment of built land on GENs was proposed to be transferred. Among those lands, rural/industrial land adjustments supported by current land use policies were justifiably integrated into this transformation process [,]. In this study, we assumed that the two categories of land use that needed to be removed were replaced by dry land according to suitability and practical experience (e.g., land consolidation and reclamation in Chinese rural areas) []. Considering economic benefits and operability, the transfer of urban land was excluded from the scope of land transformation. Based on the policy of total built land control, the decrease of rural land needed to be linked to the increase of urban land [,]. Thus, areas for urban expansion should be simulated.
3.2. Scenarios of Urban Expansion Simulation
3.2.1. Scenario Settings
We set four scenarios for implementing the transformation between rural/industrial land (which was identified as encroachments on GENs) and urban land (which was simulated as newly added land for urban expansion), based on current land use policies and management in China. The scenarios are set as below:
Scenario A: The land transformation could be implemented throughout the entire area, without limitations of the city boundary and considerations of development priority of each administrative unit (23 districts).
Scenario B: The land transformation could be implemented throughout the entire area, without limitations of the city boundary and but considering the development priority of administrative units.
Scenario C: The land transformation could be implemented within an individual city, with limitations of the city boundary and without considerations of development priority of administrative unit.
Scenario D: The land transformation could be implemented within an individual city, with limitations of the city boundary but considering the development priority of administrative units.
In China, the policy of total built land control policy, in practice, was well interacted with the policies of built land quotas for urban expansion management and the balance of increase and decrease of urban and rural land [,,]. The formerly designated ceilings for urban land expansion, in terms of amount, during a defined planning period with every administration unit []. The latter encouraged local governments to reclaim and consolidate the scattered even idle rural/industrial land into farmland in exchange for land quotas of urban expansion within the jurisdiction [,]. Thus, the land transformation, which means the spatial exchange with equal amount happened between the rural and urban land, was associated with the total built land control policy and can be implemented. In addition, due to regional differences, the implementation practically becomes flexible, such as limited in a city or cross-city boundary. The policy background for supporting our scenario setting basis has already been well-documented in previous studies [,,,,].
Moreover, the spatial patterns and dynamics of urban expansion in China were highly uneven and unequal even at the district level [,]. Our study area consists of 23 districts with different socioeconomic conditions that demanded different land quotas for urban expansion. In planning, the land quotas approved by up-level governments were usually decided based on the indicators including gross domestic product (GDP), GDP per capita, GDP per square kilometer, population/population density, and road network density [,,,]. This study selected those indicators to assess the 23 districts’ development priority of urban expansion in the process of simulation. The value of those indicators was rasterized and normalized with equal weight into a comprehensive value in ArcGIS 10.5. The development priority was introduced into urban expansion simulation according to scenario settings.
3.2.2. Urban Expansion Simulation Using a CA-Based FLUS Model
To realize the total built land with no net change, this study used the FLUS model to identify the optimal land use for urban expansion to make a spatial exchange with the identified rural/industrial land encroaching GENs. The FLUS model, developed based on traditional cellular automaton (CA), consists of two modules: (1) an artificial neural network (ANN) was used to train and calculate the probability of occurrence of each land use type on a specific raster map; (2) an elaborated self-adaptive inertia and competition mechanism for analyzing the competition and interactions among different land use types.
In the first module, this study selected elevation, slope, road accessibility, and distance to main water bodies and city centers to calculate the probability of occurrence in Scenario A and C, and additionally introduced the variable of development priority in Scenario B and D. The distance-related variables were generated by the Euclidean distance tool in ArcGIS. Based on the land use data of the study area in 2018, the ANN approach was applied by random sampling training with a 5% sample proportion. In the second module, different from the traditional method of incompletely considering the ecological sources as spatial constraints, this study designated the GENs as well as their corridor buffers as spatially restricted areas. We aimed to increase urban land, and thus, set a corresponding pixel number of urban land (i.e., the land quota for urban expansion) equaling to the removed rural/industrial land encroaching GENs. According to the scenario settings, the respective land quota of three cities in Scenario A and B was not limited but their sum was equal to the total removed encroachments, while limited in Scenario C and D and consistent with their identified encroachments within city jurisdiction.
In addition, two parameters were required for the model processing. The weight of the neighborhood indicates the difficulty of the degree of conversion from one land use type to another. A value that is closer to one means a stronger expansion capacity of the land use type. Here, the weight neighborhood for each land use type was set based on the related literature and our study purposes [,,]. The cost matrix describes the permission of conversion from one land use type to another, and the value of one means conversion is permitted and zero means not. To identify the optimal land use for urban expansion and realize the transformation between rural and urban land, we only needed to consider the possible land use types for converting into urban lands. The conversions among the other land use types were excluded in our scope. Thus, based on regional context, paddy land, dry land, grassland, bare land, and unused land were assigned a value of one in the matrix, while the important ecological land including forest, water body, and wetland were assigned a value of zero.
We used the kappa coefficient to validate the performance of the FLUS model. In general, the kappa coefficient varying from 0.6–0.8 suggests high simulation consistency, and varying from 0.9–1.0 suggests almost complete consistency. In this study, land use data in 2015 were set as an initial land use pattern status to predict land use in 2018. Each simulation of scenarios has conducted the validation. Comparing the real land use in 2018 with the predicted land use in 2015 using the FLUS model, we found the kappa coefficient of every scenario was up to 0.9. The validation process showed that the FLUS model has a high accuracy of urban expansion simulation in the study area. Thus, it is reliable for this study to use the validated parameters to predict the spatial allocation of newly added urban lands for transformation.
4. Results
4.1. Greenspace Ecological Networks (GENs) Establishment and Encroachment Identification
4.1.1. GENs Establishment
Figure 2 shows the core areas as ecological sources identified by morphological spatial pattern analysis (MSPA) and the corridors between those sources extracted based on the resistance surface through the least-cost paths (LCPs) method. The GENs consisted of those sources with a total number of 69 and an area of 703.90 km2, as well as corridors with a total number of 144 and length of 1600.36 km. In spatial distribution, most patches of ecological sources were distributed in the southwest of the study area and characterized with high proximity and bigger area. An appreciable amount of patches were mainly distributed northeast of Takehu lake, the biggest water body of the study area. Moreover, about 20% of patches with the small area were scattered to the northeast of the study area. In general, the GENs were fragmented by the developed lands for urbanization so that longer ecological corridors were needed to connect those remote ecological source patches, such as the long corridors between nodes 45 and 57, 40 and 55, and the almost isolated nodes of 39, 46, 59, and 69.
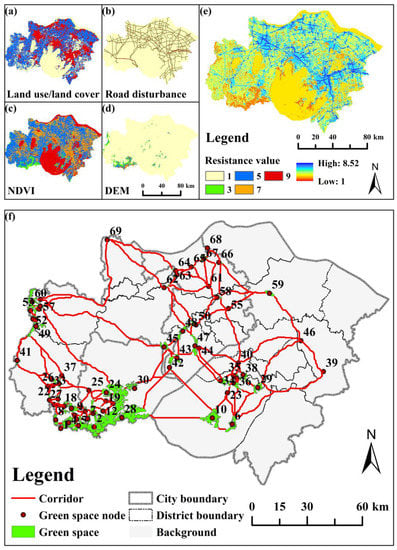
Figure 2.
Maps of greenspace ecological networks (GENs) and resistance surface simulation in the Su-Xi-Chang area. (a–d) are the individual resistance maps generated by the selected factors including land use/land cover, distance to the main road, elevation, and vegetation (represent by the normalized differential vegetation index i.e., NDVI.); (e) is the comprehensive resistance map weighted overlay of those four maps; (f) showed the overall GENs in the study area.
4.1.2. Encroachment Identification and Analysis
As documented in Methodology, the circuit theory applied in identifying encroachments on GENs consisted of two parts. The pinch point analysis (Figure 3a,b) suggests the highly constrained areas to the unconstrainted areas allow the ecological processes like species movements along the corridors. Areas with high current values indicated the corridor bottlenecks and were most vulnerable to constrain ecological processes. Those areas were mainly distributed in the west, southwestern, and central of the Su-Xi-Chang area, and all of which were surrounded by high-density built land. In Figure 3b, through a spatial overlap with the built land of the study area, it was obvious that where the bottlenecks that occurred were the places where built land encroached GENs and stressed the corridors seriously. Furthermore, those encroachments were mainly composited of urban land and rural lands, when the former was characterized by continuous and large areas and the latter was numerous, scattered, and small. Further encroaching GENs and narrowing the pinch points may disrupt the already weak connectivity of the networks and isolated more important ecological sources. In addition, the barrier analysis (Figure 3c,d) shows that the important barriers affected the quality of the corridors. The high barrier impact score implied the strong encroachment of unfavorable land use/cover and most potential restoration actions can improve the quality of GENs such as connectivity. Visualization in Figure 3d, these barriers mainly corresponded to the urban land, rural land, and a small part of industrial land affecting the corridors, in particular, the scattered rural/industrial land extensively caused the highest impact score. Therefore, GENs restoration actions referring to encroachments removal and transfer through the land transformation process in this study were necessary.
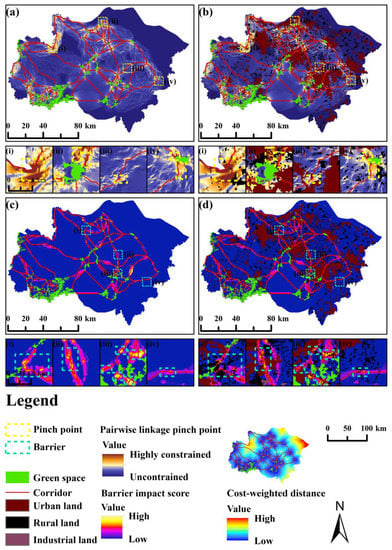
Figure 3.
Maps of pinch point (a) and barrier (c) analysis results based on circuit theory. To visualize the encroachments caused by built land, layers of urban, rural, and industrial land were added to the maps of (b,d), respectively based on maps of (a,c). (i), (ii), (iii) and (iv) show the details.
Figure 4 shows the landscape compositions of corridor buffer with a 200 m threshold analysis distance, and their quantitative statistics are elaborated in Figure 5 and Figure 6. Due to the landscape characteristics of the Su-Xi-Chang area, the major compositions of GENs’ corridors buffer were paddy land (36.23%) and water body (37.15%), and a considerable amount of built land including urban land (41.58 km2 and 7.6%), rural land (27.23 km2 and 5.0%) and industrial land (1.25 km2 and 0.22%). According to the Methodology, the rural/industrial land within corridor buffer and encroaching GENs were proposed to be transferred through land transformation, which allocated in Suzhou 4.90 km2, Wuxi 11.10 km2, and Changzhou 12.48 km2, respectively.
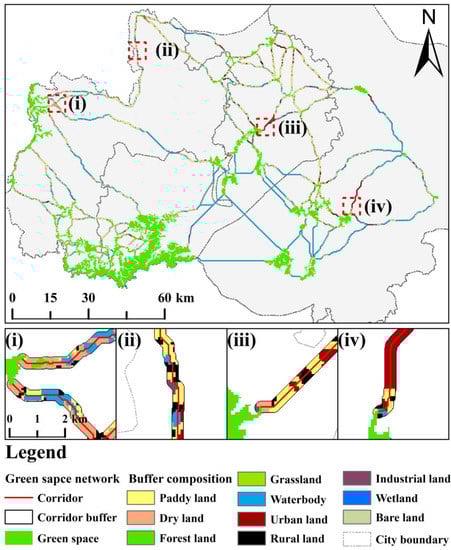
Figure 4.
Maps of landscape composition within corridors buffer of greenspace ecological networks (GENs). The sub-figure (i–iv) shows the detailed land use/land cover composited the buffer areas.
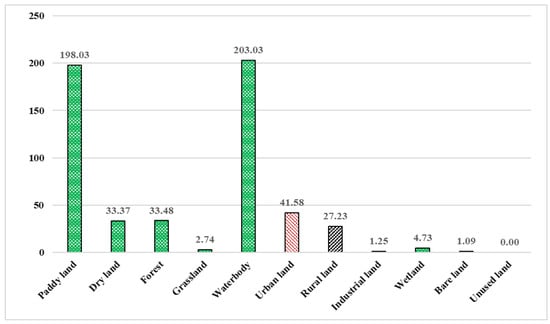
Figure 5.
Landscape composition and area of encroachments within corridors buffer of GENs (km2).
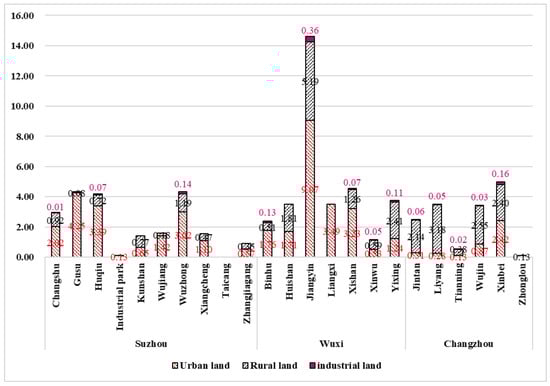
Figure 6.
Amount of built land encroachments on GENs of each city and district (km2).
4.2. Scenarios of Urban Expansion Simulation
In the FLUS model processing, the development priority of administrative units, in terms of the land quota allot for urban expansion assessed by a set of indicators (Figure 7), was introduced in Scenario B and D in contrast to Scenario A and C. The assessment results showed that districts such as Jiangyin, Kunshan, and Industrial park were of the high level of development priority, and districts such as Jintan, Liyang Wuzhong, and Binhu were of the low, suggesting the differences in development status in the internal study area.
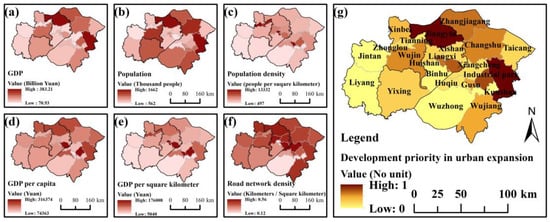
Figure 7.
Assessment results of development priority of 23 districts in our study area. The priority was quantized by the normalization of six indicators including GDP (a), population (b), population density (c), GDP per capita (d), GDP per square kilometer (e), and road network density (f) in 2018, which were commonly used as criteria of land quota for urban expansion in the Chinese context. (g) shows the comprehensive development priority of the 23 districts calculated by the six indicators with equal weight.
Figure 8 and Table 3 show the spatial patterns and amount of newly added urban land of four scenarios in urban expansion simulated by the FLUS model. Since the amount of encroachments removed on GENs decided the ceilings of land quota allotted for urban expansion (i.e., 28.48 km2 of the newly-added urban land generated by the model), the constraints of the city boundary and development priority of administrative units caused the differences of the four scenarios. Spatially, almost all newly added urban land was attached to the original urban land, distributed on plains and gentle slopes, and closed to main water bodies and roads of the study area. In scenario A, the newly added urban land was scattered and sprawling, while in Scenario B, the newly added urban land was more concentrated and tended to gather in districts with high development priority. Among the three cities, Suzhou with the most competition capacity, such as in terms of population and GDP, whose newly added urban land increased from 11.86 km2 to 14.23 km2 (Table 3). By comparing Scenario C to D, with the precondition of the determined ceiling of newly added urban land (i.e., Suzhou 4.89 km2, Wuxi 11.10 km2, Changzhou 12.49 km2), the tendency of newly added urban land to be concentrated in districts with higher development priority within the jurisdiction of each city was more obvious. For example, the districts of Industrial Park increased from 0.29 km2 to 1.69 km2 and Xiangchang increased 0.78 km2 to 1.76 km2. The above findings suggested that the limitation of administrative boundaries and the variable of development priority would impact the spatial patterns of urban expansion causing differences. Furthermore, those differences could be magnified in the scaling process, that is, from the city level down to the district level in this study.
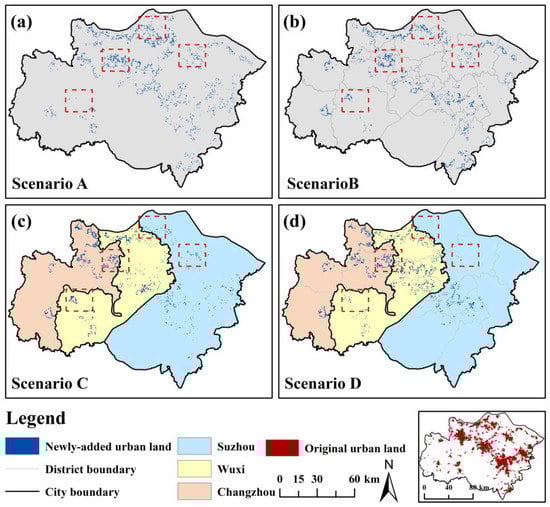
Figure 8.
(a) Scenario A, (b) Scenario B, (c) Scenario C, (d) Scenario D. Simulation results of urban expansion based on the FLUS model and maps show the spatial distribution of newly added urban land in Scenario A, B, C, and D. Some of the obvious differences are marked by rectangular boxes.
Table 3.
Calculation results of the land amount that can be allotted to urban expansion planning in each city and district based on the removed rural/industrial land encroaching on GENs (km2).
4.3. Landscape Metric Calculation Results
Eleven landscape metrics were calculated to identify the differences among the four scenarios of urban land spatial patterns in the simulation and transformation process. The results showed that all four scenarios were optimized, and obtained a compact, continuous, and less fragmented urban land spatial pattern (Table 4). For example, the values of Mean Patch Area Distribution (AREA_MM), Mean Shape Index Distribution (SHAPE_MM), Fractal Dimension Index (FRAC_MN), and Mean Contiguity Index Distribution (CONTIG_MN) increased and Number of Patches (NP) and Patch Density (PD) decreased, compared to the original urban land pattern. Since the amount of newly added urban land was the same in all four scenarios, the value of Percentage of Landscape (PLAND) was equal to 17.0901 and greater than the original 16.9288. Scenario A had the highest value Landscape Shape Index (LSI), AREA_MN, SHAPE_MN, FRAC_MN, and CONTIG_MN, and the lowest NP and PD. Those values suggested that the spatial pattern of urban land in Scenario A had a larger mean patch area and better landscape complexity and connectivity, appearing less fragmented. Without the limitation of the city boundary and impacted by the development priority, Scenario B had the highest value of Largest Patch Index (LPI). The index of LPI means the proportion of the largest patch in the landscape, and its increase indicated that the spatial pattern of urban land presented the tendency of polycentric to monocentric. Meanwhile, the Aggregation Index (AI) increased most in Scenario B as the spatial urban pattern of urban land was increasingly aggregated. However, when the city boundary was considered and no development priority was introduced, the newly added urban land led to a more continuous spatial pattern of urban land in Scenario C, with the largest Mean Proximity Index (PROX_MN) value. In general, our findings implied the constraints of city boundaries and more socioeconomic variables (i.e., development priority) determining the land quota for urban expansion would lead to a more fragmented spatial pattern, for example, Scenario D. From the perspective of regional landscape pattern optimization, this paper recommended Scenario A as potential policymaking for the planning of urban expansion.
Table 4.
Landscape metrics calculations results of spatial patterns of urban land expansion.
5. Discussion
5.1. The Importance of Land Transformation
Ecological connectivity is a global priority for protecting biodiversity and the ecosystem []. In recent decades, rapid urbanization and the associated human activities caused the fragmentation of green spaces and the loss of the natural landscape matrix profoundly. The phenomenon of ecological connectivity degradation is serious, as the encroachments on greenspace ecological networks (GENs) caused by built land sprawl increase. The normal ecological processes including spatial movements of species are blocked []. Establishing and optimizing GENs provide effective ways to restore the connectivity among ecological patches and facilitate the ecological process, but little attention has been paid to an approach of land transformation. The optimization of GENs means improving the network connectivity and quality, including optimization of ecological patches and corridors. The former could be realized by increasing the area and amount of patches, meaning to designate more land use for protection. Extensive explorations on this aspect have effectively alleviated the loss of ecological connectivity and biodiversity in the landscape. However, designating more land use for protection is difficult because of limited land resources and intensive land development in rapidly urbanized areas. In reality, the size of protected areas in the world increased while the habitat loss and conservation situation declined [,]. This phenomenon highlights the need for research to focus on optimizing ecological corridors and adjusting current land use patterns. Of course, the increased amount of ecological patches will cause the corridors to increase subsequently. But the optimization of ecological corridors aims to repair or remove the encroachments (i.e., pinch points, barriers, and bottlenecks) in the corridors according to the degree of connectivity []. Those encroachments are usually caused by unfavorable land use and land cover, for example, built land with intensive human disturbance. This study emphasized the importance of the removal of those encroachments, especially those identified scattered rural/industrial land (Figure 3), for improving the connectivity and quality of GENs. The spatial adjustments of current land use patterns through land transformation were necessary and important.
Based on insights from China’s total built land control policy, the land transformation in this study refers to the transfer of the identified rural/industrial land, as the encroachments within GENs’ corridors buffer, into the newly added urban land in simulation models. We applied a series of methods to implement such a land transformation, such as circuit theory and a CA-based FLUS model. In these applications, the total built land with no net change was a precondition. It exists in China’s specific context of land use management and practice, providing us with a new idea of GENs optimization. But in most cases, the increase of built land is inevitable. Consequently, our proposed precondition will not be available and the new idea of GENs optimization will be questioned in terms of operability. Here, we found the existing alternatives could be used to satisfy the precondition. For example, multifunctional land use aims to meet a variety of social, economic, and ecological needs and has been widely recommended both in theoretical and practical contexts [,]. Current studies on this issue include spatial identification [,], evaluation and potential analysis [,], and multifunctional management and implementation, also involving green spaces design and planning [,]. However, less consideration has focused on restoring connectivity of GENs as well as the encroachments caused by current land use. Incorporating our idea into those alternatives will make our idea of land transformation available in various contexts and benefit better effectiveness of GENs and results of ecosystem protection.
5.2. Scenario Settings of Urban Expansion Simulation
We set four comparable scenarios of urban expansion simulation considering the limitations of administrative boundaries and the development priority of administrative units. In China, the local government can access land quota for urban expansion through reclaiming and consolidating the equal amount of rural land (e.g., idle settlements in rural areas). It means that the increase of urban land is linked with the decrease of rural land. However, due to the excessive economic development, the land quota was accessed radically without considering comprehensive factors such as the integrity and connectivity of GENs or the like. In addition, such land quota could be traded across administrative boundaries, especially in better economically developed areas, even locally break the ceiling of this quota in urban expansion planning []. Based on the above aspects, our scenario settings were in the line with the policy context and contained real practical experiences. We aimed to assess the landscape impact of multiple land transformation scenarios between rural and urban land. As a result, in Scenario A and B without the limitation of city boundaries, Suzhou with a more competitive capacity could access more land quota in the transformation process, increasing from 4.89 km2 to 11.86 km2 and 14.23 km2 respectively. Besides, although there was sufficient dry land and bare land in the study area, which were generally considered more suitable for urban expansion in practice, most of the newly added urban land in the FLUS model was converted from paddy land. The paddy land is protected in reality. It means that the built land increase in the study area is nearing saturation. More attention should be paid to the adjustment of the spatial patterns of the existing built land.
Scenarios could be flexibly set but should well-match the policies context and could be implemented when recommended. However, its implementation still faces difficulties due to some other issues which have not been well solved. For example, the land transformation involves the issues of stakeholder participation and ecological compensation. If the schemes of ecological compensation cannot be accepted by all stakeholders, the transformation will not be effectively implemented. Sometimes, issues of participation and compensation are more complex and have a greater impact on the implementation of the land transformation and flexibility of the scenario settings. Therefore, integrating those issues into related policies will promote the recommended scenario toward effective implementation. Furthermore, the idea of GENs establishment and optimization, in particular, the encroachments removal and connectivity restoration should be brought into various policies. This way, scenarios will be set well-matched with the policies. Those policies are capable to guarantee the recommended scenario being implemented in a higher effect.
5.3. Limitations
Despite the contribution of this study, it also has limitations that need to be improved in future research. A series of methods applied in this study facilitated the identification of the encroachments on GENs and the most favorable land use for urban expansion and helped to optimize the GENs and landscape patterns. But those methods provide little help to evaluate the heterogeneity within the urban landscape and whether urban land has been utilized in a highly efficient manner and the next step of urban expansion is sound. Besides, this study simplified the process of land transformation which was not overnight in reality. We only consider the potential adjustments of those scattered rural/industrial land for connectivity and quality improvements of GENs. Obviously, the encroachments caused by those continuous and concentrated urban land have excluded the scope of land transformation, which was commonly recognized as uneconomic. In fact, land transformation is a complicated issue affected by many variables even unpredictable, so that it is arbitrary to convert all identified encroachments. Stakeholders’ participatory planning may offer beneficial help for further improvements. Taking this participatory idea into consideration, useful variables can be generated to form equations with constraints and make this kind of transformation more practical and precise, especially in scaling and concrete implementations.
6. Conclusions
This study proposed a new idea of linking greenspace ecological networks (GENs) optimization into urban expansion planning through a process of land transformation. This idea was implemented in the Su-Xi-Chang area, one of the most urbanized areas in China, and was integrated in a series of methods. First, the morphological spatial pattern analysis (MSPA) method was applied to identify the major green spaces, i.e., the forests, as the ecological sources, and the least-cost paths (LCPs) method was used to extract the important ecological corridors of GENs based on a comprehensive landscape resistance surface. We mainly focus on restoring the connectivity and integrity of those corridors. Thus, circuit theory and corridor buffer analysis were used to visualize and identify the built land encroachments on GENs, in terms of landscape composition/configuration, amount as well as their impacts on connectivity. Among those encroachments, the scattered rural/industrial land was proposed to be removed and transferred according to the context of land use management and practical experience in China. Based on the precondition of total built land with no net change, the amount of encroachment removal was set as a constraint of four comparable scenarios of urban expansion simulation. Our scenarios considered the limitation of city boundaries and the development priority of administrative units (i.e., the 23 districts).
The results indicated that the GENs consisted of 69 ecological sources with a total area of 703.90 km2 and 144 corridors with a total length of 1600.36 km. Overall, the patches of greenspace were fragmented, some required to be connected by longer corridors, and some were almost isolated. The built land was the main cause of encroachments (i.e., pinch points, barriers, bottlenecks within GENs), in particular, the scattered rural/industrial land with a total area of 28.48 km2. Among the four scenarios, the spatial patterns of the newly added urban land were different, influenced by city boundaries and development priority, and those differences would be magnified in the scaling down from the city to the district. The calculation results of landscape metrics implied that all scenarios obtained optimized spatial patterns of urban land, but the introduction of administrative boundary and development priority would lead to a more fragmented urban landscape. From the perspective of landscape pattern optimization, Scenario A was recommended as potential policymaking for inclusive urban expansion planning, linking with GENs optimization.
China’s total built land control policy provides an analytical lens to link rural and urban land transformation and further allows us an opportunity to link GENs optimization to urban expansion planning. Current studies mainly focused on the establishment and optimization of GENs or alike based on the background of built land increase. But the designation of sizeable and numerous protected patches becomes more difficult especially in rapidly urbanized areas. It is necessary to pay attention to the importance of removing the built land encroachments within corridors to improve the connectivity and integrity of GENs. Based on regional characteristics, our applied methods not only revealed the impacts of built land encroachments on GENs but also assessed multiple scenarios of urban expansion simulation considering socioeconomic conditions. The results of the study have practical contributions regarding GENs optimization and urban expansion planning for policymakers and our ideas of land transformation provide a reference for similar studies.
Author Contributions
Conceptualization, Z.S. and W.W.; methodology, Z.S.; validation, Z.S. and W.W.; data curation, Z.S., S.T. and J.W.; writing—original draft preparation, Z.S., W.W. and M.C.; writing—review and editing, Z.S. and W.W.; visualization, Z.S., S.T. and J.W. supervision, W.W.; project administration, W.W.; funding acquisition, W.W. All authors have read and agreed to the published version of the manuscript.
Funding
This research was funded by the National Natural Science Foundation of China, grant number 41571176.
Data Availability Statement
The data that support the findings of this study are available from the corresponding author, Wei Wu, upon reasonable request.
Acknowledgments
This study was financially supported by the National Natural Science Foundation of China (Grant numbers 41571176) In writing this paper, the authors received much care and guidance from the authors’ friends and colleagues.
Conflicts of Interest
The authors declare no conflict of interest.
Appendix A
Table A1.
Land use and land cover (LULC) description.
Table A1.
Land use and land cover (LULC) description.
| LULC | Description |
|---|---|
| Paddy land | Refers to the cultivated land with guaranteed water sources and irrigation facilities, which can be irrigated normally in normal years for the cultivation of aquatic crops such as rice and lotus root. |
| Dry land | Cultivated land without irrigation sources or facilities and dependent on natural precipitation to grow crops; or cultivated land with water and irrigation facilities that can be irrigated normally in normal times of the year; and is mainly for growing vegetables |
| Forest | Refers to land that that dominated by arbor forest, shrub forest, bamboos, and mangrove. |
| Grassland | Refers to the land that dominated by herbaceous plants, with a coverage ≥ of 5% |
| Waterbody | Includes rivers, lakes, ponds, channels. |
| Urban land | Belongs to built land, and means the built-up areas within a city, county, and town. |
| Rural land | Belongs to built land, and means the settlement areas in a village. |
| Industrial land | Belongs to built land, particularly refers to land for industrial areas, quarries, oil fields, salt works, and quarries, as well as traffic roads, airports, docks, which isolate with residential areas at all levels. |
| Wetland | Includes river, lake, and sea beach, as well as marshland. |
| Bare land | Refers to the land covered by soil, rocks, sand, and gravel, with vegetation coverage < of 5% |
| Unused land | Includes Saline-alkali land and wilderness. |
| Built land | Refers the general term of urban land, rural land (settlements), and industrial land. |
References
- Kuang, W.; Du, G.; Lu, D.; Dou, Y.; Li, X.; Zhang, S.; Chi, W.; Dong, J.; Chen, G.; Yin, Z.; et al. Global observation of urban expansion and land-cover dynamics using satellite big-data. Sci. Bull. 2021, 66, 297–300. [Google Scholar] [CrossRef]
- Luo, J.; Zhang, X.; Wu, Y.; Shen, J.; Shen, L.; Xing, X. Urban land expansion and the floating population in China: For production or for living? Cities 2018, 74, 219–228. [Google Scholar] [CrossRef]
- Asabere, S.B.; Acheampong, R.A.; Ashiagbor, G.; Beckers, S.C.; Keck, M.; Erasmi, S.; Schanze, J.; Sauer, D. Urbanization, land use transformation and spatio-environmental impacts: Analyses of trends and implications in major metropolitan regions of Ghana. Land Use Policy 2020, 96, 104707. [Google Scholar] [CrossRef]
- Peng, J.; Zhao, H.; Liu, Y. Urban ecological corridors construction: A review. Acta Ecol. Sin. 2017, 37, 23–30. [Google Scholar] [CrossRef]
- Liu, Y.; Zhang, Z.; Zhou, Y. Efficiency of construction land allocation in China: An econometric analysis of panel data. Land Use Policy 2018, 74, 261–272. [Google Scholar] [CrossRef]
- Zhang, Z.; Liu, J.; Gu, X. Reduction of industrial land beyond Urban Development Boundary in Shanghai: Differences in policy responses and impact on towns and villages. Land Use Policy 2019, 82, 620–630. [Google Scholar] [CrossRef]
- Fang, C.; Yu, D.; Mao, H.; Bao, C.; Huang, J. Optimization Goals and Keys for the Spatial Pattern of China’s Urban Development. In China’s Urban Pattern; Fang, C., Yu, D., Mao, H., Bao, C., Huang, J., Eds.; Springer: Singapore, 2018; pp. 173–232. [Google Scholar]
- Ministry of Land and Resources. Guidelines on Promoting the Economical and Intensive Use of Land. Ministry of Land and Resources. Available online: http://www.gov.cn/xinwen/2014-09/26/content_2756852.htm (accessed on 15 May 2021).
- Wang, J.; Li, Y.R.; Wang, Q.Y.; Cheong, K.C. Urban-Rural Construction Land Replacement for More Sustainable Land Use and Regional Development in China: Policies and Practices. Land 2019, 8, 171. [Google Scholar] [CrossRef] [Green Version]
- Ma, B.; Tian, G.; Kong, L.; Liu, X. How China’s linked urban–rural construction land policy impacts rural landscape patterns: A simulation study in Tianjin, China. Landsc. Ecol. 2018, 33, 1417–1434. [Google Scholar] [CrossRef]
- Fang, L.; Tian, C. Construction land quotas as a tool for managing urban expansion. Landsc. Urban Plan. 2020, 195, 103727. [Google Scholar] [CrossRef]
- Zhang, Y.Q.; Chen, Z.J.; Cheng, Q.W.; Zhou, C.; Jiang, P.H.; Li, M.C.; Chen, D. Quota Restrictions on Land Use for Decelerating Urban Sprawl of Mega City: A Case Study of Shanghai, China. Sustainability 2016, 8, 17. [Google Scholar] [CrossRef] [Green Version]
- Wang, J.; Wu, Q.; Yan, S.Q.; Guo, G.C.; Peng, S.G. China’s local local governments breaking the land use planning quota: A strategic interaction perspective. Land Use Policy 2020, 92, 15. [Google Scholar] [CrossRef]
- Xu, W.; Wang, J.; Zhang, M.; Li, S. Construction of landscape ecological network based on landscape ecological risk assessment in a large-scale opencast coal mine area. J. Clean. Prod. 2020, 286, 125523. [Google Scholar] [CrossRef]
- Vogt, P.; Riitters, K.H.; Iwanowski, M.; Estreguil, C.; Kozak, J.; Soille, P. Mapping landscape corridors. Ecol. Indic. 2007, 7, 481–488. [Google Scholar] [CrossRef]
- Wang, K.; Li, Z.; Zhang, J.; Wu, X.; Jia, M.; Wu, L. Built-up land expansion and its impacts on optimizing green infrastructure networks in a resource-dependent city. Sustain. Cities Soc. 2020, 55, 102026. [Google Scholar] [CrossRef]
- Wanghe, K.; Guo, X.; Wang, M.; Zhuang, H.; Ahmad, S.; Khan, T.U.; Xiao, Y.; Luan, X.; Li, K. Gravity model toolbox: An automated and open-source ArcGIS tool to build and prioritize ecological corridors in urban landscapes. Glob. Ecol. Conserv. 2020, 22, e01012. [Google Scholar] [CrossRef]
- Kong, F.; Yin, H.; Nakagoshi, N.; Zong, Y. Urban green space network development for biodiversity conservation: Identification based on graph theory and gravity modeling. Landsc. Urban Plan. 2010, 95, 16–27. [Google Scholar] [CrossRef]
- Kong, F.; Wang, D.; Yin, H.; Dronova, I.; Fei, F.; Chen, J.; Pu, Y.; Li, M. Coupling urban 3-D information and circuit theory to advance the development of urban ecological networks. Conserv. Biol. 2021, 35, 1140–1150. [Google Scholar] [CrossRef]
- Peng, J.; Yang, Y.; Liu, Y.; Hu, Y.; Du, Y.; Meersmans, J.; Qiu, S. Linking ecosystem services and circuit theory to identify ecological security patterns. Sci. Total Environ. 2018, 644, 781–790. [Google Scholar] [CrossRef] [Green Version]
- Teng, M.; Wu, C.; Zhou, Z.; Lord, E.; Zheng, Z. Multipurpose greenway planning for changing cities: A framework integrating priorities and a least-cost path model. Landsc. Urban Plan. 2011, 103, 1–14. [Google Scholar] [CrossRef]
- Liu, Z.; Huang, Q.; Tang, G. Identification of urban flight corridors for migratory birds in the coastal regions of Shenzhen city based on three-dimensional landscapes. Landsc. Ecol. 2020, 36, 2043–2057. [Google Scholar] [CrossRef]
- Hu, R.; Gu, Y.; Luo, M.; Lu, Z.; Wei, M.; Zhong, J. Shifts in bird ranges and conservation priorities in China under climate change. PLoS ONE 2020, 15. [Google Scholar] [CrossRef]
- Zhang, Y.; Liu, Y.; Wang, Y.; Liu, D.; Xia, C.; Wang, Z.; Wang, H.; Liu, Y. Urban expansion simulation towards low-carbon development: A case study of Wuhan, China. Sustain. Cities Soc. 2020, 63, 102455. [Google Scholar] [CrossRef]
- Zhou, L.; Dang, X.; Sun, Q.; Wang, S. Multi-scenario simulation of urban land change in Shanghai by random forest and CA-Markov model. Sustain. Cities Soc. 2020, 55, 102045. [Google Scholar] [CrossRef]
- Cao, Y.; Zhang, X.; Fu, Y.; Lu, Z.; Shen, X. Urban spatial growth modeling using logistic regression and cellular automata: A case study of Hangzhou. Ecol. Indic. 2020, 113, 106200. [Google Scholar] [CrossRef]
- Siddiqui, A.; Siddiqui, A.; Maithani, S.; Jha, A.K.; Kumar, P.; Srivastav, S.K. Urban growth dynamics of an Indian metropolitan using CA Markov and Logistic Regression. Egypt. J. Remote Sens. Space Sci. 2018, 21, 229–236. [Google Scholar] [CrossRef]
- Liu, X.; Liang, X.; Li, X.; Xu, X.; Ou, J.; Chen, Y.; Li, S.; Wang, S.; Pei, F. A future land use simulation model (FLUS) for simulating multiple land use scenarios by coupling human and natural effects. Landsc. Urban Plan. 2017, 168, 94–116. [Google Scholar] [CrossRef]
- Liang, X.; Liu, X.; Li, X.; Chen, Y.; Tian, H.; Yao, Y. Delineating multi-scenario urban growth boundaries with a CA-based FLUS model and morphological method. Landsc. Urban Plan. 2018, 177, 47–63. [Google Scholar] [CrossRef]
- Huang, D.Q.; Huang, J.; Liu, T. Delimiting urban growth boundaries using the CLUE-S model with village administrative boundaries. Land Use Policy 2019, 82, 422–435. [Google Scholar] [CrossRef]
- Soille, P.; Vogt, P. Morphological segmentation of binary patterns. Pattern Recognit. Lett. 2009, 30, 456–459. [Google Scholar] [CrossRef]
- Li, H.; Li, D.; Li, T.; Qiao, Q.; Yang, J.; Zhang, H. Application of least-cost path model to identify a giant panda dispersal corridor network after the Wenchuan earthquake—Case study of Wolong Nature Reserve in China. Ecol. Model. 2010, 221, 944–952. [Google Scholar] [CrossRef]
- Ersoy, E.; Jorgensen, A.; Warren, P.H. Identifying multispecies connectivity corridors and the spatial pattern of the landscape. Urban For. Urban Green. 2018, 40, 308–322. [Google Scholar] [CrossRef]
- Su, K.; Yu, Q.; Yue, D.; Zhang, Q.; Yang, L.; Liu, Z.; Niu, T.; Sun, X. Simulation of a forest-grass ecological network in a typical desert oasis based on multiple scenes. Ecol. Model. 2019, 413, 108834. [Google Scholar] [CrossRef]
- Dickson, B.G.; Albano, C.M.; Anantharaman, R.; Beier, P.; Fargione, J.; Graves, T.A.; Gray, M.E.; Hall, K.R.; Lawler, J.J.; Leonard, P.B.; et al. Circuit-theory applications to connectivity science and conservation. Conserv. Biol. 2018, 33, 239–249. [Google Scholar] [CrossRef]
- McRae, B.H.; Dickson, B.G.; Keitt, T.H.; Shah, V.B. Using circuit theory to model connectivity in ecology, evolution, and conservation. Ecology 2008, 89, 2712–2724. [Google Scholar] [CrossRef] [PubMed]
- Xiao, S.C.; Wu, W.J.; Guo, J.; Ou, M.H.; Pueppke, S.G.; Ou, W.X.; Tao, Y. An evaluation framework for designing ecological security patterns and prioritizing ecological corridors: Application in Jiangsu Province, China. Landsc. Ecol. 2020, 35, 2517–2534. [Google Scholar] [CrossRef]
- King, D.I.; Chandler, R.B.; Collins, J.M.; Petersen, W.R.; Lautzenheiser, T.E. Effects of width, edge and habitat on the abundance and nesting success of scrub–shrub birds in powerline corridors. Biol. Conserv. 2009, 142, 2672–2680. [Google Scholar] [CrossRef]
- Cao, Y.; Zhang, X.; Zhang, X.; Li, H. The incremental construction land differentiated management framework: The perspective of land quota trading in China. Land Use Policy 2020, 96, 104675. [Google Scholar] [CrossRef]
- He, Q.; Tan, S.; Yin, C.; Zhou, M. Collaborative optimization of rural residential land consolidation and urban construction land expansion: A case study of Huangpi in Wuhan, China. Comput. Environ. Urban Syst. 2019, 74, 218–228. [Google Scholar] [CrossRef]
- Wang, X.G.; Su, F.Z.; Zhang, J.J.; Cheng, F.; Hu, W.Q.; Ding, Z. Construction land sprawl and reclamation in the Johor River Estuary of Malaysia since 1973. Ocean Coast. Manag. 2019, 171, 87–95. [Google Scholar] [CrossRef]
- Wei, Y.H.D.; Li, H.; Yue, W.Z. Urban land expansion and regional inequality in transitional China. Landsc. Urban Plan. 2017, 163, 17–31. [Google Scholar] [CrossRef]
- He, S.; Bayrak, M.M.; Lin, H. A comparative analysis of multi-scalar regional inequality in China. Geoforum 2017, 78, 1–11. [Google Scholar] [CrossRef]
- Li, G.; Li, F. Urban sprawl in China: Differences and socioeconomic drivers. Sci. Total Environ. 2019, 673, 367–377. [Google Scholar] [CrossRef]
- Li, C.; Li, J.X.; Wu, J.G. What drives urban growth in China? A multi-scale comparative analysis. Appl. Geogr. 2018, 98, 43–51. [Google Scholar] [CrossRef]
- Jin, W.F.; Zhou, C.S.; Liu, T.; Zhang, G.J. Exploring the factors affecting regional land development patterns at different developmental stages: Evidence from 289 Chinese cities. Cities 2019, 91, 193–201. [Google Scholar] [CrossRef]
- Zhong, Y.; Lin, A.W.; He, L.J.; Zhou, Z.G.; Yuan, M.X. Spatiotemporal Dynamics and Driving Forces of Urban Land-Use Expansion: A Case Study of the Yangtze River Economic Belt, China. Remote Sens. 2020, 12, 287. [Google Scholar] [CrossRef] [Green Version]
- Zhang, D.; Wang, X.; Qu, L.; Li, S.; Lin, Y.; Yao, R.; Zhou, X.; Li, J. Land use/cover predictions incorporating ecological security for the Yangtze River Delta region, China. Ecol. Indic. 2020, 119, 106841. [Google Scholar] [CrossRef]
- Long, Y.; Jin, X.; Yang, X.; Zhou, Y. Reconstruction of historical arable land use patterns using constrained cellular automata: A case study of Jiangsu, China. Appl. Geogr. 2014, 52, 67–77. [Google Scholar] [CrossRef]
- Mustafa, A.; Heppenstall, A.; Omrani, H.; Saadi, I.; Cools, M.; Teller, J. Modelling built-up expansion and densification with multinomial logistic regression, cellular automata and genetic algorithm. Comput. Environ. Urban Syst. 2018, 67, 147–156. [Google Scholar] [CrossRef] [Green Version]
- An, Y.; Liu, S.; Sun, Y.; Shi, F.; Beazley, R. Construction and optimization of an ecological network based on morphological spatial pattern analysis and circuit theory. Landsc. Ecol. 2020, 36, 2059–2076. [Google Scholar] [CrossRef]
- Stokstad, E. Global efforts to protect biodiversity fall short. Science 2020, 369, 1418. [Google Scholar] [CrossRef]
- Paloniemi, R.; Hujala, T.; Rantala, S.; Harlio, A.; Salomaa, A.; Primmer, E.; Pynnonen, S.; Arponen, A. Integrating Social and Ecological Knowledge for Targeting Voluntary Biodiversity Conservation. Conserv. Lett. 2017, 11, e12340. [Google Scholar] [CrossRef]
- Mander, Ü.; Helming, K.; Wiggering, H. Multifunctional Land Use: Meeting Future Demands for Landscape Goods and Services; Mander, Ü., Wiggering, H., Helming, K., Eds.; Springer: Berlin/Heidelberg, Germany, 2007; pp. 1–13. [Google Scholar]
- Otte, A.; Simmering, D.; Wolters, V. Biodiversity at the landscape level: Recent concepts and perspectives for multifunctional land use. Landsc. Ecol. 2007, 22, 639–642. [Google Scholar] [CrossRef]
- Liang, X.; Jin, X.; Ren, J.; Gu, Z.; Zhou, Y. A research framework of land use transition in Suzhou City coupled with land use structure and landscape multifunctionality. Sci. Total Environ. 2020, 737, 139932. [Google Scholar] [CrossRef]
- Liu, C.; Xu, Y.; Huang, A.; Liu, Y.; Wang, H.; Lu, L.; Sun, P.; Zheng, W. Spatial identification of land use multifunctionality at grid scale in farming-pastoral area: A case study of Zhangjiakou City, China. Habitat Int. 2018, 76, 48–61. [Google Scholar] [CrossRef]
- Fagerholm, N.; Eilola, S.; Kisanga, D.; Arki, V.; Käyhkö, N. Place-based landscape services and potential of participatory spatial planning in multifunctional rural landscapes in Southern highlands, Tanzania. Landsc. Ecol. 2019, 34, 1769–1787. [Google Scholar] [CrossRef] [Green Version]
- Paracchini, M.L.; Pacini, C.; Jones, M.L.M.; Pérez-Soba, M. An aggregation framework to link indicators associated with multifunctional land use to the stakeholder evaluation of policy options. Ecol. Indic. 2011, 11, 71–80. [Google Scholar] [CrossRef]
- Shi, W.; Woolley, H. Managing for Multifunctionality in Urban Open Spaces: Approaches for Sustainable Development. J. Urban Manag. 2014, 3, 3–21. [Google Scholar] [CrossRef]
- Zhang, Z.; Meerow, S.; Newell, J.P.; Lindquist, M. Enhancing landscape connectivity through multifunctional green infrastructure corridor modeling and design. Urban For. Urban Green. 2018, 38, 305–317. [Google Scholar] [CrossRef]
Publisher’s Note: MDPI stays neutral with regard to jurisdictional claims in published maps and institutional affiliations. |
© 2021 by the authors. Licensee MDPI, Basel, Switzerland. This article is an open access article distributed under the terms and conditions of the Creative Commons Attribution (CC BY) license (https://creativecommons.org/licenses/by/4.0/).