Article

A Network-Based Approach for Reducing Pedestrian Exposure to PM2.5 Induced by Road Traffic in Seoul

1
EcoBank Team, National Institute of Ecology, 1210 Geumgang-ro, Seocheon-gun 33657, Republic of Korea
2
Department of Forest Resources, Graduate School of Kookmin University, 77 Jeongneung-ro, Seongbuk-gu, Seoul 02707, Republic of Korea
3
Urban Forests Division, National Institute of Forest Science, 57 Hoegi-ro, Dongdaemun-gu, Seoul 02455, Republic of Korea
4
Department of Forest Environment and Systems, College of Science and Technology, Kookmin University, 77 Jeongneung-ro, Seongbuk-gu, Seoul 02707, Republic of Korea
*
Author to whom correspondence should be addressed.
Land 2021, 10(10), 1045; https://doi.org/10.3390/land10101045
Submission received: 17 August 2021 / Revised: 24 September 2021 / Accepted: 1 October 2021 / Published: 5 October 2021

Abstract

:
Urban plans for pedestrian-friendly environments by reducing exposure to air pollutants and enhancing movement are crucial for public health and accessibility of social infrastructure. Here, we develop a novel network analysis-based approach, which identifies pivotal local walkways that lower exposure risk to fine particulate matter (PM2.5) while improving the urban landscape connectivity. We employ an exponential distance-decay model and partial correlation analysis to estimate traffic-induced PM2.5 and to test the relationship between the proxies and actual PM2.5 concentrations, respectively. We use a proxy for pedestrians’ PM2.5 exposure as a movement cost when conducting network analyses to compute pedestrian network centrality, reflecting both low PM2.5 exposure risk and landscape connectivity. As a result, we found a significant contribution of traffic to the estimated PM2.5 exposure and PM2.5 concentrations. We also found that walkways make a large contribution to regional connectivity regardless of the estimated PM2.5 exposure risk owing to the composition and configuration of urban landscape elements. Regarding the spatial features and planning context, this study suggests four types of pedestrian networks to provide urban authorities with useful practical information in city-wide urban plans for enhancing walkability: PM2.5 reduction required; PM2.5 reduction recommended; optimal areas; and alternatives of optimal areas.

1. Introduction

The provision of a pedestrian-friendly environment to enhance citizens’ health is critical for urban planning [1]. However, particulate matter (PM), which harms human health, degrades the walking environment in urban areas [2,3,4,5]. PM has more threatening health impacts on urban pedestrians than other air pollutants, such as ozone and carbon monoxide, owing to the mixed effects of PM concentration, particle size, and time–space distribution [6]. Furthermore, PM with a particle size under 2.5 micrometers (PM2.5) is considered to be more harmful to health than that under 10 micrometers, because the former has a longer propagation distance, atmospheric residual time, and higher penetrability of the respiratory tracts [3,7,8]. Rising pollution levels has raised the need for urban planning and related studies more than ever before to help ensure a safe walking environment from fine dust.
Roadways emitting vehicle exhaust fumes have been emphasized as an epicenter of rising PM2.5 concentration levels in large cities, since PM2.5 is mainly caused by fossil-fuel combustion [9]. When comparing modes of local transport (e.g., walking, tram, bus, and motorcycle), people may be exposed to higher concentrations of PM2.5 in open-aired vehicles (e.g., auto-rickshaws and motorcycles) than in other transport modes with enclosed environments [10]. Similarly, cyclists and walkers may experience high concentrations of PM2.5 if their routes are surrounded by vehicular traffic that stops at or passes through sidewalks [11,12]. In other words, the health risk caused by PM2.5 exposure varies by the route that pedestrians choose to reach their destinations [6,10,13]. Network analysis-based approaches, which visually and quantitatively assess the connectivity pattern of pedestrian roads, are increasingly finding time-saving routes with low levels of air pollutants that can reduce exposure to PM2.5.
Exposure of pedestrians to PM2.5 has been generally assessed using network analysis by comparing the shortest-distance path with a low-exposure path between two nodes [14,15]. However, this approach does not interpret the entire urban space by identifying the key areas that contribute to improving the connectivity of regional networks [16]. Thus, the lack of regional perspectives has hindered this literature from considering city-wide urban plans that aim to enhance general accessibility of social, economic, and educational facilities [17] or regional connectivity by lining isolated areas [18]. Urban planners can provide practical ideas that incorporate various social benefits while reducing the exposure risk of PM2.5 and linking the landscape by adopting centrality and connectivity, which are fundamental concepts of network analysis.
In this study, we aim to present a practical approach to building an urban pedestrian network that can provide further insights into pedestrians’ different walking environments across the city while reducing exposure to PM2.5. We evaluate pedestrians’ exposure to PM2.5, considering the traffic volume of major roads based on PM2.5 dispersion models. This study also conducts network analyses based on the shortest path and circuit-theoretic approaches, which compute the estimated PM2.5 impact as the resistance or cost of the movement of urban pedestrians. Finally, the key walking areas that minimize exposure to PM2.5 (based on the shortest-path approach) and alternative walking areas (based on the circuit-theoretic approach) are compared and interpreted in terms of spatial context. In doing so, this study offers an integrated way to provide essential information to urban practitioners who consider promoting citizens’ health and mobility.

2. Materials and Methods

2.1. Study Area

We examined the case of the pedestrian environment in Seoul (N37° 34’ E126° 59’, WGS 84), the capital of South Korea, with an area of 605 km2 (Figure 1). Seoul is the cultural, economic, and political center of South Korea and is one of the world’s most densely populated metropolises (16,470 capita/km2) [19]. Seoul has the highest automobile utilization rate among major cities in South Korea, with high fine-dust levels mainly due to vehicle emissions [20]. Therefore, Seoul actively implements policies to reduce PM2.5 concentration, such as the supply of fossil-fuel-free cars and intensive management of diesel cars [21].

2.2. Data Collection and Analysis

2.2.1. PM2.5, Roadway, and Walkway Data

The PM2.5 concentration data in Geographic Information System-Database format were retrieved from real-time air quality datasets in the Air Korea data platform [22]. The data were measured hourly from 1 January 2019 to 31 December 2019 at 61 monitoring stations in Seoul and surrounding areas (Supplementary Figure S1). PM2.5 data were transformed into monthly, seasonal, and yearly average values for further statistical analyses. Roadway and footpath network data for Seoul were collected from the OpenStreetMap website (https://www.openstreetmap.org, accessed on 20 September 2020). For the walkway network data, consisting of sidewalks and footpaths, we removed polyline data, such as highways, tunnel roadways, overpasses, and underpasses, to leave only walkable paths in the data.

2.2.2. PM2.5 Effects of Roadway to Walkways

The Raster calculator function of ArcMap 10.5 (ESRI, Redlands, CA, USA) was used to render exponential distance-decay models into raster maps of 10 m resolution that estimated the impact of PM2.5 emissions from roadways to adjacent sidewalks and footpaths. The function was conducted using the following steps. First, we classified major roadways (i.e., trunk, motorway, primary, secondary, and tertiary) with the estimated weights as proxies for traffic volume as base raster files [23] (Table 1). The estimated weight showed a significant correlation (Pearson’s r = 0.641, p < 0.05) with the annual average daily traffic of 140 plots on the major roads, retrieved from the Seoul Traffic Information System [24]. Second, we calculated three exponential distance-decay coefficients, where the PM2.5 concentration is 5% of the initial value at 100 m, 200 m, and 500 m (henceforth, the models are referred to as 100M, 200M, and 500M, respectively) from major roadways, and applied them to five types of roadway raster files. The exponential distance-decay models were based on published research that traffic-related PM2.5 concentration decreases exponentially or drastically with increasing distance from the roadway up to a few hundred meters [25,26,27]. After using the Raster calculator, we obtained 15 raster files (5 types of roadways × 3 exponential decay coefficients) with scores that surrogate PM2.5 effects of roadways (hereafter, PMER) in Seoul. The five types of PMER raster images based on roadways were merged into three PMER raster images, each of which represented the results from 100M, 200M, and 500M. Finally, to extract the PMER scores on walkways only, the three PMER raster files were masked by the walkway network data for further analyses.

2.3. Partial Correlation Analysis

The relationship between the PMER scores and PM2.5 concentrations at the 61 atmospheric monitoring stations was analyzed by Spearman’s partial correlation analysis. NO3 and NH4+ highly contribute to PM2.5 concentrations and are strongly associated with vehicle emission sources in Seoul [20]. However, it has been reported that the contribution of air pollutants brought by northwesterly or westerly wind is also significant to PM2.5 concentrations in the Seoul metropolitan area [28]. For example, the PM2.5 concentrations tend to be particularly high in spring, partly due to Asian dust originating from China and the deserts of Kazakhstan and Mongolia, all located to the west of the study area. Thus, we set the longitude of each atmospheric monitoring station as a control variable in the analysis. PMER scores at the same locations of the monitoring stations were extracted from the three PMER raster layers developed in the previous step. Partial correlation analysis was performed using the pcor.test function from the ppcor package [29] in R software (R version 4.0.3).

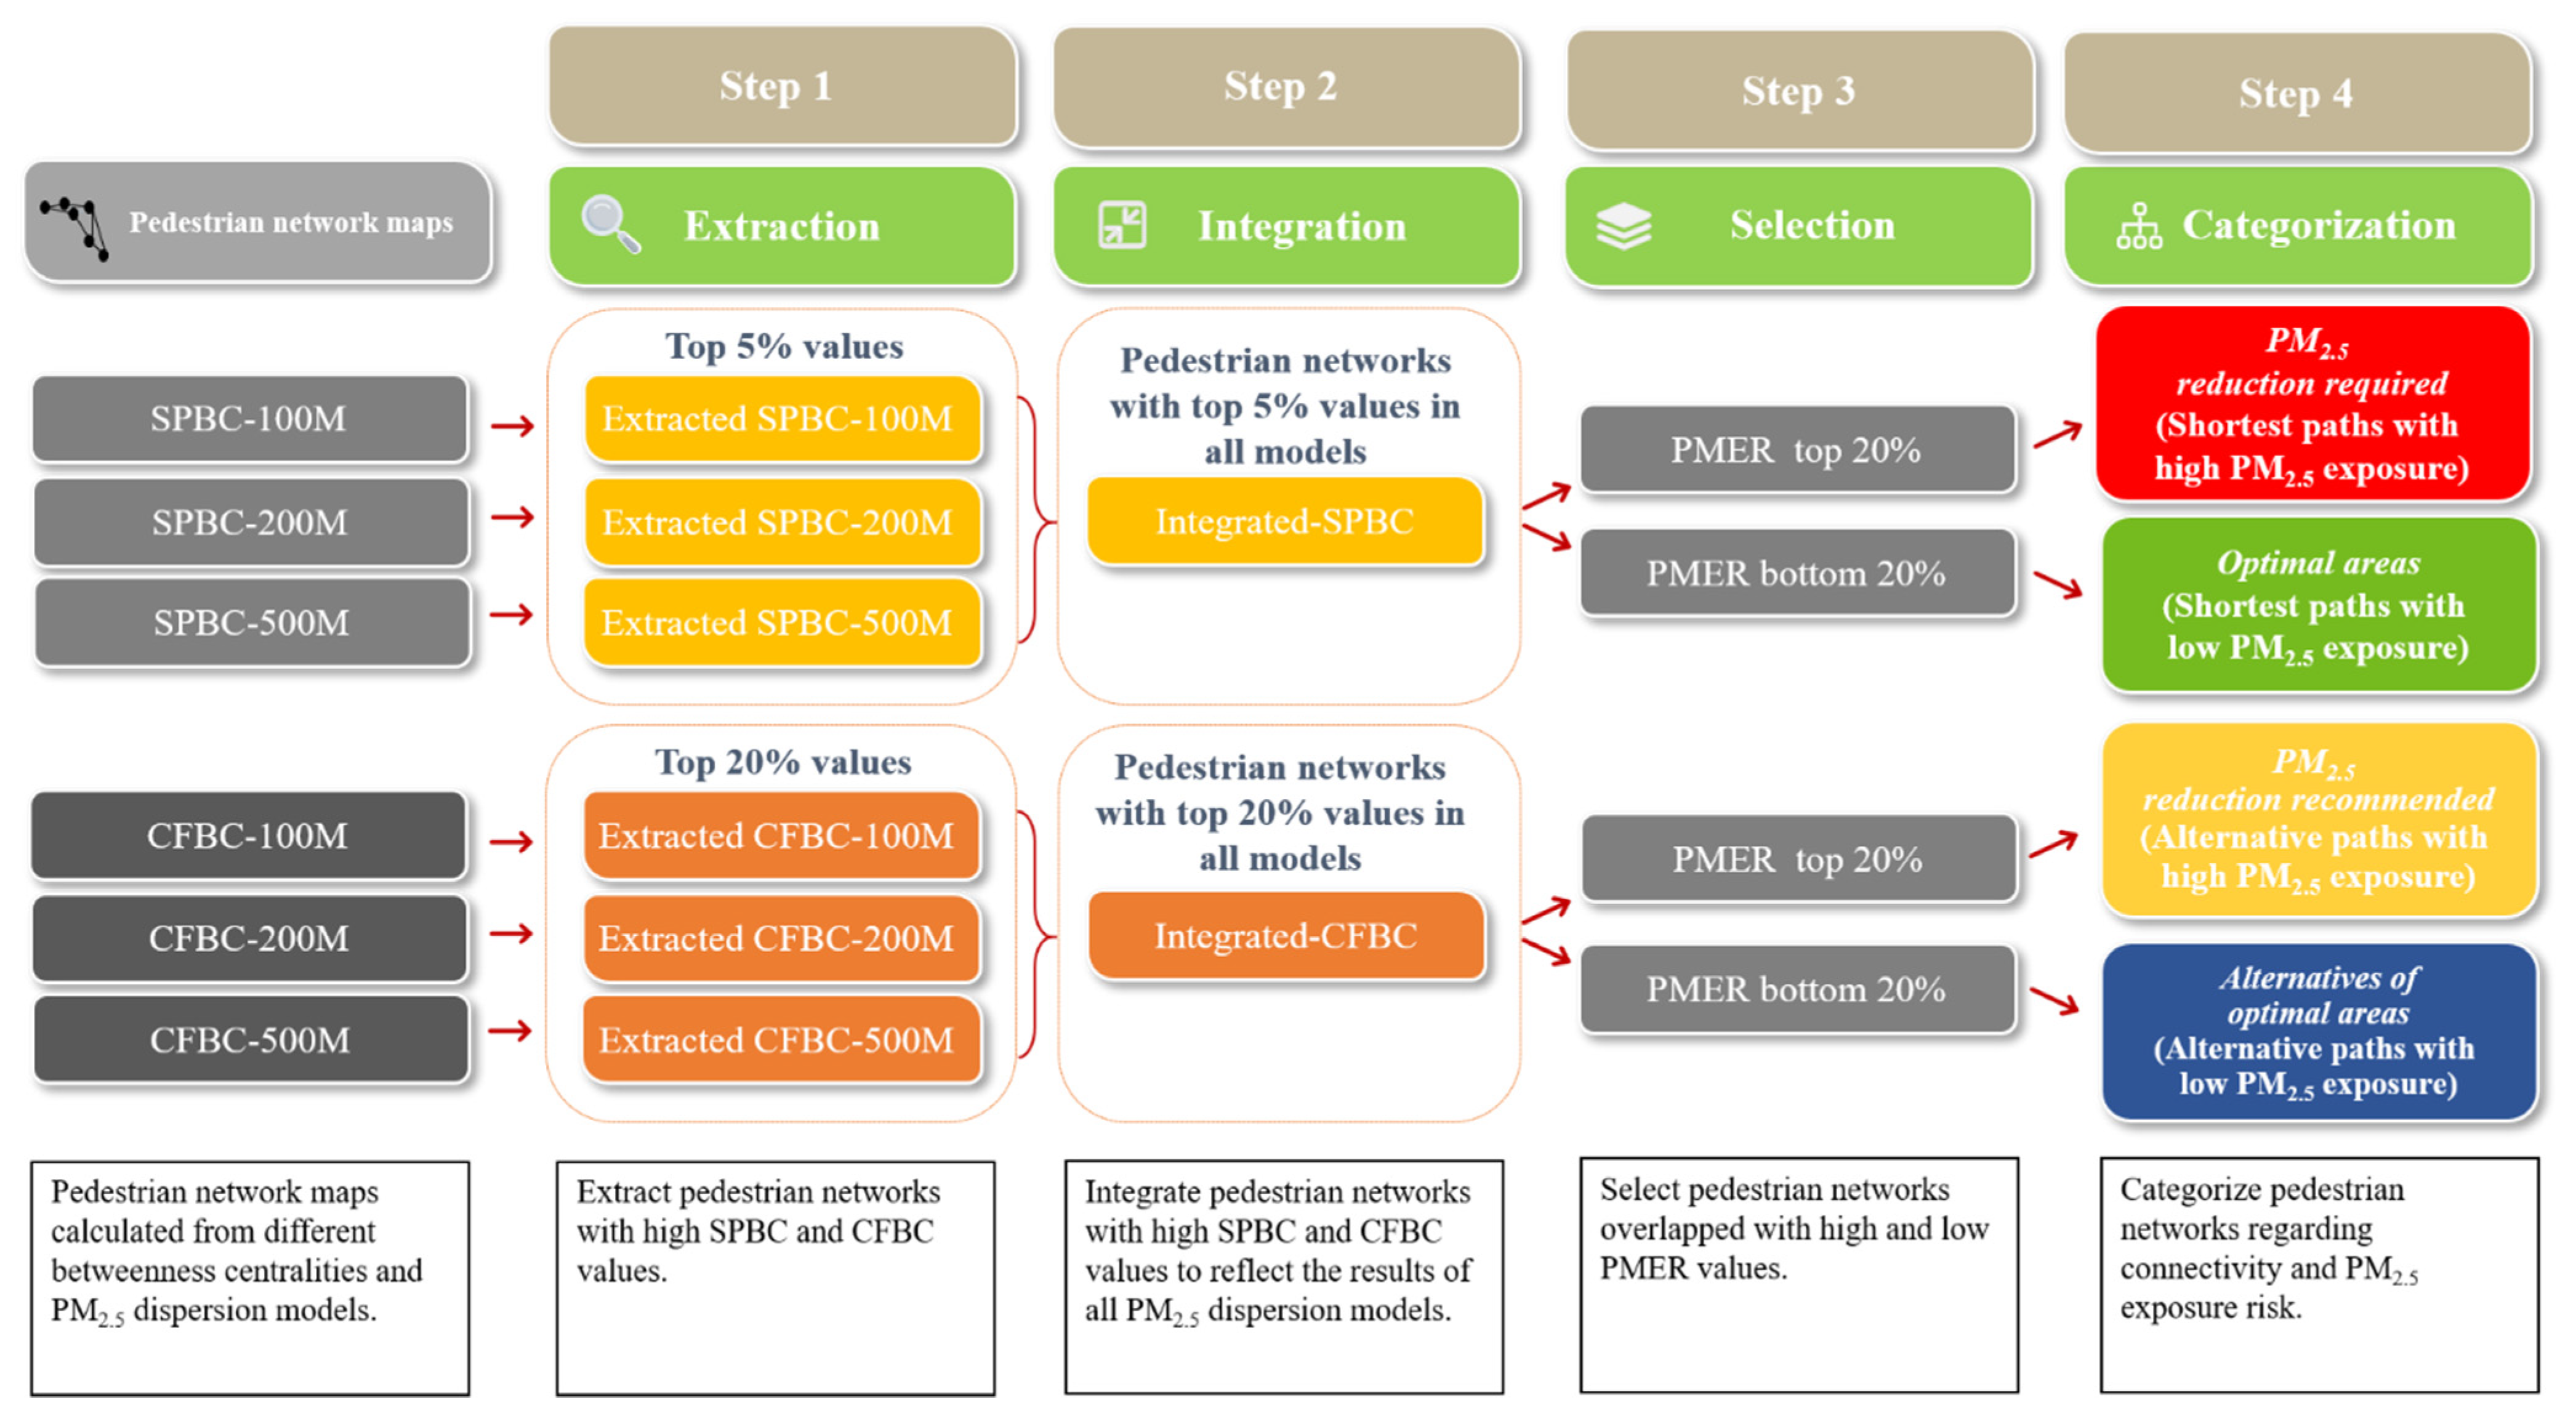
2.4. Pedestrian Network Analysis

We utilized shortest-path betweenness centrality (SPBC) and current-flow betweenness centrality (CFBC) provided in the Connectivity Analysis Toolkit [30] to map the pedestrian network in Seoul. Permeability maps with weight values that reflect the impact of PM2.5 on pedestrian roads in Seoul were needed to conduct connectivity analysis. The three PMER raster images in rectangular grids were spatially joined with 0.1-ha hexagonal grids to establish the permeability maps. This conversion enhanced the clarity in computing the nearest neighborhood owing to the equivalent position between neighboring hexagonal grids when conducting SPBC and CFBC analyses [31].
SPBC finds the shortest path between all pairs of hexagonal grids by minimizing the sum of PMER scores assigned to hexagonal grids. Meanwhile, CFBC considers all the alternative paths based on random walks as well as the shortest paths when computing the pathways between two hexagonal grids. Spatially, CFBC identifies linkage areas that encompass the linkages derived from SPBC. However, these areas are more diffusely distributed than those of SPBC [30]. Therefore, given these distribution characteristics, we identified key walking areas as hexagons with the top 5% and the top 20% of connectivity values for SPBC and CFBC, respectively, for pedestrian network mapping.
We sampled SPBC and CFBC values within hexagonal grids located on the five types of roadways to interpret the results. The mean centrality values were compared according to the three PM2.5 distance-decay models and the five roadway types. Finally, the results were categorized into four types of pedestrian networks based on centrality values and PMER scores (Figure 2). We define the four types of pedestrian networks as follows: (1) PM2.5 reduction required: pedestrian networks where PM2.5 reduction plans could be required owing to high SPBC values and exposure risk to PM2.5; (2) optimal areas: pedestrian networks that could have the most favorable conditions for walkers owing to high SPBC values and low exposure risk to PM2.5; (3) PM2.5 reduction recommended: areas that can be alternative routes for PM2.5 reduction required owing to high CFBC values and exposure risk to PM2.5; and (4) alternatives for optimal areas: areas with alternative routes to optimal areas owing to high CFBC values and low exposure risk to PM2.5.

3. Results

3.1. Partial Correlation Analysis

The partial correlation analysis revealed different degrees of the contribution of roadway traffic to PM2.5 concentrations for PM2.5 measurement periods and PM2.5 distance-decay models (Figure 3). All of the statistically significant relationships between PMER and PM2.5 exhibited positive correlation coefficients. In all PM2.5 distance-decay models, PMER was significantly correlated with PM2.5 concentration in March, December, and the whole of 2019 (p < 0.05). However, the correlation between PMER and PM2.5 concentration showed no significant associations from April to August, regardless of the PM2.5 distance-decay models. Regarding seasonal PM2.5 concentration, significant correlations were lacking in all seasons except winter. When showing statistical significance in each period, the distance-decay model that assumed PM2.5 concentration decreased to 5% of the initial value at 100 m from a roadway was always included in the results. Furthermore, 100M showed higher partial correlation coefficients than the other models in most periods.

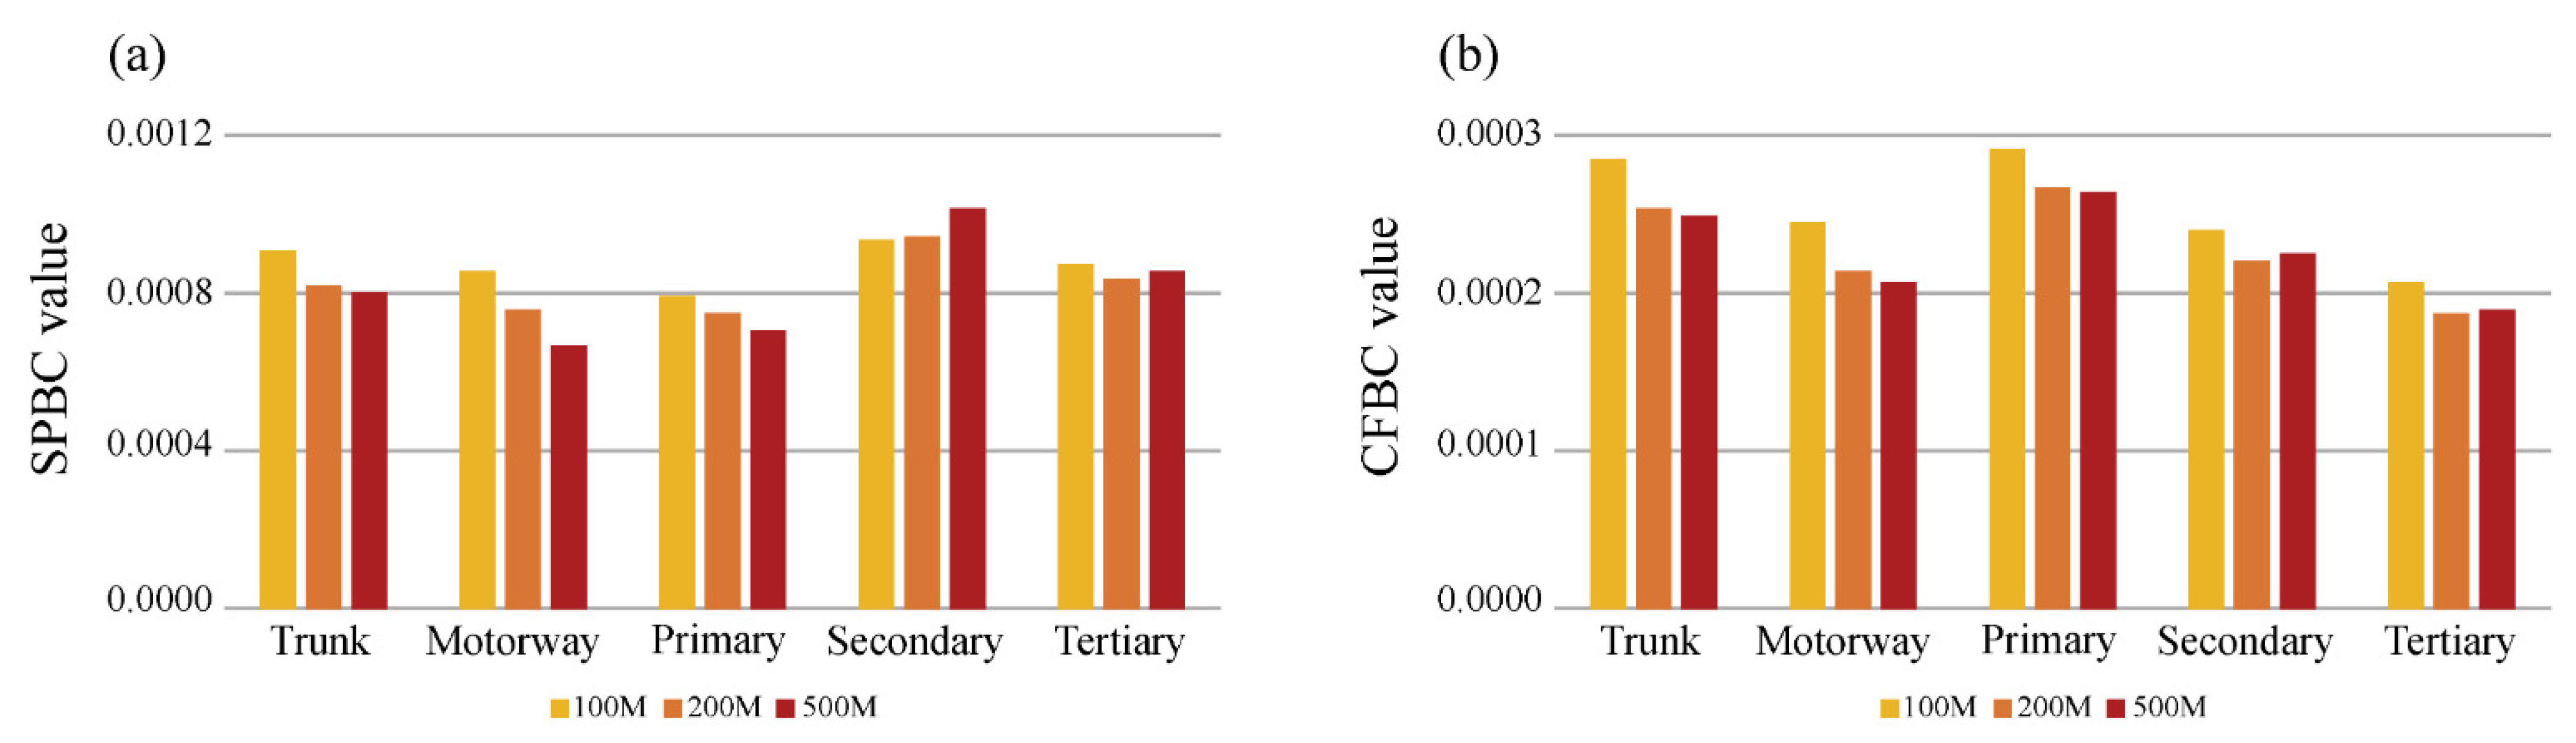
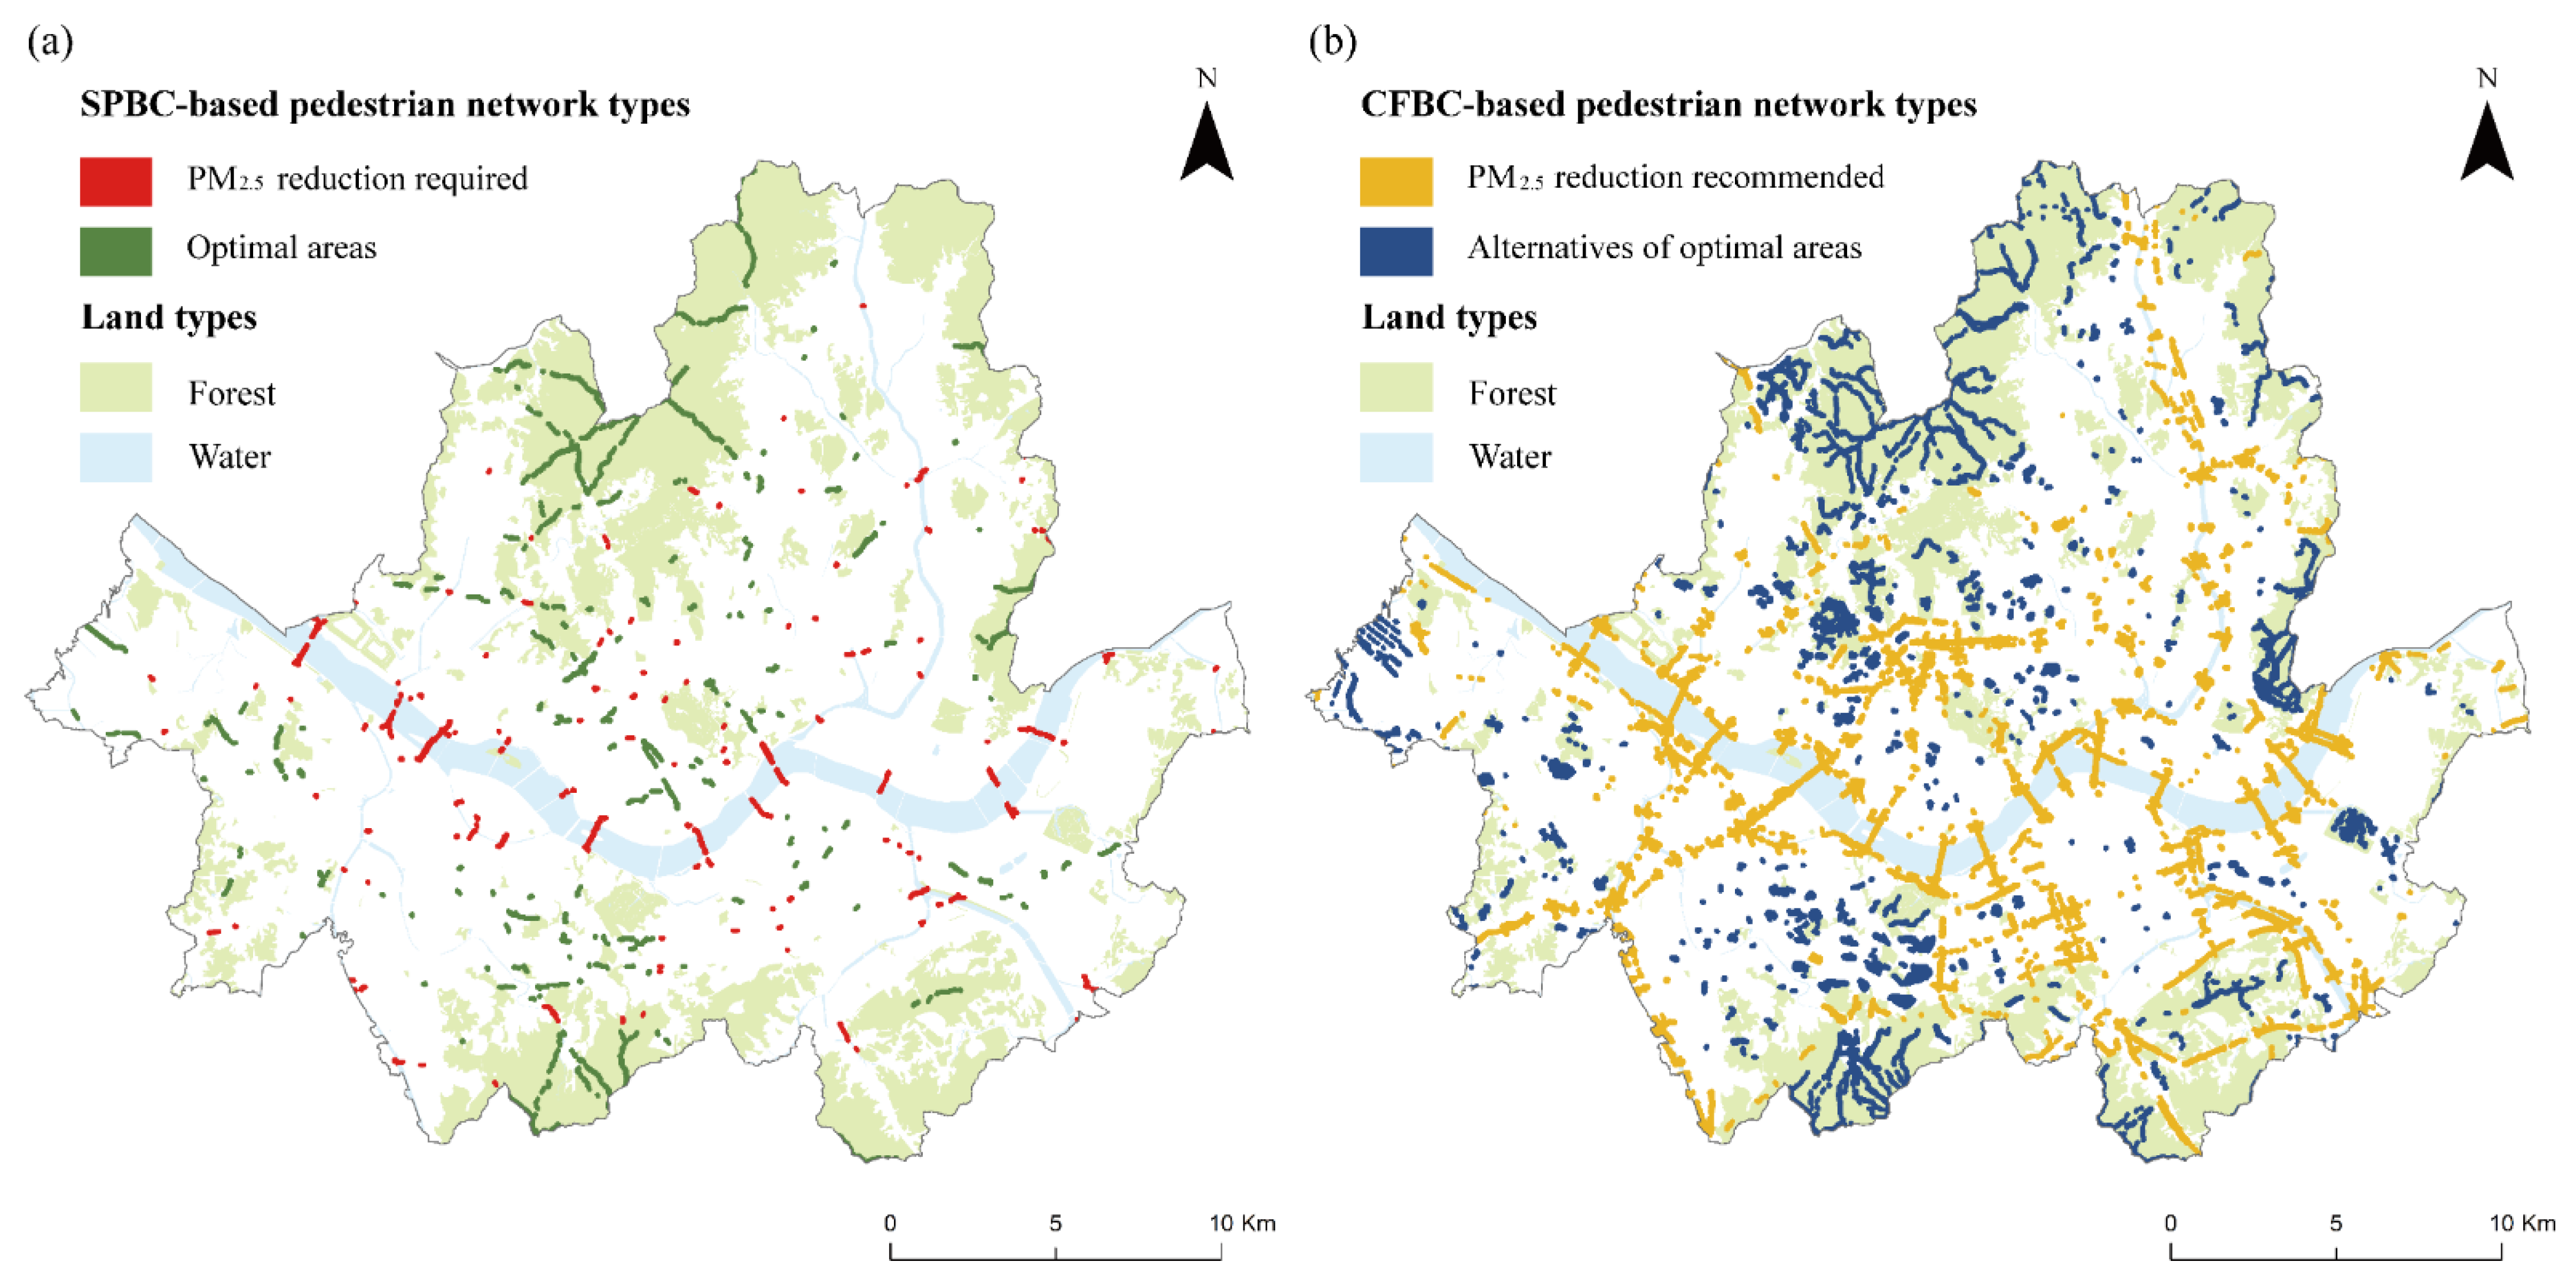
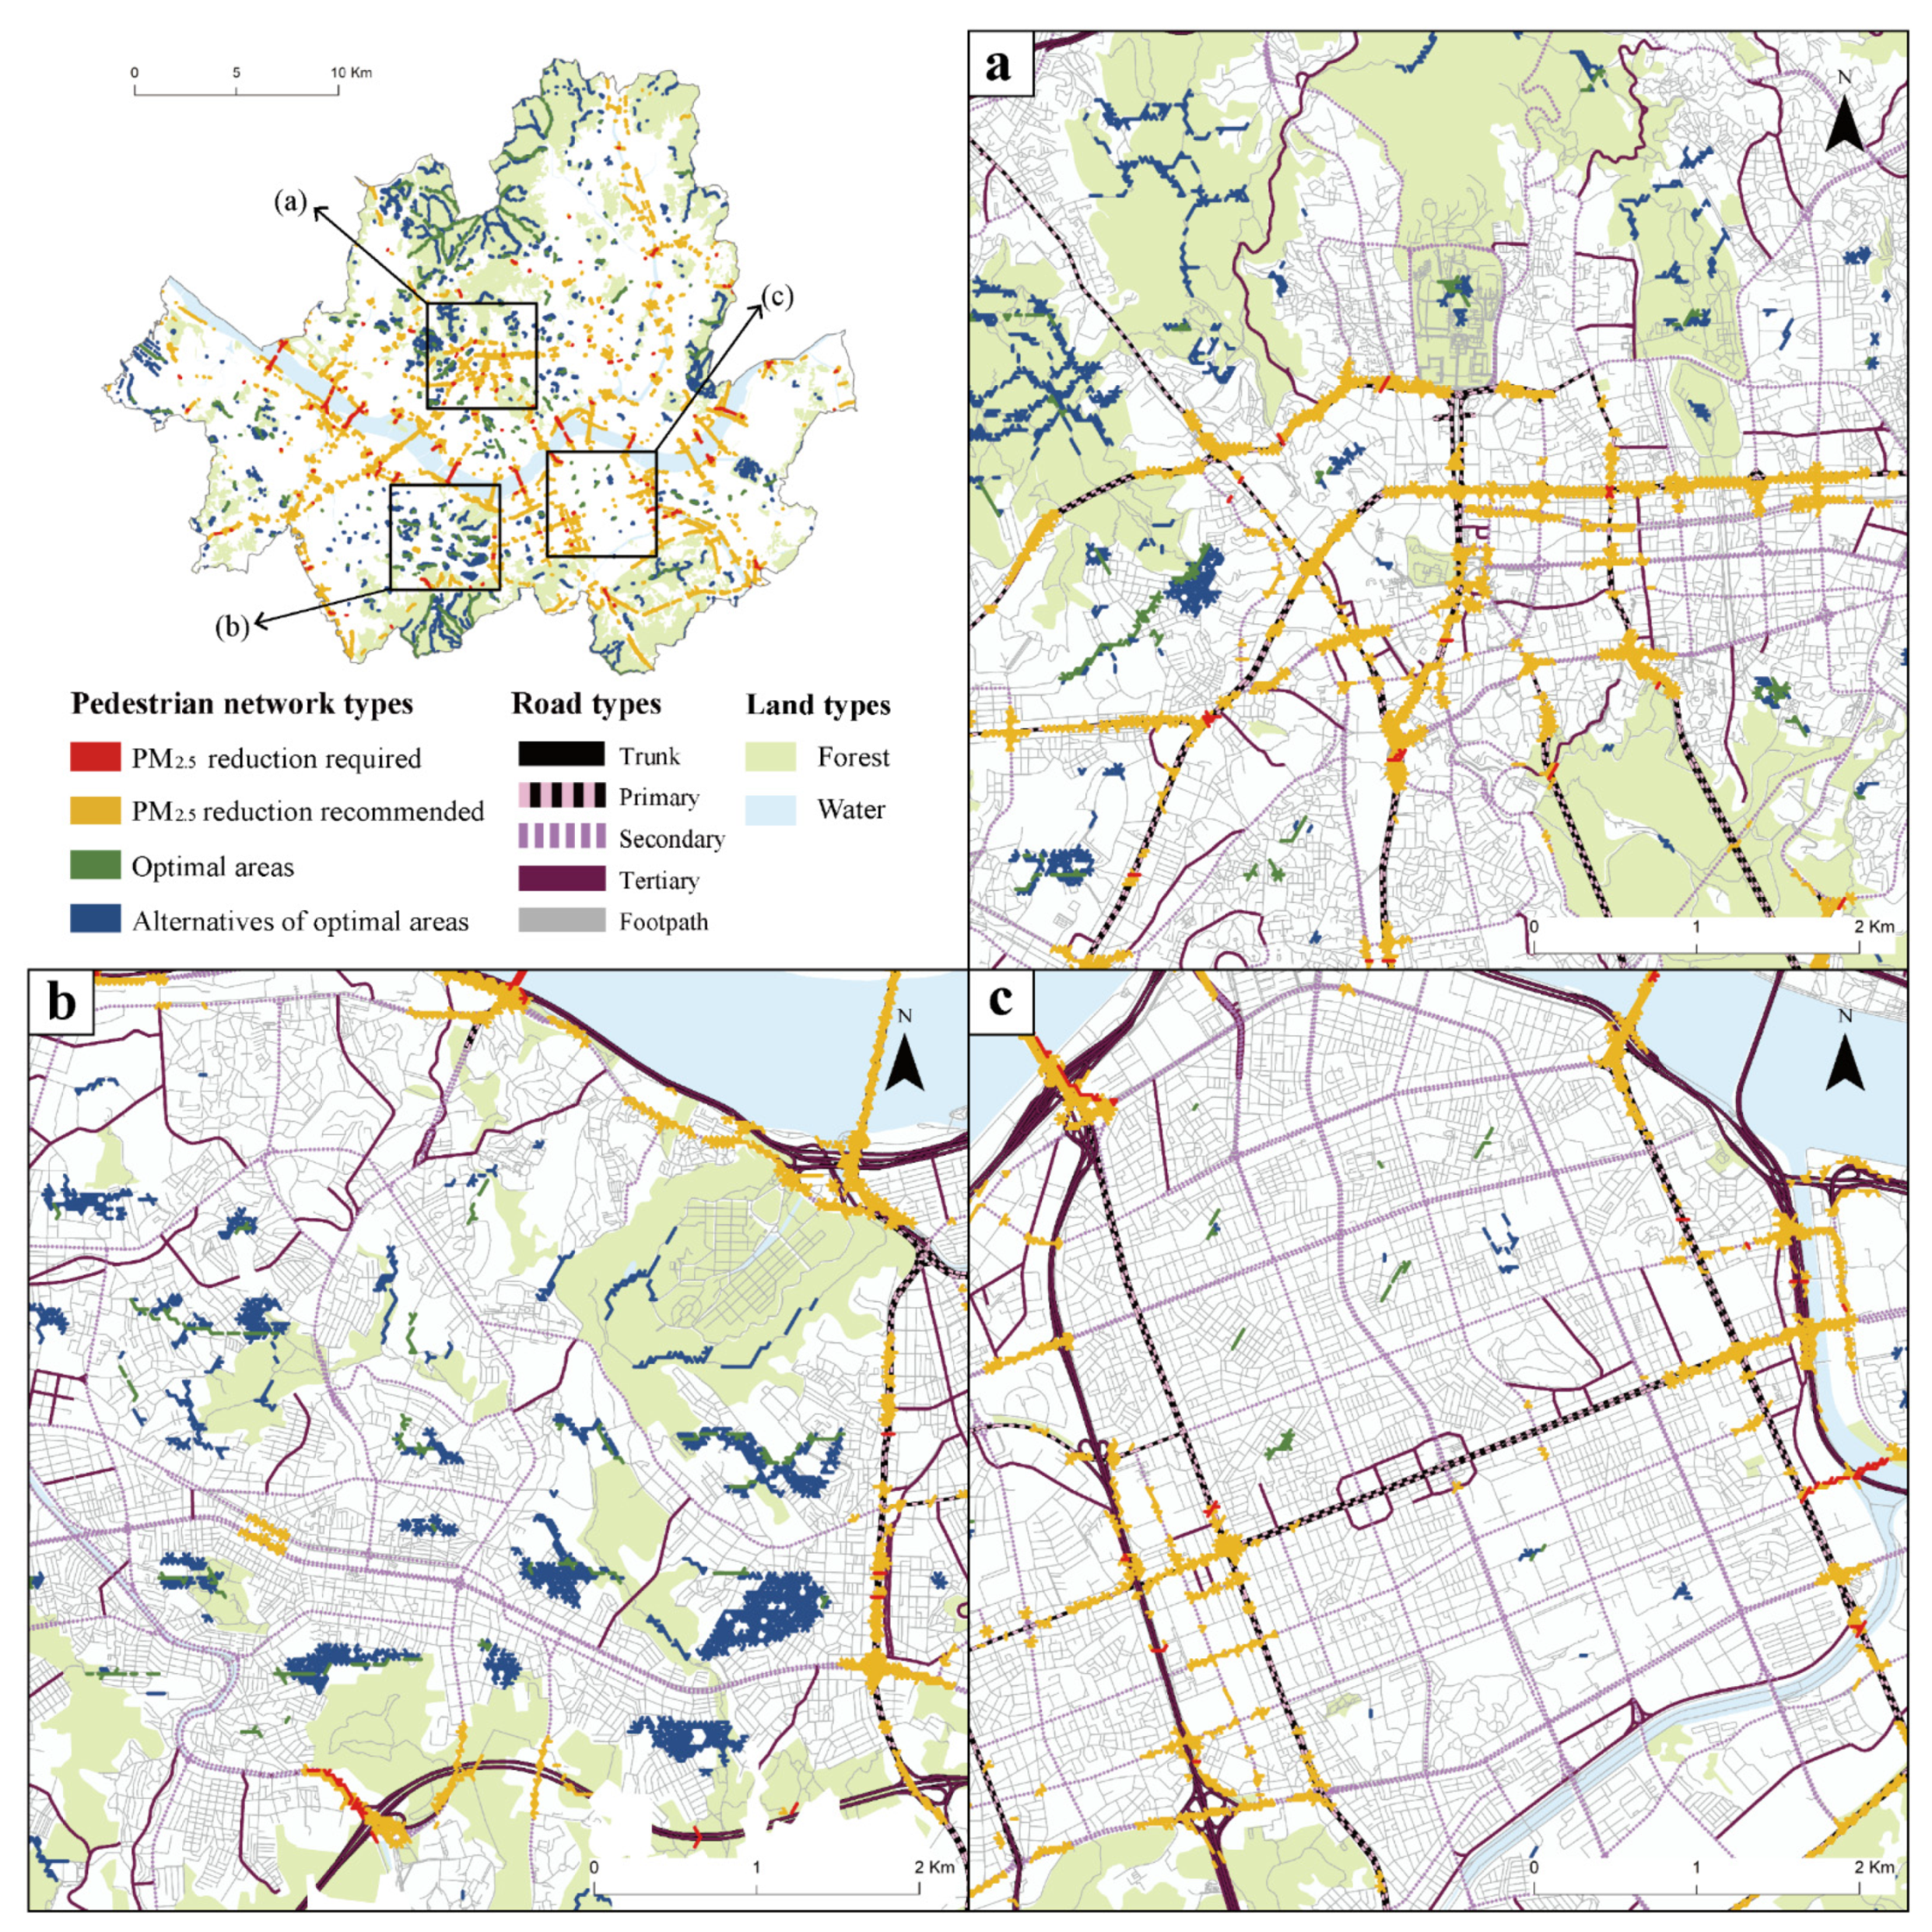
3.2. Pedestrian Network Analysis

The CFBC and SPBC values calculated from the pedestrian network analysis were compared among the roadway types with different traffic volumes (Figure 4). Mean centrality values generally increased as the distance-decay rate of PM2.5 from roadways increased. As PM2.5 distance-decay rate decreased, the CFBC and SPBC values of motorways declined more drastically than those of other roadways. When compared to other types of roadways, primary roadways had the highest mean CFBC values regardless of the decay rates of PM2.5. However, primary showed the lowest mean SPBC values, while secondary roadways had the highest mean SPBC values for every result. Tertiary roadways, which have the lowest weight of traffic volume, exhibited the lowest centrality values in the CFBC-based connectivity results. Moreover, although secondary and tertiary roadways made lower contributions to PM2.5 concentrations than trunk and motorway roadways, CFBC values were lower for secondary and tertiary roadways regardless of exponential distance-decay models of PM2.5.
The pedestrian networks with high centrality values showed distinct patterns through the connectivity analysis methods (Figure 5). Overall, pedestrian networks with high SPBC values showed more dispersed and fragmented patterns than those with high CFBC values. In other words, pedestrian networks with high CFBC values were densely connected by occupying areas that extended from pedestrian networks with high SPBC values. For instance, both optimal pedestrian networks (Figure 5a) and the alternative areas (Figure 5b) were located on the outskirts of Seoul with mountainous terrain; however, the latter included the surrounding areas of pedestrian networks. This pattern was also observed for pedestrian networks, defined as PM2.5 reduction required and PM2.5 reduction recommended, where bridges over the Han River and roads connected to the bridges were located.

4. Discussion

4.1. Contributions of Road Traffic to PM2.5 Concentrations by Season and Model

The partial correlation analysis identified the contributions of roadway traffic to PM2.5 concentrations with respect to temporal scales and different exponential distance-decay rates of PM2.5, as shown in Figure 3. When conducting the analysis, we aimed to exclude the contribution of other pollutant sources, which are brought by the northwesterly wind from industrial areas on the east coast of China, to the concentration PM2.5, especially in spring and winter [32,33]. Interestingly, notable relationships between road traffic density and PM2.5 concentration were found in the related periods. In general, the weather is relatively dry from late fall to spring on the Korean peninsula. Meanwhile, precipitation is high from summer to early fall owing to rainy periods and typhoons. Thus, although our analysis controlled the effect of pollutants from China, which can significantly affect the concentration of PM2.5, during spring and winter, the results may be significant, because pollutants emitted from vehicles on roadways in Seoul may be less washed out from the atmosphere by rain. This result is consistent with previous studies showing that the scarce flushing effect by rainfall and low temperature causes the suspension of inhalable particles in the air [13,34,35]. The seasonal difference in the contribution of road traffic to PM2.5 concentration should be closely considered when establishing and interpreting pedestrian-friendly networks, as PM2.5 concentrations exceeded the daily safe limit (25 µg/m3) set by the World Health Organization on most days in spring and winter (Supplementary Figure S1).
The relationship between PM2.5 concentrations and traffic volume of roadways was consistently significant during the overall study period when adopting 100M to estimate the impact of PM2.5 from roadways. Although the exponential distance-decay of PM2.5 concentrations from roadways has been reported in previous studies [25,26], the detailed distance parameters of decay models would not be very consistent because numerous meteorological factors, such as precipitation and wind, strongly affect PM2.5 dispersion [25,36,37]. The contribution of traffic to PM2.5 concentrations became inconspicuous 150 m away from roadways where the turbulence caused by vehicles, road and atmospheric boundary layer was small [26]. Moreover, roadways surrounded by vegetation that can reduce the effect of downwind from roadways showed sharp declines in PM2.5 concentration within 100 m [38]. Thus, our findings are consistent with previous research conducted in similar environments of roadways with street trees. However, under the impact of downwind from roadways, PM2.5 concentration would not decline to the ground level a few hundred meters away [25,39]. This explains why the PMER scores calculated from 200M and 500M showed significant but relatively weak correlations with PM2.5 concentrations in this study. This suggests that distances of 200M and 500M should be also considered to estimate the risk of pedestrians’ PM2.5 exposure.

4.2. Inconsistent Relationship between Effects of Traffic Volume and Centrality

It is generally considered that roadways with heavy traffic emitting high levels of PM2.5 threaten the health of pedestrians [4,6]. In this study, as the PM2.5 decay rate decreased (i.e., the contribution of roadway traffic to the PM2.5 concentration of the surrounding environment increased), the overall centrality values also decreased, because we set PMER as resistance when calculating the CFBC and SPBC values (Figure 4). However, the degree of importance of PM2.5 concentrations caused by roadway traffic can be changed to identify safe pedestrian networks when considering spatial context and connectivity. For example, tertiary roadways, which have the lowest traffic volume among the roadway types in Seoul [24], presented relatively low centrality values. This implies that the configuration of roadways and footpaths could have a higher hierarchy than the PM2.5 effect from roadways when calculating connectivity. The algorithms of connectivity analyses also resulted in different orders of spatial connectivity under the same estimated PM2.5 impacts from roadways. The mean SPBC value of primary roadways was lower than that of tertiary and secondary roadways, which is contrary to the CFBC analysis results. It is likely that the SPBC analysis attempted to minimize the sum of PMER scores rather than to find alternative routes, as the CFBC analysis did [40]. Thus, our results indicate that both spatial features and pollutant levels emitted from roadways can be crucial for establishing a pedestrian-friendly network.

4.3. Interpretation of Centrality-Based Pedestrian Networks

The areas with high SPBC values in Figure 5a indicate the collection of the best single pathways for minimizing exposure to PM2.5 while traveling between random locations in walkway networks. Thus, these areas were defined as optimal areas and PM2.5 reduction required to set key pedestrian-friendly networks within the study area. The locations of optimal areas are plausibly explained by footpaths in forested areas that are isolated from roadways with high PM2.5 concentration. In addition, these footpaths may be a bottleneck area where the movement between two locations across a mountain or forested area is constrained because of the limited number of roads. PM2.5 reduction required highlights the pedestrian networks that are critical for the connectivity of the whole study area, even where the estimated impact of PM2.5 concentrations is high. Thus, although most sidewalks along the primary or secondary roadways of bridges crossing the Han River showed high PMER scores, they were selected as important pedestrian networks by forming paths with a high bottleneck effect within the study area.
Essentially, SPBC-based connectivity analysis presents the unwanted results that numerous paths, which can enhance the connectivity of a target area, could be ignored, leaving only a few best routes [18]. The excessive removal of walkable paths according to SPBC-based analysis may be unsuitable for designing pedestrian networks for linking numerous districts in a target urban landscape. Pedestrian networks with high CFBC values (Figure 5b) can solve the above-mentioned problem by modeling multiple paths that could be alternatives to the best routes, minimizing the exposure of pedestrians to PM2.5. In doing so, alternatives of optimal areas and PM2.5 reduction recommended in Figure 5b fill the empty spaces where pedestrian networks drawn by the SPBC are absent, thereby allowing the overall urban areas in Seoul to be linked.
Pedestrian networks with high CFBC values are generally extended from central Seoul (Figure 6a,b), where SPBC values are high, to the outskirts of Seoul. However, the southeastern part of the Han River in central Seoul did not show high centrality values (Figure 6c). These spatial patterns can also be explained by the composition and configuration of landscape features, such as roadways, footpaths, and forested areas. The sidewalks along primary roadways, forming PM2.5 reduction recommended routes to the central area shown in Figure 6a, were connected with areas, generally green spaces, where other roadways or footpaths linked to primary roadways were scarce. Alternative optimal areas shown in Figure 6b are located on footpaths surrounded by mountains, which can disturb the formation of well-connected road networks. Thus, both CFBC-high areas can be induced by bottleneck effects, as shown by the SPBC-high areas. However, the exposure risk to PM2.5 between the two CFBC-high pedestrian networks was significantly different. This is probably because alternative optimal areas were relatively distant from roadways with high PMER scores and even the nearest roadways, secondary and tertiary, had lower PMER scores than the primary roadways. The central area in Figure 6c presents well-organized grid-shaped road networks with dense footpaths and roadways. Therefore, it can be inferred that redundant walking paths between two random locations rarely occurred when routes computed by SPBC and CFBC analyses passed this area.

4.4. Applications of Categorized Pedestrian Networks

We categorized four types of pedestrian networks based on pedestrians’ estimated PM2.5 exposure and high betweenness centrality values that determine a hexagonal grid as pivotal stepping stones while keeping a target landscape linked [41,42]. Although all types of pedestrian networks are crucial for the connectivity of the study area, urban designers and planners need to consider different purposes of each type of pedestrian network with various social circumstances and geographical factors for effective urban planning and policy.
Both optimal areas and alternatives of optimal areas included walkways with low PMER scores. Thus, these networks can be utilized in urban planning for children and the elderly, who are more susceptible to the adverse impact of PM2.5 than the general population [3]. Optimal areas can enhance accessibility to green spaces for children and elderly people [43,44], because the pedestrian network is distant from roadways and adjacent to forested areas and mountains. Meanwhile, alternatives of optimal areas can function as stepping stones by connecting relatively isolated optimal areas in green spaces to downtown areas or other pedestrian networks. In doing so, in built-up areas, alternatives of optimal areas might help to identify potential routes that reduce the exposure to PM2.5 for schoolchildren [44,45] or the elderly to access business and commercial facilities [41,46]. The two pedestrian networks can be effectively used to find less polluted and well-connected pathways in overall urban areas, while complementing previous studies that depend on individual routes or distances between specific social infrastructure and residential areas [45,46,47].
PM2.5 reduction required and PM2.5 reduction recommended inevitably became key stepping stones facilitating the connectivity of pedestrian networks in Seoul, even though high PM2.5 exposure to pedestrians was estimated owing to adjacency to roadways. Neither type of pedestrian network would be a safe pathway for pedestrians unless counterpart measures were conducted to mitigate exposure of pedestrians to PM2.5. For example, roadside barriers, such as green walls or street trees that reduce PM2.5 [48,49], can help enhance walkability. To enhance the landscape connectivity for pedestrians, the abovementioned PM2.5 mitigation measures for PM2.5 reduction required could be regarded as an urgent task. If an urban planner focuses on improving the accessibility of social infrastructure, PM2.5 mitigation measures for PM2.5 reduction recommended may also be crucial owing to its role as a stepping stone in inner-city areas. However, reducing the actual amount of PM2.5 from roadways by using physical structures or vegetation would not always be feasible, because of an excessive amount of traffic-induced PM2.5 over the capacity of green infrastructure as well as budget limitations and lack of space. In this situation, urban planners need to find ways to encourage pedestrians to use public transportation routes that pass those networks from nearby walkways. This could encourage people to breathe filtered air in a closed vehicle so as not to be exposed to high levels of PM2.5 [10,50].

5. Conclusions

This study has applied network analysis to develop reliable approaches to help urban planners identify optimal locations for transportation, settlements, and green spaces, highlighted by upholding aspects of connectivity [51,52,53]. However, in terms of reducing the adverse impact of PM2.5 on public health, network analysis-based approaches have generally been confined to PM2.5 exposure assessments of individual routes between two locations [14,15,45,47]. In this study, we suggested a novel network analysis-based approach that can identify key walking areas that could reduce pedestrian exposure to PM2.5 and enhance the connectivity of the study area by integrating the estimated PM2.5 impacts and betweenness centrality index. In other words, the methods presented here can provide information about local sites with the exposure risk of traffic-induced PM2.5 in planning and decision-making process for enhancing pedestrians’ walkability at a regional scale [18]. In addition, our suggestions could be useful for city-wide urban plans or designs, because we applied the average condition of traffic-induced PM2.5 concentrations rather than daily variations [14]. More elaborate models considering various predictors, such as climate factors, adjacent land uses, and other human activities, are needed to refine the estimation of PM2.5 concentrations in future studies.

Supplementary Materials

The following are available online at www.mdpi.com/article/10.3390/land10101045/s1, Figure S1: The mean hourly concentrations of PM2.5 in (a) spring (March-May), (b) summer (June-August), (c) fall (September-November), and (d) winter (December-February) at 61 PM2.5 monitoring stations in Seoul and surrounding areas. The natural breaks method is used to classify PM2.5 concentrations into five levels.

Author Contributions

Conceptualization and methodology, S.Y. and W.K.; data curation, Y.M. and Y.M.; formal analysis, S.Y., Y.M., J.J. and W.K.; investigation and visualization, S.Y., Y.M. and J.J.; funding acquisition, project administration, resources and supervision, W.K. and C.-R.P.; writing—original draft preparation, S.Y.; validation and writing—review and editing, S.Y., Y.M., J.J., C.-R.P. and W.K. All authors have read and agreed to the published version of the manuscript.

Funding

This research was funded by the National Institute of Forest Science of Korea, grant number NIFOS FE0000201801.

Data Availability Statement

No new data were created or analyzed in this study. Data sharing is not applicable to this article.

Acknowledgments

We would like to show our gratitude to Youngdae Heo who shared his expertise in data processing for this study. We appreciate Rachelle Dimaano for editing and proofreading the initial manuscript. We also thank reviewers for their helpful and constructive comments.

Conflicts of Interest

The authors declare no conflict of interest.

References

  1. Frank, L.D.; Sallis, J.F.; Saelens, B.E.; Leary, L.; Cain, L.; Conway, T.L.; Hess, P.M. The development of a walkability index: Application to the neighborhood quality of life study. Br. J. Sports Med. 2010, 44, 924–933. [Google Scholar] [CrossRef]
  2. Ali, M.U.; Liu, G.; Yousaf, B.; Ullah, H.; Abbas, Q.; Munir, M.A.M. A systematic review on global pollution status of particulate matter-associated potential toxic elements and health perspectives in urban environment. Environ. Geochem. Health 2019, 41, 1131–1162. [Google Scholar] [CrossRef] [PubMed]
  3. Kim, K.H.; Kabir, E.; Kabir, S. A review on the human health impact of airborne particulate matter. Environ. Int. 2015, 74, 136–143. [Google Scholar] [CrossRef]
  4. Tsang, H.; Kwok, R.; Miguel, A.H. Pedestrian exposure to ultrafine particles in Hong Kong under heavy traffic conditions. Aerosol Air Qual. Res. 2008, 8, 19–27. [Google Scholar] [CrossRef]
  5. Van Cauwenberg, J.; Van Holle, V.; De Bourdeaudhuij, I.; Van Dyck, D.; Deforche, B. Neighborhood walkability and health outcomes among older adults: The mediating role of physical activity. Health Place 2016, 37, 16–25. [Google Scholar] [CrossRef]
  6. Moreno, T.; Reche, C.; Rivas, I.; Minguillón, M.C.; Martins, V.; Vargas, C.; Buonanno, G.; Parga, J.; Pandolfi, M.; Brines, M.; et al. Urban air quality comparison for bus, tram, subway and pedestrian commutes in Barcelona. Environ. Res. 2015, 142, 495–510. [Google Scholar] [CrossRef] [PubMed]
  7. Atkinson, R.W.; Fuller, G.W.; Anderson, H.R.; Harrison, R.M.; Armstrong, B. Urban ambient particle metrics and health: A time-series analysis. Epidemiology 2010, 21, 501–511. [Google Scholar] [CrossRef] [PubMed]
  8. Cheung, K.; Daher, N.; Kam, W.; Shafer, M.M.; Ning, Z.; Schauer, J.J.; Sioutas, C. Spatial and temporal variation of chemical composition and mass closure of ambient coarse particulate matter (PM10-2.5) in the Los Angeles area. Atmos. Environ. 2011, 45, 2651–2662. [Google Scholar] [CrossRef]
  9. Kinney, P.L.; Gichuru, M.G.; Volavka-Close, N.; Ngo, N.; Ndiba, P.K.; Law, A.; Gachanja, A.; Gaita, S.M.; Chillrud, S.N.; Sclar, E. Traffic impacts on PM2.5 air quality in Nairobi, Kenya. Environ. Sci. Policy 2011, 95, 1–191. [Google Scholar] [CrossRef] [Green Version]
  10. Kumar, P.; Patton, A.P.; Durant, J.L.; Frey, H.C. A review of factors impacting exposure to PM2.5, ultrafine particles and black carbon in Asian transport microenvironments. Atmos. Environ. 2018, 187, 301–316. [Google Scholar] [CrossRef]
  11. Kaur, S.; Clark, R.D.R.; Walsh, P.T.; Arnold, S.J.; Colvile, R.N.; Nieuwenhuijsen, M.J. Exposure visualisation of ultrafine particle counts in a transport microenvironment. Atmos. Environ. 2006, 40, 386–398. [Google Scholar] [CrossRef]
  12. O’Donoghue, R.T.; Gill, L.W.; McKevitt, R.J.; Broderick, B. Exposure to hydrocarbon concentrations while commuting or exercising in Dublin. Environ. Int. 2007, 33, 1–8. [Google Scholar] [CrossRef] [PubMed]
  13. Qiu, Z.; Lv, H.; Zhang, F.; Wang, W.; Hao, Y. Pedestrian exposure to PM2.5, BC and UFP of adults and teens: A case study in Xi’an, China. Sustain. Cities Soc. 2019, 51, 101774. [Google Scholar] [CrossRef]
  14. Davies, G.; Whyatt, J.D. A network-based approach for estimating pedestrian journey-time exposure to air pollution. Sci. Total Environ. 2014, 485–486, 62–70. [Google Scholar] [CrossRef] [PubMed] [Green Version]
  15. Hertel, O.; Hvidberg, M.; Ketzel, M.; Storm, L.; Stausgaard, L. A proper choice of route significantly reduces air pollution exposure—A study on bicycle and bus trips in urban streets. Sci. Total Environ. 2008, 389, 58–70. [Google Scholar] [CrossRef]
  16. Porta, S.; Crucitti, P.; Latora, V. Multiple centrality assessment in Parma: A network analysis of paths and open spaces. Urban Des. Int. 2008, 13, 41–50. [Google Scholar] [CrossRef] [Green Version]
  17. Shen, Y.; Karimi, K. Urban function connectivity: Characterisation of functional urban streets with social media check-in data. Cities 2016, 55, 9–21. [Google Scholar] [CrossRef] [Green Version]
  18. Zetterberg, A.; Mörtberg, U.M.; Balfors, B. Making graph theory operational for landscape ecological assessments, planning, and design. Landsc. Urban Plan. 2010, 95, 181–191. [Google Scholar] [CrossRef]
  19. World Population Review. Seoul Population. 2021. Available online: https://worldpopulationreview.com/world-cities/seoul-population (accessed on 10 April 2021).
  20. Seoul Institute of Health & Environment (SIHE). Chemical Characteristics of Fine Dust (PM2.5) at Seoul in 2019. 2020. Available online: https://cleanair.seoul.go.kr/board/download?fileType=FILE&bbsSeq=1089 (accessed on 13 September 2021).
  21. Seoul Metropolitan City. The 5th regional energy plan of Seoul Metropolitan City (2020~2040). 2020. Available online: https://news.seoul.go.kr/env/archives/507994 (accessed on 30 March 2021).
  22. Air Korea. Fine Dust Measurement Data. 2019. Available online: https://www.airkorea.or.kr/web/last_amb_hour_data?pMENU_NO=123 (accessed on 20 September 2020).
  23. Geofabrik. Open Street Map. 2020. Available online: http://download.geofabrik.de/ (accessed on 25 September 2020).
  24. TOPIS. Road Traffic Information. 2017. Available online: https://topis.seoul.go.kr/ (accessed on 20 September 2020).
  25. Hitchins, J.; Morawska, L.; Wolff, R.; Gilbert, D. Concentrations of submicrometre particles from vehicle emissions near a major road. Atmos. Environ. 2000, 34, 51–59. [Google Scholar] [CrossRef] [Green Version]
  26. Li, Y.L.; Zhang, D.C.; Jin, X.M.; Yang, L.J.; Du, X.Z.; Yang, Y.P. Transportation characteristics of motor vehicle pollutants near Beijing typical expressway. Sci. China Technol. Sci. 2016, 59, 468–475. [Google Scholar] [CrossRef]
  27. Chavez, M.; Li, W.-W. Comparison of modeled-to-monitored PM2.5 exposure concentrations resulting from transportation emissions in a near-road community. Transp. Res. Rec. 2020, 2674, 130–143. [Google Scholar] [CrossRef]
  28. Bae, C.; Kim, B.U.; Kim, H.C.; Yoo, C.; Kim, S. Long-range transport influence on key chemical components of PM2.5 in the Seoul metropolitan area, South Korea, during the years 2012–2016. Atmosphere 2020, 11, 48. [Google Scholar] [CrossRef] [Green Version]
  29. Kim, S. ppcor: An R package for a fast calculation to semi-partial correlation coefficients. Commun. Stat. Appl. Methods 2015, 22, 665–674. [Google Scholar] [CrossRef] [Green Version]
  30. Carroll, C.; McRae, B.H.; Brookes, A. Use of linkage mapping and centrality analysis across habitat gradients to conserve connectivity of gray wolf populations in western North America. Conserv. Biol. 2012, 26, 78–87. [Google Scholar] [CrossRef] [PubMed]
  31. Birch, C.P.D.; Oom, S.P.; Beecham, J.A.; Dhv, B.V.; Box, P.O.; Amersfoort, B.C. Rectangular and hexagonal grids used for observation, experiment and simulation in ecology. Ecol. Model. 2007, 6, 347–359. [Google Scholar] [CrossRef]
  32. Lee, D.; Choi, J.-Y.; Myoung, J.; Kim, O.; Park, J.; Shin, H.-J.; Ban, S.-J.; Park, H.-J.; Nam, K.-P. Analysis of a severe PM2.5 episode in the Seoul Metropolitan Area in South Korea from 27 February to 7 March 2019: Focused on Estimation of Domestic and Foreign Contribution. Atmosphere 2019, 10, 756. [Google Scholar] [CrossRef] [Green Version]
  33. Bae, M.; Kim, B.-U.; Kim, H.C.; Kim, S. A multiscale tiered approach to quantify contributions: A case study of PM2.5 in South Korea during 2010–2017. Atmosphere 2020, 11, 141. [Google Scholar] [CrossRef] [Green Version]
  34. Huang, T.; Yu, Y.; Wei, Y.; Wang, H.; Huang, W.; Chen, X. Spatial–seasonal characteristics and critical impact factors of PM2.5 concentration in the Beijing–Tianjin–Hebei urban agglomeration. PLoS ONE 2018, 13, e0201364. [Google Scholar] [CrossRef]
  35. Saha, P.K.; Khlystov, A.; Snyder, M.G.; Grieshop, A.P. Characterization of air pollutant concentrations, fleet emission factors, and dispersion near a North Carolina interstate freeway across two seasons. Atmos. Environ. 2018, 177, 143–153. [Google Scholar] [CrossRef]
  36. Asif, Z.; Chen, Z.; Guo, J. A study of meteorological effects on PM2.5 concentration in mining area. Atmos. Pollut. Res. 2018, 9, 688–696. [Google Scholar] [CrossRef]
  37. Pipal, A.S.; Jan, R.; Satsangi, P.G.; Tiwari, S.; Taneja, A. Study of surface morphology, elemental composition and origin of atmospheric aerosols (PM2.5 and PM10) over Agra, India. Aerosol Air Qual. Res. 2014, 14, 1685–1700. [Google Scholar] [CrossRef] [Green Version]
  38. Tong, Z.; Whitlow, T.H.; Macrae, P.F.; Landers, A.J.; Harada, Y. Quantifying the effect of vegetation on near-road air quality using brief campaigns. Environ. Pollut. 2015, 201, 141–149. [Google Scholar] [CrossRef] [PubMed]
  39. Singh, V.; Sokhi, R.S.; Kukkonen, J. PM2.5 concentrations in London for 2008–A modeling analysis of contributions from road traffic. J. Air Waste Manag. Assoc. 2014, 64, 509–518. [Google Scholar] [CrossRef] [PubMed] [Green Version]
  40. Mocanu, D.C.; Exarchakos, G.; Liotta, A. Decentralized dynamic understanding of hidden relations in complex networks. Sci. Rep. 2018, 8, 1–15. [Google Scholar]
  41. Badiu, D.L.; Nita, A.; Iojă, C.I.; Niţă, M.R. Disentangling the connections: A network analysis of approaches to urban green infrastructure. Urban For. Urban Green. 2019, 135, 24–30. [Google Scholar] [CrossRef]
  42. Foltête, J.-C.; Girardet, X.; Clauzel, C. A methodological framework for the use of landscape graphs in land-use planning. Landsc. Urban Plan. 2014, 124, 140–150. [Google Scholar] [CrossRef]
  43. La Rosa, D. Accessibility to greenspaces: GIS based indicators for sustainable planning in a dense urban context. Ecol. Indic. 2014, 42, 122–134. [Google Scholar] [CrossRef]
  44. Reyes, M.; Páez, A.; Morency, C. Walking accessibility to urban parks by children: A case study of Montreal. Landsc. Urban Plan. 2014, 125, 38–47. [Google Scholar] [CrossRef]
  45. Mölter, A.; Lindley, S. Influence of walking route choice on primary school children’s exposure to air pollution—A proof of concept study using simulation. Sci. Total Environ. 2015, 530, 257–262. [Google Scholar] [CrossRef]
  46. Marquet, O.; Miralles-Guasch, C. Neighbourhood vitality and physical activity among the elderly: The role of walkable environments on active ageing in Barcelona, Spain. Soc. Sci. Med. 2015, 135, 24–30. [Google Scholar] [CrossRef]
  47. Davies, G.; Whyatt, D. A least-cost approach to personal exposure reduction. Trans. GIS 2009, 13, 229–246. [Google Scholar] [CrossRef] [Green Version]
  48. Al-Dabbous, A.N.; Kumar, P. The influence of roadside vegetation barriers on airborne nanoparticles and pedestrians exposure under varying wind conditions. Atmos. Environ. 2014, 90, 113–124. [Google Scholar] [CrossRef] [Green Version]
  49. Srbinovska, M.; Andova, V.; Mateska, A.K.; Krstevska, M.C. The effect of small green walls on reduction of particulate matter concentration in open areas. J. Clean. Prod. 2021, 279, 123306. [Google Scholar] [CrossRef]
  50. Tartakovsky, L.; Baibikov, V.; Czerwinski, J.; Gutman, M.; Kasper, M.; Popescu, D.; Veinblat, M.; Zvirin, Y. In-vehicle particle air pollution and its mitigation. Atmos. Environ. 2013, 64, 320–328. [Google Scholar] [CrossRef]
  51. Mao, Y.; Liu, Y.; Wang, H.; Tang, W.; Kong, X. A spatial-territorial reorganization model of rural settlements based on graph theory and genetic optimization. Sustainability 2017, 9, 1370. [Google Scholar] [CrossRef] [Green Version]
  52. Moseley, D.; Marzano, M.; Chetcuti, J.; Watts, K. Green networks for people: Application of a functional approach to support the planning and management of greenspace. Landsc. Urban Plan. 2013, 116, 1–12. [Google Scholar] [CrossRef]
  53. Nelson, Q.; Steffensmeier, D.; Pawaskar, S. A simple approach for sustainable transportation systems in smart cities: A graph theory model. In Proceedings of the 2018 IEEE Conference on Technologies for Sustainability (SusTech), Long Beach, CA, USA, 11–13 November 2018; pp. 1–5. [Google Scholar]
Figure 1. Map showing land cover and road types of study area, Seoul. A roadway is defined as a road specifically for vehicles. A sidewalk is defined as a road that has a roadway for vehicles and paths for pedestrians on the sides. A footpath is defined as a road that is shared by pedestrians and vehicles or used solely by pedestrians.
Land 10 01045 g001
Figure 2. The categorization process of pedestrian networks in the study area.
Land 10 01045 g002
Figure 3. The partial correlation coefficients between PM2.5 concentrations and PMER by period in 2019.
Land 10 01045 g003
Figure 4. The comparison of mean (a) SPBC and (b) CFBC values according to roadway types and PM2.5 dispersion models.
Land 10 01045 g004
Figure 5. Map of categorized pedestrian networks based on (a) SPBC and (b) CFBC.
Land 10 01045 g005
Figure 6. Map showing the pedestrian network pattern examples, (a) PM2.5 reduction recommended, (b) alternatives of optimal areas, and (c) low centrality centered areas.
Land 10 01045 g006
Table 1. Estimated weights indicating the traffic volume proxy based on AADT (Annual Average Daily Traffic) of each roadway type.
RoadwaysWeights
Trunk100
Motorway75
Primary50
Secondary30
Tertiary10
Publisher’s Note: MDPI stays neutral with regard to jurisdictional claims in published maps and institutional affiliations.

