Abstract
Pan measurement is a reliable and efficient method for indicating the evaporative demand of the atmosphere. There are several types of pan evaporimeters worldwide, and the estimation of the conversion coefficients (Kp) between them is necessary in hydrologic research. In China, E601B pans were installed at all meteorological stations beginning in 1998. They replaced the 20 cm pans (φ20). To fully use the records from the two pans and obtain long-term pan evaporation, the spatial patterns of Kp between φ20 and E601B and the factors that influence Kp are investigated based on records from 573 national meteorological stations from 1998 to 2001. In this study, The results show that higher Kp values are found in southwestern regions and lower values are found in northeastern regions during the warm seasons (from May to September), while Kp values are lower during warm seasons than during cold seasons (from October to April the following year). In addition, net radiation was found to be the dominant climate factor that affects variations in Kp, followed by relative humidity and the vapor pressure deficit. This study can improve the benefit of not only the selection of appropriate evaporimeters by meteorological departments, but also of the study of temporal variability and trends in the evaporative demand.
1. Introduction
Evaporation is a key hydrological process [1]. It is an important nexus between the water cycle and energy budget and can further impact regional and global climate [2,3,4]. The atmospheric evaporative demand can be evaluated based on potential evapotranspiration [5,6] or evaporimeters [7,8] and is regarded as the upper limit of evaporation [9,10,11]. The evaporative demand of the atmosphere is controlled by radiative and aerodynamic factors, and it can be calculated using meteorological variables, such as radiation, wind speed, air temperature, and humidity [7,10]. However, these meteorological factors are not always available, especially radiation. Instead, a simple and efficient observational measurement device, the pan evaporimeter, is often adopted to accurately quantify local atmospheric evaporation [8,12,13,14]. Many types of pan evaporimeters have been installed in different countries to measure the evaporative demand [1,15], including Class A evaporimeters in the US and Australia [16], the GGI-3000 in Russia [17], the MO tank in Britain [18], and the 20 cm pan (φ20) and E601B in China [13,19]. These devices are used by meteorological and climate scientists, agricultural scientists, and hydrologists [12,20,21]. Although pan evaporation (Epan) measured from various types of evaporimeters cannot completely represent the actual evaporation [22,23], it can provide in-depth insight into the trends and temporal variations in evaporation in the context of climate change [6,24] and anthropogenic interference [25,26].
Due differences between pan evaporimeters (for example, material type, geometric shape, and installation method), observed evaporation can vary greatly, even for evaporimeters in similar environments [27]. Pan evaporation values measured using different evaporimeters over the same time span, cannot be compared directly. Otherwise, considerable uncertainty would be introduced into the results. A conversion must be performed to make the values comparable. It is necessary to determine the conversion coefficient (Kp) between different measurements before using the values in studies of evaporation trends [28,29] or water resources [8]. A number of previous studies discussed Kp related to pan evaporation at the point scale [15,30], regional scale [31,32], and catchment scale [33]. For example, Hong et al. [30] investigated two types of evaporimeters, one buried in the soil and one exposed to the air, at Nansi Lake Station. The results showed that the buried devices, such as E601 and GGI-3000, had larger Kp values (ratio of the 20 m2 evaporation tank to these evaporimeters, Kp > 0.98) compared to the Kp values (Kp < 0.88) of an exposed ones, such as Class A and φ20. Fu et al. [15] compared the Kp values of 15 types of evaporimeters to that of a 20 m2 evaporation tank and found that the Kp values of φ20 (Kp = 0.60) and E601B (Kp = 1.07) were distinctly different at the annual scale. Liang et al. [32] discussed the Kp difference between Epan and reference evaporation (ETref) in the West Songnen Plain of China and found that it varied significantly in space (0.48–0.68) and time at an annual scale. Xu et al. [33] also studied the Kp difference between Epan and ETref in the Yangtze River basin. They observed higher Kp values in the central region of the basin, which has a relatively lower vapor pressure deficit, and Kp exhibited monthly variations in the three regions of the catchment. Due to the spatial and temporal variabilities in Kp, considerable uncertainties may be associated with using constant Kp values in large regions when conducting climate change research [28,34]. The spatial patterns of Kp and the dominant factors that control its variation must be determined. Revealing the spatial distribution of Kp and its driving factors is imperative and can improve hydrometeteorological studies.
China is an ideal location to study Kp patterns and the factors that influence Kp. Among the various evaporation pans used in China [15,19,35,36], the two most common are the φ20 and E601B pans (Figure 1 and Table 1). In 1998, the E601B pans were first installed at all meteorological stations across China, with the aim of replacing the φ20 pan. To maintain comparability between the two evaporimeters, simultaneous observations were collected from 1998 to 2001. By 2002, the φ20 pans were successfully replaced by E601B pans at all stations, and E601B became the standard evaporimeter for measuring evaporation in China. To effectively use the records from the two pan evaporation devices in long-term studies of evaporation trends (the φ20 pan records date to approximately 1951), the Kp value between them must be determined. In addition, China can be divided into eight climatic regions [13,37] due its large spatial extent. There are significant differences in climate between the regions [38]; for example, the temperature increases from north to south, and precipitation increases from northwest to southeast (Table 1). Ren et al. [35] compared the monthly and annual mean Kp values between the two evaporimeters in different provinces from 1998 to 2001. Additionally, Liu et al. [36] compared the Kp values between E601 (similar to E601B) and φ20 in several typical cities from 1986 to 1995. However, few studies have focused on Kp differences in different climatic conditions, which may considerably affect Kp. Mapping the spatial distribution of Kp between the two evaporimeters and determining the driving factors of Kp can allow the pan evaporation records in China to be fully used and provide an understanding of the underlying mechanisms of Kp variability.

Figure 1.
Four types of evaporation evaporimeters: Class A from the USA (a); GGI-3000 from Russia (b); and φ20 (c) and E601B (d) from China.

Table 1.
Detailed information regarding the four types of evaporimeters.
To address these issues, we compare the spatial distribution and temporal variability (monthly for one year) of Kp and investigate the factors that influence Kp between the E601B and φ20 pans in China. The main objectives of this paper are as follows: (1) investigate the monthly variation and spatial distribution of Kp for the two pan evaporations during the warm (May–September) and cold seasons (October–April); and (2) determine the contributions of several key climatic factors to the variation in Kp. The results of this study can improve the selection of the appropriate pan in different climate regions and provide information for hydrologic research, especially studies of evaporation trends. This study is structured as follows: in Section 2, the datasets and methods used in our study are described; in Section 3, the spatial distribution of Kp is mapped during the warm and cold seasons. Furthermore, the factors that influence Kp are also investigated in this section. The uncertainties and conclusions are shown in Section 4 and Section 5.
This paper reports the initial stage of ongoing research work. The ongoing research and planned studies are as follows: (1) constructing a long-term series of pan evaporation records (from the 1950s–present) and investigating the trends in pan evaporation across the country in the context of climate change [5,13]; (2) performing experiments regarding the pan evaporation of φ20 and E601B and developing some novel approaches or formulations to explain the mechanisms of Kp [20,39]; and (3) investigating and quantifying the effects of various climatic factors on Kp using a modified PenPan model [27] and a partial differential method [6].
2. Data and Methods
2.1. Information and Measurements from Different Evaporimeters
Different types of evaporimeters have been used to measure the evaporative demand of the atmosphere [15]. Two typical pans are recommended by the World Meteorological Organization [40]: Class A from the USA (Figure 1a) and GGI-3000 from Russia (Figure 1b). However, these two evaporimeters are not widely installed in China, but the φ20 and E601B (Figure 1c,d) evaporimeters are commonly used. Additional information regarding the evaporimeters is listed in Table 1.
The φ20 pan with a screen to prevent bird drinking is made of metal and placed at a height of 70 cm (Figure 1c). This evaporimeter is weighed at 20:00 each day using a high-precision weighbridge, and it is then refilled with water to a depth of 20 mm. The daily evaporation rate can be calculated from the following equation:
where E is the pan evaporation rate (mm·day−1); W1 and W2 are the pan weights of the previous and current measurements, respectively (g·day−1); P is the total precipitation (mm·day−1, including rain and snow); and 31.4 is the weight of 1 mm of water in the pan (g·mm−1). The E601B is made of fiberglass and has a relatively lower heat transfer to the surrounding area. The evaporation from this evaporimeter should be relatively close to the evaporation recorded from a moderately-sized water body (such as a 20 m2 evaporation tank) [15,19]. The daily evaporation rate can be calculated using Equation (2):
where E and P are the same as in Equation (1); and H1 and H2 are the water depths of E601B on the previous and current day, respectively. The water depths of H can be read directly from the indicator installed on the stylus holder (Figure 1d).
2.2. Meteorological and Evaporation Data
Daily meteorological data and evaporation data from the evaporimeters at 573 national meteorological stations were obtained from the China Meteorological Administration (CMA, Figure 2) for a four-year period (January 1998–December 2001). The data were quality controlled. Records that were missing for less than three consecutive days were interpolated based on the nearest data. For gaps of more than three days, the missing data were replaced using a simple linear regression based on the nearest stations. Finally, 573 of the 756 meteorological stations with continuous records were selected. Monthly data, which were summed from daily values, were used in the following sections.
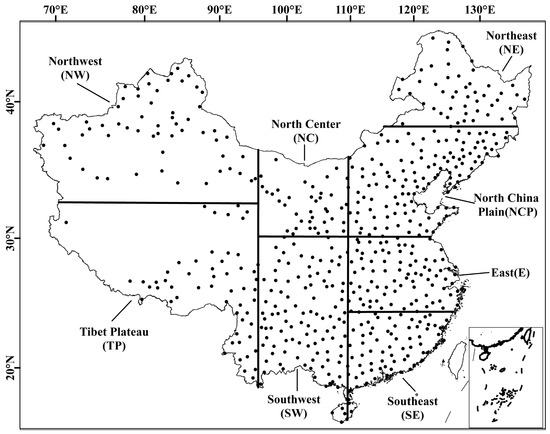
Figure 2.
Locations of meteorological stations in China. The eight regional abbreviations are shown in the figure. This map was modified from Liu et al. [13].
To identify the effects of different climatic factors on the Kp values of the two pans, the entire region was divided into eight climatic regions [13,37]: northwest (NW), north center (NC), North China plain (NCP), northeast (NE), east (E), southeast (SE), southwest (SW), and Tibet plateau (TP). According to the aridity index (AI, Table 2), NW, NC, NCP, and NE are humid regions (AI > 1.0), while E, SE, and SW are non-humid regions (AI < 1.0). The climate characteristics of each region are listed in Table 2. Pan evaporation is an integrated process affected by various climate factors, such as the net radiation (Rn), wind speed (U2), air temperature (Tmean), vapor pressure deficit (VPD), relative humidity (RH), and elevation (Elev) [19,21,41]. The U2 at a height of 2 m was derived from a height of 10 m according to a logarithmic wind speed profile. Rn was calculated from the difference between the incoming net shortwave radiation (Rns) and the outgoing net longwave radiation (Rnl) [21]. The coefficients, as and bs, recommended by Allen et al. [21] to calculate the solar radiation (Rs) were not used. The optimized coefficients calibrated using the 116 solar radiation stations were adopted in our paper. These coefficients can significantly reduce the uncertainty associated with radiation [42].
Table 2.
Climate factor characteristics in the eight climatic regions from 1998 to 2001.
Evaporation data for the E601B pan are not available during the winter in most northern regions in China because the water in the pan freezes. Thus, the year was divided into a warm season (May–September) and a cold season (October–April). This is reasonable because the warm season accounted for most of the annual evaporation (>60%), even in the southern areas; therefore, these months were the most important.
2.3. Calculations and Analysis Method for the Kp
Kp is defined as the ratio of the E601B evaporation to the φ20 pan evaporation:
where EE601B is the monthly evaporation rate of the E601B pan; and E20 is the φ20 evaporation rate for the same month. Spatial interpolation using the Kriging method was performed in ESRI ArcGIS 10.0 software (Redlands, CA, USA) with the spatial analysis toolbox [6,44] to obtain the spatial distributions of monthly and annual Kp values.
A Pearson’s correlation analysis, multiple stepwise regression analysis, and our knowledge of the potential physical driving factors (Tmean, RH, VPD, U2, Elev, and Rn) were used to analyze the potential factors that influence Kp variation. The Pearson’s correlation coefficients between Kp and selected climatic factors were calculated using SPSS Statistics 20 (SPSS Inc., Chicago, IL, USA). Stepwise multiple linear regressions were developed between Kp and the potential dominant factors to find the best predictors and the independent explanatory ability of each selected climatic factor based on the spatial variation in Kp.
3. Results and Analysis
3.1. Spatial Patterns of Kp for the Two Pan Evaporimeters
3.1.1. Spatial Distribution of Pan Evaporation during the Warm Season
The spatial distributions of φ20 and E601B evaporation during the warm season from 1998 to 2001 at the national scale are shown in Figure 3a,b, respectively. When the characteristics of the eight climatic regions were combined (Table 2), the differences between the two pan evaporations were spatially related to the variations in meteorological factors. For the warm season from 1998 to 2001, there were statistically significant differences (p < 0.001) between the φ20 and E601B pan evaporations, and the annual values were 1014 mm and 597 mm, respectively (Table 3). The spatial distributions of the pan evaporations of φ20 and E601B generally exhibited the same spatial pattern: a clear decreasing trend from northwest to southeast. The highest values were found in the NW region, while the lowest values were found in the TP, NW and NE regions. The φ20 pan evaporation varied from 739 mm to 5573 mm with an average of 1613 mm, and the E601B pan evaporation varied from 470 mm to 2831 mm with an average of 921 mm.
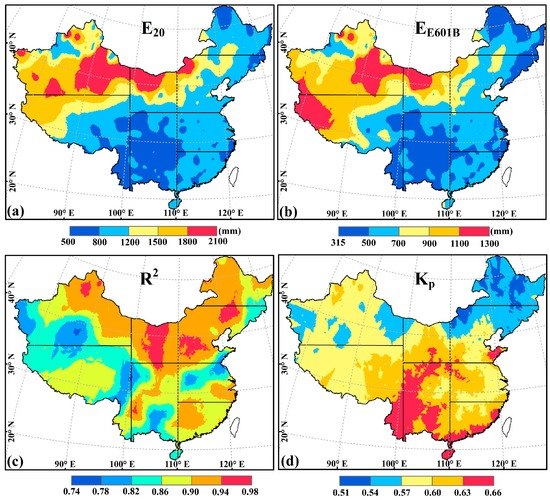
Figure 3.
Spatial distributions of φ20 (a) and E601B (b) evaporation; the determination coefficient R2 (c); and the conversion coefficient Kp (d) between the two pan evaporations during the warm season (May–September).
Table 3.
Statistical information regarding E601B and φ20 pan evaporation (EE601B, E20), the determination coefficient (R2), and the conversion coefficient (Kp) between the two pans in eight climatic regions during the warm season and three regions in the cold season. The minimum and maximum values are given in parentheses.
3.1.2. Spatial Distribution of the Correlation Coefficient during the Warm Season
To quantify the performance of the E601B pan in capturing the spatial distribution and temporal variation of the φ20 pan evaporation, the temporal determination coefficients (R2) of the two pan evaporation series during the warm season were calculated at each station, and the spatial distributions of R2 were mapped using the Kriging interpolation method [44]. The results showed that the two pan evaporations had high R2 values in each region (Figure 3c) and varied significantly in one month (Figure 4). The mean value of R2 in China can reach 0.89, indicating that the E601B values capture the variation in φ20 fairly well. This is not surprising because the two pans were influenced by the same meteorological conditions, such as solar radiation, wind speed, temperature, etc. Thus, it may be reasonable to convert φ20 evaporation values to E601B evaporation values by multiplying a constant.
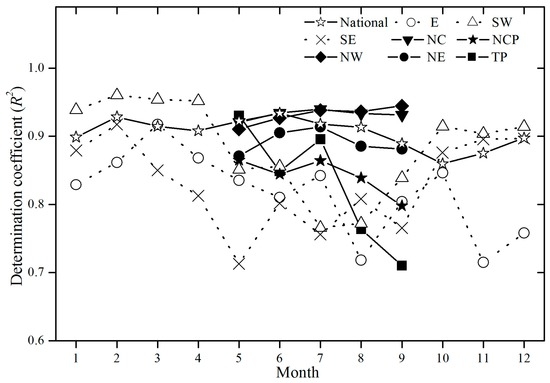
Figure 4.
Monthly variation in the coefficient of determination (R2) values of E601B and φ20 pan evaporation in the eight climate regions. The R2 values in the three humid regions (E, SE, and SW) are illustrated by dotted lines, and the R2 values in the four non-humid regions and TP region are illustrated by solid lines during the warm season (May–September). The national R2 is illustrated by the solid black line with open star symbols.
Despite the overall high R2 between φ20 and E601B in China, large differences were also found in the eight climatic regions. The R2 values in the northern regions were generally higher than those in the southern regions, which indicated that the variabilities in the two evaporimeters became more uniform as evaporation increased. The average values of R2 ranged from 0.89 to 0.94 in the northern regions. R2 was highest in the NC region, and it varied between 0.86 and 0.99, with an average of approximately 0.94 (Table 3). By contrast, the average values of R2 in the southern regions (E, SE, and SW) ranged from 0.87 to 0.89 with smaller deviations. The monthly R2 values in the southern regions were high in the cold season and low in the warm season. The R2 values in Northern China were high and stable in the warm season. The lowest average R2 value (0.84) was found in the TP region, and it exhibited a decreasing trend from May to September (Figure 4). This R2 value in TP may be caused by special climatic conditions. For example, the TP region is the highest plateau in the world with an average elevation of 4000 m, and it is also known as the “Third Pole” of the earth [45].
3.1.3. Spatial Distribution of Kp during the Warm Season
The spatial distribution of Kp during the warm season is shown in Figure 3d. Kp was calculated at each meteorological station independently, and the spatial distribution was obtained using the Kriging interpolation method [44]. The results show that the two pan evaporations exhibited the same spatial distribution (Figure 3a,b), while Kp exhibited significant spatial differences. Overall, Kp varied from 0.46 to 0.92 in China, with an average of approximately 0.60 and a standard deviation of 0.056 (Table 3). Kp was lower in the non-humid northern regions (Kp < 0.60) than in the humid southern regions (Kp > 0.60), which indicated that the bias in the evaporations of the two pan evaporations was smaller in the humid area during the warm season. Thus, the pan Kp between the two evaporimeters varied substantially, and this variation was larger at low latitudes and smaller at high latitudes. Researchers have documented that the additional heat absorbed by the pan wall has an important effect on Kp [46,47]. Additionally, the φ20 device can intercept more solar radiation at high latitudes (e.g., NE and NW) than at low latitudes (e.g., SW and SE) due to the solar zenith angle difference. The extra absorbed heat is subsequently transferred into the water through the pan wall, which increases the evaporation rate of the φ20 pan. The Kp pattern (Figure 3d) generally reflected this process. Additionally, pronounced differences between Kp values in the eight climatic regions were also detected. The smallest Kp values were found in the NE region, and the average Kp ranged from 0.46 to 0.62 with an average of 0.55. The largest values were observed in the SW and TP regions, both with averages of 0.63. The spatial distribution of Kp was similar to that noted by Chen, Gao [19], who compared φ20 evaporation to reference evapotranspiration in China. Therefore, the regional differences in Kp must be considered to obtain accurate evaporation data series when the evaporation values from the two pans are adopted to determine evaporation trends.
3.1.4. Monthly Variation in Kp during the Warm Season
In addition to the spatial differences, the Kp values of the two evaporimeters also exhibited significant temporal variability. The variation in Kp in eight regions during the warm season is shown in Figure 5. The results are as follows: (1) overall, the monthly average values of Kp in China increased during the warm season from approximately 0.58 in May to 0.63 in September, and the increase was especially rapid from June to August; (2) except in humid regions, Kp varied throughout the warm season with a similar increasing pattern (solid line); (3) in the humid regions, Kp decreased from May to June and then increased until August or September (dotted line), which confirmed the finding of Allen et al. [21] that Kp was high in humid environments; and (4) the lowest values of the entire warm season (Kp = 0.54) occurred in the NE region with mean monthly variation from 0.51 to 0.58. The largest values varied from the SW region in May to the TP region in June and July and to SW region again in August and September.

Figure 5.
Monthly variation in the conversion coefficient (Kp) of E601B and φ20 pan evaporation in the eight climate regions. The Kp values in the three humid regions (E, SE, and SW) are illustrated by dotted lines, and the Kp values in the four non-humid regions and TP region are illustrated by solid lines during the warm season (May–September). The national Kp is illustrated by the solid black line with open star symbols.
3.1.5. Spatial Pattern and Temporal Variability of Kp in Humid Regions during the Cold Season
In humid regions (E, SE, and SW), the annual precipitation is larger than 1000 mm and the aridity index is less than 1.0 (Table 2). Due to the relatively high minimum temperature, there are no frozen periods throughout the whole year. Therefore, the evaporation records of E601B are still available during the cold season (October–April). The spatial pattern of evaporation (E20, EE601B) and the R2 and Kp between the two pans during the cold seasons are shown in Figure 6. As was the case in the warm season (Figure 3), the evaporation from the two pans exhibited similar spatial patterns during the cold season in humid areas, increasing from the central to marginal regions (Figure 6a,b) and averaging 664 mm and 427 mm annually for the φ20 and E601B pans, respectively (Table 3). The R2 values also increased from the central to marginal regions and were relatively high, with an average of 0.92. This trend indicated that the E601B evaporimeter could capture the variation in φ20 better during the cold season than during the warm season.
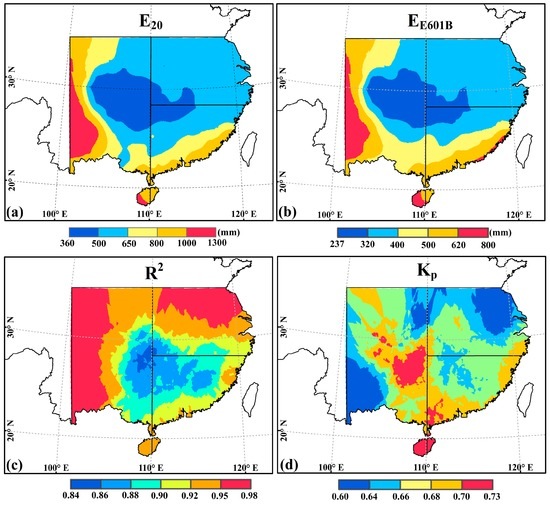
Figure 6.
Spatial distributions of φ20 (a) and E601B (b) evaporation; the correlation coefficient R2 (c); and the conversion coefficient Kp (d) between E601B and φ20 evaporation in the cold season (October–April).
Although the two pan evaporations had similar spatial patterns, the spatial variations in Kp during the cold season were not constant. The highest values occurred in the northwest and southeast parts of the humid region, indicating larger differences between the two evaporations, while the lowest values occurred in the northeast and southwest areas, indicating smaller differences between the two evaporations. Overall, the Kp values ranged from 0.49 to 0.81 (with a mean of 0.66 ± 0.057) in the humid regions. These values were significantly different from those during the warm season (p < 0.001). Of the three regions, the Kp values in the E region were significantly lower than those in the others regions (p < 0.01), and there was no significant difference between the values in the SE and SW regions. The highest Kp values appeared in the SW region during the warm season and in the SE region during the cold season.
The Kp between the two pans varied significantly during the cold season (October–April of the following year): (1) the Kp increased from October to the maximum value (Kp ≈ 0.71) in December or January of the following year, and then decreased until April (Kp ≈ 0.58); and (2) in the three regions, Kp exhibited the same pattern of variations. The variation of Kp at the annual timescale showed an increase from approximately May to December and then a decrease until April. The monthly variation pattern was most similar to that found by Fu et al. (2009), whose study was conducted at an experimental evaporation station in the E region. The average value of Kp during the cold season (0.66 ± 0.057) was greater than that during the warm season (0.62 ± 0.047), indicating a smaller difference between the two pan evaporations during the cold season. The average value of Kp in all months in the humid regions was 0.64, with a standard deviation of 0.057.
As noted above, except for in the TP region, the monthly variability in Kp exhibited a similar pattern in both the warm and cold seasons, which indicated that some specific factors may control the variability in the Kp value. Therefore, meteorological factors were quantitatively explored to identify those that made the greatest contributions to Kp variability.
3.2. Potential Factors That Influence Kp
The Pearson correlation coefficients (r) and significance levels between Kp and several climatic factors are listed in Table 4. Kp was generally negatively correlated with Rn, VPD, U2, Elev, and Tmean. The relationships between Kp and the climatic factors were similar to those noted by Xu et al. [33] in the Yangtze River basin, China. They investigated the Kp of φ20 and the Penman-Monteith reference evapotranspiration; and found that a high conversion coefficient was associated with a relatively high RH and low U2. At the national scale, Kp was significantly negatively correlated (p < 0.01) with Rn (r = −0.4) and VPD (r = −0.33), and positively correlated with RH (r = 0.33) (Table 4). As climate change has occurred in recent decades [48], the pan evaporation paradox [12,13] associated with the variation in solar radiation has gained increasing attention at the global [49,50] and regional scales [51,52]. The change in net radiation (Rn) is expected to strongly affect Kp because of the high correlation between Kp and Rn; therefore, it should be considered in studies of evaporation trends that use different pan measurements. However, at the regional scale, the r values exhibited a significant geographic distribution. In five of the eight climatic regions, NCP, NE, E, SE, and SW, the Kp values had the highest correlation with Rn, followed by RH and VPD. In the other three regions, the Kp values were more associated with RH (especially in the NC and TP regions, with r values of 0.46 and 0.42, respectively), and the following factors were found in VPD and Tmean (Table 4). Therefore, further analysis must be performed to quantitatively separate the effects of different climate variables on Kp values.
Table 4.
Pearson’s correlation between the conversion coefficients (Kp) and various climate factors, and the independent explanatory powers of each variable based on Kp variation derived from the stepwise multiple linear regressions (%, in parentheses). Tmean is the mean air temperature, RH is the relative humidity, VPD is the vapor pressure deficit, U2 is the wind speed at a height of 2 m, Elev is the elevation, and Rn is the net radiation. The dominant factors are highlighted in bold.
The percent contributions of each climate factor to Kp variation were analyzed using multiple stepwise regression with Kp as the dependent variable and the six climatic factors as the independent variables (Table 4). The climate factors together explained approximately one quarter of the Kp variation in China. Of the six climatic factors, Rn had the most explanatory power, with an independent explanation percentage of 15.5%, followed by RH and VPD (4.4% and 1.4%, respectively). The combined explanation percentage was 23.1%, which implied that more complicated mechanisms affect the variations in Kp. Similar to the r values, the highest explanatory percentages in five of the eight regions were found associated with Rn (the NCP, NE, E, SE, and SW regions) and ranged from 5.5% (NCP region) to 18.1% (E region), while RH in the other regions ranged from 11.2% (NW region) to 21% (NC region). The greatest combined explanation of the climatic factors was found in the NC region (32%), followed by the E (25.2%) and TP (22.6%) regions, and the weakest explanatory power was found in the NCP region (10.4%).
The two evaporimeters at each station experience the same macroclimate, so the microclimate differences between them can be magnified by the regional difference in climatic factors. For example, the volume and depth of the water in the pans are also important to Kp variability [16]. The difference in the water volume in the two pans caused the water temperature to increase at different rates. Due to the relatively low heat capacity, the water temperature of φ20 increases faster during the day and also decreases faster at night than that of the E601B pan. This phenomenon may be significant in regions with high temperature differences, such as the NE and NW regions (Table 3). By contrast, the E601B, compared to the φ20, has no effect because it was buried in the ground and surrounded by water (Figure 1). Similarly, Lim et al. [47], based on an energy balance experiment, found that the Kp between a Class A pan and steady state lake evaporation was mainly dependent on the additional radiation absorbed by the pan wall. The wall of the φ20 also had a large area based on the ratio of the wall to the water surface (Figure 1c). Thus, the wall absorbed additional radiation and transferred heat to the water, which increased the evaporation [27]. In addition, on nights without solar radiation, the appreciable storage of heat within the pan wall (Class A or φ20) may have caused additional evaporation [27], while E601B had a relatively small evaporation because it was buried in the soil. A negative correlation between Kp and Rn was found in this paper (Table 4), and this finding has also been confirmed by previous experimental data [15,41,53]. In addition, wind speed can decline rapidly with decreasing height due to higher surface roughness and friction near ground [21]. Therefore, a small φ20 evaporimeter located at a higher elevation and exposed to the faster wind speed should have more evaporation than the E601B evaporimeter, resulting in a small Kp. This condition can be amplified by regional differences in wind speed. For example, the average wind speed is high in the NE and NCP regions (Table 2); thus, the φ20 evaporation could be larger than that of E601, resulting in smaller Kp values than in other regions during the warm season (Table 3).
In conclusion, several factors, including water temperature, vapor pressure, wind speed, turbulence, heat transfer, and heat storage, can affect pan evaporation. The combined influence of various factors produces different spatial patterns and monthly variations in Kp. However, further analysis of the contribution of each factor to Kp requires rigorous experimental investigation of the physics of pan evaporation [47,53] or more reasonable evaporation models [14].
4. Uncertainties
Uncertainties of the spatial distribution and monthly variation of Kp existed in this study, as well as the explanatory powers of the climatic factors. First, although the spatial distribution of Kp is useful for evaporation studies, it should be noted that only larger R2 values indicate a high confidence of converting the φ20 evaporation to E601B evaporation. Therefore, in combination with the spatial distribution of R2 (Figure 3a and Figure 4), it was reasonable to obtain E601B evaporation by multiplying Kp by the φ20 evaporation in the northern part of China, such as in the NC, NCP, and NE regions. However, there are uncertainties in the TP and NW regions due to the relatively sparse distribution of monitoring stations in such large areas (Figure 2); thus, Kp should be used cautiously in these regions. Second, the Kp value was calculated based on the assumption that Kp remains constant over time. This may not be true in some places, and its further testing of the inter-annual variability is required. In addition, the climatic factors that were selected to explain Kp may not be independent. For example, VPD is a function of RH and temperature [21].
Despite these uncertainties, this study presented the spatial distribution of Kp and investigated the dominant climatic factors. Our findings were similar to those of previous studies [19,33,41,53]. Therefore, more attention should be paid to the spatial and temporal variations in Kp before using evaporation data from different evaporimeters. Some researchers have documented that evaporation from Class A (Figure 1a), GGI-3000 (Figure 1b), and φ20 (Figure 1c) evaporimeters had relatively small Kp values compared those of 20 m2 evaporation tanks [8,15,30]. By contrast, E601B evaporation had a high value of Kp and was close to the free water surface evaporation [15]. Researchers have compared various types of evaporimeters at the station scale in the E and NCP regions of China [15,30]. They found that the E601B, compared to other evaporimeters, had a larger conversion coefficient and smaller coefficient of variation with 20 m2 evaporation tanks, indicating that the evaporation from E601 was much closer to evaporation from the free water surface. The Class A and φ20 pans, which are exposed to the air and can absorb additional radiation via the wall, had small conversion coefficients with 20 m2 evaporation tanks [8,47]. Therefore, it is reasonable to substitute E601B for φ20 in China, not only because of its stability in different climate regions but also because of its relatively small difference relative to evaporation from large water bodies.
5. Conclusions and Suggestions
This paper analyzed the spatial distribution, correlation coefficient (R2), and conversion coefficient (Kp) of evaporation from two typical pans in eight climate regions in China. The main conclusions are as follows:
(1) During the warm season, the spatial evaporation patterns of the two pans were similar and showed increasing trends from the southeastern to northwestern regions of China. The R2 values were relatively high and ranged from 0.48 to 0.99 with an average of 0.89, which indicates that the E601B pans accurately captured the variation in φ20 evaporation. The Kp values showed significant spatial variability across China and varied from 0.46 to 0.92 with a mean of 0.60. The highest and lowest Kp values were found in the southwestern (SW and TP) and NE regions, respectively. Generally, Kp increased from May to September in all of the regions, especially during the summer (June, July and August). In the humid regions (the E, SE, and SW regions), the values of R2 and Kp were higher during the cold season (means of 0.92 and 0.66, respectively) than during the warm season. The monthly Kp values at the annual scale had a unimodal distribution. They increased from May to December or January the following year, and then decreased until April.
(2) The Pearson correlations and the explanatory powers of the variables were calculated using the multiple stepwise regression method. Rn was the dominant climatic factor for the variation in Kp, exhibiting the best correlation (r ≈ 0.4, p < 0.01) and highest independent explanatory power (approximately 15%) in five of the eight regions, followed by RH and VPD. The combined explanation percentage of all of the variables was 23.1%, and significant differences in explanation percentages were observed in the eight climate regions.
Although the contributions of climate factors to Kp variability were identified by the stepwise multiple linear regression method, the selected factors in this study had relatively weak explanatory powers. Further experiments must be performed to investigate the other potential mechanisms that affect Kp, such as the water vapor pressure at the surface and in the air, pan size, wind speed [53], and the energy balance around evaporimeters [47]. Based on this initial stage of this research, ongoing research and planned experiments, new approaches and evaporation equations [14,41] will be explored using the large and valuable meteorological records available in China. Quantification of the contributions of climatic factors to Kp and determination of the mechanisms of Kp variability can improve the understanding of long-term trends in pan evaporation across China.
Acknowledgments
This research was financially supported by Natural Science Foundation of China (No. 41330529, 41501032, 41571024). We will give many thanks to Wilfried Brutsaert and Guobin Fu for their good suggestions to the manuscript.
Author Contributions
This paper was designed and performed by all the authors. Yanzhong Li wrote the draft of the paper. Changming Liu provided the data and financial support. Kang Liang provided the idea and detailed directed the writing.
Conflicts of Interest
The authors declare no conflict of interest.
References
- Brutsaert, W. Evaporation into the Atmosphere: Theory, History and Applications; Springer: Heidelberg, Germany, 1982; Volume 1. [Google Scholar]
- Brutsaert, W.; Parlange, M. Hydrologic cycle explains the evaporation paradox. Nature 1998, 396, 30. [Google Scholar] [CrossRef]
- Hetherington, A.M.; Woodward, F.I. The role of stomata in sensing and driving environmental change. Nature 2003, 424, 901–908. [Google Scholar] [CrossRef] [PubMed]
- Jung, M.; Reichstein, M.; Ciais, P.; Seneviratne, S.I.; Sheffield, J.; Goulden, M.L.; Bonan, G.; Cescatti, A.; Chen, J.; De Jeu, R.; et al. Recent decline in the global land evapotranspiration trend due to limited moisture supply. Nature 2010, 467, 951–954. [Google Scholar] [CrossRef] [PubMed]
- Zhang, Y.; Liu, C.; Tang, Y.; Yang, Y. Trends in pan evaporation and reference and actual evapotranspiration across the Tibetan Plateau. J. Geophys. Res. Atmos. 2007, 112, 1103–1118. [Google Scholar] [CrossRef]
- Li, Y.; Liang, K.; Bai, P.; Feng, A.; Liu, L.; Dong, G. The spatiotemporal variation of reference evapotranspiration and the contribution of its climatic factors in the Loess Plateau, China. Environ. Earth Sci. 2016, 75, 1–14. [Google Scholar] [CrossRef]
- Hobbins, M.; Wood, A.; Streubel, D.; Werner, K. What Drives the Variability of Evaporative Demand across the Conterminous United States? J. Hydrometeorol. 2012, 13, 1195–1214. [Google Scholar] [CrossRef]
- Stanhill, G. Is the Class A evaporation pan still the most practical and accurate meteorological method for determining irrigation water requirements? Agric. For. Meteorol. 2002, 112, 233–236. [Google Scholar] [CrossRef]
- Alkhafaf, S.; Wierenga, P.J.; Williams, B.C. Evaporative Flux from Irrigated Cotton as Related to Leaf Area Index, Soil Water, and Evaporative Demand. Agron. J. 1978, 70, 912–917. [Google Scholar] [CrossRef]
- Azorin-Molina, C.; Vicente-Serrano, S.M.; Sanchez-Lorenzo, A.; McVicar, T.R.; Morán-Tejeda, E.; Revuelto, J.; El Kenawy, A.; Martín-Hernández, N.; Tomas-Burguera, M. Atmospheric evaporative demand observations, estimates and driving factors in Spain (1961–2011). J. Hydrol. 2015, 523, 262–277. [Google Scholar] [CrossRef]
- Donohue, R.J.; McVicar, T.R.; Roderick, M.L. Assessing the ability of potential evaporation formulations to capture the dynamics in evaporative demand within a changing climate. J. Hydrol. 2010, 386, 186–197. [Google Scholar] [CrossRef]
- Roderick, M.L.; Farquhar, G.D. The cause of decreased pan evaporation over the past 50 years. Science 2002, 298, 1410–1411. [Google Scholar] [PubMed]
- Liu, X.; Luo, Y.; Zhang, D.; Zhang, M.; Liu, C. Recent changes in pan-evaporation dynamics in China. Geophys. Res. Lett. 2011, 38, 142–154. [Google Scholar] [CrossRef]
- Singh, V.; Xu, C. Evaluation and generalization of 13 mass-transfer equations for determining free water evaporation. Hydrol. Process. 1997, 11, 311–323. [Google Scholar] [CrossRef]
- Fu, G.; Liu, C.; Chen, S.; Hong, J. Investigating the conversion coefficients for free water surface evaporation of different evaporation pans. Hydrol. Process. 2004, 18, 2247–2262. [Google Scholar] [CrossRef]
- Brouwer, C.; Heibloem, M. Irrigation Water Management: Irrigation Water Needs. Training Manual; Food and Agriculture Organization of the United Nations: Rome, Italy, 1986. [Google Scholar]
- Golubev, V.S.; Lawrimore, J.H.; Groisman, P.Y.; Speranskaya, N.A.; Zhuravin, S.A.; Menne, M.J.; Peterson, T.C.; Malone, R.W. Evaporation changes over the contiguous United States and the former USSR. Geophys. Res. Lett. 2001, 53, 323–324. [Google Scholar] [CrossRef]
- Symons, G.J. Evaporators and evaporation. Br. Rainfall 1867, 7, 9–10. [Google Scholar]
- Chen, D.; Gao, G.; Xu, C.Y.; Guo, J.; Ren, G. Comparison of the Thornthwaite method and pan data with the standard Penman-Monteith estimates of reference evapotranspiration in China. Clim. Res. 2005, 28, 123–132. [Google Scholar] [CrossRef]
- Brustaert, W. Evaluation of some practical methods of estimating evapotranspiration in arid climates at low latitudes. Water Resour. Res. 1965, 2, 187–191. [Google Scholar]
- Allen, R.G.; Pereira, L.S.; Raes, D.; Smith, M. Crop Evapotranspiration. Guidelines for Computing Crop Water Requirements; FAO Irrigation and Drainage Paper 56; Food and Agriculture Organization of the United Nations: Rome, Italy, 1998. [Google Scholar]
- Zuo, H.; Chen, B.; Wang, S.; Guo, Y.; Zuo, B.; Wu, L.; Gao, X. Observational study on complementary relationship between pan evaporation and actual evapotranspiration and its variation with pan type. Agric. For. Meteorol. 2016, 222, 1–9. [Google Scholar] [CrossRef]
- Liu, W.; Wang, L.; Zhou, J.; Li, Y.; Sun, F.; Fu, G.; Li, X.; Sang, Y.F. A worldwide evaluation of basin-scale evapotranspiration estimates against the water balance method. J. Hydrol. 2016, 538, 82–95. [Google Scholar] [CrossRef]
- Gao, G.; Xu, C.Y.; Chen, D.; Singh, V.P. Spatial and temporal characteristics of actual evapotranspiration over Haihe River basin in China. Stoch. Environ. Res. Risk Assess. 2012, 26, 655–669. [Google Scholar] [CrossRef]
- Liu, X.; Zhang, D. Trend analysis of reference evapotranspiration in Northwest China: The roles of changing wind speed and surface air temperature. Hydrol. Process. 2013, 27, 3941–3948. [Google Scholar] [CrossRef]
- Mao, D.; Wang, Z.; Li, L.; Song, K.; Jia, M. Quantitative assessment of human-induced impacts on marshes in Northeast China from 2000 to 2011. Ecol. Eng. 2014, 68, 97–104. [Google Scholar] [CrossRef]
- Yang, H.; Yang, D. Climatic factors influencing changing pan evaporation across China from 1961 to 2001. J. Hydrol. 2012, 414–415, 184–193. [Google Scholar] [CrossRef]
- Fu, G.; Charles, S.P.; Yu, J. A critical overview of pan evaporation trends over the last 50 years. Clim. Chang. 2009, 97, 193–214. [Google Scholar] [CrossRef]
- Li, Y.; Liang, K.; Liu, C.; Liu, W.; Bai, P. Evaluation of different evapotranspiration products in the middle Yellow River Basin, China. Hydrol. Res. 2016, 47. [Google Scholar] [CrossRef]
- Hong, J.; Fu, G.; Guo, Z. Experimental research on the water-surface evaporation of Nansi Lake in Shandong Province. Geogr. Res. 1996, 15, 42–49. (In Chinese) [Google Scholar]
- Yang, Y.; Yang, L.; Wang, X.; Liu, J.; Qian, R. Variation Charicteristic and Influence Factors of Pan Evaporation in Xingtai of Hebei Province. J. Arid Meteorol. 2013, 31, 82–88. (In Chinese) [Google Scholar]
- Liang, L.; Li, L.; Liu, Q. Spatio-temporal variations of reference crop evapotranspiration and pan evaporation in the West Songnen Plain of China. Hydrol. Sci. J. 2011, 56, 1300–1313. [Google Scholar] [CrossRef]
- Xu, C.Y.; Gong, L.; Jiang, T.; Chen, D.; Singh, V.P. Analysis of spatial distribution and temporal trend of reference evapotranspiration and pan evaporation in Changjiang (Yangtze River) catchment. J. Hydrol. 2006, 327, 81–93. [Google Scholar] [CrossRef]
- Brutsaert, W. Use of pan evaporation to estimate terrestrial evaporation trends: The case of the Tibetan Plateau. Water Resour. Res. 2013, 49, 3054–3058. [Google Scholar] [CrossRef]
- Ren, Z.; Liu, M.; Zhang, W. Conversion coefficient of small evaporation pan into E-601B pan in China. J. Appl. Meteorol. Sci. 2002, 13, 508–512. (In Chinese) [Google Scholar]
- Liu, X.N.; Wang, S.Q.; Wu, Z.X.; Wang, Y. Comparative analyses on two kinds of observed evaporation data in China. Q. J. Appl. Meteorol. 1998, 9, 321–328. (In Chinese) [Google Scholar]
- Liu, B.; Xu, M.; Henderson, M.; Gong, W. A spatial analysis of pan evaporation trends in China, 1955–2000. J. Geophys. Res. Atmos. 2004, 109, 1255–1263. [Google Scholar] [CrossRef]
- Zhang, Q.; Xu, C.Y.; Chen, Y.D.; Ren, L. Comparison of evapotranspiration variations between the Yellow River and Pearl River basin, China. Stoch. Envrion. Res. Risk Assess. 2011, 25, 139–150. [Google Scholar] [CrossRef]
- Brutsaert, W. Equations for vapor flux as a fully turbulent diffusion process under diabatic conditions. Hydrol. Sci. J. 1965, 10, 11–21. [Google Scholar] [CrossRef]
- World Meteorological Organization (WMO). Guide to Meteorological Instruments and Methods of Observation, 6th ed.; WMO Rep. 8; WMO: Geneva, Switzerland, 1996. [Google Scholar]
- Yu, S.L.; Brutsaert, W. Evaporation from very shallow pans. J. Appl. Meteorol. 1967, 6, 265–271. [Google Scholar] [CrossRef]
- Liu, C.; Zhang, D.; Liu, X.; Zhao, C. Spatial and temporal change in the potential evapotranspiration sensitivity to meteorological factors in China (1960–2007). J. Geogr. Sci. 2012, 22, 3–14. [Google Scholar] [CrossRef]
- Zhang, D.; Liu, X.; Hong, H. Assessing the effect of climate change on reference evapotranspiration in China. Stoch. Envrion. Res. Risk Assess. 2013, 27, 1871–1881. [Google Scholar] [CrossRef]
- Stein, M.L. Interpolation of spatial data: Some theory for kriging. Technometrics 2015, 42, 436–437. [Google Scholar]
- Qiu, J. China: The third pole. Nature 2008, 454, 393–396. [Google Scholar] [CrossRef] [PubMed]
- Linacre, E.T. Estimating U.S. Class A Pan Evaporation from Few Climate Data. Water Int. 1994, 19, 5–14. [Google Scholar] [CrossRef]
- Lim, W.H.; Roderick, M.L.; Hobbins, M.T.; Wong, S.C.; Farquhar, G.D. The energy balance of a US Class A evaporation pan. Agric. For. Meteorol. 2013, 182–183, 314–331. [Google Scholar] [CrossRef]
- Intergovernmental Panel on Climate Change (IPCC). Summary for Policymakes: The Physical Science Basis; Contribution of Working Group I to the IPCC Fifth Assessment Report Climate Change; IPCC: Geneva, Switzerland, 2013. [Google Scholar]
- Wild, M.; Gilgen, H.; Roesch, A.; Ohmura, A.; Long, C.N.; Dutton, E.G.; Forgan, B.; Kallis, A.; Russak, V.; Tsvetkov, A. From dimming to brightening: Decadal changes in surface solar radiation. Science 2005, 308, 847–850. [Google Scholar] [CrossRef] [PubMed]
- Gilgen, H.; Roesch, A.; Wild, M.; Ohmura, A. Decadal changes in shortwave irradiance at the surface in the period from 1960 to 2000 estimated from Global Energy Balance Archive Data. J. Geophys. Res. Atmos. 2009, 114. [Google Scholar] [CrossRef]
- Hayasaka, T.; Kawamoto, K.; Shi, G.; Ohmura, A. Importance of aerosols in satellite-derived estimates of surface shortwave irradiance over China. Geophys. Res. Lett. 2006, 33, 178–196. [Google Scholar] [CrossRef]
- You, Q.; Kang, S.; Flügel, W.A.; Sanchez-Lorenzo, A.; Yan, Y.; Huang, J.; Martin-Vide, J. From brightening to dimming in sunshine duration over the eastern and central Tibetan Plateau (1961–2005). Theor. Appl. Climatol. 2010, 101, 445–457. [Google Scholar] [CrossRef]
- Brutsaert, W.; Yu, S.L. Mass transfer aspects of pan evaporation. J. Appl. Meteorol. 1968, 7, 563–566. [Google Scholar] [CrossRef]
© 2016 by the authors; licensee MDPI, Basel, Switzerland. This article is an open access article distributed under the terms and conditions of the Creative Commons Attribution (CC-BY) license (http://creativecommons.org/licenses/by/4.0/).