Abstract
Rapid and accurate identification of the source of mine water inrush is a key technical challenge in preventing and controlling such accidents. To enhance the accuracy and stability of source identification, this study proposes a combined model integrating maximum information coefficient (MIC) feature selection, factor analysis (FA) for dimensionality reduction, and Multinomial Logistic Regression. First, MIC is utilized to select key variables from hydrochemical indicators that exhibit strong correlations with the water source type, effectively capturing significant nonlinear characteristics. Second, FA is adopted to reduce the dimensionality of the selected features, eliminate multicollinearity, and extract potential common factors. Finally, a combined discrimination model based on MIC-FA-Logistic regression is constructed. Using the Yangliu Coal Mine in the Huaibei Mining Area as a case study, 67 water samples were collected from four aquifers. Nine hydrochemical indicators, specifically Na+ + K+, Ca2+, Mg2+, Cl−, HCO3−, SO42−, total hardness, pH value, and total alkalinity, were selected as initial variables. MIC effectively quantified the complex correlation strengths between these indicators and the water source types. Consequently, eight indicators (Mg2+, SO42−, Ca2+, total hardness, pH, HCO3−, total alkalinity, and Na+ + K+) were selected as key discriminant variables. FA transformed these eight indicators into five new comprehensive variables, optimizing the model’s input structure. The discrimination accuracy rates of the MIC-FA-Logistic regression model for the training and test samples were 89.1% and 95.2%, respectively. This performance is significantly superior to traditional Logistic regression, FA-Logistic regression, MIC-Logistic regression, and SVM models. This study provides a method for discriminating mine water inrush sources characterized by high precision, high stability, and strong interpretability.
1. Introduction
The hydrogeological conditions of coal mines in China are complex, and frequent water inrush accidents occur during coal seam mining, leading to serious economic losses and casualties. Once a water inrush occurs in a mine, quickly and accurately determining its source is critical for water hazard control and the safe, efficient production of coal mines [1,2]. To prevent and control water inrush accidents and to promptly identify their sources, numerous scholars have conducted extensive research on this topic [3,4,5]. Currently, methods for identifying the source of water inrush primarily include groundwater chemical analysis, isotope methods, and multivariate statistical approaches [6,7]. The chemical composition of water objectively reflects the essential characteristics of water sources. Based on hydrochemical information, the source of water inrush can be identified more quickly and accurately [8]. Consequently, many scholars, based on the differences in the hydrochemical characteristics of various aquifers, have applied diverse methods, such as multivariate statistical analysis, fuzzy mathematics, Fisher discriminant analysis, gray theory, distance discriminant analysis, extension identification methods, and GIS theory, to process and comparatively analyze hydrochemical data from water inrushes and their potential source aquifers. This research has effectively guided the safe production of mines [9].
In recent years, advancements in mathematical theories and computer technology have led to the widespread application of machine learning methods, such as Back Propagation Neural Networks (BPNNs), Support Vector Machines (SVMs), Random Forests (RFs), and Extreme Learning Machines (ELMs), in the identification of mine water inrush sources. These methods have not only enhanced identification accuracy but also advanced the theoretical framework for mine water prevention and control. However, each of these methods possesses distinct advantages and limitations [10,11,12]. For instance, determining factor weights and membership degrees is often challenging in fuzzy mathematics and gray system theory. The extension recognition method is prone to misjudgment when analyzing sample data with minimal variance. Distance discrimination methods often fail to specifically subdivide discriminant factors, ignoring the varying influence of individual factors on the overall prediction. While SVMs are suitable for processing small sample data in high-dimensional spaces, they are significantly affected by parameter selection and are sensitive to noise and outliers. Similarly, RF models are prone to overfitting on datasets with excessive noise, which compromises prediction accuracy. BPNNs suffer from drawbacks such as slow convergence speeds and a tendency for model parameters to become trapped in local optima [13,14,15]. In addition, many existing identification methods require specific initial conditions and rely on strict assumptions regarding data distribution. The reliance on single-method approaches also limits potential improvements in model accuracy [16]. In contrast, the Multinomial Logistic Regression model offers distinct advantages—it does not require variables to follow a normal distribution and makes no assumptions regarding variable distribution. This method is particularly applicable to categorical variables with three or more classes where no ordinal relationship exists. The final discrimination result is presented as a probability, which is intuitive and aligns well with practical reality. Consequently, it demonstrates significant potential for identifying mine water inrush sources [17].
However, the direct application of the logistic regression model to the identification of mine water inrush sources presents three specific challenges. First, the large number of hydrochemical indicators poses a difficulty. If all hydrochemical indicators are used as inputs to construct a discrimination model, it not only leads to data redundancy and increases computational complexity but also reduces prediction accuracy [18]. Previous studies on the selection of hydrochemical features mostly relied on empirical judgment or linear correlation coefficients, making it difficult to effectively capture the nonlinear relationships between hydrochemical indicators and water source types. Second, high correlations often exist among hydrochemical indicators [19,20], which leads to significant multicollinearity issues and affects the stability of the discrimination model. Third, unordered multinomial logistic regression is prone to parameter estimation bias when processing high-dimensional, correlated features [21,22]. Therefore, there is a critical need to construct an integrated model that can effectively extract nonlinear features, eliminate redundant indicators, and improve discrimination accuracy.
To address these challenges and ensure the quality of model input variables, this study first introduces the MIC method to select hydrochemical features, quantify the correlation strength between hydrochemical indicators and water source types, and eliminate the influence of irrelevant features. MIC is a non-parametric correlation measure capable of simultaneously capturing linear and nonlinear relationships between variables. It overcomes the limitations of traditional Pearson correlation coefficients, which only reflect linear correlations, thereby ensuring the selection of high-value indicators that are genuinely related to water source types. Subsequently, FA is employed for dimensionality reduction and optimization. FA extracts a small number of independent common factors that comprehensively reflect the information of the original variables. These factors serve as inputs for the Multinomial Logistic Regression model, eliminating the influence of redundant features and improving model stability. Finally, a combined discrimination model based on MIC feature selection, FA dimensionality reduction, and Multinomial Logistic Regression is constructed to achieve high-precision, high stability, and strongly interpretable intelligent discrimination of mine water inrush sources.
2. Overview of the Study Area and Data Sources
2.1. Overview of the Study Area
The Yangliu Coal Mine is situated in Suixi County, Huaibei City, Anhui Province, China. The mine extends approximately 9 km from north to south and 3–9 km from east to west. Located in the central Huaibei Plain, the terrain is flat, with ground elevations ranging from + 25.98 to +28.26 m and averaging approximately +27 m. The mining area exhibits a transitional climate between continental and maritime. Winters are cold, dry, and windy, while summers are hot and rainy. Spring and autumn are mild. The average annual temperature is 14.5 °C. The mean annual average precipitation is 862.29 mm, with a maximum monthly average precipitation of 254.4 mm. Surface water in the area belongs to the Huai River system. The Hui River, a tributary of the Huai River, flows from the southwest periphery of the mine toward the southeast. The Hui River, along with its tributaries and artificial ditches, forms a dense, web-like surface water system. Structurally, the Yangliu Coal Mine is located at the northern end of the eastern limb of the Tongting Anticline. The strike of the shallow strata is nearly north–south. However, in deeper sections, the strike varies significantly due to faulting. The overall structure is a monocline with a dip angle of 2–29°, typically ranging between 5 and 24° with an average of 12°. The structural distribution of the mine is illustrated in Figure 1. The geological structure is complex, characterized by small- to medium-sized faults and well-developed folds. Seven coal seams are mineable, specifically seams No.31, No.32, No.51, No.72, No.81, No.82, and No.10. Among these, the No.82 and No.10 seams are the primary mineable coal seams.
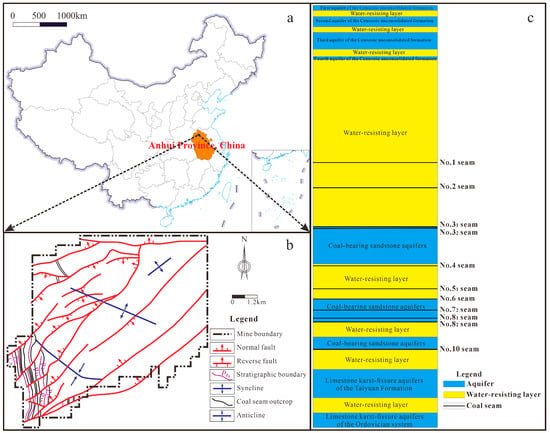
Figure 1.
Geographic location of the Yangliu Coal Mine in China and the structural distribution map: (a). Geographic location map in China; (b). Structural distribution map of the Yangliu Coal Mine; (c). Schematic diagram of distribution of aquifers and water-resisting layers of the Yangliu Coal Mine.
Based on the characteristics of the host media, the groundwater aquifers in the mine are classified into four types: the pore aquifers of the Cenozoic unconsolidated formation, the fracture aquifers of the Permian sandstone, the karst-fissure aquifers of the Carboniferous Taiyuan Formation limestone, and the karst-fissure aquifers of the Ordovician limestone. The pore aquifers in the Cenozoic unconsolidated formation are subdivided into four aquifers from top to bottom, designated as the First, Second, Third, and Fourth Aquifers, based on lithological associations and regional hydrogeological correlations. The Fourth Aquifer directly overlies the Permian coal-bearing strata and serves as one of the primary recharge sources for mine water inflow. The sandstone fracture aquifer located in the roof of the main mining coal seam acts as the direct water source for mine inflow. It is characterized by limited recharge and is dominated by static storage. In the karst-fissure aquifers of the Carboniferous Taiyuan Formation, the No. 1 to No.4 limestone layers are relatively well-developed and exhibit high water abundance. This aquifer serves as a supplementary and indirect water source during the mining of the No. 10 coal seam. The Ordovician limestone karst-fissure is approximately 500 m thick, featuring well-developed shallow karst fissures and strong water-bearing capacity. Under normal conditions, as the aquifer is distant from the main coal seam, it has no direct hydraulic connection to the mining operations. However, water inrush may occur when encountering water-conducting faults or karst collapse columns. Inrushes from the Ordovician limestone are characterized by high water pressure and large volume, representing a significant safety hazard in mine exploitation.
2.2. Data Sources
A total of 67 water samples were collected from four major aquifers implicated in historical water inrush accidents at the Yangliu Coal Mine to establish and verify the water source discrimination model. The dataset comprises 9 samples from the Fourth aquifer of the Cenozoic unconsolidated formation (hereinafter referred to as CUFFA), 31 samples from the coal-bearing sandstone aquifers of the Permian main mining seam (referred to as CBSA), 20 samples from the limestone karst-fissure aquifers of the Taiyuan Formation (referred to as TYLA), and 7 samples from the limestone karst-fissure aquifers of the Ordovician system (referred to as OLA). The primary hydrochemical indicators analyzed included K+ + Na+, Ca2+, Mg2+, Cl−, SO42−, HCO3−, CO32−, total hardness, pH, and total alkalinity. The analytical results for these samples are presented in Table 1. For the modeling process, the indicators were encoded as variables X1 through X9, representing total hardness, pH, total alkalinity, K+ + Na+, Ca2+, Mg2+, SO42−, HCO3−, and Cl−, respectively. The study utilized 46 samples for training and 21 samples for testing. The test set consisted of 2 samples from the CUFFA, 11 from the CBSA, 6 from the TYLA, and 2 from the OLA. Water samples were collected from drainage boreholes, hydrological observation wells, mining faces, and underground roadways at the Yangliu Coal Mine. Samples were spatially distributed uniformly, with no faults present in their vicinity. During the sampling period, the overall scale of mining operations in the study area was limited, resulting in no significant dynamic changes in groundwater levels across aquifers. Therefore, this study analyzed hydrochemical composition data of water samples solely from a static perspective. As indicated in Table 1, samples numbered 1 through 46 were designated as the training set, while samples 47 through 67 constituted the test set.

Table 1.
Hydrochemical composition data of water samples.
3. Methods
3.1. Maximum Information Coefficient MIC
MIC is a correlation analysis method based on information theory and it is capable of capturing the degree of both linear and nonlinear correlations between two variables and is characterized by strong noise resistance, universality, equitability, and symmetry [23,24]. Consequently, it is widely applied in fields such as statistics, data mining, and machine learning. The calculation of MIC relies on mutual information and grid partitioning. Mutual information quantifies the amount of information one variable contains about another. When input data contains a large number of redundant or noisy features, MIC serves as an effective tool for feature selection, improving model efficiency and accuracy [25,26,27]. MIC values range from 0 to 1; a larger value indicates a stronger association between the two variables. In this study, the features were ranked based on their correlation values with the category labels. A threshold was set at 0.5, and features with MIC values exceeding 0.5 were selected to form the feature subset for subsequent analysis. The specific calculation steps are as follows [28,29].
(1) Let the feature variable be represented by the set and the category label by the set , where n and m denote the sample sizes of the feature variable and the category label, respectively. The formula for mutual information (MI) is:
In the formula, is the joint probability density function of A and B; and represent the marginal probability densities of A and B, respectively.
(2) The scatter plot of variables A and B is partitioned using grids of varying resolutions (a × b), and the mutual information is calculated for each grid configuration. The MIC value is derived by normalizing the maximum mutual information obtained across all valid grid partitions. The calculation formula for MIC is expressed in Equation (2):
where a and b represent the number of bins (grid segments) along the X-axis and Y-axis, respectively; B denotes the upper bound for the total grid size (limit of total cells, i.e., a × b < B).
In this study, MIC is utilized to quantify the nonlinear correlation between each hydrochemical feature and the water source category. Features are ranked based on these scores. Those with weak correlations are eliminated, while variables exhibiting strong correlations are selected to construct a feature subset. This subset serves as the optimized input for the subsequent model. Compared to traditional methods such as Pearson and Spearman correlation, MIC demonstrates superior universality and robustness, capable of sensitively detecting complex, underlying dependencies between variables.
3.2. Factor Analysis
FA is a multivariate statistical analysis technique widely applied in the field of natural sciences [30,31]. Often viewed as an extension of Principal Component Analysis (PCA), it explores the underlying structure of observed data by analyzing internal dependencies among numerous variables. It represents this structure using a smaller set of unobserved, hypothetical variables known as factors. These factors capture the primary information and explain the interdependent relationships inherent in the original, high-dimensional dataset. Detailed calculation procedures are provided in references [32,33].
In this study, FA is employed to reduce the dimensionality of the dataset and identify common factors among the hydrochemical indicators. Specifically, the Principal Component method was adopted for factor extraction, followed by Varimax rotation to maximize the interpretability of the factors. Factor scores were subsequently calculated using the Regression Method. Through this process, the key features identified in the previous stage (MIC) are transformed into a set of linearly independent comprehensive variables. By selecting an appropriate number of these factor inputs, the structure of the Logistic regression model is significantly optimized. All statistical analyses were performed using IBM SPSS Statistics 27.
3.3. Multinomial Logistic Regression Model
The Multinomial Logistic Regression model is a probabilistic classification algorithm widely used in machine learning [34]. It serves as a multiple regression approach for analyzing the relationship between a dependent variable with three or more nominal (unordered) categories and a set of independent variables. Fundamentally, this method functions as an extension of binary logistic regression, simultaneously performing multiple binary comparisons [17,35]. In this study, the construction and analysis of the model were performed using SPSSAU software (Version 25.0) [36].
Consider a multi-classification problem where the dependent variable Y has j distinct categories . To estimate the model parameters, one category must be designated as the reference group (or baseline). While any category can serve this purpose, the last category (J) is commonly selected as the reference in theoretical formulations. Let the vector of independent variables be . The log-odds (logit) of the j-th category occurring relative to the reference category J is expressed as:
where is the probability of the dependent variable belonging to category ; represents the intercept (constant term) for the j-th logit model; represents the regression coefficient for the k-th independent variable in the j-th logit model; is the principal component of the k-th Class.
The sum of the probabilities for all J categories must equal to 1. This fundamental property is expressed in Equation (4):
By substituting the logic expressions from Equation (3) into this summation, the probability of the reference category J can be derived as shown in Equation (5):
Consequently, the individual probabilities for each category can be explicitly calculated. The system of probability equations is presented in Equation (6):
To generalize, the probability estimation for any specific category j (where the dependent variable has J categories) can be expressed using the unified formula in Equation (7).
3.4. Combined Discriminant Model Based on MIC-FA-Logistic Regression
Based on the analysis of nine hydrochemical indicators from water samples collected from four aquifers in the Yangliu Coal Mine, this study proposes a hybrid identification model that integrates MIC, FA and Multinomial Logistic Regression (referred to as the MIC-FA-Logistic model). The modeling process consists of three stages: First, the MIC method is employed to select optimal input variables, effectively filtering out irrelevant data. Second, FA is utilized to extract latent features from these selected variables, thereby reducing multicollinearity and coupling among the indicators. Finally, the Multinomial Logistic Regression algorithm is applied to achieve accurate and stable discrimination of the mine water inrush sources.
The methodology primarily comprises the following steps: First, water samples from inrush events are collected and subjected to hydrochemical composition analysis. Second, the dataset is partitioned into training and test sets, and the raw data undergoes preprocessing. Third, the MIC algorithm is employed to select hydrochemical features. This involves calculating the nonlinear correlation between each hydrochemical variable and the water source category labels, ranking the features, and removing those with weak or irrelevant correlations. Fourth, FA is applied to the features retained by MIC for dimensionality reduction. This step extracts a small number of independent common factors that comprehensively capture the information of the original variables, serving as optimized inputs for the subsequent model and eliminating redundancy. Fifth, the combined discrimination model for mine water inrush sources based on MIC-FA-Logistic regression is constructed. Sixth, the established model is applied to the test dataset to generate discrimination results, which are then analyzed and compared with other models to evaluate overall performance.
4. Result Analysis
4.1. Results of MIC Hydrochemical Feature Selection
Due to the complexity of groundwater systems, numerous hydrochemical indicators exist within each aquifer. Selecting an appropriate set of indicators is crucial for establishing an accurate water inrush source identification model [20]. In previous studies, the selection of hydrochemical features mostly relied on empirical judgment or linear correlation coefficients, making it difficult to effectively capture the nonlinear relationships between hydrochemical indicators and water source types. Typically, the major ions, Na+ + K+, Ca2+, Mg2+, Cl−, HCO3− + CO32−, and SO42−, are the most widely distributed constituents in groundwater. Additionally, total hardness, pH, and total alkalinity reflect the comprehensive influence of various hydrogeochemical processes on the water source, providing a robust basis for identification [33]. In this study, nine hydrochemical indicators, specifically Na+ + K+, Ca2+, Mg2+, Cl−, HCO3−, SO42−, total hardness, pH, and total alkalinity, were selected as the initial variables for the discrimination model. However, the correlation strength between each indicator and the water source type varies significantly. Therefore, effectively identifying and selecting high-value indicators that are genuinely correlated with the water inrush source is key to establishing a robust discrimination model.
This study employed MIC to select the hydrochemical features. By exploring the intrinsic connections between features and categories, the correlation strength between hydrochemical indicators and water source types was quantified. The most effective features conducive to classification were retained, while those irrelevant or weakly correlated with the categories were removed, thereby eliminating the influence of redundant features. A larger MIC value indicates a stronger relationship between two variables. The MIC values were calculated for the nine hydrochemical indicators and the water source categories, with the results illustrated in Figure 2. The results demonstrate that Mg2+, SO42−, Ca2+, total hardness, and pH value exhibit the strongest correlations with water source types, all displaying MIC values greater than 0.8. This indicates a high degree of correlation between these indicators and the water source types. Furthermore, HCO3−, total alkalinity, and Na+ + K+ also showed strong correlations, with MIC values exceeding 0.5. Consequently, these three indicators were also retained, resulting in a total of eight key hydrochemical indicators selected by the MIC screening process. The MIC value for Cl− was calculated at 0.377, which is below the 0.5 threshold, suggesting its limited contribution to water source discrimination. Therefore, Cl− was excluded, as depicted in Figure 3. This application of MIC effectively identified complex correlations between the nine hydrochemical indicators and water source types, quantifying their respective strengths. The eight selected indicators, namely Mg2+, SO42−, Ca2+, total hardness, pH value, HCO3−, total alkalinity, Na+ + K+, were retained as the key discriminant indicators for the water inflow source identification model, thereby removing the influence of weakly correlated features.
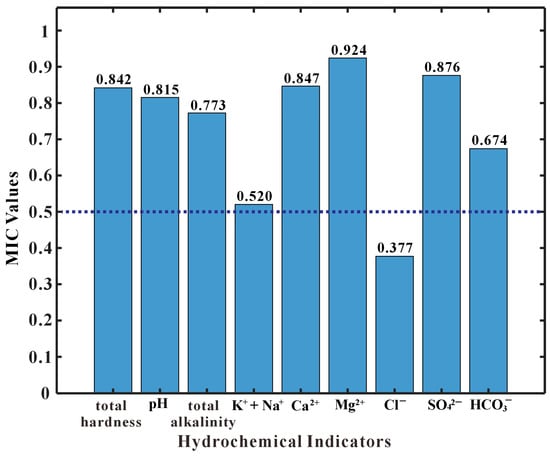
Figure 2.
MIC values of quantifying the correlation between the nine hydrochemical indicators and water source types.
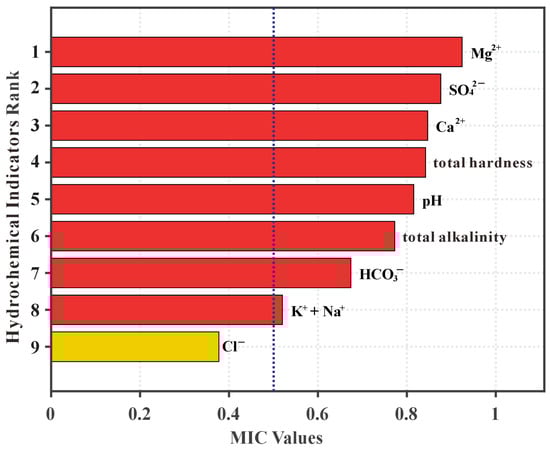
Figure 3.
Results of hydrochemical feature selection using the MIC method.
4.2. FA Feature Extraction Results
A correlation analysis was performed on the eight key discriminant indicators selected via the MIC method. The results are presented in Figure 4. As illustrated in the figure, significant correlations exist among these indicators. Specifically, total hardness exhibits strong correlations with Mg2+, Ca2+ and SO42−; correlation coefficients with SO42−, Ca2+ are 0.83 and 0.82, respectively. Similarly, total alkalinity shows high correlations with Na+ + K+ (0.84) and HCO3− (0.89). Furthermore, the correlation between Ca2+ and Mg2+ is 0.82, and that between Mg2+ and SO42− reaches 0.88. These results indicate substantial information redundancy and multicollinearity among these key discriminant indicators.
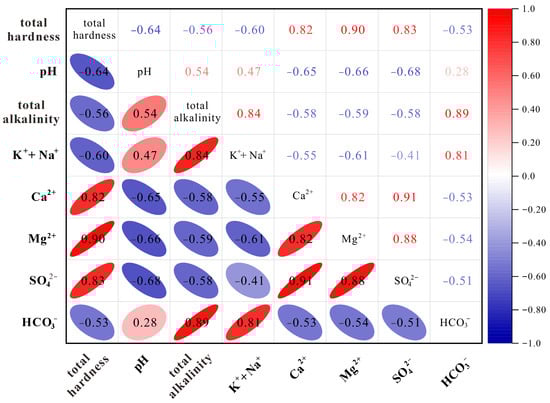
Figure 4.
Heatmap showing the correlations among the eight key hydrochemical indicators.
Factor analysis was performed on the eight key discriminant indicators selected via MIC. The results of the Kaiser–Meyer–Olkin (KMO) measure and Bartlett’s test of sphericity are presented in Table 2, confirming that the data are suitable for factor analysis [37,38]. After numerous attempts, better results were achieved when extracting five principal components. The variance explained and cumulative contribution for each component were calculated and are listed in Table 3. As indicated in Table 3, the cumulative variance explained by the first five components is 98.02%, capturing nearly all the information contained in the original dataset. Consequently, the first five components were selected as new composite variables. To enhance interpretability, these components were rotated using the Varimax method. Factor scores, denoted as F1, F2, F3, F4, and F5, were subsequently calculated using the regression method. The resulting factor score coefficient matrix is shown in Table 4. Finally, the factor score equations for the five new composite variables were derived, as shown in Equation (8).
In Equation (8), represent the scores of the five components, while denotes the standardized values of the eight key discriminative indicators selected via MIC.
This approach effectively reduces the data dimensionality from eight variables to five. By minimizing redundant information among the sample indicators, it decreases the number of independent variables required for the Multinomial Logistic Regression model. Consequently, this optimizes the model’s input structure and enhances its generalization capability.
Table 2.
Results of the KMO and Bartlett’s tests.
Table 2.
Results of the KMO and Bartlett’s tests.
| Kaiser–Meyer–Olkin measure of sampling adequacy | 0.611 | |
| Bartlett’s test of sphericity | Approximate chi square | 763.324 |
| Degree of freedom (df) | 28 | |
| Significance (Sig.) | <0.001 | |
Table 3.
Total variance explained.
Table 3.
Total variance explained.
| Component | Initial Eigenvalues | Extraction Sums of Squared Loadings | Sum of Squares of Rotational Load | ||||||
|---|---|---|---|---|---|---|---|---|---|
| Total | % Of Variance | Cumulative/% | Total | % Of Variance | Cumulative/% | Total | % Of Variance | Cumulative/% | |
| 1 | 5.587 | 69.841 | 69.841 | 5.587 | 69.841 | 69.841 | 3.173 | 39.665 | 39.665 |
| 2 | 1.266 | 15.826 | 85.667 | 1.266 | 15.826 | 85.667 | 2.694 | 33.680 | 73.345 |
| 3 | 0.503 | 6.285 | 91.952 | 0.503 | 6.285 | 91.952 | 1.207 | 15.090 | 88.435 |
| 4 | 0.313 | 3.907 | 95.859 | 0.313 | 3.907 | 95.859 | 0.428 | 5.354 | 93.789 |
| 5 | 0.173 | 2.167 | 98.026 | 0.173 | 2.167 | 98.026 | 0.339 | 4.237 | 98.026 |
| 6 | 0.099 | 1.242 | 99.268 | ||||||
| 7 | 0.054 | 0.671 | 99.940 | ||||||
| 8 | 0.005 | 0.060 | 100.000 | ||||||
Table 4.
Component score coefficient matrix.
Table 4.
Component score coefficient matrix.
| Indicators | Components | ||||
|---|---|---|---|---|---|
| 1 | 2 | 3 | 4 | 5 | |
| X1 | 0.592 | 0.138 | 0.231 | −0.673 | −0.411 |
| X2 | 0.28 | −0.103 | 1.184 | 0.161 | −0.069 |
| X3 | 0.233 | 0.52 | 0.303 | 0.222 | −0.67 |
| X4 | 0.197 | 0.181 | 0.001 | −0.309 | 1.349 |
| X5 | −0.095 | 0.174 | 0.171 | 1.819 | −0.507 |
| X6 | 0.599 | 0.068 | 0.139 | −0.893 | −0.011 |
| X7 | 0.302 | −0.008 | 0.037 | 0.16 | 0.894 |
| X8 | −0.001 | 0.554 | −0.328 | 0.128 | −0.541 |
4.3. Construction of the Combined Model
The five components (F1, F2, F3, F4, F5), extracted through MIC feature selection and Factor Analysis, were utilized as the independent variables for the Multinomial Logistic Regression model, while the water source category label Y served as the dependent variable. The dataset was partitioned into a training set comprising samples 1 to 46 and a test set comprising samples 47 to 67, representing a training-to-test ratio of approximately 7:3. The model was trained using the L-BFGS optimization algorithm with L2 regularization, and an intercept term was included. The maximum number of iterations was set to 5000, and the convergence tolerance was set to 0.001. Through this process, the combined discrimination model for mine water inrush sources, based on MIC-FA-Logistic regression, was established [36].
This combined model integrates linear feature combinations with the Sigmoid function, mapping input data to a probability range between 0 and 1. This value represents the likelihood that a sample belongs to a specific category; the category with the highest probability is subsequently selected as the classification result. The classification results for the training set are presented in Table 5. The overall accuracy of the combined model for the training samples is 89.1%, demonstrating robust discriminant performance. Specifically, the classification accuracy for water source Type II reached 100%, while Type III and Type IV achieved 92.9% and 80%, respectively. However, the accuracy for water source Type I was relatively low, at only 57.1%.
Table 5.
Discrimination results of the combined discriminant model on the training set samples.
To further assess the discrimination results on the training set, the model’s performance was evaluated using three metrics: precision, recall, and the F1-score [39]. The evaluation results are presented in Table 6. Precision refers to the proportion of actual positive samples among those predicted as positive. A higher value indicates fewer false positives. Recall refers to the proportion of positive samples correctly identified among all actual positive samples. A higher value indicates fewer false negatives. Since precision and recall often exhibit a trade-off, the F1-score is commonly used as a comprehensive evaluation metric. The F-1 score is the harmonic mean of precision and recall, with a value ranging from 0 to 1. A value closer to 1 indicates superior performance. This metric is particularly suitable for evaluating classifiers on imbalanced datasets [33]. As shown in Table 6, the model achieves an overall precision, recall, and F1-score of 0.89 on the training set. These results indicate that the model demonstrates robust performance and high stability.
Table 6.
Performance evaluation metrics of the combined discriminant model on the training set.
Upon completion of model training, the test set data were input into the model to generate classification results, as illustrated in Figure 5 and Figure 6. As observed in these figures, the classification accuracy rate of the combined model for the test samples reached 95.2%. Model performance was further evaluated using precision, recall, and the F1-score. The evaluation results are presented in Table 7 and Figure 7. The combined discriminant model achieved a weighted average precision of 96.83%, a recall of 95.24%, and an F1-score of 0.95 on the test set. These metrics indicate that the model possesses excellent discriminant performance and stability.
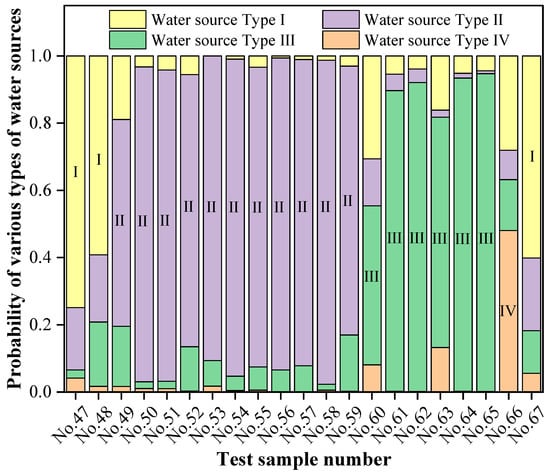
Figure 5.
Discrimination results of the combined model for the test set samples.
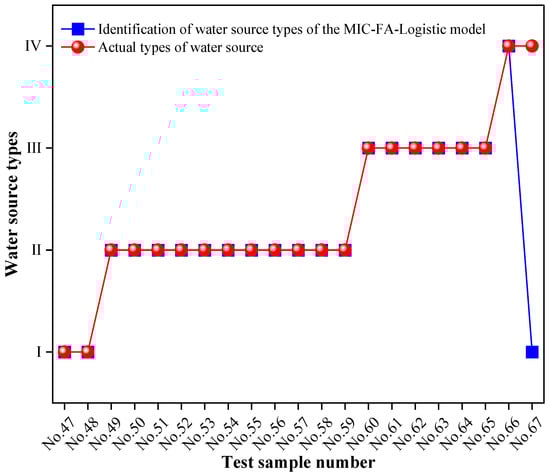
Figure 6.
Comparison between the predicted discrimination results and the actual water source types for the test set.
Table 7.
Performance evaluation metrics of the combined discriminant model on the test set.
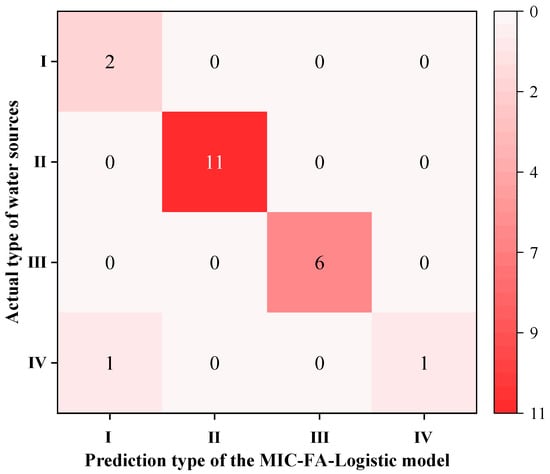
Figure 7.
Confusion matrix of the combined discriminant model on the test set.
4.4. Performance Comparison of Different Models
To further demonstrate the advantages of the proposed combined model, four comparative models were established: the traditional Logistic Regression model, the FA-Logistic regression model, the MIC-Logistic regression model, and the traditional SVM model. The classification performance of these models was compared with that of the MIC-FA-Logistic model. The results are presented in Table 8.
Table 8.
Comparison of prediction results across the five models.
Based on the classification results for the training samples (refer to Table 8 and Figure 8), the MIC-FA-Logistic regression model demonstrates significantly improved performance compared to the traditional Logistic, FA-Logistic, MIC-Logistic, and SVM models. The training accuracy reached 89.1%, while the weighted average precision, recall, and F1-score were all 0.89, demonstrating the superior performance of the proposed method.
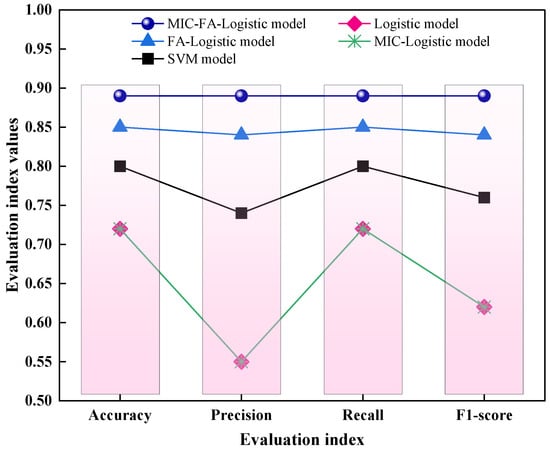
Figure 8.
Comparison of performance metrics for the different models on the training set.
According to the classification results for the test samples (refer to Table 8 and Figure 9), both the traditional Logistic regression and MIC-Logistic regression models produced 4 misclassifications out of 21 samples, resulting in an accuracy of 81.0%. The SVM model resulted in 3 misclassifications, yielding an accuracy of 86%, while the FA-Logistic regression model performed slightly better with 2 misclassifications and an accuracy of 90.5%. In contrast, the MIC-FA-Logistic regression model produced only one misclassification, achieving a significantly higher accuracy of 95.2%. Furthermore, among the five models, the MIC-FA-Logistic model achieved the highest weighted average precision (0.97), recall (0.95), and F-1 score (0.95). These metrics demonstrate the superior performance of the proposed method and indicate that the model possesses excellent generalization capabilities for identifying new samples.
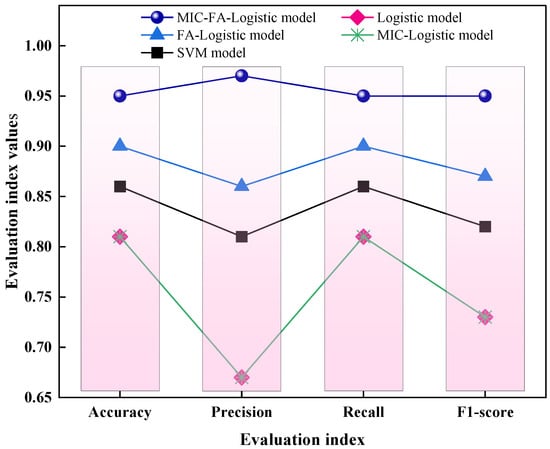
Figure 9.
Comparison of the performance metrics for the different models on the test set.
In summary, the MIC-FA-Logistic regression model established in this study demonstrates superior performance compared to the other four models. Specifically, the FA-Logistic model showed significant improvement over the traditional Logistic model. Although the classification performance of the MIC-Logistic model was identical to that of the traditional Logistic model, the MIC selection process successfully eliminated the Cl− variable. This reduction in input variables simplifies the model structure and confirms that the contribution of Cl− to water source discrimination is minimal. The SVM model exhibited moderate performance, though significant room for improvement remains. Ultimately, the proposed combined model demonstrates not only strong fitting capabilities for the training samples but also excellent predictive performance for new samples, indicating superior accuracy and robust generalization ability.
Additionally, as shown in Table 8, several water samples (specifically Samples 2, 36, and 67) could not be effectively differentiated by various methods. Since the water samples used for model development were collected from mine drainage wells, hydrogeological observation wells, mining workfaces, and underground tunnels, they exhibit spatially uniform distribution. Furthermore, no abnormal changes in borehole water levels occurred during sampling, and no faults were present near these three samples. Therefore, we conclude that the spatial distribution of water samples can be disregarded. Analysis indicates that the primary cause stems from insufficient raw data for the Fourth Aquifer and Ordovician limestone aquifer, coupled with a relatively larger number of samples from the sandstone and limestone aquifers. This imbalance in sample distribution across the four aquifers has limited the model’s discrimination accuracy to some extent.
5. Discussion
To minimize the disruption caused by mine water inrushes to mining operations and reduce the risks posed to underground personnel and equipment, accurately identifying the source of water inrushes and implementing effective prevention and control measures represent a critical challenge in mining engineering [40,41]. Hydrochemical analysis is of critical significance for identifying the sources of mine groundwater. Since groundwater chemistry reflects the intrinsic characteristics of groundwater and enables accurate, rapid, and economical identification of water sources, it has become a commonly used method for identifying the source of mine water inrushes. Currently, some researchers have employed techniques such as logistic regression, factor analysis, and Bayesian discrimination based on hydrochemical analysis to investigate the identification of water inrush sources in multiple Chinese mines, including Yuan’er Coal Mine, Gubei Coal Mine, and Xieyi Coal Mine, achieving satisfactory results [42,43]. However, due to the complexity of groundwater systems, traditional identification methods relying on conventional hydrochemical characteristics and single-model approaches often suffer from significant errors [5,17].
The MIC-FA-Logistic regression model proposed in this study demonstrates significant advantages in identifying mine water inrush sources. These advantages can be attributed to three key contributions. First, the model comprehensively captures the nonlinear relationship between hydrochemical indicators and water source categories via the MIC method. This effectively quantifies the correlation strength between variables. Consequently, irrelevant or weakly correlated features are eliminated. This approach avoids the common pitfalls of traditional methods, such as feature omission or the selection of irrelevant variables due to ignoring nonlinear correlations [25], thereby achieving a scientifically rigorous selection of hydrochemical features. Second, Factor Analysis is employed to reduce the dimensionality of the selected hydrochemical features. This step effectively eliminates the influence of multicollinearity, further optimizes the model’s input structure, and enhances its stability. Third, the Multinomial Logistic Regression serves as the core classifier, offering the distinct advantage of strong probabilistic interpretability. Unlike some machine learning models (e.g., SVMs) that function as “black boxes”, this method outputs posterior probabilities for each category, selecting the one with the highest probability as the final result. This makes the discrimination process more intuitive and easier to interpret. By integrating the complementary strengths of these three methods, the MIC-FA-Logistic model ensures robust, high-precision, and probabilistic identification of mine water inrush sources.
Although the combined discrimination model for mine water inrushes sources based on MIC-FA-Logistic regression performs well, certain limitations remain. The model was established based on hydrochemical data from 67 water samples collected from four aquifers in the Yangliu Coal Mine. Consequently, the discriminative performance is inherently influenced by the quality and size of the sample dataset. If the samples lack representativeness or if there is a significant imbalance in the number of samples across different aquifers, these biases may propagate through the model inputs, thereby affecting accuracy. Specifically, the samples for Type I and Type IV aquifers were relatively limited compared to other types. The traditional Logistic and MIC-Logistic models exhibited high misclassification rates for Type I and Type IV, indicating that these models are significantly affected by sample imbalance. Although the MIC-FA-Logistic regression model significantly reduced the misclassification rate for Type I and Type IV samples, there remains room for further improvement, particularly in expanding the dataset for underrepresented aquifers. In future research, it is necessary to collect more water sample data, prioritize addressing sample size imbalance, and employ random sampling to perform gradient partitioning modeling on the water sample dataset. Systematically conduct modeling and accuracy analysis of this method under varying sample sizes to determine the minimum sample size required for significant improvement in model accuracy. Additionally, compare the accuracy variation patterns of this method with traditional groundwater source identification methods across different sample sizes to further validate its advantages in sample utilization efficiency.
Furthermore, mine water inrush is a complex nonlinear process influenced by multiple factors including hydrogeological conditions, fault structures, and mining activities [32]. The water chemistry of mine aquifers is not the sole decisive factor in every instance of mine water inrush risk. However, changes in the water chemistry characteristics of mine aquifers can often provide early warning signs for potential water inrush events. Mine groundwater systems are inherently complex, characterized by highly variable hydrochemistry and numerous constituents [5]. Accurate source identification depends not only on the nine hydrochemical indicators analyzed in this study but also potentially on other parameters, such as water temperature, stable isotopes, and trace elements [33,44].
Additionally, some studies have applied intelligent optimization algorithms combined with the fluorescence spectra of organic indicators such as UV254, TOC, and dissolved organic matter (DOM), along with new technologies for real-time monitoring of aquifer water quality changes, to identify the sources of mine water inrushes. This has effectively improved the accuracy and intelligence of source identification, though it has also increased the cost of such identification to some extent. Generally, routine water chemistry testing of mine aquifers is relatively low-cost. The MIC-FA-Logistic regression model established in this study using nine hydrochemical indicators can economically identify water inrush sources. Future research should consider incorporating additional identification factors while balancing economic costs, establishing a more comprehensive and scientific identification indicator system. Integrating new indicators and technologies will further enhance early warning capabilities for mine water inrush risks, thereby safeguarding mine production safety.
6. Conclusions
Based on the hydrogeological conditions of the Yangliu Coal Mine, water samples from four aquifers were collected and analyzed. Nine hydrochemical indicators were selected as initial variables to construct a combined discrimination model integrating MIC feature selection, FA optimization, and Multinomial Logistic Regression. This hybrid model utilizes MIC to retain nonlinear features that are strongly correlated with water sources, and employs FA for dimensionality reduction to eliminate multicollinearity. Consequently, the model achieves robust, probabilistic discrimination of water inrush sources across the mine’s multiple aquifers. The main conclusions are as follows:
- (1)
- The MIC method effectively identified the complex correlations between the nine initial hydrochemical indicators and the water source types, quantifying the specific correlation strength for each. Consequently, eight indicators, namely Mg2+, SO42−, Ca2+, total hardness, pH, HCO3−, total alkalinity, and Na+ + K+, were selected as the key discriminant variables. This process successfully eliminated the influence of weakly correlated features (such as Cl−).
- (2)
- Factor analysis transformed these eight selected key indicators into five new comprehensive variables (common factors). This step optimized the model’s input structure by effectively eliminating information redundancy and multicollinearity among the variables.
- (3)
- Compared to the traditional Logistic regression, FA-Logistic regression, MIC-Logistic regression and SVM models, the classification performance of the proposed MIC-FA-Logistic regression model is significantly superior. The classification accuracies for the training and test samples reached 89.1% and 95.2%, respectively.
- (4)
- The model proposed in this study integrates high accuracy, high stability, and strong probabilistic interpretability. It provides a scientifically rigorous and reliable method for identifying mine water inrush sources, with a level of precision that meets the requirements for modern mine safety and hazard control.
Author Contributions
Conceptualization, Y.B. and X.Z.; methodology, Y.B. and J.W.; software, Y.B.; investigation, L.D. and Y.B.; resources, Y.B. and X.Z.; data curation, F.L. and Y.B.; writing—original draft preparation, Y.B.; writing—review and editing, Y.B. and D.L. All authors have read and agreed to the published version of the manuscript.
Funding
The study was supported by the Open Foundation of the Key Laboratory of Mine Geological Disaster Prevention of Anhui Province (Grant No. 2023-MGDP-05) and the Anhui Provincial Department of Education University Research Project (Natural Science) (Grant No. 2024AH051734).
Data Availability Statement
The data used to support the findings of this study are available from the corresponding author upon reasonable request.
Conflicts of Interest
The authors declare no conflicts of interest.
References
- Wang, T.T.; Jin, D.W.; Liu, J.; Yang, J.; Wang, X.Y.; Zhao, W. Application of dynamic weight-set pair analysis model in mine water inrush discrimination. J. China Coal Soc. 2019, 44, 2840–2850. [Google Scholar]
- Ju, Q.D.; Hu, Y.B.; Liu, Q.M. Grey Situation Decision Method Based on Improved Whitening Function to Identify Water Inrush Sources in the Whole Cycle of Coal Mining. Water 2025, 17, 1479. [Google Scholar] [CrossRef]
- Yang, Y.; Li, J.; Tao, H.W.; Cheng, Y.; Zhao, L. Explainable Machine Learning Model for Source Type Identification of Mine Inrush Water. Information 2025, 16, 648. [Google Scholar] [CrossRef]
- Wang, D.K.; Ju, Q.D.; Wang, Y.Q.; Hu, Y.B.; Liu, Q.M.; Chai, H.C.; Liu, Y. Source identification of mine water inrush based on the exponential whitenization function and the grey situation decision model. Energy Explor. Exploit. 2022, 40, 1217–1235. [Google Scholar] [CrossRef]
- Liu, W.Y.; Li, B.B.; Du, Y.H.; Han, M.K.; Zhao, J.Y. Research on the recognition model of mine water inrush source based on improved SSA-BP neural network. Ind. Mine Autom. 2024, 50, 98–105+115. [Google Scholar]
- Dong, D.L.; Zhang, J.L. Discrimination methods of mine inrush water source. Water 2023, 15, 3237. [Google Scholar] [CrossRef]
- Wu, Q.; Mu, W.P.; Xing, Y.; Qian, C.; Shen, J.J.; Wang, Y.; Zhao, D.K. Source discrimination of mine water inrush using multiple methods: A case study from the Beiyangzhuang Mine, Northern China. Bull. Eng. Geol. Environ. 2019, 78, 469–482. [Google Scholar] [CrossRef]
- Bi, Y.S.; Wu, J.W.; Zhai, X.R.; Shen, S.H.; Tang, L.B.; Huang, K.; Zhang, D.W. Application of Partial Least Squares-Discriminate Analysis Model Based on Water Chemical Compositions in Identifying Water Inrush Sources from Multiple Aquifers in Mines. Geofluids 2021, 2021, 6663827. [Google Scholar] [CrossRef]
- Dong, D.L.; Zhang, L.Q.; Zhang, E.Y.; Fu, P.Q.; Chen, Y.Q.; Lin, X.D.; Li, H.Z. A rapid identification model of mine water inrush based on PSO-XGBoost. Coal Sci. Technol. 2023, 51, 72–82. [Google Scholar]
- Jiang, C.L.; Zhu, S.J.; Hu, H.; An, S.K.; Su, W.; Chen, X.; Li, C.; Zheng, L.G. Deep learning model based on big data for water source discrimination in an underground multiaquifer coal mine. Bull. Eng. Geol. Environ. 2022, 81, 26. [Google Scholar] [CrossRef]
- Wei, Z.L.; Ji, Y.; Fang, H.M.; Yu, L.J.; Dong, D.L. Rapid Source Identification of Mine Water Inrush Using Spectral Data Combined with BA-RBF Modeling. Water 2025, 17, 790. [Google Scholar] [CrossRef]
- Wang, H.; Sun, J.Q.; Zeng, Y.F.; Shang, H.B.; Wang, T.T.; Qiao, W. An intelligent water source discrimination method for water inrushes from coal seam roofs in the Inner Mongolia-Shaanxi border region. Coal Geol. Explor. 2024, 52, 76–88. [Google Scholar]
- Ji, Y.; Dong, D.L.; Gao, J.; Wei, Z.L.; Ding, J.; Hu, Z.Q. Source discrimination of mine water inrush based on spectral data and EGA–PNN model: A case study of huangyuchuan mine. Mine Water Environ. 2022, 41, 583–593. [Google Scholar] [CrossRef]
- Wang, S.C.; Zhai, P.H.; Yu, X.G.; Han, J.; Shi, L.Q. Optimizing identification of mine water inrush source with manifold reduction and semi-supervised learning using improved autoencoder. Stoch. Environ. Res. Risk Assess. 2024, 38, 1701–1720. [Google Scholar] [CrossRef]
- Ma, L.J.; Wang, S.; Zhao, B.F.; Lv, Y.G.; Zhang, Y.; Lu, C.W. Identification method of mine water inrush source based on PCA-SSA-BPNN. J. Min. Saf. Eng. 2025, 42, 273–281. [Google Scholar]
- Chen, X.Y.; Shi, N.; Du, J.J.; Wang, A.L. Study on the Influencing Factors of Rural Courtyard’s Space Combination Based on Multinomial Logistic Regression. J. Shandong Agric. Univ. (Nat. Sci. Ed.) 2017, 48, 688–693. [Google Scholar]
- Ji, Z.C.; Ding, X.; Hou, E.K.; Pu, Z.G.; Xie, P. The PCA-Logistic method for identification of water burst in Nalinhe No.2 coal mine. Coal Geol. Explor. 2020, 48, 97–105+112. [Google Scholar]
- Bi, Y.S.; Wu, J.W.; Zhai, X.R.; Wang, G.T.; Shen, S.H.; Qing, X.B. Discriminant Analysis of Mine Water Inrush Sources with Multi-Aquifer Based on Multivariate Statistical Analysis. Environ. Earth Sci. 2021, 80, 144. [Google Scholar] [CrossRef]
- Yu, X.G.; Liu, Y.F.; Zhai, P.H. Identification of mine water inrush source based on PCA-AWOA-ELM model. Coal Sci. Technol. 2023, 51, 182–189. [Google Scholar]
- Shao, L.S.; Li, X.C. Indentification of mine water inrush source based on MIV-PSO-SVM. Coal Sci. Technol. 2018, 46, 183–190. [Google Scholar]
- Dong, D.L.; Chen, Y.Y.; Ni, L.G.; Li, Y.; Qin, H.Q.; Wei, X.Y. Fast discriminant model of mine water inrush source based on WOA-ELM algorithm. J. China Coal Soc. 2021, 46, 984–993. [Google Scholar]
- Huo, J.Y.; Wang, X.S.; Liu, Q.; Ye, X.C.; Yu, C.J. Lane Line Recognition and Influencing Factors Analysis of Ground Roads Based on a Hybrid Model. China J. Highw. Transp. 2025, 38, 1–12. [Google Scholar]
- Xu, J.B.; Hou, X.M.; Wu, X.; Liu, Y.F.; Sun, G.Z. Slope Displacement Prediction Using MIC-XGBoost-LSTM Model. China J. Highw. Transp. 2024, 37, 38–48. [Google Scholar]
- Li, L.W.; Wu, Y.P.; Miao, F.S.; Liao, K.; Zhang, L.F. Displacement prediction of landslides based on variational mode decomposition and GWO-MlC-SVR model. Chin. J. Rock Mech. Eng. 2018, 37, 1395–1406. [Google Scholar]
- Yao, S.C.; Li, L.Q.; Liu, W.; Li, Z.H.; Zhou, A.L.; Li, W.J.; Chen, J.H.; Lu, Z.M. Emission Concentration Prediction of NOx from Waste Incinerator Based on MIC-PCA-LSTM Model. J. South China Univ. Technol. (Nat. Sci. Ed.) 2025, 53, 1–10. [Google Scholar]
- Bi, Y.; Zheng, B.; Zhang, Y.W.; Zhu, X.; Jiang, Y.L.; Li, C.S. Vibration trend prediction of hydroelectric generating unit based on MIC and BiGRU. J. Hydraul. Eng. 2021, 52, 612–621+632. [Google Scholar]
- Gu, J.F.; Xu, M.Y.; Ma, F.Y.; Lin, Z.Y.; Ji, C.; Wang, J.D.; Sun, W. Support vector regression based on maximal information coefficient and its application in chemical industrial processes. CIESC J. 2021, 72, 1480–1486. [Google Scholar]
- Tang, C.J.; Wang, C.; Huan, Z.; Chen, L. Feasibility Detection for Time-Sensitive Network Configurations Based on MIC-SSA-SVM. J. Kunming Univ. Sci. Technol. (Nat. Sci.) 2024, 49, 73–82. [Google Scholar]
- Xiong, W.Z.; Xu, J.X.; Xiong, Y. Research on anode copper quality prediction based on MIC feature selection and WOA-LSSVM optimization. Chin. J. Process Eng. 2025, 25, 579–589. [Google Scholar]
- Jiang, Q.X.; Sun, Y.X.; Wang, Z.L.; Song, L.L.; Wu, Y.X.; Guo, W.P.; Tao, M.Y. Evaluation of water resources utilization efficiency and analysis of driving factors in Heilongjiang Province based on mutation theory and factor analysis. Water Resour. Prot. 2025, 41, 19–26. [Google Scholar]
- Meng, Y.W.; Wang, L.; Li, Z.P.; Li, B.B.; Qing, G.Y.; Liu, Z.S. Driver’s Visual Load Based on Factor Analysis and Entropy Weight Methods for Mountainous Two-lane Road. J. Transp. Syst. Eng. Inf. Technol. 2025, 25, 361–372. [Google Scholar]
- Bi, Y.S.; Shen, S.H.; Wu, J.W.; Li, D. Prediction of the height of water-conducting fracture zone using the FA-ALO-SVR model. Earth Sci. Inform. 2025, 18, 85. [Google Scholar] [CrossRef]
- Bi, Y.S.; Shen, S.H.; Wu, J.W. An improved LSSVM discrimination model based on factor analysis and moth flame optimization algorithm for identifying water inrush sources across multiple aquifers in mines. Environ. Earth Sci. 2024, 83, 424. [Google Scholar] [CrossRef]
- Chen, J.; Shen, R.P.; Li, B.L.; Ti, C.P.; Yan, X.Y.; Zhou, M.Y.; Wang, S.W. The development of plastic greenhouse index based on Logistic regression analysis. Remote Sens. Nat. Resour. 2019, 31, 43–50. [Google Scholar]
- Zhang, H.; Yao, D.X.; Lu, H.F.; Xue, L.; Zhu, N.N. Study on Water Source Discrimination Based on Multinomial Logistic Regression Model Using Principal Component Analysis. Geol. J. China Univ. 2017, 23, 366–372. [Google Scholar]
- The SPSSAU Project. SPSSAU. Version 25.0. Online Application Software. 2025. Available online: https://www.spssau.com (accessed on 28 January 2026).
- Shrestha, N. Factor analysis as a tool for survey analysis. Am. J. Appl. Math. Stat. 2021, 9, 4–11. [Google Scholar] [CrossRef]
- Roy, B.N.; Roy, H.; Rahman, K.S.; Mahmud, F.; Bhuiyan, M.M.K.; Hasan, M.; Bhuiyan, A.K.; Hasan, M.; Mahbub, M.S.; Jahedi, R.M.; et al. Principal component analysis incorporated water quality index modeling for Dhaka-based rivers. City Environ. Interact. 2024, 23, 100150. [Google Scholar]
- Lu, X.; Wang, Q.; Xie, B.; Zhu, J. A KPCA-ISSA-SVM Hybrid Model for Identifying Sources of Mine Water Inrush Using Hydrochemical Indicators. Water 2025, 17, 2859. [Google Scholar] [CrossRef]
- Ylldlz, T.D. Loss of profits occurring due to the halting of mining operations arising from occupational accidents or reasons related to legislation. Gospod. Surowcami Miner. Miner. Resour. Manag. 2021, 37, 153–176. [Google Scholar]
- Onder, S.; Mutlu, M. Analyses of non-fatal accidents in an opencast mine by logistic regression model—A case study. Int. J. Inj. Control Saf. Promot. 2017, 24, 328–337. [Google Scholar] [CrossRef]
- Zhang, H.; Xing, H.; Yao, D.; Liu, L.; Xue, D.; Guo, F. The multiple logistic regression recognition model for mine water inrush source based on cluster analysis. Environ. Earth Sci. 2019, 78, 612. [Google Scholar] [CrossRef]
- Zhu, J.Z.; Li, L.; Yang, S. Research on discrimination of mine water bursting source based on factor analysis. Min. Saf. Environ. Prot. 2021, 48, 87–91+96. [Google Scholar]
- Xue, W.F.; Hou, E.K.; Zhao, X.; Ye, Y.; Tsangaratos, P.; Ilia, I.; Chen, W. Discriminant Analysis of Water Inrush Sources in the Weibei Coalfield, Shaanxi Province, China. Water 2023, 15, 453. [Google Scholar] [CrossRef]


Disclaimer/Publisher’s Note: The statements, opinions and data contained in all publications are solely those of the individual author(s) and contributor(s) and not of MDPI and/or the editor(s). MDPI and/or the editor(s) disclaim responsibility for any injury to people or property resulting from any ideas, methods, instructions or products referred to in the content. |
© 2026 by the authors. Licensee MDPI, Basel, Switzerland. This article is an open access article distributed under the terms and conditions of the Creative Commons Attribution (CC BY) license.