Abstract
This research study examines a renewable energy system that has been designed to meet the water needs of Mykonos, a tourism-dependent island in Greece with high seasonal demand. The proposed system consists of 22 wind turbines of 2.3 MW each, 4 desalination units with a total capacity of 1400 m3/h and multiple pumped-hydro storage reservoirs with a total volume of 3,900,000 m3. Two operational scenarios were analyzed. Water production through desalination was prioritized in both scenarios; however, their difference lies in the way excess renewable energy has been allocated: that is either to storage or to electricity generation. The results indicate that water demand in Mykonos is almost fully met in both scenarios, reaching a coverage of 99.9%. However, there is a significant difference between the two scenarios regarding energy coverage, which corresponds to coverage rates of 73% and 79%, respectively. From an economic perspective, the marginal selling price of electricity is EUR/MWh 100 and the cost of desalinated water ranges from EUR/m3 0.48 to 0.91 depending on the operating scenario. Overall, the results demonstrate nearly complete water autonomy in both scenarios, whereas the second scenario is proven optimal in terms of energy coverage. This approach proves that integrated water and energy management can lower fossil fuel use and improve sustainability on islands with strong seasonal variations.
1. Introduction
The global transition toward renewable energy has intensified the need for reliable and efficient systems capable of meeting both water and energy demands; this becomes even more evident in the case of isolated or insular regions [1]. Climate change further exacerbates these challenges as it alters precipitation patterns, increases temperature and evaporation rates, and intensifies drought events [2]. All of these phenomena directly influence water availability and energy demand [3]. Islands often face distinct challenges due to their geographical isolation [4], limited natural resources [5], and high dependence on imported fossil fuels [6]. These particular characteristics, combined with seasonal variations in population and consumption [7], create instability in the supply of both electricity and water [8]. Moreover, increasing water pollution from untreated wastewater, agricultural runoff, and coastal contamination further deteriorates freshwater quality [9], making sustainable water management even more complex for insular regions [10].
Tourism is one of the most influential factors affecting both water and energy balance on Greek islands [11]. During the summer months, the populations of many islands increase several times compared to those of winter months, driven by intense tourist activity [12]. This sharp seasonal variation leads to sudden peaks in electricity consumption and freshwater demand, mainly from hotels, restaurants, transportation, and hospitality facilities [13]. Such fluctuations create severe pressure on the local infrastructure, often resulting in water shortages, increased operational costs, and dependence on fossil-fueled power generation [14]. Moreover, the simultaneous growth of tourism and desalination demands that the interconnection between the water and energy sectors be amplified, thereby highlighting the importance of integrated solutions [15]. The development of renewable energy systems that can adapt to these seasonal variations will offer a sustainable pathway toward water and energy autonomy for insular regions [16].
Several recent studies have demonstrated the technical and environmental advantages of combining wind power, desalination, and pumped-hydro storage to achieve water–energy autonomy. For instance, Kiehbadroudinezhad et al. [17] showed that combining a wind turbine with a battery system to power seawater reverse osmosis will result in the lowest environmental footprint: by emitting only around 0.143 kg CO2/m3 of desalinated water, it produces approximately 90% less CO2/m3 than conventional diesel-based desalination systems. Babatunde et al. [18] analyzed various energy configurations for a university in Nigeria; they found that the solar–diesel–battery combination was the most economical option, achieving a cost of USD/MWh 139, a 71% share of renewable energy, and an annual reduction in CO2 of 108 tons compared to a diesel-only generation system. Mendez-Morales et al. [19] proposed a modular floating energy island for Crete that combines offshore wind turbines with solar panels, selecting an eastern offshore area based on two criteria, namely energy potential and environmental suitability. The study also defines storage and grid-connection requirements, suggesting a realistic approach toward achieving energy self-sufficiency and enabling electricity exports. Skroufouta et al. [20] studied a practical framework for Karystos that combines wind power with a seawater-based pumped-storage hydropower scheme and a reverse osmosis desalination plant (consisting of nine 3.5 MW wind turbines totaling 31.5 MW, a desalination capacity of 9600 m3/day, a 100,000 m3 freshwater tank, 9 MW pumps, and a 1.7 hm3 upper reservoir). The scheme demonstrated approximately 99% reliability for drinking water, coverage of irrigation needs at a rate of 63%, and coverage of electricity demand at 86%; about one-third of the energy supply came from seawater pumped-storage through the use of surplus wind. Papathanasiou et al. [21] compared hydro-pumped storage versus green hydrogen within a wind-powered system with desalination on Kefalonia, finding hydro-pumped storage more efficient (67% vs. 33%), with both scenarios achieving 99.9% coverage for drinking water; however, hydro-pumped storage rendered slightly higher results in terms of irrigation reliability (80.2% vs. 79.4%) and electricity coverage (77.8% vs. 76.0%) from 250,232 MWh/year of wind generation by 19 turbines. Agapitidou et al. [22] evaluated a renewable system for Lemnos combining wind power, desalination, and two storage options, namely pumped hydro and hydrogen. Using 27.5 MW of wind, a 1175 m3/day desalination plant, and a 490,000 m3 tank, both scenarios achieved about 99.9% drinking water coverage and 66% irrigation reliability. Electricity coverage reached 91% with pumped storage and 57% with hydrogen, respectively, thus proving the hydro option to be a more stable option, though hydrogen performed better in years when over 60,000 MWh of surplus wind energy was available.
Although several studies have examined renewable energy systems, research focusing specifically on islands with strong seasonal tourism, such as Mykonos, is still limited. The island’s sharp fluctuations in population and demand create unique challenges that differ from other regions where more stable conditions are present. This research study aims to fill this gap by developing and evaluating a renewable energy system for Mykonos that combines wind energy, desalination, and pumped-hydro storage. The system is designed to evaluate two operational scenarios that differ in the way in which excess wind energy is allocated, either directing it first to pumped-hydro storage or directly to the generation of electricity. This structure allows for the identification of the most effective way to meet both water and electricity needs. In addition, an economic analysis is performed to assess investment requirements and the marginal costs of water and electricity under different scenarios, providing insight into the financial feasibility of each approach.
The novelty of this research study lies in the development of an integrated water–energy management framework that examines how different operational priorities between desalination, energy supply, and pumped-hydro storage affect system performance under strong seasonal demand variations. Rather than focusing solely on a single configuration, this study compares alternative prioritization strategies and quantifies their impact on water coverage, energy coverage, and storage behavior throughout the year. Although Mykonos is used as a case study, the proposed approach is transferable to other insular systems that are faced with similar seasonal tourism-driven demand patterns and can, consequently, support planning and decision-making for renewable-based water–energy systems.
2. Materials and Methods
Located in Greece, Mykonos (37°24′–37°30′ N, 25°17′–25°30′ E) is an island in the Aegean Sea and part of the Cyclades complex (Figure 1). Its capital, Chora, lies on the western side of the island. According to the 2021 Census of the Hellenic Statistical Authority [23], Mykonos has a population of 10,704 permanent residents. The island covers an area of 86 km2 and has a coastline of about 89 km [24]. The port of Mykonos is located 117 km from Piraeus, the main port of Greece. Nearby islands include Tinos (9 km), Syros (29 km), Paros (28 km), and Naxos (26 km).
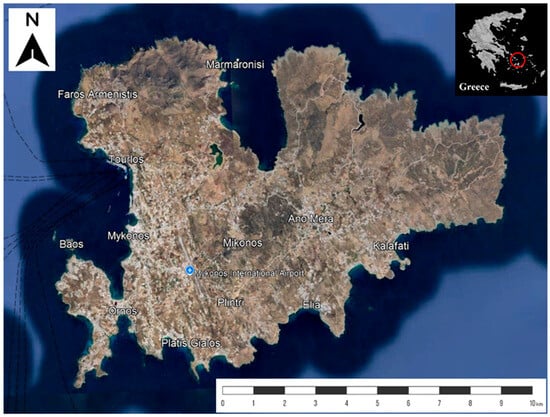
Figure 1.
A map of Mykonos showing its location within Greece. The red circle indicates the position of Mykonos in the Greek territory (image created by the authors based on Google Maps).
Mykonos is a particularly interesting study area for the renewable energy system due to its strong seasonal variation in visitor numbers [25]. While the island has a permanent population of 10,704 residents, it receives over 2,000,000 tourists during a six-month period (excluding cruise passengers). Cruise tourism contributes an additional 800,000 visitors. As a result, sharp fluctuations in water and electricity demand become evident on the island throughout the year.
Water and electricity demand on Mykonos is expected to remain seasonal and increase further in peak summer months, as tourism activity evolves. The present research study is based on current demand conditions and is presented as a baseline for interpreting system performance under pronounced seasonality.
The main source of water in Mykonos is groundwater extracted from wells and submarine springs. However, declining rainfall combined with increasing consumption has made these resources insufficient when it comes to meeting demand. As a result of the above phenomena, seawater intrusion has occurred in several wells, leading to a deterioration in groundwater quality [26].
According to the Municipal Water Supply and Sewerage Company of Mykonos [27], daily water consumption on the island reaches a maximum of 14,000 m3. Considering distribution losses at a rate of 20–30%, it can be assumed that approximately 2800–4200 m3 of water are lost each day during the summer months. The annual water demand of Mykonos is estimated to be a total of 4,218,250 m3.
The energy needs of Mykonos are primarily met through the Interconnected System of the Cyclades, which connects the island to Greece’s mainland grid, thereby ensuring power supply during periods of peak demand, particularly during the summer [28]. Tourism growth has greatly increased consumption from hotels, restaurants, and other facilities, making reliable energy supply a vital factor for the island’s economy and reputation [29]. In addition to the Interconnected System, Mykonos possesses a 55 MW oil-fired power plant that is operated and serves as backup during periods of high demand or in cases of grid failure. However, dependence on imported fuel is both expensive and environmentally taxing [30], requiring about 30 shipments per year. The island’s annual electricity demand of 264,062 MWh highlights the need for greater energy autonomy and efficient management of resources. The electricity demand also accounts for the energy requirements that stem from electric vehicle usage. The calculations for the number of vehicles were based on the National Energy and Climate Plan of Greece [31].
In the proposed renewable energy system, wind turbines generate electricity, desalination units convert seawater into freshwater to meet demand on the island, and pumped-hydro storage stores excess energy for later use. When renewable production exceeds demand, surplus electricity is used to pump water to an upper reservoir, which is later released to generate power during low-wind or high-demand periods. This integrated configuration enhances system flexibility and ensures a stable supply of both electricity and water throughout the year.
The renewable energy system in Mykonos consists of 22 wind turbines, each rated at 2.3 MW, providing a total installed capacity of 50.6 MW. The number of turbines was selected so that the annual wind energy production would correspond to 1.2 times the annual electricity demand on the island. This approach accounts for seasonal demand peaks, low wind periods, and energy losses, ensuring reliable operation throughout the year [32]. Wind energy production was estimated using recorded wind speed data and the manufacturer’s power curve. Since wind speeds were measured at a meteorological station located at a 13 m altitude, they were adjusted to the turbines’ hub height of 138 m to ensure accurate calculations of energy. The wind speed at the turbine hub height was calculated by converting the measured wind speed from the meteorological station with the application of Equation (1) [33]:
where V (m/s) represents the wind speed at height y (138 m), V0 (m/s) represents the wind speed at height y0 (13 m), and n (0.20) represents the Manning coefficient, which varies depending on the surface roughness (natural terrain) at the installation site.
V/V0 = (y/y0)n,
Wind energy production was calculated using the wind turbines’ power curve. Equation (2) provides a numerical approximation of the power curve used in the simulation for wind speeds of 2–16 m/s. For wind speeds below 2 m/s, the wind turbine is not in operation. For wind speeds between 16 and 25 m/s, it operates at its rated power of 2.3 MW, while for wind speeds above 25 m/s, it shuts down. Equation (2) is defined as follows:
where V (m/s) is the wind speed at the turbine hub height, and Ewind is the wind energy production (MWh) over the time step.
Ewind = (0.005∙V6 − 0.2379∙V5 + 4.0136∙V4 − 29.972∙V3 + 117.54∙V2 − 204.77∙V + 116.03)/1000,
A historical multi-year time series (2015–2024) from the Hellenic National Meteorological Service was used for the simulation, processed at a three-hour time step to ensure consistency between renewable generation, desalination operation, and storage dynamics. Although the full historical dataset was simulated, the presented results correspond to an average representative year derived from the long-term series.
To meet the island’s water needs, the system includes 4 desalination units that employ reverse osmosis technology; this specific technology was selected for its high efficiency and suitability for island conditions [34], rendering a total production capacity of 1400 m3 per hour. The average energy consumption is equal to 3.5 kWh/m3 [32], corresponding to a total power demand of 4.5–5.0 MW. Additionally, two pumps with a combined power of 60 kW were used in order to transfer the freshwater produced from the desalination units to the storage and distribution network. Reverse osmosis was assumed to operate with a seawater recovery ratio of 50%, thereby generating an equivalent brine fraction [35]. Brine was then considered discharged to the marine environment by means of an engineered outfall, in accordance with standard operational practices regarding seawater desalination plants [36].
For the pumped-hydro storage system, 4 pumps with a total installed capacity of 2.2 MW (0.8 pump efficiency) are used to transfer desalinated freshwater into two reservoirs with a combined storage volume of 3,900,000 m3; these are located about 40 m above sea level. The system also includes two hydropower stations with discharge capacities of 20 m3/s and 40 m3/s, respectively; these are positioned downstream of the Ano Mera and Marathio dams, respectively. The pumped-hydro components (pumps, reservoirs, and turbines) operate with desalinated freshwater. The pumped-hydro storage dimensions were selected based on existing reservoirs on the island, reflecting both their availability in storage volume and elevation difference.
Equation (3) was used to calculate the power from the hydro-turbine [37]:
where ρ is the water density (1000 kg/m3), g is the gravitational acceleration (9.81 m/s2, Q is the flow rate (m3/s), H is the effective head (m), η is the turbine efficiency (0.85), and P is the generated power (W). Τhe overall round-trip efficiency of the pumped-hydro storage system is 68%.
P = ρ × g × Q × H × n,
The daily water demand in Mykonos was estimated using monthly population data in conjunction with an assumed daily consumption of 250 L per capita [38,39]. Electricity demand was similarly calculated based on monthly population variations and an average daily use of 2.5–3.5 kWh per capita [40]; these numbers reflect daily activities and an increase in the use of appliances during the summer tourist season [41].
Two operational scenarios were developed for the assessment of the renewable energy system. In the first scenario, priority was assigned to water production through desalination, followed by pumped-hydro storage, while electricity demand was given last priority, considered only if excess energy remained. In the second scenario, desalination is again prioritized, followed by electricity demand, and any remaining energy is directed to pumped-hydro storage.
The operational structure of the two scenarios is summarized in Figure 2, clearly illustrating the sequence in which available wind energy is allocated to desalination, electricity demand, and pumped-hydro storage. This visual representation assists in highlighting the key differences in priority-setting between Scenario 1 and Scenario 2.

Figure 2.
A flowchart illustrating the operational priorities of the two scenarios. Arrows indicate the energy allocation sequence.
During manuscript preparation, Grammarly v. 2025 was applied in grammatical and syntax contexts to ensure the accurate presentation of the findings and to facilitate readability.
3. Results and Discussion
The simulation of the renewable energy system for Mykonos was performed under two operational scenarios, with both prioritizing water production through desalination; however, their difference lies in how the remaining renewable energy is allocated, namely either to storage or to electricity generation. The aim was to evaluate how the allocation of renewable energy affects the island’s ability to meet its annual water needs.
The simulations were executed with the application of a multi-year dataset; however, given the fact that no significant interannual variations were recorded in the key performance indicators, the results described in the following sections correspond to a representative average year.
Table 1 presents the coverage rates and total quantities of water and energy supplied under the two examined scenarios. In Scenario 1, where desalination is prioritized, water coverage is nearly total (99.9%), amounting to 4,218,250 m3, whereas energy coverage, treated as the lowest priority, is met at a lower rate of 73% (191,657 MWh). In Scenario 2, energy coverage, being a second priority, amounts to 79%, while water demand coverage, as a primary priority, reaches 99.9%, as in Scenario 1. The total energy coverage amounts to 209,586 MWh, while water coverage reaches 4,218,250 m3. It is important to note that desalination represents a major share of the system’s energy consumption, requiring 14,764 MWh per year (3.5 kWh/m3 for the annual production of 4,218,250 m3).

Table 1.
The water and energy demand coverage rates and quantities under the two scenarios.
Comparing the two scenarios, it is observed that both achieve full coverage in water demand (99.9%). However, energy coverage is notably higher in Scenario 2 (79%) compared to Scenario 1 (73%), indicating that Scenario 2 provides a more balanced and efficient use of available energy resources.
Seasonal fluctuation of the reservoir water level is illustrated in Figure 3 for Scenario 1. The water volume available stays consistently high throughout the year, with only minor fluctuations, thereby indicating more efficient management of water resources. This stability results from prioritizing desalination for meeting water demand, ensuring continuous supply even during the summer peak. As a result, the risk of reservoir depletion is eliminated, highlighting the effectiveness of water-focused operation under seasonal variability.
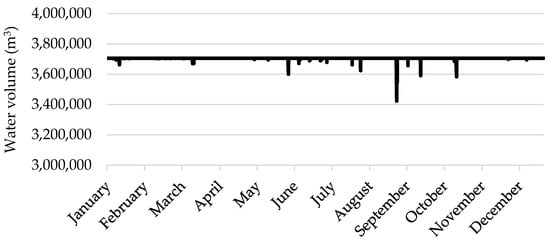
Figure 3.
Seasonal variation in the reservoir water volume for the first scenario (m3).
In Figure 4, which depicts Scenario 2, the reservoir level demonstrates significant fluctuations throughout the year, indicating active use of the storage system. At the beginning of the period, the level remains high, close to the maximum allowable volume of 3,500,000 m3 (90% of the total capacity). However, as the summer months approach, a sharp decline in the reservoir level is observed.
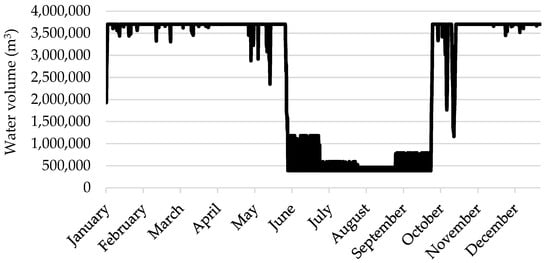
Figure 4.
Seasonal variation in the reservoir water volume for the second scenario (m3).
Between the two scenarios, notable differences can be observed in the fluctuation of reservoir water levels and, consequently, in the management of stored water. In Scenario 1, the level remains high and stable throughout the year, reflecting limited use of the stored water; this occurs due to the reduced production of energy and the prioritization of desalination. In Scenario 2, the reservoir level takes a sharp plunge during the summer months due to increased water demand and production of hydropower, reaching significantly low levels before gradually recovering towards the end of the year. Overall, the comparison of the two scenarios highlights how management priorities strongly influence the seasonal dynamics of the reservoir, as well as the sustainability of water storage throughout the year.
Figure 5 illustrates the production of hydroelectric energy by means of the turbine. Both scenarios are depicted over a period of a year. In Scenario 1, periods of hydropower generation are relatively limited, as the system prioritizes the preservation of water storage rather than the production of electricity by means of the turbine. The system mainly operates by prioritizing the provision of the amount of electricity required for desalination; this explains the overall stability of the reservoir level. Nevertheless, a few minor peaks in hydroelectric generation can be observed during the summer period, reaching up to 200 MWh. These short-lived increases occur when a surplus in renewable energy becomes available, ensuring continuity in electricity and water supply during periods of higher demand. The annual hydroelectric production in Scenario 1 amounts to a total of 194 MWh.
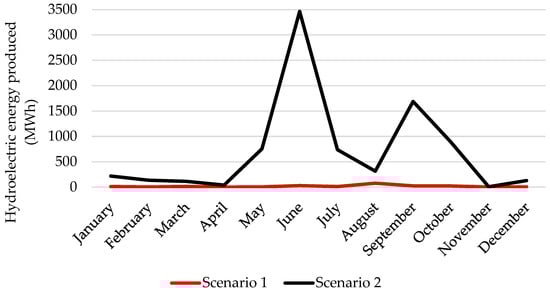
Figure 5.
Monthly hydroelectric energy production from the turbine under the two scenarios (MWh).
In Scenario 2, two major peaks are observed: one at approximately 3500 MWh in June and another at 1500 MWh in September. High production during the summer months coincides with increased demand both for water and electricity; this justifies the significant reduction in the level of the reservoir. Towards the end of the year, production decreases sharply, and the reservoir volume is restored as energy requirements decline. The annual hydroelectric production in Scenario 2 amounts to a total of 8484 MWh.
Within the framework of the pump and turbine efficiencies adopted, the round-trip efficiency of the pump-hydro system amounts to 68%; concurrently, hydrogen-based energy storage reaches a lower overall efficiency of 33%, as described in the literature [21]. An island research study, comparable to the present one, has been reported for Gran Canaria: in that study, seawater reverse osmosis desalination is used to maintain the water volumes required for pumped storage operation in the reservoir [4]. The paper offers additional context for linking desalination with storage in island systems, particularly when reservoir levels can affect long-term operation.
With the baseline input in mind, Scenario 2 appears to be a more favorable option; however, the comparison is heavily influenced by factors that can change from year to year on tourism-dependent islands. Annual water demand may increase during peak tourist months, while wind conditions can be weaker for some years, thereby reducing renewable electricity production and affecting system performance. In order to test the stability of the results under such changes, a two-factor sensitivity analysis was carried out by (i) gradually increasing annual water demand by 5%, 10%, 15%, and 20% and (ii) decreasing wind availability by 5%, 10%, 15%, and 20%. For each case, both scenarios were re-simulated and water and energy coverage were recalculated using the same definitions used in the baseline analysis. The results are summarized in Table 2, presenting a clear comparison of both scenarios across a realistic range of demand growth and wind-resource reduction.
Table 2.
Two-factor sensitivity analysis of Scenario 1 and Scenario 2 under conditions of increasing annual water demand (+5%, +10%, +15%, +20%) and decreasing wind availability (−5%, −10%, −15%, −20%), presenting the resulting water and energy coverage.
Across the tested conditions, water coverage remains nearly complete for both scenarios; this reflects the fact that operating priority is given to desalination. In contrast, energy coverage is more sensitive to the input changes: increasing water demand slightly reduces energy coverage, as a greater amount of renewable electricity is redirected to meet the higher water-related load. Concurrently, reduced wind availability leads to a clearer decline in energy coverage due to the lower generation of renewable electricity. Scenario 2 maintains higher energy coverage than Scenario 1 in all cases, indicating greater robustness in dealing with demand growth and weaker wind years. As wind availability decreases, the difference between the two scenarios becomes more pronounced.
A cost–benefit analysis is carried out to evaluate both the investment and operational expenses of the system. The analysis also determines the marginal selling prices of desalinated water and electricity. The costs of supply and equipment for the renewable energy system are calculated at EUR 15,000,000. Additionally, the costs associated with the operation and maintenance of the renewable energy system are estimated at EUR 800,000 on an annual basis. The payback period for the project is estimated at 10 years. Within this period, the overall installation and operation expenses amount to EUR 23,000,000. The cost assumptions are derived from previous techno-economic studies of similar renewable energy projects [42,43]. The total capital investment and annual operational costs were disaggregated by system components, as shown in Table 3 and Table 4.
Table 3.
A breakdown of total capital investment across the main components of the system.
Table 4.
A breakdown of annual operational costs for the renewable energy system.
Revenue is obtained from the sale of both desalinated water and electricity. The annual production of desalinated water is 4,218,250 m3 for Scenario 1 and 4,218,250 m3 for Scenario 2. Regarding electricity, production amounts to 191,657 MWh for Scenario 1 and 209,586 MWh for Scenario 2.
The marginal selling prices of desalinated water and electricity were estimated based on the production data. Of the two scenarios, Scenario 1 presents the highest marginal price for desalinated water (EUR/m3 0.91), while Scenario 2 yields the lowest one (EUR/m3 0.48). This indicates a significant variation in economic performance that is clearly dependent on the system configuration. The electricity selling price was assumed to vary around a representative mean value of EUR/MWh 100, which reflects typical market conditions for island electricity systems [44]. Nonetheless, water prices vary because of fluctuations in levels of water production. The estimated marginal price of water is EUR/m3 0.91 for Scenario 1 and EUR/m3 0.48 for Scenario 2. Table 5 presents the marginal selling prices of desalinated water and electrical energy for both operational scenarios.
Table 5.
The marginal selling prices of desalinated water and electrical energy under the two operational scenarios.
The difference in water price between the two scenarios arises from the fact that Scenario 2 generates more electrical energy; this increases total revenue and allows for a more efficient distribution of the fixed investment and operational costs of the renewable energy system. As a result, the marginal price of desalinated water decreases, even though annual water production remains stable.
Similar studies on small islands report comparable costs for renewable-powered reverse osmosis desalination. Escoto and Abundo [34] examined a solar photovoltaic-grid system and reported an electricity cost of USD/kWh 0.21 and a water cost of USD/m3 2.02; this outcome provides a reference point used for the interpretation of the economic performance of the present research study.
The proposed approach can be applied to other tourism-dependent islands with strong summer peaks in water and electricity demand. For a new island, the same workflow and priority rules can be used, while wind capacity, desalination capacity, and storage size can be adjusted to match local demand and wind data. Transferability is highest where desalination is needed and suitable storage infrastructure (that is, existing reservoirs or feasible sites with sufficient head) is available.
4. Conclusions
The research study assesses a renewable energy system that integrates wind power, desalination, and pumped-hydro storage with a view to addressing both water and electricity needs on Mykonos, an island experiencing pronounced seasonal fluctuations due to tourism. Two operational scenarios were developed, both prioritizing water production through desalination; they are different, however, in how they allocate the remaining renewable energy: either towards storage or directly towards the generation of electricity. The analysis of these scenarios demonstrated that system reliability and resource efficiency can be significantly enhanced through the alignment of water and energy planning within a single framework. The results highlight that both scenarios fully meet water demand, while the second scenario achieves higher energy coverage, offering the most efficient and sustainable performance overall. In summary, the findings confirm that renewable energy systems can effectively reduce fossil fuel dependence, optimize resource allocation, and strengthen resilience in insular environments that are faced with strong seasonal demand variations.
The comparison of the two scenarios highlights how different management strategies affect the energy performance of the system. In both scenarios, water production through desalination is given first priority, ensuring almost complete satisfaction of water demand (99.9%). However, the way excess renewable energy is utilized leads to notable differences in energy performance. Specifically, in Scenario 1, energy coverage reaches 73%, while in Scenario 2 it is more pronounced, reaching a rate of 79%. This indicates a more efficient use of available resources. Overall, both configurations achieve water autonomy, with Scenario 2 yielding higher energy efficiency and more balanced operation throughout the year.
The analysis of reservoir water levels demonstrates notable differences between the two scenarios. In Scenario 1, the reservoir remains high and relatively stable throughout the year, since water production is prioritized and only limited amounts are used for hydropower generation. In Scenario 2, the reservoir level fluctuates more noticeably, with a clear decrease during the summer months; this can be explained by increased energy generation and water demand during this period. This pattern indicates that stored water is actively utilized to support both water and energy needs and, therefore, demonstrates the more flexible and dynamic operation of the system.
The comparison of hydroelectric production reveals distinct differences between the two scenarios. In Scenario 1, hydroelectric generation is very limited, as the system mainly supplies the electricity required for desalination, resulting in an annual output of only 194 MWh. In Scenario 2, however, production is significantly higher, with two major peaks of around 3500 MWh in June and 1500 MWh in September, reaching an annual output of 8484 MWh in total. These results demonstrate how the different allocation of renewable energy affects system behavior. Scenario 2 utilizes stored water more effectively in balancing electricity generation and water supply.
From an economic perspective, the renewable energy system requires a total investment of EUR 23,000,000, including operation costs, with a payback period of 10 years. The marginal selling price of electricity is EUR/MWh 100, while the price of desalinated water varies between the two scenarios. In Scenario 1, the marginal price of water reaches EUR/m3 0.91, whereas in Scenario 2 it decreases to EUR/m3 0.48, indicating a more cost-efficient configuration. These results highlight that economic performance is heavily influenced by priorities in the allocation of renewable energy, with the second scenario offering the most balanced and efficient outcome.
In addition to the case of Mykonos, the same framework can support planning on other islands that are characterized by seasonal tourism-driven demand. Applying it requires local wind and demand time series and the re-sizing of desalination and storage to match summer peaks.
Future research will focus on including climate change scenarios in order to study how changes in wind, solar energy, and water availability can affect the performance of the renewable energy system. A comparative analysis of different energy storage options, such as batteries, hydrogen, and pumped-hydro systems, will help to identify which technologies are most effective for long-term sustainability. Furthermore, the application of the same approach to other islands with different sizes, climates, and resource conditions will make the results more useful and adaptable, helping to design better strategies for achieving water and energy independence.
Author Contributions
Conceptualization, I.P., A.-F.P. and E.B.; methodology, I.P.; software, I.P.; validation, E.B.; formal analysis, I.P.; investigation, I.P.; resources, I.P.; data curation, I.P.; writing—original draft preparation, A.-F.P.; writing—review and editing, A.-F.P., I.P. and E.B.; visualization, I.P.; supervision, E.B.; project administration, E.B. All authors have read and agreed to the published version of the manuscript.
Funding
This research received no external funding.
Data Availability Statement
Data that support the findings of this study are not publicly available due to restrictions applied to them, which means they can be used only for research purposes. However, they are available from the authors upon reasonable request and with the permission of the services provided to them.
Acknowledgments
During the preparation of this manuscript, the authors used “Grammarly v. 2025” for the purposes of ensuring the grammatical and linguistic accuracy of the author’s original work. The authors have reviewed and edited the output and take full responsibility for the content of this publication.
Conflicts of Interest
The authors declare no conflicts of interest.
References
- Bertsiou, M.M.; Baltas, E. Integration of Different Storage Technologies towards Sustainable Development—A Case Study in a Greek Island. Wind 2024, 4, 68–89. [Google Scholar] [CrossRef]
- Rahmati, O.; Melesse, A.M.; Naghibi, A. Water Scarcity Crisis: Overview of Challenges and Solutions. In Water Scarcity Management; Elsevier: Amsterdam, The Netherlands, 2026; pp. 1–12. [Google Scholar] [CrossRef]
- Fulazzaky, M.A.; Syafiuddin, A.; Muda, K.; Martin, A.Y.; Yusop, Z.; Ghani, N.H.A. A Review of the Management of Water Resources in Malaysia Facing Climate Change. Environ. Sci. Pollut. Res. 2023, 30, 121865–121880. [Google Scholar] [CrossRef]
- Lozano Medina, J.C.; Mendieta Pino, C.A.; Ramos Martín, A.; León Zerpa, F. A Case Study of a Reverse Osmosis Based Pumped Energy Storage Plant in Canary Islands. Water 2024, 16, 515. [Google Scholar] [CrossRef]
- Vozinaki, A.-E.K.; Anyfanti, I.V.; Karatzas, G.P.; Varouchakis, E.A.; Ceseracciu, C.; Branca, G.; Deriu, R.; Roggero, P.P.; Cetinkaya, I.D.; Aydın, C.İ.; et al. Sustainable Water Governance: Insights from Living Lab Experiences. Water Resour. Manag. 2025, 40, 10. [Google Scholar] [CrossRef]
- Arévalo, P.; Ochoa-Correa, D.; Villa-Ávila, E.; Espinoza, J.L.; Albornoz, E. Decarbonizing Insular Energy Systems: A Literature Review of Practical Strategies for Replacing Fossil Fuels with Renewable Energy Sources. Fuels 2025, 6, 12. [Google Scholar] [CrossRef]
- Mamand, B.S.; Yashooa, N.K.; Ali, B.A.; Mawlood, D.K. The Study of Groundwater Level Fluctuations in the Central Sub-Basin of Erbil-Northern Iraq. Environ. Earth Sci. 2025, 85, 27. [Google Scholar] [CrossRef]
- Myronidis, D.; Nikolaos, T. Changes in Climatic Patterns and Tourism and Their Concomitant Effect on Drinking Water Transfers into the Region of South Aegean, Greece. Stoch. Environ. Res. Risk Assess. 2021, 35, 1725–1739. [Google Scholar] [CrossRef]
- Reshmi, N.; Awasthi, M.P.; Bohara, R.; Saqr, A.M.; Đurin, B.; Cetl, V.; Pant, R.R.; Thapa, L.B.; Chettri, M.K. Hydrochemical Dynamics and Pollution Regimes in Satyawati Lake, Nepal: Implications for Water Quality and Sustainable Management. Int. J. Energ. Water Res. 2025, 10, 10. [Google Scholar] [CrossRef]
- Wulandari, R.; Iswara, A.P.; Qadafi, M.; Prayogo, W.; Astuti, R.D.P.; Utami, R.R.; Jayanti, M.; Awfa, D.; Suryawan, I.W.K.; Fitria, L.; et al. Water Pollution and Sanitation in Indonesia: A Review on Water Quality, Health and Environmental Impacts, Management, and Future Challenges. Environ. Sci. Pollut. Res. 2024, 31, 65967–65992. [Google Scholar] [CrossRef]
- Superchi, F.; Bianchini, A.; Moustakis, A.; Pechlivanoglou, G. Towards Sustainable Energy Independence: A Case Study of Green Hydrogen as Seasonal Storage Integration in a Small Island. Renew. Energy 2025, 245, 122813. [Google Scholar] [CrossRef]
- Skrimizea, E.; Parra, C. Social-Ecological Dynamics and Water Stress in Tourist Islands: The Case of Rhodes, Greece. J. Sustain. Tour. 2019, 27, 1438–1456. [Google Scholar] [CrossRef]
- Jahangir, M.H.; Mousavi, S.A.; Asayesh Zarchi, R. Implementing Single- and Multi-Year Sensitivity Analyses to Propose Several Feasible Solutions for Meeting the Electricity Demand in Large-Scale Tourism Sectors Applying Renewable Systems. Environ. Dev. Sustain. 2021, 23, 14494–14527. [Google Scholar] [CrossRef]
- Liao, X.W.; Hall, J.W.; Hanasaki, N.; Lim, W.H.; Paltan, H. Water Shortage Risks for China’s Coal Power Plants under Climate Change. Environ. Res. Lett. 2021, 16, 044011. [Google Scholar] [CrossRef]
- Papathanasiou, A.-F.; Bertsiou, M.M.; Baltas, E. Pumped-Storage Hydropower and Hydrogen Storage for Meeting Water and Energy Demand through a Hybrid Renewable Energy System. Euro-Mediterr. J. Environ. Integr. 2024, 9, 1471–1483. [Google Scholar] [CrossRef]
- Tsiaras, E.; Andreosatou, Z.; Kouveli, A.; Tampekis, S.; Coutelieris, F.A. Off-Grid Methodology for Sustainable Electricity in Medium-Sized Settlements: The Case of Nisyros Island. Clean Technol. 2025, 7, 16. [Google Scholar] [CrossRef]
- Kiehbadroudinezhad, M.; Merabet, A.; Hosseinzadeh-Bandbafha, H.; Ghenai, C. Environmental Assessment of Optimized Renewable Energy-Based Microgrids Integrated Desalination Plant: Considering Human Health, Ecosystem Quality, Climate Change, and Resources. Environ. Sci. Pollut. Res. 2023, 30, 29888–29908. [Google Scholar] [CrossRef]
- Babatunde, O.; Denwigwe, I.; Oyebode, O.; Ighravwe, D.; Ohiaeri, A.; Babatunde, D. Assessing the Use of Hybrid Renewable Energy System with Battery Storage for Power Generation in a University in Nigeria. Environ. Sci. Pollut. Res. 2022, 29, 4291–4310. [Google Scholar] [CrossRef]
- Mendez-Morales, M.; Karipoglu, F.; Ivanković, M.; Lukić, T.; Rebelo, C. Transforming Crete’s Sustainable Energy Landscape: A Modular Energy Island Approach. Int. J. Energy Res. 2025, 2025, 2363366. [Google Scholar] [CrossRef]
- Skroufouta, S.; Mavrogiannis, A.; Baltas, E. A Methodological Framework for the Development of a Hybrid Renewable Energy System with Seawater Pumped Storage Hydropower System under Uncertainty in Karystos, Greece. Sustain. Energy Technol. Assess. 2024, 71, 104002. [Google Scholar] [CrossRef]
- Papathanasiou, A.-F.; Pasaniotis, G.; Baltas, E. Comparison of Hydro-Pumped and Green Hydrogen as Energy Storage Processes: A Case Study on Kefalonia Island, Greece. Sustain. Chem. Pharm. 2025, 48, 102216. [Google Scholar] [CrossRef]
- Agapitidou, A.-A.; Skroufouta, S.; Baltas, E. Methodology for the Development of Hybrid Renewable Energy Systems (HRES) with Pumped Storage and Hydrogen Production on Lemnos Island. Earth 2022, 3, 537–556. [Google Scholar] [CrossRef]
- Hellenic Statistical Authority. Available online: https://www.statistics.gr/en/home/ (accessed on 9 December 2025).
- Nasioula, A.; Kosmopoulos, P.G. Energy Autonomy Scenario for the Island of Mykonos in Greece with Solar Power Plants. Environ. Sci. Proc. 2023, 26, 10. [Google Scholar] [CrossRef]
- Ntalakos, A.; Skagias, K.; Belias, D.; Rossidis, I. Navigating Sustainable Features: A Comparative Analysis of Sustainable Tourism in Santorini, Mykonos, and Paros. Tour. Hosp. 2025, 6, 183. [Google Scholar] [CrossRef]
- Atay, I.; Saladié, Ò. Water Scarcity and Climate Change in Mykonos (Greece): The Perceptions of the Hospitality Stakeholders. Tour. Hosp. 2022, 3, 765–787. [Google Scholar] [CrossRef]
- Public Water Supply and Sewerage Company of Mykonos. (In Greek). Available online: https://deyam.gr/ (accessed on 9 December 2025).
- Karystianos, M.E.; Pitas, C.N.; Efstathiou, S.P.; Tsili, M.A.; Mantzaris, J.C.; Leonidaki, E.A.; Voumvoulakis, E.M.; Sakellaridis, N.G. Planning of Aegean Archipelago Interconnections to the Continental Power System of Greece. Energies 2021, 14, 3818. [Google Scholar] [CrossRef]
- Economou, A. Renewable Energy Resources and Sustainable Development in Mykonos (Greece). Renew. Sustain. Energy Rev. 2010, 14, 1496–1501. [Google Scholar] [CrossRef]
- Katsaprakakis, D.A.; Dakanali, E.; Dimopoulos, A.; Gyllis, Y. Energy Transition on Sifnos: An Approach to Economic and Social Transition and Development. Appl. Sci. 2022, 12, 2680. [Google Scholar] [CrossRef]
- National Energy and Climate Plan of Greece—European Commission. Available online: https://commission.europa.eu/publications/greece-final-updated-necp-2021-2030-submitted-2025_en (accessed on 9 December 2025).
- Papathanasiou, A.-F.; Baltas, E. Achieving Water and Energy Independence, Economic Sustainability, and CO2 Reduction Through Hybrid Renewable Systems: A Case Study of Skyros Island. Water 2025, 17, 1267. [Google Scholar] [CrossRef]
- Yang, H.; Chen, J.; Pang, X. Wind Turbine Optimization for Minimum Cost of Energy in Low Wind Speed Areas Considering Blade Length and Hub Height. Appl. Sci. 2018, 8, 1202. [Google Scholar] [CrossRef]
- Escoto, B.E.; Abundo, M.L.S. Evaluating the Feasibility and Sustainability of Renewable Energy Systems for Seawater Reverse Osmosis Desalination Application in Small Island Communities. Results Eng. 2025, 27, 106015. [Google Scholar] [CrossRef]
- Al-Addous, M.; Bdour, M.; Rabaiah, S.; Boubakri, A.; Schweimanns, N.; Barbana, N.; Wellmann, J. Innovations in Solar-Powered Desalination: A Comprehensive Review of Sustainable Solutions for Water Scarcity in the Middle East and North Africa (MENA) Region. Water 2024, 16, 1877. [Google Scholar] [CrossRef]
- Shalaby, S.M.; Sharshir, S.W.; Kabeel, A.E.; Kandeal, A.W.; Abosheiasha, H.F.; Abdelgaied, M.; Hamed, M.H.; Yang, N. Reverse Osmosis Desalination Systems Powered by Solar Energy: Preheating Techniques and Brine Disposal Challenges—A Detailed Review. Energy Convers. Manag. 2022, 251, 114971. [Google Scholar] [CrossRef]
- Acharya, N.; Kim, C.-G.; Thapa, B.; Lee, Y.-H. Numerical Analysis and Performance Enhancement of a Cross-Flow Hydro Turbine. Renew. Energy 2015, 80, 819–826. [Google Scholar] [CrossRef]
- Papathanasiou, A.-F.; Ntemiri, K.; Baltas, E. Sustainable Water Resources Management and Energy Production in Small Mediterranean Islands. Environ. Process. 2025, 12, 19. [Google Scholar] [CrossRef]
- Kyriakarakos, G.; Papadakis, G.; Karavitis, C.A. Renewable Energy Desalination for Island Communities: Status and Future Prospects in Greece. Sustainability 2022, 14, 8176. [Google Scholar] [CrossRef]
- Luo, J.; Zhuang, C.; Liu, J.; Lai, K. A Comprehensive Assessment Approach to Quantify the Energy and Economic Performance of Small-Scale Solar Homestay Hotel Systems. Energy Build. 2023, 279, 112675. [Google Scholar] [CrossRef]
- Ali, S.S.S.; Razman, M.R.; Awang, A.; Asyraf, M.R.M.; Ishak, M.R.; Ilyas, R.A.; Lawrence, R.J. Critical Determinants of Household Electricity Consumption in a Rapidly Growing City. Sustainability 2021, 13, 4441. [Google Scholar] [CrossRef]
- Kumar, N.; Karmakar, S. Techno-Economics of a Trigeneration HRES; a Step towards Sustainable Development. Renew. Energy 2022, 198, 833–840. [Google Scholar] [CrossRef]
- Wyszomierski, R.; Bórawski, P.; Bełdycka-Bórawska, A.; Brelik, A.; Wysokiński, M.; Wiluk, M. The Cost-Effectiveness of Renewable Energy Sources in the European Union’s Ecological Economic Framework. Sustainability 2025, 17, 4715. [Google Scholar] [CrossRef]
- Karapidakis, E.; Kalogerakis, C.; Pompodakis, E. Sustainable Power Generation Expansion in Island Systems with Extensive RES and Energy Storage. Inventions 2023, 8, 127. [Google Scholar] [CrossRef]
Disclaimer/Publisher’s Note: The statements, opinions and data contained in all publications are solely those of the individual author(s) and contributor(s) and not of MDPI and/or the editor(s). MDPI and/or the editor(s) disclaim responsibility for any injury to people or property resulting from any ideas, methods, instructions or products referred to in the content. |
© 2026 by the authors. Licensee MDPI, Basel, Switzerland. This article is an open access article distributed under the terms and conditions of the Creative Commons Attribution (CC BY) license.