Abstract
Designing robust drinking water treatment schemes for eutrophic sources requires shifting from considering each treatment step separately to considering the full treatment process as a connected system. This study evaluated how treatment configuration and arrangement influence microbial community dynamics, organic carbon removal, and biological stability in a full-scale drinking water treatment plant. A Dutch treatment plant was monitored, operating two parallel lines: one conventional (coagulation, sedimentation, and rapid sand filtration) and one advanced (ion exchange, ceramic microfiltration, and advanced oxidation), both converging into granular activated carbon (GAC) filtration. Microbial and chemical water quality was assessed across treatment stages and seasons. This plant experiences periods of discoloration, taste, and odor issues, and an exceedance of Aeromonas counts in the distribution network. Advanced oxidation achieved a high bacterial cell inactivation (~90%); however, it significantly increased assimilable organic carbon (AOC) (300–900% increase), challenging biological stability. GAC filtration partially reduced AOC levels (from 70 μg Ac-C/L to 12 μg Ac-C/L) but also supported dense (105 cells/mL) and diverse microbial communities (Shannon diversity index 5.83). Moreover, Gammaproteobacteria, which harbor opportunistic pathogens such as Aeromonas, persisted during the treatment. Archaea were highly sensitive to oxidative and physical stress, leading to reduced diversity downstream. Beta diversity analysis revealed that treatment configuration, rather than seasonality, governed the community composition. The findings highlight that treatment arrangement, oxidation, GAC operation, and organic and microbial loads critically influence biological stability. This study proposes integrated strategies to achieve resilient and biologically stable drinking water production when utilizing complex water sources such as eutrophic lakes.
1. Introduction
Drinking water treatment plants (DWTPs) sourcing from eutrophic lakes face increasing operational complexity due to elevated levels of algal biomass, natural organic matter (NOM), and microbial activity [1,2]. These source waters are characterized by seasonal variability, enhanced microbial and chemical reactivity, and a high potential of disinfection by-product (DBP) formation [3]. To meet regulatory and performance targets under such conditions, many utilities implement a sequence of higher-level treatment processes, including ultraviolet (UV) oxidation [4], activated carbon filtration [5], and membrane-based separation [6] for a more advanced removal of contaminants. However, the integration of these technologies into existing treatment trains often lacks a systems-level design approach, resulting in less optimal outcomes despite high-performance unit processes.
Performance-based evaluations such as percent removal, log reduction values, or DBP precursor mitigation remain the dominant approach for assessing drinking water treatment efficacy [7,8,9]. These metrics offer standardized comparisons and guide process optimization and regulatory compliance. However, this reductionist framework typically isolates unit processes from broader system context, limiting the understanding of cumulative effects and downstream interactions. Process steps are frequently assessed independently, without evaluating how their outputs influence the performance of subsequent stages [10]. This approach is particularly limiting in the context of complex or variable source waters, where non-linear and emergent behavior often arises within the treatment train.
Interdependencies between processes can significantly influence treatment performance. For example, upstream coagulation affects downstream filtration and UV disinfection by modifying particle size distributions and the composition of organic precursors [11,12]. Likewise, residual biological activity and organic fractions eluting from granular activated carbon (GAC) filters can influence microbial regrowth and disinfectant demand downstream [13]. These interactions are not only additive but system-determined, and their effects are increased when treating eutrophic waters due to the highly dynamic nature of the influent matrix [14].
Despite increasing awareness of process interactions, there is a need for studies that consider the cumulative performance of treatment technologies and the influence of treatment sequencing (e.g., the order in which treatment steps are arranged) within the overall system [15]. There is limited evidence from full-scale plants assessing how advanced and conventional treatment lines interact when operated in parallel and how flow integration points influence final water quality. Furthermore, few studies examine how microbial and organic matter are shaped not only by individual processes but by the sequence and structural configuration of the treatment train. This study addresses these gaps through a system-level evaluation of a dual-line DWTP treating eutrophic source water.
In several European countries, particularly in the Netherlands, Denmark, and parts of Germany, utilities intentionally avoid chlorination in the distribution systems to prevent the formation of disinfection by-products and to preserve the organoleptic quality of drinking water, relying instead on biologically stable treatment, continuous monitoring, and well-maintained infrastructure to ensure microbial safety [16]. Moreover, certain bacteria, including opportunistic pathogens, can exhibit resistance to chlorination or rapidly recover post-disinfection [17], further supporting the need for upstream biological stability rather than reliance on residual disinfectants.
Delivering biologically stable drinking water, especially in the absence of a disinfectant residual, remains a key objective for utilities treating challenging source waters. In this study, biological stability is defined as the extent to which treated water resists microbial regrowth during distribution, in the absence of a disinfectant residual.
To investigate these interactions, a full-scale DWTP operating two parallel treatment lines, a conventional train, and an advanced train designed to relieve the load on the UV oxidation unit, was examined. The drinking water is distributed without residual disinfectant. The distribution system supplied by the plant experiences systematic periods of non-compliance with the Dutch guidelines for Aeromonas levels (<1000 CFU/100 mL) during the summer season, as well as other microbial regrowth-related issues, such as sediment formation, causing customer complaints about turbid or brown waters. Although the advanced treatment demonstrated effective removal of microbial cells and organic matter, its influence on final water quality was constrained by its downstream blending with the conventional line prior to final polishing, limiting its distinct contribution to finished water quality. A multi-parametric approach combining organic matter fractionation, microbial cell quantification, and 16S rRNA-based community profiling was applied to characterize how treatment train configuration and sequencing affect contaminant removal and downstream microbial dynamics. The findings emphasize that treatment efficacy is shaped not only by individual unit performance but also by system-level integration and emergent interactions across the train.
2. Materials and Methods
2.1. Sampling Scheme
The drinking water treatment facility is located in Andijk, North Holland, The Netherlands (52° 44′ 43.77″ N, 5° 13′ 15.15″ E). The treatment scheme and sampling points are depicted in Figure 1. The facility takes raw water from a eutrophic lake, which has an average depth of approximately 5 m, and stores it in an open reservoir with a maximum depth of about 20 m for an average residence time of 28 days. Water is pumped into the reservoir from the upper layers of the lake and extracted at approximately 13–15 m of depth for treatment. The pH in the source water ranges seasonally between 8.0 and 8.8, and after NaOH dosing in the reservoir for softening, the pH increases to between 9.1 and 9.7, reducing water hardness from 1.6–2.5 mmol/L to 1.0–1.2 mmol/L. CO2 is added after the reservoir before the water enters the treatment facility, to neutralize excess alkalinity and stop the softening process. After the reservoir, the water passes through microsieves (35 µm) and is divided into two treatment lines. The first line, treating ~70% of the total flow, includes conventional treatment with coagulation, sedimentation, rapid sand filtration, followed by advanced oxidation (H2O2/UV). The second line, treating ~30% of the flow, incorporates microsieves (200 µm), suspended ion exchange, and ceramic microfiltration, followed by advanced oxidation (H2O2/UV). Effluents from both lines are then mixed and passed through granular activated carbon (GAC) filtration NORIT ROW 0.8S (Cabot Norit, Amersfoort, The Netherlands) with a grain size of 0.60 mm and an empty-bed contact time of 23–40 min (average 30–35 min), followed by microsieves (35 µm). Finally, a low dose of chlorine dioxide (0.01–0.04 mg/L after the reservoir) is added before storage in the clean water reservoir, with residual chlorine not maintained in the distribution network. During 2021, bulk water samples were collected from (i) lake surface water intake (SW), and the effluents of (ii) raw water reservoir (RWR), (iii) rapid sand filtration (conventional pretreatment-CPT), (iv) advanced oxidation after the conventional pre-treatment (AOP_C), (v) microfiltration (Advanced pretreatment-APT), (vi) advanced oxidation after the advanced pre-treatment (AOP_A), (vii) granular activated carbon filters (GAC), and (viii) produced water reservoir (final drinking water) (FDW). The sampling points are indicated in Figure 1. Samples were stored at 4 °C and analyzed within 24 h.
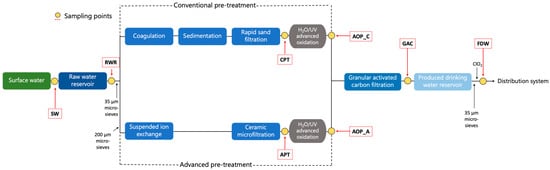
Figure 1.
Andijk water treatment plant scheme. Sampling points are indicated as yellow dots, and sample names are indicated in red dashed lines.
2.2. Characterization of Organics
The concentration of AOC was determined with the AOC method using P. fluorescens strain (P17) and Spirillum sp. strain (NOX) as described by Ross et al. [18]. Shortly, after pasteurization for 30 min at 60 °C, duplicate samples in 600 mL Erlenmeyer flasks with glass stoppers were inoculated with precultured P17 and NOX solutions (100 CFU/mL). The samples were incubated at 15 ± 1 °C and cultured every 2 days until the samples reached the maximum number of CFU/mL. The AOC concentration was calculated from the Nmax values (when microorganisms reach their maximum growth) using the yield value of the organisms on acetate [19]. The samples after UV treatment are first controlled at the laboratory for residual H2O2 with a peroxide meter (Dulcotest DT3, Prominent GmbH, Heidelberg, Germany) and, when needed, quenched with sodium sulfite (Na2SO3) at 37.9 mg/mL. From this solution, 3 mL is added to the 600 mL AOC samples for quenching, before pasteurization of the sample. A blank sample is also supplied with the same amount of sodium sulfite to check for any effect on the AOC measurement. An average of 10 samples were analyzed from each treatment stage, collected every 1 to 2 weeks, from January to October 2021.
The organic matter in the samples was characterized as an organic fraction using liquid chromatography with organic carbon detection (LC-OCD) as described previously [20]. The main fractions identified were biopolymers (BP), humic substances (HS), building blocks (BB), and neutrals.
Samples were analyzed for total organic carbon (TOC) according to standard protocols [21]. An average of 10 samples were analyzed from each treatment stage, collected every week, from January to November 2021.
2.3. Microbial Analysis: Total and Intact Bacterial Cell Concentration
The total (TCC) and intact (ICC) bacterial cell density was measured with flow cytometry-based staining using SYBR Green I (Sigma-Aldrich, St. Louis, MO, USA) and propidium iodide (PI) (1.5 mM, Sigma-Aldrich, USA), as previously described [22]. Briefly, 100 µL of the water sample was mixed with 1 µL, 100× SYBR Green I (10,000× final dilution of SG) for the total cell concentration, or SYBR Green I and PI (10,000× final dilution of SG; 4 µM final concentration of PI) for the intact cell concentration measurement. The bacterial cell density of water samples was measured using an Accuri C6 Plus flow cytometer (BD Biosciences, San Jose, CA, USA). The samples were pre-heated for 4 min at 37 ± 2 °C and then incubated for 15 min at 37 ± 2 °C in the dark after the addition of stains. Intact cell density is measured with 50 µL of the sample at a flow rate of 66 µL/min with the threshold set on green fluorescence (FL1; 533 nm). Bacteria were gated on the green/red fluorescence density plot to determine intact cell density (FL1 and FL3; >670 nm). Total cell density was measured similarly, using SYBR Green I stain alone without PI, and gated on green fluorescence. An average of 26 samples were analyzed from each treatment stage, collected every 1 to 2 weeks, across the year 2021.
2.4. DNA Extraction and Sequencing
Samples of 2 L were filtered through a 0.22 μm polycarbonate 47 mm filter (MontaMil, Frisenette ApS, Ebeltoft, Denmark). The filters were kept in the dark at −80 °C until shipping. All the filters holding the biomass were sent to the DNASense Laboratory (Aalborg, Denmark) for DNA extraction, which follows the standard protocol for the DNeasy PowerWater kit (Qiagen, Hilden, Germany). Samples were processed for gene amplicon sequencing targeting the bacteria 16S rRNA gene variable regions V3-4 and the archaea 16S rRNA gene region V3-5 using the Illumina MiSeq platform. The DNA concentration was measured using a Qubit dsDNA HS Assay kit (Thermo Fisher Scientific, Waltham, MA, USA). The size and purity of the sequencing libraries were checked with Tapestation 2200 and D1000/High sensitivity D1000 screenTape assay (Agilent Technologies, Santa Clara, CA, USA) that produces a gel electrophoresis image of the DNA analysis. Samples were collected monthly during the spring, summer, and fall seasons of 2021. Samples with a DNA yield below the detection limit were not processed for further analysis.
Sequencing Data Analysis
DNA extraction and sequencing library preparation were successful for 61 out of 98 samples (62.2%) and yielded between 8689 and 87,839 DNA reads after quality control and bioinformatic processing. Failed samples were those yielding fewer filtered DNA reads than 10,000, and therefore not considered for subsequent analyses.
The purified sequencing libraries were pooled in equimolar concentrations and diluted to 2 nM. The samples were paired-sequenced (2 × 300 bp) using a MiSeq reagent kit v3 (Illumina, San Diego, CA, USA) following the standard guidelines. Forward and reverse reads were trimmed for quality using Trimmomatic v. 0.32 and merged using FLASH v. 1.2.7. Taxonomy was assigned using the u-clust classifier as implemented in QIIME [23] and the SILVA database [24]. Sequences were aligned using the average neighbor algorithm into operational taxonomic units (OTUs) with a similarity cut-off of 97% and singleton OTUs were removed.
Beta diversity analyses were performed using the QIIME2 (version 2021.4) diversity plugin. Quantitative (weighted UniFrac) distance matrices were calculated from the data. Statistical differences between groups based on the sampling points were determined using the ADONIS (permutation-based ANOVA) test with 999 permutations [25]. Pairwise comparisons between groups were conducted using the beta-group-significance command within the QIIME2 diversity plugin. Non-metric Multidimensional Scaling (NMDS) ordination was employed to investigate the structure of microbial communities. The stress value was calculated using Kruskal’s stress formula [26], where a value of <0.1 indicates a good representation of the dissimilarities by the NMDS algorithm.
3. Results
3.1. Organic Matter Dynamics: Interactions Across Treatment Trains
The relevant organic content to microbial regrowth (DOC and AOC) is depicted in Figure 2. While dissolved organic carbon (DOC) concentrations decreased steadily across both treatment lines, most of the removal occurred during the initial pretreatment stages (Figure 2A). DOC was reduced from nearly 6 mg/L in the SW to 1.95 mg/L after CPT, and to 2.20 mg/L after APT. Downstream oxidation steps produced negligible changes in DOC. The final significant decrease occurred after granular activated carbon filtration (GAC), where DOC dropped to 1.20 mg/L and further to 1.15 mg/L in the final drinking water (FDW). These changes, while indicative of general organic load reduction, provide limited insight into microbial risks downstream. An overview of key source water quality parameters measured throughout the full treatment trains is provided in Table S1.
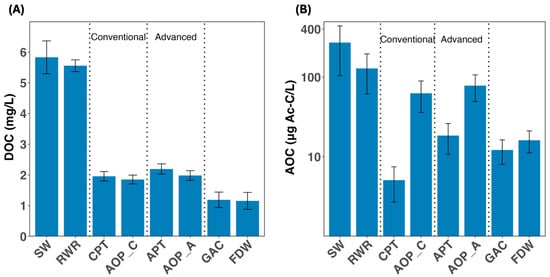
Figure 2.
Variations of (A) dissolved organic carbon (DOC) and (B) assimilable organic carbon (AOC) throughout the treatment process. Dashed lines indicate the steps belonging to conventional and advanced pre-treatment trains. Error bars represent seasonal variation observed across sampling periods. The y-axis in figure (B) is shown on a logarithmic scale. Abbreviations: SW: source water; RWR: raw water reservoir; CPT: conventional pre-treatment; AOP_C: advanced oxidation process in the conventional line; APT: advanced pre-treatment; AOP_A: advanced oxidation process in the advanced line; GAC: granular activated carbon filtration; FDW: final drinking water.
By contrast, assimilable organic carbon (AOC) revealed more dynamic and treatment-sensitive behavior (Figure 2B). AOC concentration decreased significantly after CPT (from 130 ± 66 μg Ac-C/L in the RWR to 6.3 ± 5.7 μg Ac-C/L; >90% removal), but increased nearly ten-fold after the downstream advanced oxidation process (AOP_C), reaching 62.6 ± 26.7 μg Ac-C/L. A similar trend was observed in the advanced treatment train: APT reduced AOC to 8.40 ± 7.65 μg Ac-C/L, followed by a ~300% increase after AOP_A (78 ± 28.6 μg Ac-C/L).
GAC filtration further decreased the AOC concentration by more than 80% (12.2 ± 4.14 μg Ac-C/L), whereas a slight increase was observed in the final drinking water (FDW) (16.10 ± 4.93 μg Ac-C/L; p > 0.05), likely due to breakdown of organic matter by the addition of disinfectant before the reservoir. Importantly, AOC values increased notably during warmer months in the source water and raw water reservoir, as well as in the oxidation steps, whereas other stages showed minimal seasonal variation (Figure S1), emphasizing the importance of considering both source water quality and oxidation sequence together when assessing the risk of microbial regrowth.
The fractionation of natural organic matter (NOM) across the treatment further supports this dynamic (Figure S2). Both pretreatment lines significantly removed biopolymers (70–90%) and humic substances, with comparable efficiencies (p > 0.05) from the RWR. However, oxidation steps led to partial reformation or transformation of biopolymers, consistent with AOC trends. GAC consistently reduced biopolymer levels to <100 μg C/L, while HS and building blocks (BB) were also substantially decreased, to 640 μg C/L and 307 μg C/L, respectively. Neutral compounds were less affected and persisted throughout the treatment. The cumulative contributions from each treatment step to the removal of DOC, AOC, and organic matter fractions, calculated relative to the preceding step to reflect the actual plant configuration of the treatment plant rather than isolated step efficiencies, are depicted in Figure S3. Figure S4 shows the seasonal variation of NOM fractions throughout the treatment process. During the warmer months, biopolymers increased significantly in the SW and RWR (from ~300 μg C/L in spring to ~900 μg C/L in summer/fall), while building blocks decreased in the source water but slightly increased in the raw water reservoir (Figure S4C). Humic substances decreased across all treatment stages, and neutrals remained relatively stable throughout the year.
3.2. Bacterial Cell Dynamics Across Treatment Trains
Bacterial cell density across the full treatment system revealed how microbial loads and viability evolved under two parallel treatment configurations (Figure 3). The source water (SW), drawn from a eutrophic lake, exhibited high total cell density with an average of 4.96 × 10⁶ ± 1.80 × 10⁶ cells/mL, and intact cells accounted for the majority (74.6%) (Figure 3A and Figure 3B, respectively). Minimal changes observed in the raw water reservoir, where the total and intact cell densities observed were 5.18 × 10⁶ ± 1.49 × 10⁶ cells/mL and 3.86 × 10⁶ ± 1.41 × 10⁶ cells/mL, respectively). SW and RWR cell densities were not statistically different (p > 0.05). This highlighted that this stage alone had a negligible impact on microbial load, emphasizing the need for downstream interventions.
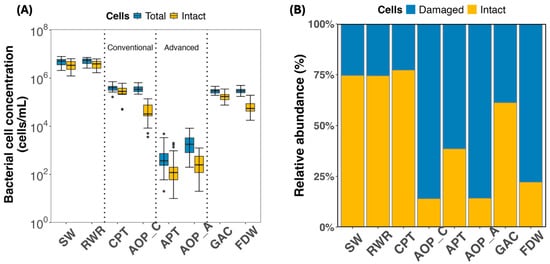
Figure 3.
(A) Total (yellow) and intact (blue) bacterial cell density across the treatment train; (B) relative abundance: percentage of intact (blue) to damaged (yellow) bacterial cell density across samples. Error bars represent seasonal variation observed across sampling periods. Dots represent outliers beyond 1.5 times the interquartile range (IQR). Abbreviations: SW: source water; RWR: raw water reservoir; CPT: conventional pre-treatment; AOP_C: advanced oxidation process in the conventional line; APT: advanced pre-treatment; AOP_A: advanced oxidation process in the advanced line; GAC: granular activated carbon filtration; FDW: final drinking water.
Within the conventional treatment line, coagulation-sedimentation-filtration (CPT) achieved a reduction of ~1-log in both total and intact cell densities (3.93 × 10⁵ ± 1.26 × 10⁵ cells/mL and 3.03 × 10⁵ ± 1.41 × 10⁵ cells/mL, respectively). However, a high proportion of viable cells (>75%, Figure 3B) remained post-CPT. The advanced oxidation in the conventional train (AOP_C) achieved a sharp decrease in intact cells of 83% (Figure 3B).
In contrast, the advanced treatment line combining microfiltration (APT) and advanced oxidation (AOP_A) exhibited the highest bacterial load reduction, achieving nearly 3-log removal in both total and intact cells (99% removal). Microfiltration, a robust physical barrier, was key to this outcome (7.75 × 10² ± 1.05 × 10³ cells/mL TCC and 2.82 × 10² ± 4.77 × 10² cells/mL ICC) (Figure 3A). The subsequent advanced oxidation further damaged remaining cells, achieving intact-to-total ratios below 20% (Figure 3B).
Despite the superior microbial removal and inactivation performance of the advanced train, both treatment lines ultimately merged before final polishing, reducing the advantages of the advanced configuration. Post-blending, GAC filtration introduced a consistent rise in total (105 cells/mL) and viable cell counts (~65%) (Figure 3A,B), likely due to biofilm growth.
Disinfection with ClO2 at the end of the treatment process reduced viable cell proportions to ~24% (6.58 × 10⁴ ± 2.68 × 10⁴ cells/mL); however, bacterial densities remained comparable to those observed after conventional filtration, indicating that the benefits of the advanced treatment train were reduced by downstream integration constraints.
3.3. Microbial Community Dynamics Across the Treatment Train
Drinking water treatment induced marked changes in microbial community composition and structure, with strong reductions in diversity and archaeal prevalence observed along the treatment sequence (Figure 4 and Figure 5). SW and RWR hosted taxonomically rich bacterial and archaeal communities, with over half of the operational taxonomic units (OTUs) affiliated with archaea. However, archaeal richness declined significantly after both CPT and APT and was nearly absent in the GAC and finished drinking water (FDW). In contrast, bacterial communities persisted and became increasingly dominant, indicating higher resistance to treatment-associated stressors. AOP_C and AOP_A samples yielded fewer than 10,000 quality-filtered DNA reads; therefore, these samples were neglected for the archaeal analysis.
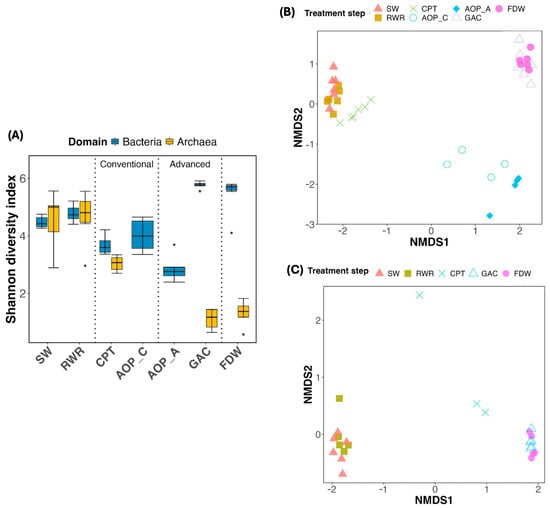
Figure 4.
(A) Alpha diversity (Shannon index) of the bacterial and archaeal community across treatment stages. Error bars represent seasonal variation observed across sampling periods. Dots represent outliers beyond 1.5 times the interquartile range (IQR). Beta diversity (Non-metric Multidimensional Scaling; NMDS) of (B) bacterial (stress value = 0.07) and (C) archaeal communities (stress value = 0.037) across the treatment train. Note that samples APT (for both bacterial and archaeal domains) and AOP_C and AOP_A (only for the archaeal domain) were not processed (DNA amplification was not successful). Abbreviations: SW: source water; RWR: raw water reservoir; CPT: conventional pre-treatment; AOP_C: advanced oxidation process in the conventional line; AOP_A: advanced oxidation process in the advanced line; GAC: granular activated carbon filtration; FDW: final drinking water.
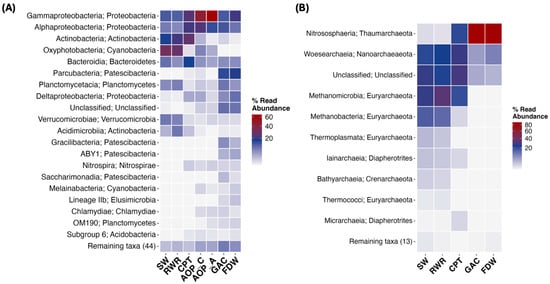
Figure 5.
Heatmap of the most abundant classes and their respective phylum in (A) bacterial and (B) archaeal communities detected throughout the treatment. Note that samples APT (for both bacterial and archaeal domains) and AOP_C and AOP_A (only for the archaeal domain) were not processed (DNA amplification was not successful). Abbreviations: SW: source water; RWR: raw water reservoir; CPT: conventional pre-treatment; AOP_C: advanced oxidation process in the conventional line; AOP_A: advanced oxidation process in the advanced line; GAC: granular activated carbon filtration; FDW: final drinking water.
Bacterial diversity was significantly reduced after CPT but recovered following GAC filtration (Figure 4A). FDW bacterial diversity remained high and comparable to GAC (p > 0.05). Archaeal diversity, however, declined steadily and remained low post-GAC and in FDW.
Community similarity analysis via NMDS (Figure 4B,C) indicated that treatment processes exerted stronger selectivity pressure than seasonal variation. Bacterial communities clustered into three main groups: (i) SW, RWR, CPT; (ii) AOP_AOP_A; and (iii) GAC, FDW, highlighting the impact of treatment type (Figure 4B). Notably, AOP_C and AOP_A diverged despite process similarity, suggesting that pre-treatment microbial composition influenced downstream outcomes. PERMANOVA confirmed significant differences between treatment stages (Table S2), especially between SW and CPT, and between the two AOPs. A similar trend was observed in the archaeal community (Figure 4C), where two groups can be differentiated: the SW overlapped with RWR, and GAC clustered with FDW. A comparison within the two groups (SW vs. RWR, and GAC vs. FDW) revealed no significant differences (p > 0.05).
Taxonomic shifts were also evident at the phylum level (Figure 5A). Proteobacteria remained dominant across most stages, particularly post-AOP, while Actinobacteria, after dominating the RWR, declined significantly following oxidative treatment. GAC and FDW samples featured a broader distribution of bacterial phyla, including increased representation of Patescibacteria (15.4% and 19.7% abundance, respectively).
Archaeal phyla were more selectively distributed (Figure 5B). Euryarchaeota dominated the early stages (SW and RWR) but were eliminated post-GAC. Thaumarchaeota became dominant in GAC and FDW by 88.0% and 87.3%, respectively, and were identified in the CPT at 21% of relative abundance.
In total, 63 bacteria and 27 archaeal classes were identified (Figure 5A and Figure 5B, respectively). While Gammaproteobacteria and Alphaproteobacteria persisted across the train and became dominant after the reservoir, archaeal communities were governed initially by Woesearchaeia and Metahnomicrobia, and in later stages, by Nitrososphaeria. GAC and FDW exhibited a higher variety of classes, where GAC’s most abundant bacterial class was Parcubacteria by 15.3%, and in FDW was Gammaproteobacteria at 20.8%. This is directly reflected in the significant increase in diversity observed in Figure 5.
4. Discussion
Surface water treatment remains a dynamic challenge due to seasonal fluctuations in biological activity, nutrient levels, and organic matter composition. As treatment plants increasingly adopt advanced unit processes such as AOPs, membrane filtration, and ion exchange, it is important to evaluate these technologies within a system-wide framework that considers interactions between treatment steps, cumulative effects of process sequencing, and downstream biological implications. Such an integrated approach supports more robust, adaptable systems in the face of climate change, rising operational costs, and increasing maintenance demands. This study demonstrates that limited integration across treatment stages affects biological stability over the long term, especially under seasonal stress conditions.
4.1. Integrating Processes for Enhanced Organic Matter Removal and Microbial Stability
The patterns observed in organic matter removal and microbial community shifts highlight the complexity of achieving biological stability in drinking water systems. While the DOC removal efficiency (~80%) is relatively high, the key consideration is not only the extent of removal but the composition of the remaining organic matter, as residual biodegradable fractions such as AOC and biopolymers, rather than total DOC, are more indicative of biological stability risks [27], and these biodegradable compounds remained persistent in the final water, particularly during warmer months. Despite the substantial removal during the pre-treatment, these compounds become more problematic when advanced processes, such as AOPs, generate additional biodegradable by-products (Figure 2) [28].
The CPT, which included coagulation, sedimentation, and rapid sand filtration, consistently achieved the highest removal of AOC and biopolymers across seasons. Also, AOPs effectively inactivated microbial cells in both trains, but concurrently increased AOC concentrations by breaking down high-molecular-weight organic matter into smaller, more biodegradable compounds [7,29]. While this transformation supports the performance of activated carbon filtration in removing the remaining organic matter [30], it also creates a readily available carbon source that can enhance downstream microbial growth [31]. Despite substantial AOC removal within the GAC (down to ~12 μg Ac-C/L), the residual levels surpass the recommended AOC concentration in produced drinking water (<10 μg Ac-C/L) to avoid microbial proliferation [32]. Elevated AOC concentrations observed in the source water, especially during the warmer months (Figure S1), contributed to increases in AOC observed in the oxidation steps. While AOC levels in the final drinking water remained relatively stable, these seasonal increases upstream and during AOPs can promote favorable conditions for Aeromonas exceedance in the distribution network [33,34,35]. The observed patterns suggest that seasonal temperature variations primarily influence AOC formation in the source water and during oxidation, whereas subsequent treatment stages help mitigate these fluctuations, highlighting the importance of considering upstream seasonal dynamics when evaluating regrowth potential in the network. Moreover, slowly biodegradable compounds like biopolymers persisted in the final water, with concentrations similar to those reported by Wagenvoort et al. [14], who found higher biopolymer levels in surface water-treated drinking water (76 µg C/L) compared to groundwater-treated water (7.7 µg C/L). Seasonal increases observed in biopolymers within the source water (Figure S4) could compromise biological stability by serving as substrates for microbial growth and biofilm formation, therefore correlating with the seasonal issues occurring in the distribution network from this study’s plant. Together with humic substances, a major DOC component contributing to water coloration, taste, and odor issues, can promote pathogenic microorganism growth and biofilm formation [27,36]. Results revealed that while conventional and advanced pretreatments are both effective at removing bulk NOM, their effects on biologically relevant fractions are divergent post-oxidation, and the seasonal increase in biodegradable fractions highlights that, without real-time adaptation or targeted pre-removal of precursors, advanced treatment stages became vulnerable to regrowth dynamics, despite their standalone efficiency.
4.2. Treatment-Induced Microbial Shifts and the Need for Strategic Integration
The observed shifts in microbial diversity and community structure across the treatment train remark the selective pressures created by successive treatment steps and highlight the importance of evaluating microbial resilience at the system level. Bacterial diversity started declining after both pre-treatment trains, consistent with the decrease in cell density (Figure 3). However, this trend reversed post-GAC, where biofilm development likely facilitated re-establishment of a more diverse and structured community [13,37]. This is supported by the increased abundance of biofilm-forming taxa such as Gammaproteobacteria and Parcubacteria, suggesting that biological activity within the GAC might contribute to downstream microbial regrowth potential [38]. In contrast, archaeal diversity decreased progressively and remained low after GAC, indicating greater susceptibility to oxidative and physical treatment barriers and limited ecological niches for recovery [39].
NMDS and PERMANOVA analyses confirmed that treatment configuration, rather than seasonal dynamics, predominantly shaped microbial community composition. The separation between AOP_C and AOP_A clusters, despite their chemical similarity, highlights the influence of upstream community composition on downstream microbial paths. These shifts were not random; warmer temperatures, elevated AOC, and biofilm-prone surfaces within the GAC created favorable conditions for Gammaproteobacteria (Aeromonas class) to persist [40], which correlate with the exceedance of Aeromonas during the warmer months (Figure S5). This interaction between treatment-induced community shifts and seasonal drivers creates a favorable environment for Aeromonas proliferation in the distribution network, where residual AOC and other NOM, and elevated temperatures sustain regrowth. Also, these can promote the formation and accumulation of particulate matter, which in turn creates microenvironments that favor the exceedance of Aeromonas in the distribution system [14,41,42]. Moreover, while advanced steps successfully reduced microbial load (e.g., 3-log reduction through microfiltration and AOP), the sequencing and positioning of these units did not prevent regrowth when viewed from a full-train perspective. This points to a critical gap: treatment trains are often optimized for unit-level performance but not for cumulative, system-wide outcomes. Without integration across steps, where the output of one process is strategically aligned with the needs of the next, the plant’s biological stability remains vulnerable to both predictable (seasonal) and stochastic fluctuations.
Taxonomic transitions, including the replacement of Euryarchaeota by Thaumarchaeota and dominance of Nitrososphaeria in later stages, suggest a shift toward functionally specialized communities potentially linked to nitrification activity within GAC biofilms [43,44]. These results emphasize the complexity of microbes-nutrient interaction occurring in treatment processes such as filters operating both with adsorption and biodegradation, and the need for integrated microbial monitoring across the full treatment train, particularly when operating biologically active filtration stages for extended periods of time [45].
4.3. Dynamic Optimization of Treatment Processes
Achieving high-quality and biologically stable drinking water and an optimized treatment process requires transitioning from a component-focused design philosophy to a systems-level optimization framework. Findings from this study highlight several actionable strategies that integrate hydraulic design, microbial control, and organic matter dynamics across the full treatment train. First, reconsidering treatment sequence, for example, by relocating ion exchange downstream of coagulation, may enhance the removal of hydrophilic AOC precursors, thereby reducing the biodegradable load entering GAC filtration [46,47]. In fact, Liu et al. [48] proved that biological ion exchange (BIEX) removes NOM more efficiently than activated carbon filtration. Additionally, GAC performance can be improved by optimizing empty bed contact time (EBCT) [49], implementing biofilm management protocols [50], and exploring bioaugmentation approaches with targeted microbial consortia to foster functional community structures [51].
The selection and positioning of advanced oxidation processes should also be critically re-evaluated. While H2O2/UV is effective in micropollutant degradation, it generates elevated levels of AOC, increasing the risk of downstream biological instability [52]. The integration of polishing biofilters, such as slow sand filtration, either before or after GAC, may reduce AOC concentrations and promote microbial community resilience [50,53,54]. Finally, system-wide, real-time monitoring of NOM fractions, microbial dynamics, and regrowth potential should be embedded into operational protocols, especially during seasonal transitions. This allows adaptive interventions, such as dose adjustment, implementation of pre-treatment buffers, and AOC reduction strategies, which are essential to maintain biological stability under variable source water and operational conditions [16,34,55].
4.4. Resilient Design for Emerging Challenges
Current design and operational frameworks often prioritize immediate regulatory compliance (e.g., turbidity, cell count) rather than long-term biological stability. As a result, advanced treatments are added to target specific flaws such as taste, odor, or biofilm formation, without addressing root causes [7,56]. In this present study, the advanced pre-treatment line was implemented specifically to reduce the organic load to the UV oxidation step in the conventional train, improving its performance and lowering operational costs. This approach limits resilience under climate or ecosystem-driven stressors, which are becoming more frequent and intense [57,58].
Future treatment design must be anticipatory rather than reactive. Systemic alignment of treatment steps, guided by source water characteristics and microbial ecology, would be key. Optimization should not only focus on removal efficiencies but also on the interactions between physical, chemical, and biological processes. Only then can plants move beyond symptom management toward sustained, high-quality drinking water production.
5. Conclusions
This study highlights the importance of evaluating full treatment trains as integrated systems rather than isolated steps. In plants treating eutrophic surface waters, where microbial and organic matter loads fluctuate seasonally, the sequencing and interaction of treatment technologies significantly shape the chemical and microbial quality of the final water.
Key insights include:
- Oxidation and activated carbon filtration must be carefully balanced; insufficient removal of biodegradable compounds can lead to microbial regrowth instead of control.
- Biological stability depends not only on treatment effectiveness but also on how treatment steps interact across the full process.
- A system-level perspective is essential to design resilient schemes, especially when treating complex or eutrophic source waters.
- Microbial regrowth potential cannot be fully addressed by optimizing individual processes alone; it requires an integrated approach that accounts for nutrient loads, residual management, and seasonal dynamics.
Supplementary Materials
The following supporting information can be downloaded at: https://www.mdpi.com/article/10.3390/w18020231/s1, Table S1: Concentration of key chemical and biological parameters in the source water (SW) and throughout the full treatment; Figure S1: Seasonal trends of assimilable organic carbon (AOC) throughout the year in the full treatment process; Figure S2: Natural organic matter (NOM) fractions concentration during the treatment process; Figure S3: Waterfall plots showing the evolution of dissolved organic carbon (DOC) and assimilable organic carbon (AOC), and natural organic matter (NOM) fractions concentration during the treatment process; Figure S4: Seasonal trends of natural organic matter (NOM) fractions throughout the year in the full treatment process. Table S2: Significance values between the different sample groups based on the PERMANOVA analysis; Figure S5: Increase of Aeromonas count in the distribution network and with the temperature of the water throughout the year.
Author Contributions
Conceptualization, A.I.F., E.I.P. and N.F.; methodology, E.I.P.; formal analysis, A.I.F. and E.I.P.; investigation A.I.F.; resources E.I.P.; data curation, A.I.F. and E.I.P.; writing—original draft preparation, A.I.F.; writing—review and editing, E.I.P., N.F., J.B. and J.V.; visualization, A.I.F.; supervision, J.V. and N.F.; project administration, E.I.P., N.F. and J.V.; funding acquisition, E.I.P. and J.V. All authors have read and agreed to the published version of the manuscript.
Funding
This research was funded by PWN Water Supply Company, North-Holland, 1991 AS Velserbroek, The Netherlands, and by King Abdullah University of Science and Technology (KAUST), 23955-6900 Thuwal, Saudi Arabia.
Data Availability Statement
Data is contained within the article or Supplementary Materials.
Acknowledgments
The authors would like to thank PWN for technical support.
Conflicts of Interest
Author Emmanuelle I. Prest was employed by the company PWNT, and author John Boogaard was employed by the company PWN. The remaining authors declare that the research was conducted in the absence of any commercial or financial relationships that could be constructed as a potential conflict of interest.
Abbreviations
The following abbreviations are used in this manuscript:
| DWTP | Drinking water treatment plant |
| AOP | Advanced oxidation processes |
| GAC | Granular activated carbon filtration |
| AOC | Assimilable organic carbon |
| CPT | Conventional pre-treatment |
| APT | Advanced pre-treatment |
| NOM | Natural organic matter |
References
- Jeon, Y.; Li, L.; Bhatia, M.; Ryu, H.; Santo Domingo, J.W.; Brown, J.; Goetz, J.; Seo, Y. Impact of Harmful Algal Bloom Severity on Bacterial Communities in a Full-Scale Biological Filtration System for Drinking Water Treatment. Sci. Total Environ. 2024, 927, 171301. [Google Scholar] [CrossRef]
- Jeon, Y.; Li, L.; Calvillo, J.; Ryu, H.; Santo Domingo, J.W.; Choi, O.; Brown, J.; Seo, Y. Impact of Algal Organic Matter on the Performance, Cyanotoxin Removal, and Biofilms of Biologically-Active Filtration Systems. Water Res. 2020, 184, 116120. [Google Scholar] [CrossRef]
- Leite, L.D.S.; Dos Santos, D.V.; Paschoalato, C.F.P.R.; Bond, T.; Daniel, L.A. Disinfection By-Products Formation from Chlor(Am)Ination of Algal Organic Matter of Chlorella Sorokiniana. Toxics 2023, 11, 690. [Google Scholar] [CrossRef]
- Sillanpää, M.; Ncibi, M.C.; Matilainen, A. Advanced Oxidation Processes for the Removal of Natural Organic Matter from Drinking Water Sources: A Comprehensive Review. J. Environ. Manag. 2018, 208, 56–76. [Google Scholar] [CrossRef] [PubMed]
- Phungsai, P.; Kurisu, F.; Kasuga, I.; Furumai, H. Changes in Dissolved Organic Matter Composition and Disinfection Byproduct Precursors in Advanced Drinking Water Treatment Processes. Environ. Sci. Technol. 2018, 52, 3392–3401. [Google Scholar] [CrossRef]
- Dobrowsky, P.H.; Lombard, M.; Cloete, W.J.; Saayman, M.; Cloete, T.E.; Carstens, M.; Khan, S.; Khan, W. Efficiency of Microfiltration Systems for the Removal of Bacterial and Viral Contaminants from Surface and Rainwater. Water Air Soil Pollut. 2015, 226, 33. [Google Scholar] [CrossRef]
- Chen, W.T.; Chien, C.C.; Ho, W.S.; Ou, J.H.; Chen, S.C.; Kao, C.M. Effects of Treatment Processes on AOC Removal and Changes of Bacterial Diversity in a Water Treatment Plant. J. Environ. Manag. 2022, 311, 114853. [Google Scholar] [CrossRef]
- Burke, M.; Wells, E.; Larison, C.; Rao, G.; Bentley, M.J.; Linden, Y.S.; Smeets, P.; DeFrance, J.; Brown, J.; Linden, K.G. Systematic Review of Microorganism Removal Performance by Physiochemical Water Treatment Technologies. Environ. Sci. Technol. 2025, acs.est.4c03459. [Google Scholar] [CrossRef] [PubMed]
- Neale, P.A.; Khan, S.J.; Li, J.; O’Carroll, D.M.; Leusch, F.D.L. Assessing the Ability of Advanced Pre-Treatment to Reduce Disinfection by-Product Formation and Finished Water Toxicity. Water Res. 2025, 282, 123755. [Google Scholar] [CrossRef] [PubMed]
- Nemani, K.S.; Peldszus, S.; Huck, P.M. Practical Framework for Evaluation and Improvement of Drinking Water Treatment Robustness in Preparation for Extreme-Weather-Related Adverse Water Quality Events. ACS EST Water 2023, 3, 1305–1313. [Google Scholar] [CrossRef]
- Chaukura, N.; Marais, S.S.; Moyo, W.; Mbali, N.; Thakalekoala, L.C.; Ingwani, T.; Mamba, B.B.; Jarvis, P.; Nkambule, T.T.I. Contemporary Issues on the Occurrence and Removal of Disinfection Byproducts in Drinking Water—A Review. J. Environ. Chem. Eng. 2020, 8, 103659. [Google Scholar] [CrossRef]
- Zhang, X.; Chen, Z.; Shen, J.; Zhao, S.; Kang, J.; Chu, W.; Zhou, Y.; Wang, B. Formation and Interdependence of Disinfection Byproducts during Chlorination of Natural Organic Matter in a Conventional Drinking Water Treatment Plant. Chemosphere 2020, 242, 125227. [Google Scholar] [CrossRef]
- Vignola, M.; Werner, D.; Wade, M.J.; Meynet, P.; Davenport, R.J. Medium Shapes the Microbial Community of Water Filters with Implications for Effluent Quality. Water Res. 2018, 129, 499–508. [Google Scholar] [CrossRef]
- Wagenvoort, A.; Van Asperen, R.V.; Sandrini, G.; Hijnen, W. Changes in Water Source Cause Shifts in Invertebrate Biomass, Composition, and Regrowth in a Non-Chlorinated Drinking Water Distribution System. Water 2023, 15, 732. [Google Scholar] [CrossRef]
- Rietveld, L.; Van Der Helm, A.; Van Schagen, K.; Van Der Aa, R.; Van Dijk, H. Integrated Simulation of Drinking Water Treatment. J. Water Supply Res. Technol. Aqua 2008, 57, 133–141. [Google Scholar] [CrossRef]
- Prest, E.I.; Hammes, F.; Van Loosdrecht, M.C.M.; Vrouwenvelder, J.S. Biological Stability of Drinking Water: Controlling Factors, Methods, and Challenges. Front. Microbiol. 2016, 7, 45. [Google Scholar] [CrossRef]
- Favere, J.; Barbosa, R.G.; Sleutels, T.; Verstraete, W.; De Gusseme, B.; Boon, N. Safeguarding the Microbial Water Quality from Source to Tap. npj Clean Water 2021, 4, 28. [Google Scholar] [CrossRef]
- Ross, P.S.; Hammes, F.; Dignum, M.; Magic-Knezev, A.; Hambsch, B.; Rietveld, L.C. A Comparative Study of Three Different Assimilable Organic Carbon (AOC) Methods: Results of a Round-Robin Test. Water Supply 2013, 13, 1024–1033. [Google Scholar] [CrossRef]
- van der Kooij, D.; Visser, A.; Oranje, J.P. Multiplication of Fluorescent Pseudomonads at Low Substrate Concentrations in Tap Water. Antonie Van Leeuwenhoek 1982, 48, 229–243. [Google Scholar] [CrossRef] [PubMed]
- Jeong, S.; Kim, S.-J.; Min Kim, C.; Vigneswaran, S.; Vinh Nguyen, T.; Shon, H.-K.; Kandasamy, J.; Kim, I.S. A Detailed Organic Matter Characterization of Pretreated Seawater Using Low Pressure Microfiltration Hybrid Systems. J. Membr. Sci. 2013, 428, 290–300. [Google Scholar] [CrossRef]
- Potter, B.B.; Wimsatt, J.C. Determination of Total Organic Carbon and Specific UV Absorbance at 254 nm in Source Water and Drinking Water; U.S. Environmental Protection Agency: Cincinnati, OH, USA, 2009.
- Van Nevel, S.; Koetzsch, S.; Proctor, C.R.; Besmer, M.D.; Prest, E.I.; Vrouwenvelder, J.S.; Knezev, A.; Boon, N.; Hammes, F. Flow Cytometric Bacterial Cell Counts Challenge Conventional Heterotrophic Plate Counts for Routine Microbiological Drinking Water Monitoring. Water Res. 2017, 113, 191–206. [Google Scholar] [CrossRef]
- Caporaso, J.G.; Kuczynski, J.; Stombaugh, J.; Bittinger, K.; Bushman, F.D.; Costello, E.K.; Fierer, N.; Peña, A.G.; Goodrich, J.K.; Gordon, J.I.; et al. QIIME Allows Analysis of High-Throughput Community Sequencing Data. Nat. Methods 2010, 7, 335–336. [Google Scholar] [CrossRef]
- Quast, C.; Pruesse, E.; Yilmaz, P.; Gerken, J.; Schweer, T.; Yarza, P.; Peplies, J.; Glöckner, F.O. The SILVA Ribosomal RNA Gene Database Project: Improved Data Processing and Web-Based Tools. Nucleic Acids Res. 2012, 41, D590–D596. [Google Scholar] [CrossRef]
- Anderson, J.C.; Wachenheim, C.J.; Lesch, W.C. Perceptions of Genetically Modified and Organic Foods and Processes. AgBioForum 2006, 9, 180–194. [Google Scholar]
- Clarke, K.R. Non-parametric Multivariate Analyses of Changes in Community Structure. Aust. J. Ecol. 1993, 18, 117–143. [Google Scholar] [CrossRef]
- Hijnen, W.A.M.; Schurer, R.; Bahlman, J.A.; Ketelaars, H.A.M.; Italiaander, R.; van der Wal, A.; van der Wielen, P.W.J.J. Slowly Biodegradable Organic Compounds Impact the Biostability of Non-Chlorinated Drinking Water Produced from Surface Water. Water Res. 2018, 129, 240–251. [Google Scholar] [CrossRef] [PubMed]
- Wang, W.-L.; Zhang, X.; Wu, Q.-Y.; Du, Y.; Hu, H.-Y. Degradation of Natural Organic Matter by UV/Chlorine Oxidation: Molecular Decomposition, Formation of Oxidation Byproducts and Cytotoxicity. Water Res. 2017, 124, 251–258. [Google Scholar] [CrossRef]
- Ramseier, M.K.; Peter, A.; Traber, J.; Von Gunten, U. Formation of Assimilable Organic Carbon during Oxidation of Natural Waters with Ozone, Chlorine Dioxide, Chlorine, Permanganate, and Ferrate. Water Res. 2011, 45, 2002–2010. [Google Scholar] [CrossRef]
- Huo, L.; Zhao, S.; Shi, B.; He, S.; Wang, H. Effects of GAC and UV/H2 O2 -GAC Filtration on the Bacterial Community and Opportunistic Pathogens in Simulated Drinking Water Systems. Environ. Sci. Water Res. Technol. 2021, 7, 1611–1621. [Google Scholar] [CrossRef]
- Liu, W.; Wu, H.; Wang, Z.; Ong, S.L.; Hu, J.Y.; Ng, W.J. Investigation of Assimilable Organic Carbon (AOC) and Bacterial Regrowth in Drinking Water Distribution System. Water Res. 2002, 36, 891–898. [Google Scholar] [CrossRef]
- van der Kooij, D. Assimilable Organic Carbon as an Indicator of Bacterial Regrowth. J. Am. Water Work. Assoc. 1992, 84, 57–65. [Google Scholar] [CrossRef]
- Prest, E.I.; Hammes, F.; Kötzsch, S.; Van Loosdrecht, M.C.M.; Vrouwenvelder, J.S. Monitoring Microbiological Changes in Drinking Water Systems Using a Fast and Reproducible Flow Cytometric Method. Water Res. 2013, 47, 7131–7142. [Google Scholar] [CrossRef] [PubMed]
- Lautenschlager, K.; Hwang, C.; Liu, W.T.; Boon, N.; Köster, O.; Vrouwenvelder, H.; Egli, T.; Hammes, F. A Microbiology-Based Multi-Parametric Approach towards Assessing Biological Stability in Drinking Water Distribution Networks. Water Res. 2013, 47, 3015–3025. [Google Scholar] [CrossRef] [PubMed]
- LeChevallier, M.W.; Prosser, T.; Stevens, M. Opportunistic Pathogens in Drinking Water Distribution Systems—A Review. Microorganisms 2024, 12, 916. [Google Scholar] [CrossRef] [PubMed]
- Lipczynska-Kochany, E. Effect of Climate Change on Humic Substances and Associated Impacts on the Quality of Surface Water and Groundwater: A Review. Sci. Total Environ. 2018, 640–641, 1548–1565. [Google Scholar] [CrossRef]
- Velten, S.; Boller, M.; Köster, O.; Helbing, J.; Weilenmann, H.-U.; Hammes, F. Development of Biomass in a Drinking Water Granular Active Carbon (GAC) Filter. Water Res. 2011, 45, 6347–6354. [Google Scholar] [CrossRef]
- Qin, W.; Hammes, F. Substrate Pre-Loading Influences Initial Colonization of GAC Biofilter Biofilms. Front. Microbiol. 2021, 11, 596156. [Google Scholar] [CrossRef]
- Nagymáté, Z.; Homonnay, Z.G.; Márialigeti, K. Investigation of Archaeal and Bacterial Community Structure of Five Different Small Drinking Water Networks with Special Regard to the Nitrifying Microorganisms. Microbiol. Res. 2016, 188–189, 80–89. [Google Scholar] [CrossRef]
- Talagrand-Reboul, E.; Jumas-Bilak, E.; Lamy, B. The Social Life of Aeromonas through Biofilm and Quorum Sensing Systems. Front. Microbiol. 2017, 8, 37. [Google Scholar] [CrossRef]
- Prest, E.I.; Martijn, B.J.; Rietveld, M.; Lin, Y.; Schaap, P.G. (Micro)Biological Sediment Formation in a Non-Chlorinated Drinking Water Distribution System. Water 2023, 15, 214. [Google Scholar] [CrossRef]
- Seike, S.; Kobayashi, H.; Ueda, M.; Takahashi, E.; Okamoto, K.; Yamanaka, H. Outer Membrane Vesicles Released From Aeromonas Strains Are Involved in the Biofilm Formation. Front. Microbiol. 2021, 11, 613650. [Google Scholar] [CrossRef] [PubMed]
- Al-Ajeel, S.; Spasov, E.; Sauder, L.A.; McKnight, M.M.; Neufeld, J.D. Ammonia-Oxidizing Archaea and Complete Ammonia-Oxidizing Nitrospira in Water Treatment Systems. Water Res. X 2022, 15, 100131. [Google Scholar] [CrossRef]
- Woo, Y.; Cruz, M.C.; Wuertz, S. Selective Enrichment of Nitrososphaera Viennensis-Like Ammonia-Oxidizing Archaea over Ammonia-Oxidizing Bacteria from Drinking Water Biofilms. Microbiol. Spectr. 2022, 10, e01845-22. [Google Scholar] [CrossRef] [PubMed]
- Grace, M.A.; Healy, M.G.; Clifford, E. Performance and Surface Clogging in Intermittently Loaded and Slow Sand Filters Containing Novel Media. J. Environ. Manag. 2016, 180, 102–110. [Google Scholar] [CrossRef]
- Jutaporn, P.; Armstrong, M.D.; Coronell, O. Assessment of C-DBP and N-DBP Formation Potential and Its Reduction by MIEX® DOC and MIEX® GOLD Resins Using Fluorescence Spectroscopy and Parallel Factor Analysis. Water Res. 2020, 172, 115460. [Google Scholar] [CrossRef]
- Amini, A.; Kim, Y.; Zhang, J.; Boyer, T.; Zhang, Q. Environmental and Economic Sustainability of Ion Exchange Drinking Water Treatment for Organics Removal. J. Clean. Prod. 2015, 104, 413–421. [Google Scholar] [CrossRef]
- Liu, Z.; Lompe, K.M.; Mohseni, M.; Bérubé, P.R.; Sauvé, S.; Barbeau, B. Biological Ion Exchange as an Alternative to Biological Activated Carbon for Drinking Water Treatment. Water Res. 2020, 168, 115148. [Google Scholar] [CrossRef]
- Fundneider, T.; Acevedo Alonso, V.; Abbt-Braun, G.; Wick, A.; Albrecht, D.; Lackner, S. Empty Bed Contact Time: The Key for Micropollutant Removal in Activated Carbon Filters. Water Res. 2021, 191, 116765. [Google Scholar] [CrossRef]
- Rosenqvist, T.; Chan, S.; Ahlinder, J.; Salomonsson, E.N.; Suarez, C.; Persson, K.M.; Rådström, P.; Paul, C.J. Inoculation with Adapted Bacterial Communities Promotes Development of Full Scale Slow Sand Filters for Drinking Water Production. Water Res. 2024, 253, 121203. [Google Scholar] [CrossRef]
- Piai, L.; Dykstra, J.; Wal, A.; Langenhoff, A. Bioaugmentation of Biological Activated Carbon Filters for Enhanced Micropollutant Removal. ACS EST Water 2022, 2, 2359–2366. [Google Scholar] [CrossRef]
- Park, H.; Kim, T.-Y.; Woo, D.; Cho, Y.-S. Comparison of O3 + GAC, O3 + H2O2 + GAC, and GAC Unit Operation on Natural Organic Matter and Taste and Odor Causing Compounds Removal Using a Pilot Plant Study. Water Supply 2015, 15, 1383–1395. [Google Scholar] [CrossRef]
- Maiyo, J.K.; Dasika, S.; Jafvert, C.T. Slow Sand Filters for the 21st Century: A Review. Int. J. Environ. Res. Public Health 2023, 20, 1019. [Google Scholar] [CrossRef] [PubMed]
- Aslan, S.; Cakici, H. Biological Denitrification of Drinking Water in a Slow Sand Filter. J. Hazard. Mater. 2007, 148, 253–258. [Google Scholar] [CrossRef] [PubMed]
- Nescerecka, A.; Juhna, T.; Hammes, F. Identifying the Underlying Causes of Biological Instability in a Full-Scale Drinking Water Supply System. Water Res. 2018, 135, 11–21. [Google Scholar] [CrossRef] [PubMed]
- Bui, X.T.; Vo, T.P.T.; Ngo, H.H.; Guo, W.S.; Nguyen, T.T. Multicriteria Assessment of Advanced Treatment Technologies for Micropollutants Removal at Large-Scale Applications. Sci. Total Environ. 2016, 563–564, 1050–1067. [Google Scholar] [CrossRef]
- Kapsalis, V.C.; Kalavrouziotis, I.K. Eutrophication—A Worldwide Water Quality Issue. In Chemical Lake Restoration: Technologies, Innovations and Economic Perspectives; Zamparas, M.G., Kyriakopoulos, G.L., Eds.; Springer International Publishing: Cham, Switzerland, 2021; pp. 1–21. ISBN 978-3-030-76380-0. [Google Scholar]
- Oliver, S.; Corburn, J.; Ribeiro, H. Challenges Regarding Water Quality of Eutrophic Reservoirs in Urban Landscapes: A Mapping Literature Review. Int. J. Environ. Res. Public Health 2019, 16, 40. [Google Scholar] [CrossRef]
Disclaimer/Publisher’s Note: The statements, opinions and data contained in all publications are solely those of the individual author(s) and contributor(s) and not of MDPI and/or the editor(s). MDPI and/or the editor(s) disclaim responsibility for any injury to people or property resulting from any ideas, methods, instructions or products referred to in the content. |
© 2026 by the authors. Licensee MDPI, Basel, Switzerland. This article is an open access article distributed under the terms and conditions of the Creative Commons Attribution (CC BY) license (https://creativecommons.org/licenses/by/4.0/).