Abstract
The watersheds of the Senegal River, particularly the Gorgol River, are increasingly affected by hydrological extremes such as floods and soil erosion, pressures that are intensified by ongoing climate change and human activities. This study investigates the hydrological functioning and erosion susceptibility of the Gorgol tributaries to support sustainable watershed management. A multidisciplinary approach was applied, combining spatial analysis of watershed characteristics with hydrological modeling and erosion risk mapping. Key datasets included satellite-derived climate variables, which were validated with ground measurements and integrated with topographic, geological, soil, and land-use data. Climate analysis revealed a pronounced north–south rainfall gradient, with most precipitation occurring between July and September, alongside a +1 °C temperature increase over the past 42 years. Erosion susceptibility was assessed using the Revised Universal Soil Loss Equation, incorporating factors such as rainfall erosivity, soil erodibility, slope parameters, land-cover, and conservation practices. Results indicate that areas in the southern basin and those with fragile soils are most vulnerable, with rainfall erosivity being the primary driver of soil loss. Hydrological study identified flood-prone zones and characterized the regimes. These findings offer a scientific basis for targeted interventions in erosion control and flood risk reduction within the Gorgol basin.
1. Introduction
West Africa has experienced pronounced variability in rainfall over recent decades, with alternating droughts and increasingly frequent high-intensity rainfall events driven by broader climate fluctuations [1,2]. These shifts have intensified hydro-environmental pressures across the Senegal River Basin, particularly within tributaries that remain among the least monitored hydrological systems in Africa [3]. Limited observational data and few detailed basin-scale studies have left significant uncertainties regarding runoff generation, seasonal flood behavior, and sediment dynamics. These knowledge gaps undermine water-resource planning, reduce the effectiveness of risk-mitigation strategies, and constrain efforts to adapt to climate-induced hydrological variability.
A growing body of hydrological research across West Africa further highlights how climate variability and land-surface changes interact to influence runoff dynamics and flood responses. Recent analyses of the West African monsoon point to an intensification of short-duration, high-intensity rainfall episodes, which increase direct runoff and shorten infiltration times in semi-arid and sub-humid catchments [4,5]. Studies conducted in the Senegal River Basin and similar Sahelian systems emphasize the dominant role of convective storms, often producing rainfall intensities that exceed soil infiltration capacity and trigger rapid, high-magnitude flood peaks [6,7]. Land-surface degradation, including vegetation loss and soil crusting, further amplifies these responses by reducing retention capacity and promoting efficient hydrological connectivity between uplands and valley bottoms [8,9]. Remote-sensing analyses and field-based investigations consistently show that flood dynamics are shaped by the interaction between topography, contributing area connectivity, and the presence of slope breaks that channel overland flow downslope [10]. Despite these advances, flood-susceptibility mapping in the Senegal River remains limited, and few studies have jointly assessed hydrological variability, geomorphic changes, and their combined influence on flood hazards. This persistent gap highlights the need for integrated approaches that can better capture how rainfall variability, land-use transitions, and terrain complexity interact to produce flood risks at the basin scale.
The Gorgol and adjacent tributaries illustrate these challenges. Irregular precipitation, the absence of flow-regulation infrastructure, and rapid land-use change have increased the frequency and severity of flooding, accelerated soil erosion, and reduced the reliability of water supplies for agriculture and domestic use (Figure 1), [11,12,13,14]. Soil degradation is already a major regional concern, affecting nearly two-thirds of Sub-Saharan Africa’s cultivated land—about 500 million hectares [15]. In the Senegal River Basin, erosion contributes to declining soil productivity, higher sediment loads during peak flows, and progressive destabilization of riverbanks and valley floors.
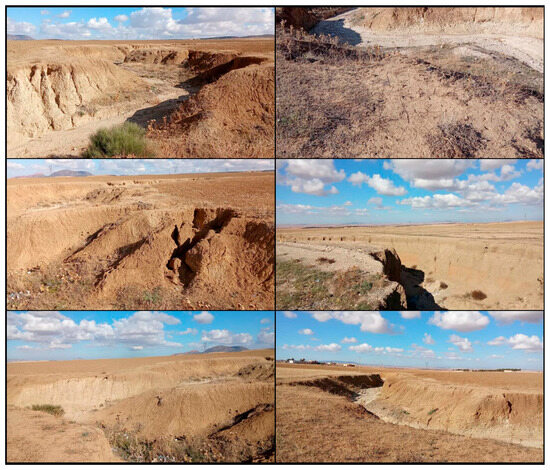
Figure 1.
Gully erosion photos in the Gorgol basin.
Hydrogeomorphic responses in these tributaries are strongly conditioned by the interaction between rainfall intensity and contrasting topographic units—plateaus, glacis, colluvial slopes, and blocky terrain. Earlier conceptual work, including the three-phase erosion–transport–deposition model proposed by Orange [16], highlights the dominant role of seasonal floods in controlling sediment dynamics. However, quantitative assessments linking hydrological patterns with spatially explicit erosion susceptibility remain limited. Bank retreat, rill development, and sediment redistribution have been documented locally, but these processes have not been consistently mapped across the Gorgol Basin.
Several empirical and process-based erosion models—USLE, RUSLE, MUSLE, MMF, SLEMSA, EPM, and PSIAC—are available for evaluating soil-loss dynamics, yet their application in West African tributary basins often remains constrained by data scarcity. The Revised Universal Soil Loss Equation (RUSLE) is widely adopted due to its operational simplicity, flexible input structure, and compatibility with remote-sensing and GIS datasets [17,18,19]. Despite this, its use in large and largely ungauged basins of the Senegal River system is still rare. Most existing work focuses on small or well-instrumented catchments and does not account for hydrological extremes or basin-scale heterogeneity [20,21,22,23,24,25]. As a result, current erosion assessments do not adequately reflect how rainfall variability and local terrain conditions interact to shape spatial erosion patterns.
Recent methodological advances demonstrate that GIS-based computation of RUSLE factors can significantly improve model accuracy, especially in complex terrain [25]. Applications in Ethiopia, Nigeria, and West Africa have shown the value of RUSLE for identifying erosion hotspots and supporting conservation planning [26,27,28,29]. However, no existing study has jointly assessed hydrological behavior, water-availability dynamics, and spatially explicit RUSLE-based erosion susceptibility within the Gorgol Basin or the broader Senegal River tributaries. This knowledge gap limits understanding of the combined roles of climate variability, land-use change, and topography in controlling erosion and flood-related hazards.
To address this gap, the present study develops an integrated hydrological and erosion modeling framework for the uncontrolled tributaries of the Senegal River Basin. The objectives are:
- (i)
- to characterize hydrological conditions and water-availability dynamics under varying rainfall regimes, and
- (ii)
- to map erosion susceptibility using a RUSLE–GIS approach incorporating rainfall erosivity, soil erodibility, topographic factors, land-cover, and conservation practices.
By linking hydrological variability with spatial patterns of soil loss in a basin exceeding 22,000 km2, this study provides new insights into the dominant drivers of land degradation in a poorly monitored region. The results contribute to improved watershed management, support climate-adaptation strategies, and offer a technical basis for prioritizing soil- and water-conservation measures across the Senegal–Gorgol system.
2. Study Area
The study area consists on the Gorgol basin, situated in Mauritania, in the upper valley of the Senegal River (Figure 2). This watershed is classified within a plateau domain, primarily formed by the geological structures of Fouta Djalon, Fantofa, and the Manding Mountains, with elevations ranging from 400 to over 1000 m. The region is markedly dissected, characterized by isolated plateau fragments that reveal a history of varying erosion cycles. In addition to the high plateaus, the region encompasses lower plateaus, including the Mandingue, Assaba, and Tagant, which have elevations between 100 and 400 m. These areas generally display a uniform topographic profile, characterized by flat plateau surfaces and deeply incised valleys that exhibit convex shapes, along with notable hills and mounds. As the terrain approaches watercourses, it transitions into a step-like configuration typical of glacis formations that connect to terraces.
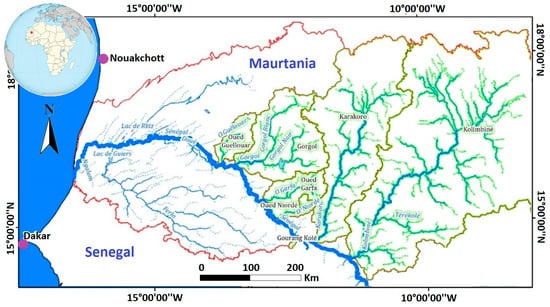
Figure 2.
Geographic location of the Senegal river (blu) basin (green) focusing on the Gorgol sub-basin.
The Gorgol basin consists of both the Gorgol Noir and Gorgol Blanc, with the former being regulated by the Foum Geita dam. Agricultural activities in this area are significantly impacted by erosion, with reports indicating a 33% loss in revenue, prompting 11% of local farmers to abandon their practices. Gorgol experiences a hot, dry desert climate according to the Köppen–Geiger classification, with an average annual temperature of 30.6 °C and average annual precipitation of 539.9 mm (Figure 3). Historical data from 1980 to 2022 highlights particularly warm years, including 1983, 1987, 1998, 2010, and 2021, reflecting cyclical temperature patterns occurring every 11 to 12 years. Additionally, a trend of increasing temperatures has been observed over the 42-year period analyzed, averaging an increase of about 1 °C across the watersheds.
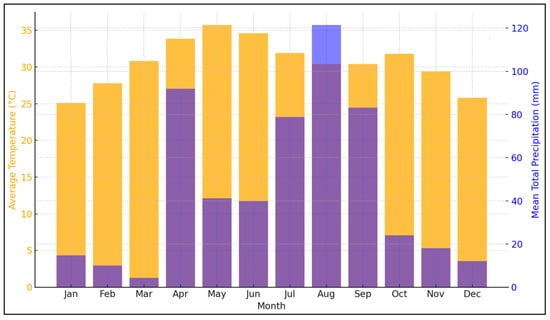
Figure 3.
The average temperature and mean total precipitation, (1981–2022).
The morphological features of the studied basin exhibit distinct concave and convex-concave slopes, with primary topographic elements including plateaus, debris zones, colluvial slopes, and glacis formations. The plateau areas are characterized by extensive, gently sloping terrain with indistinct boundaries and are typically covered by low herbaceous vegetation, which facilitates diffuse runoff. Small, shallow depressions indicative of subsidence within the lateritic crust are also present.
The transition zones between debris areas and colluvial slopes are significant, as they facilitate runoff movement from diffuse flow at the summits to concentrated runoff that actively erodes the armored surface, creating deep incisions. As the flow descends, the debris layer modifies runoff dynamics, reducing water velocity and allowing for the deposition of coarse materials such as stones and gravel transported from higher elevations. During heavy rainfall, liquefaction of underlying clays can occasionally trigger sporadic block slides. The dynamics of these topographic features are further influenced by rotational and sliding failures, primarily due to fractures parallel to the sandstone plateau edge, resulting from thermal and hydroclastic processes, as well as erosion of the softer lateritic layers.
The colluvial zone, located between the debris areas and the glacis, serves as a connector between these two topographical features. Although less prominent than other elements in the upper Senegal River basin, this zone is characterized by a fine matrix and a breakpoint in the slopes. The steep slopes at the foot of the debris gradually soften, forming a wide concavity. In this area, surface hydrodynamics transition from concentrated flow to sheet flow, facilitated by the gentle slope and broad concavity, where water carries detrital materials with greater erosive power compared to the debris zones.
The glacis, situated at the base of the debris and colluvial complex, often merges gradually into the slope. The concavity at this junction is referred to as the “root of the glacis,” with slope values ranging from 0 to 5 degrees, varying from 0 to 2.5 degrees downstream and reaching up to 5 degrees upstream. Features such as rills, flow channels, and spoon-shaped impressions on the glacis suggest a combination of diffuse and concentrated runoff, influenced by the micro-relief. During heavy rainfall, water flows over the lower glacis in a sheet-like manner, while a fluvial terrace lies below this glacis, typically composed of sandy-clay soil that slopes toward the main riverbed of the rivers.
In the Gorgol region, land-use exhibits a varied distribution of different types of land-cover. Notably, permanent crops are virtually nonexistent, comprising 0% of the total land area, while seasonal crops account for a modest 2.96%. Freshwater bodies make up 1.84% of the landscape, and forests and wooded areas cover 4.82%. Interestingly, there are no active mining, quarrying, construction sites, or landfills, all contributing 0% to the land-use profile. Similarly, savannahs are absent, also registering at 0%. A significant portion of the land, approximately 70.97%, is classified as bare or nearly bare soil, indicating extensive areas devoid of vegetation. Sparse steppes and scattered vegetation comprise 18.20% of the region, while human habitats only represent 1.05%. Inland wetlands are minimal, covering merely 0.16%, and there are no industrial, commercial, or transportation zones, including large infrastructures, which similarly account for 0%. This distribution underscores a landscape primarily dominated by bare soil and sparse vegetation, with limited agricultural development and minimal human infrastructure.
3. Materials and Methods
3.1. Overview of the Methodological Framework
The methodological workflow integrates climatic analysis, hydrological data processing, and GIS-based erosion modeling using the RUSLE framework. The approach consists of four main steps:
(i) Acquisition and preprocessing of climatic, hydrological, topographic, soil, and land-cover datasets; (ii) validation and harmonization of multi-source inputs; (iii) computation of hydrological indices and flood-related parameters; (iv) and estimation of soil loss using RUSLE and production of erosion-susceptibility maps.
All spatial operations were performed in ArcGIS 10.8 using a standardized projection system (UTM Zone 28-29, WGS84), and all raster layers were resampled to a common spatial resolution. A workflow summary is provided in Figure 4.
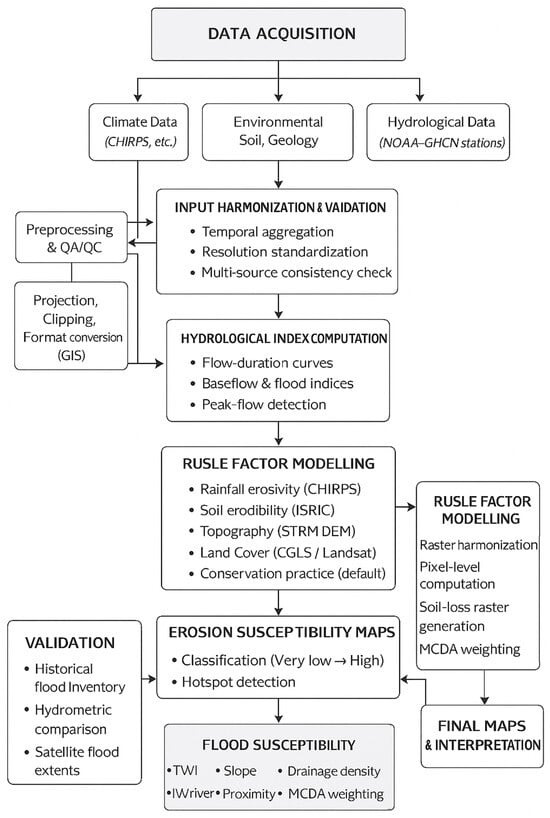
Figure 4.
Methodological workflow of the adopted approach.
3.2. Data Sources and Acquisition
Environmental, Soil, and Geological Data
Soil and geological information was sourced from ISRIC and BRGM, providing harmonized datasets on soil texture, organic matter, structure, and permeability, as well as geological and geomorphological layers. Additional layers; including hydrography, watershed boundaries, land-use, and environmental features; were obtained from BRG, ISRIC, BRGM, and project-specific repositories. Field surveys verified land-use patterns, drainage networks, and selected soil properties.
All datasets were converted to GIS-compatible formats, projected, and clipped to basin boundaries. The final database includes geology, pedology, DEM, land-use, and drainage networks for slope, LS-factor, and soil erodibility computations.
3.3. Climate Data and Analysis
3.3.1. Satellite Climate Products
Climatic variables (precipitation, temperature, evapotranspiration) were extracted from satellite-based Earth observation products, preferred due to sparse ground stations and gaps in long-term records. Validation against ground observations involved: Pairwise comparison of monthly values; computation of correlation coefficients and bias; and visual inspection of time-series agreement.
Only datasets within acceptable deviations, following literature norms, were retained.
3.3.2. Climatic Characterization
Precipitation exhibits a pronounced north–south gradient with limited east–west variation. Temperature ranges from 25.1 °C in January to 35.7 °C in May, occasionally exceeding 42 °C, with extremes up to 52 °C. Minimum temperatures in December–February can reach ~9 °C.
Rainfall is highly seasonal: <15 mm/month from January to March; increasing from April; peaking at ~121 mm in August; decreasing below 25 mm/month by October–December. Interannual variability (1981–2022) indicates a moderate rainfall increase and ~1 °C warming across sub-basins. Climatic indicators informed rainfall erosivity (R factor), hydrological indices, and seasonal flood characterization.
3.4. Hydrometric Data and Discharge Records
Daily river discharge data were compiled from in situ hydrometric stations operated by regional water authorities in Mauritania. All observations originate from ground-based gauging stations, ensuring that the dataset reflects direct hydrometric measurements rather than derived or proxy information. In this study, three stations distributed along the Gorgol–Senegal River system were selected for analysis.
The Kaedi_J1 station covers the period from 1 January 1990 to 17 February 2001 and shows a mean discharge of approximately 5 m3/s. The Podor_J1 station provides the longest and most continuous record, extending from 19 June 1903 to 8 September 2022, with a slightly higher average discharge of about 6 m3/s, consistent with its downstream position and the larger contributing catchment area. By contrast, the Podor_J2 station spans a shorter interval, from 3 September 2000 to 18 February 2001, and exhibits a lower mean discharge of roughly 4.5 m3/s.
Overall, the discharge data are suitable for hydrological analysis, as they were collected using standardized gauging methods commonly applied by national hydrological services and river basin authorities. However, some limitations remain, including temporal gaps, heterogeneity in record length across stations, and increased uncertainty during extreme flow conditions due to rating-curve extrapolation. To address these issues, the dataset was subjected to systematic quality control procedures, temporal consistency checks, and the removal of anomalous or suspect values.
The processed time series were subsequently used to derive key hydrological indicators, such as baseflow components, flow-duration curves, and flood-frequency metrics. Flood events were identified using discharge-based thresholds and incorporated into the flood-susceptibility mapping framework.
3.5. Soil Erosion Modeling Using RUSLE
3.5.1. General Formulation
Soil loss was estimated using RUSLE [17], expressed as:
where A is mean annual soil loss (t*ha−1*yr−1), and R, K, LS, C, and P are rainfall erosivity, soil erodibility, topographic factor, cover-management factor, and conservation-practice factor, respectively. Each factor was mapped as an independent raster layer before integration.
A = R × K × LS × C × P
3.5.2. Rainfall Erosivity (R Factor)
The R factor (MJ*mm*ha−1*h−1*yr−1) was computed from validated monthly precipitation using empirical equations adapted to tropical and semi-arid basins. Monthly erosivity values were summed to obtain annual R, and spatial interpolation (IDW/kriging) produced continuous erosivity surfaces. Validation compared results with regional R values reported in the literature.
In its original formulation, the R factor is derived from the EI30 index, defined as the product of the total storm energy (E) and the maximum rainfall intensity in 30 min period. Expressed in MJ.mm.ha−1.h−1.yr−1, the R factor is calculated using the (Equation (2)):
where (EI30)i represents the total kinetic energy of storm i multiplied by its maximum 30 min rainfall intensity, j is the number of storms recorded during the reference period N.
Implementing this formulation requires long-term rainfall records with 30 min temporal resolution. However, as highlighted in the literature, very few studies have been able to determine the R factor using the original method proposed by Wischmeier and Smith [20], mainly due to the limited availability of high-resolution rainfall data. Consequently, several researchers have developed empirical relationships between the R factor and monthly or annual rainfall.
Various formulations have been proposed depending on the regional context established a relationship between annual rainfall (P) and the R factor [21] (Equation (3)):
R = 0.5 P ± 0.05
Similarly, El Yacoubi [22] proposed a formulation for calculating R from the annual maximum rainfall as (Equation (4)):
R = 0.0483 × P1.610
To estimate annual rainfall at the watershed scale, several types of precipitation data can be employed, including long-term ground-based records, satellite-derived datasets such as Climate Hazards Group InfraRed Precipitation with Station data (CHIRPS) (https://www.chc.ucsb.edu/data/chirps, accessed on 1 October 2025), and gridded climatological databases such as WorldClim (www.worldclim.org, accessed on 1 October 2025).
Given the practical limitations of applying the original formulation by Wischmeier and Smith [20], this study adopts an empirical approach based on annual rainfall data. The Roose [21] model was excluded, as it is not suitable for regions located in transitional rainfall zones or along oceanic fronts, where its assumptions are not valid. The formulations proposed by El Yacoubi [22] and Sanchez Moreno [30] exhibit comparable structures and yield similar results. For this reason, we retained the El Yacoubi model, after verifying that applying Sanchez Moreno’s formulation produced no significant differences in the spatial distribution of predicted erosion.
The CHIRPS satellite dataset was ultimately selected for the computation of the R factor following a comparative analysis of various rainfall sources. Based on these data, a rainfall erosivity map for the study area was generated in raster format (Figure 5a).
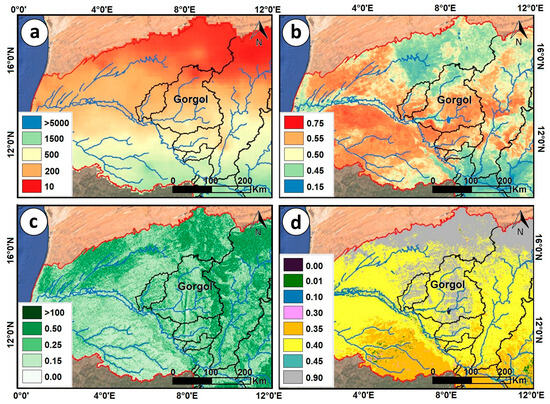
Figure 5.
(a) Rainfall erosivity map (R factor); (b) Soil erodibility map (K factor); (c) Topographic factor map (LS factor); (d) Cover management factor map (C factor), [0: Water; 0.01: Urban and forest; 0.1: Herbaceous wetland; 0.3: Cropland; 0.31: Scrubland; 0.39: Herbaceous vegetation; 0.45: No canopy, no covers; 0.9: Bare/sparse vegetation].
3.5.3. Soil Erodibility (K Factor)
The K factor, representing soil susceptibility to detachment, was calculated using ISRIC soil texture, organic matter, and structure classes. Soil texture was categorized per the USDA system, and K values were assigned following standard nomograms.
Several studies have estimated the K factor (which represents the intrinsic susceptibility of soils to erosion) using various global and regional soil databases. Some authors derived their estimates from the SoilGrids database of the International Soil Reference and Information Centre (ISRIC). For example, Adamou et al. [31] used the African Soil Erodibility Map, while Thiaw et al. [32] and Hara et al. [33] extracted soil data from the FAO Harmonized World Soil Database. The DHI [34] study relied on the FAO digital soil map, integrating it with a K-value table derived from RUSLEFAC. In another approach, El Yacoubi [22] computed the K factor using the (Equation (5)):
K = (% sand + % silt) (% clay)/100
In the present study, the K factor was estimated using the Wischmeier formulation (Equation (6)), which allows for a more detailed integration of soil texture, structure, organic matter, and permeability:
where M = (% silt + % very fine sand) × (100 − % clay)
K = (2.1 × (M1.14).(10 − 4) × (12 − MO) + 3.25.(S − 2)+2.5.(P − 3))/100
MO = percentage of organic matter
S = soil structure code (1: very fine, 2: fine, 3: medium, 4: coarse)
P = soil permeability class (1: rapid, 5: very slow)
The estimation of the soil erodibility factor (K) was carried out based on this Wischmeier formulation. The required soil texture fractions (sand, silt, and clay) and the organic matter content were directly extracted from the ISRIC SoilGrids database, ensuring spatial consistency and global comparability (Figure 5b).
The soil structure parameter (S) was determined through the interpretation of textural classes derived from the SoilGrids database, while the permeability parameter (P) was estimated by analyzing the combinations of soil texture and organic matter content, (Figure 6, Table 1).
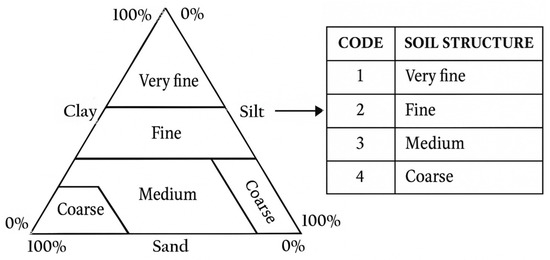
Figure 6.
The soil structure parameter (S).

Table 1.
The interpretation of textural classes through permeability.
3.5.4. Topographic Factor (LS Factor)
Slope length and steepness (LS) were derived from high-resolution DEMs. Flow accumulation and slope gradient were computed, and the Desmet and Govers algorithm [35] was applied to account for complex terrain. LS surfaces were visually inspected for DEM artifacts. This Slope Length and Steepness factor, which accounts for the combined effects of slope length (L) and slope steepness (S) on soil erosion, is typically derived from Digital Elevation Models (DEMs). In most studies, this factor has been computed using DEMs obtained from the Shuttle Radar Topography Mission (SRTM) with a spatial resolution of 3 arc-seconds (approximately 30 m). Adamou et al. [32] applied the formulations proposed by Desmet and Govers [35] and Renard et al. [17], while DHI [34] adopted the approach of Stone and Hilborn [36] to estimate the LS factor from SRTM data. In the present study, the LS factor was generated using the available topographic datasets, of 30 m-resolution DEM by SRTM data. The computation of the LS factor was carried out using Wischmeier and Smith formulation in the ArcGIS 10.8 software. The applied equations, evaluated at the pixel level (i, j), are as (Equations (7)–(9)):
θ is the slope angle (in degrees), A is the upslope contributing area, D is the cell size, and, ; Where αi,j represents the aspect angle of the cell.
This procedure ensures a physically consistent estimation of topographic influence on erosion processes by integrating both local slope gradients and contributing flow accumulation areas. The resulting LS factor map, (Figure 5c), illustrates the spatial variability of topographic control on erosion across the River Basin, highlighting areas with steeper slopes and longer flow paths that exhibit higher erosion potential.
3.5.5. Cover-Management Factor (C Factor)
Cover-Management factors were assigned based on recent land-use/land-cover (LULC) maps. Classes (cropland, forest, savannah, bare soil, settlements, water) were matched with literature values, refined using field observations. These factors were assigned based on recent land-use/land-cover (LULC) maps. Classes (cropland, forest, savannah, bare soil, settlements, water) were matched with literature values, refined using field observations. Fenta et al. [25] utilized a land-cover map provided by the Copernicus Global Land Service (CGLS), derived from PROBA-V data at a resolution of 100 m. Similarly, Adamou et al. [32] and Hara et al. [33] employed Landsat 8 imagery to generate land-use maps, which were then used to determine the cover management factor (C). DHI relied on the “ESA CCI” land-cover map, which has a resolution of 300 m, assigning C values to various vegetation cover classes based on existing literature.
The land-use map produced from CGLS data serves to identify the predominant types of land-use. The C factor values are derived from bibliographic sources, including Renard et al. [17] and Wischmeier and Smith [20], as well as adaptations specific to the local context of the basin. Dense forests are characterized by a C factor of 0.01, indicating a minimal risk of erosion (Figure 5d). Open forests also maintain a low C factor of 0.01, comparable to urban areas and water bodies, which share the same factor. In contrast, shrub savannas exhibit a higher C factor of 0.39, suggesting a moderate risk of erosion. Wetland areas are assigned a C factor of 0.25. Cultivated land, particularly rain-fed agricultural zones, has a C factor of 0.25, while areas under irrigation show a significantly elevated factor of 0.45, highlighting their increased vulnerability to erosion. Additionally, regions subjected to slash-and-burn agriculture are similarly at a heightened risk, with a C factor of 0.45. Collectively, this data underscores the diverse levels of erosion risk associated with various land-uses.
3.5.6. Conservation Practice (P Factor)
P factors were assigned using slope-based categories, reflecting standard conservation practices (contour farming, terracing, strip cropping) in semi-arid basins. According to Fenta et al. [25], “the P factor can be derived from satellite image classifications or previous field-based reports. However, at regional scales, the quantity and spatial distribution of conservation structures (bunds, terraces, contour farming) cannot yet be mapped with sufficient precision.” For example, Hurni [37,38] reported that recent attempts to automatically map conservation structures in the Ethiopian Highlands using high-resolution satellite imagery were unsuccessful due to the low accuracy of the resulting maps. Consequently, the P factor is rarely included in large-scale soil erosion assessments [39] and is generally regarded as the least reliable parameter among the RUSLE factors.
Given the lack of detailed spatial data and the large extent of the study area, the P factor was therefore set to 1 in this study. This assumption corresponds to the absence of specific conservation practices and implies that the existing land management measures have a neutral effect on erosion reduction at the basin scale.
At smaller scales, however, the P factor can be adjusted to reflect the effectiveness of soil and water conservation practices in reducing runoff and erosion, as well as the influence of local slope gradients. Wischmeier and Smith [20] derived reduction coefficients for different conservation methods based on extensive plot-scale experiments. These empirical relationships remain a key reference in soil erosion modeling (Table 2).
Table 2.
P-factor values for various conservation practices and slope ranges [20].
Table 2 highlights how contour-based and terracing practices can significantly reduce soil erosion compared to non-conservation land-use, particularly on moderate slopes. However, due to data limitations at the regional scale of this study, such differentiation could not be spatially implemented.
3.6. Integration and Mapping of Soil Loss
Raster layers for all factors were harmonized and combined in ArcGIS using the RUSLE multiplicative formula. Outputs include: Spatial distribution of predicted annual soil loss; classification into erosion-susceptibility classes (very low to very high); and identification of erosion hotspots to support conservation planning.
3.7. Hydrological Data Analysis
Hydrological conditions within the Gorgol basin were assessed using specific discharge records from the main tributaries. These data were processed to characterize both the magnitude and temporal variability of streamflow. Seasonal patterns were also examined to distinguish baseflow contributions from episodic high-flow events. Streamflow generally increased during winter and early autumn, reflecting periods of higher rainfall, while the late spring and summer months were dominated by markedly reduced flows or near-dry conditions. These seasonal and inter-annual dynamics provided the basis for understanding flood-generating mechanisms within the basin.
3.8. Flood Susceptibility Assessment
Flood susceptibility was mapped using a multi-criteria decision analysis (MCDA) approach designed to incorporate the principal physical controls on flood occurrence. Four indicators were selected based on their relevance to runoff generation and flow concentration:
3.8.1. Topographic Wetness Index (TWI)
Topographic Wetness Index (TWI): used to identify areas with a high likelihood of soil saturation and runoff accumulation. The TWI is calculated from a DEM using (Equation (10)):
TWI = ln (As/tanβ)
With As = upslope contributing area per unit contour width (m2/m).
And β = local slope angle (radians).
TWI expresses the potential for water accumulation in the landscape. High TWI values indicate areas where water is likely to pool or remain saturated (valleys, flat zones), while low values correspond to well-drained, steep areas where water is rapidly evacuated.
3.8.2. Slope
Slope: a key factor determining runoff velocity and the potential for rapid overland flow. Slope is a fundamental topographic parameter that strongly influences surface runoff dynamics. Steeper slopes increase gravitational force on flowing water, leading to higher runoff velocity and a greater likelihood of rapid overland flow. Conversely, gentle slopes slow down runoff, promoting infiltration and reducing erosion risk.
The slope derived from a DEM is commonly calculated as (Equation (11)):
where ∂z/∂ and ∂z/∂y are the elevation gradients in the x and y directions.
Slope = arctan ((∂z/∂x)2 + (∂z/∂y)2)1/2
3.8.3. Drainage Density (DD)
Drainage Density (DD): representing the degree of hydrological connectivity and the efficiency of the drainage network. It also reflects how well a landscape is dissected by streams and channels, serving as an indicator of hydrological connectivity and the efficacy of water evacuation. Areas with high drainage density tend to transfer runoff quickly and are often associated with limited infiltration and higher erosion potential. In contrast, low drainage density suggests weaker channel development, slower runoff concentration, and greater opportunities for water storage or infiltration. DD is calculated as (Equation (12)):
where Ltotal = total length of all streams in the basin (km), and A = basin area (km2).
DD = Ltotal/A
3.8.4. Proximity to Rivers and Tributaries
Proximity to Rivers and Tributaries: indicating zones exposed to inundation during periods of channel overflow. It is a spatial indicator used to identify areas more susceptible to flooding during periods of channel overflow. Locations closer to riverbanks are typically exposed to higher inundation risk due to their immediate connection to rising water levels, while zones farther away generally experience reduced flood impact unless affected by extreme events or poor drainage.
A simple distance-based expression is commonly used (Equation (13)):
where D = distance from any point; (x,y) to the nearest river or tributary (m).
D = dist (x,y; river)
Each dataset was standardized to ensure comparability among indicators and combined through a linear additive model. The weighting of parameters was guided by expert knowledge and supported by findings from hydrological research conducted in comparable semiarid environments. The resulting composite index was classified into four susceptibility levels (low, moderate, high, and very high) using thresholds informed by historical flood evidence and hydrometric observations.
3.8.5. Weighting and Scoring Method for Flood Susceptibility
To combine the four indicators (TWI, slope, drainage density, and proximity to rivers) into a single flood susceptibility index, a weighted linear combination (WLC) was applied. This method is widely used in MCDA-based hydrological mapping and enables each factor to contribute proportionally to its relative importance.
3.8.6. Standardization of Each Indicator
Each factor was transformed to a normalized scale between 0 and 1 to allow comparison:
Xnorm = X − Xmin/Xmax − Xmin
Higher values correspond to higher susceptibility, so distance-to-river was inverted:
Dnorm = 1 − (D − Dmin/Dmax − Dmin)
Thus, areas closest to rivers receive values near 1 (highest susceptibility).
3.9. Model Validation
To evaluate the reliability of the flood susceptibility map, several independent validation sources were used:
Historical Flood Inventories, which were spatially overlaid on the susceptibility classes to examine the correspondence between documented flood locations and predicted high-risk zones.
Hydrometric Discharge Data, used to verify whether areas experiencing frequent or intense flow events were consistently identified as highly susceptible.
Satellite-Derived Observations, where available, to confirm inundation extents during major rainfall episodes.
Together, these validation steps were used to ensure the robustness and credibility of the susceptibility model prior to its interpretation.
4. Results and Discussion
4.1. Implementation of the RUSLE Method in the Gorgol Basin
All datasets used in the modeling workflow were harmonized to a spatial resolution of 30 m, ensuring full compatibility among the input layers (Figure 5). Factor overlays and raster calculations were performed in ArcGIS, and the resulting water-erosion susceptibility map (Figure 7) expresses mean annual soil loss in tons per hectare per year (t·ha−1·yr−1). These values represent long-term averages and therefore do not capture short-duration, high-intensity events that may locally produce extreme erosion.
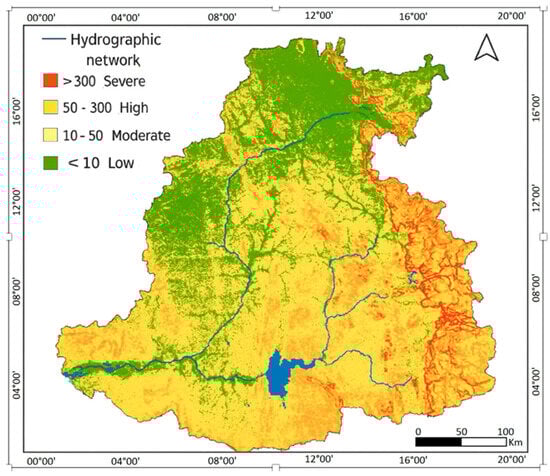
Figure 7.
Erosion susceptibility map in the Gorgol watershed.
To facilitate interpretation, erosion estimates were grouped using thresholds commonly adopted in regional and continental studies: values below 10 t·ha−1·yr−1 indicate low erosion, while rates exceeding 300 t·ha−1·yr−1 correspond to severe erosion. A mild spatial smoothing filter was applied to the outputs to reduce isolated pixel noise without altering major spatial trends.
The erosion sensitivity map clearly reflects the strong north–south rainfall gradient that shapes erosive dynamics across the Gorgol Basin (Figure 7). As documented in many tropical environments, rainfall erosivity (R factor) is the dominant component of annual soil loss. In this study, R values derived from CHIRPS data range from roughly 300 to more than 850 MJ·mm·ha−1·h−1·yr−1. The southeastern hillslopes register the highest erosivity, frequently exposed to intense convective storms, whereas the central lowlands exhibit comparatively subdued levels. This gradient implies that the most exposed sectors receive three times the erosive rainfall energy observed in the most sheltered zones.
Soil erodibility (K factor) also shows pronounced spatial variability. Estimated K values span 0.015–0.045 t·ha·h·ha−1·MJ−1·mm−1, with the highest erodibility concentrated in fine-textured soils poor in organic matter. These materials are structurally weak and highly prone to detachment under raindrop impact. In contrast, coarser and better-aggregated soils in the basin’s northwest display lower K values and thus greater natural resistance.
Topographic influence is evident in the LS factor derived from the 30 m DEM. LS values range from near zero across the wide alluvial plains to more than 25 on steep, dissected eastern slopes. Areas combining sharp gradients and long contributing flow paths show the strongest topographic amplification of runoff energy, fostering accelerated surface flow and high shear stress.
Land-cover plays a further regulatory role. Forested areas (both dense and open) maintain very low C values (0.01), providing the most effective protection against soil detachment. Shrub savannas (C ≈ 0.39) and wetlands (C ≈ 0.25) offer moderate buffering, while irrigated croplands and zones affected by slash-and-burn practices, which reach C ≈ 0.45, exhibit limited vegetative shielding. Due to the lack of detailed information on conservation measures, the P factor was kept uniform at 1 across the basin.
The resulting susceptibility map reveals strong spatial contrasts. Roughly 45–50% of the basin falls into low to moderate susceptibility classes, primarily in the central and northwestern sectors. These areas combine gentle slopes (<5°), broad valley systems, and some vegetation cover, which reduce runoff velocity and limit erosive potential.
By contrast, the eastern and southeastern sectors display the highest susceptibility levels. Nearly 20% of the basin (mostly within these areas) belongs to high or very high susceptibility classes. Steep slopes (>15°), rugged terrain, and a dense drainage network intensify flow concentration, promoting rill, gully, and sheet erosion. The clustering of these high-susceptibility zones highlights the strong geomorphic control exerted by local relief and the limited presence of stabilizing vegetation.
Hydrographic corridors represent additional hotspots. Several main drainage lines align with elongated belts of elevated susceptibility, particularly in the central and southern parts of the watershed. Frequent channel incision and repeated high-flow episodes expose adjacent slopes to lateral erosion. Near the reservoir, susceptibility increases along converging flow paths, signaling an enhanced risk of sediment delivery and raising concerns regarding accelerated siltation.
A sub-watershed breakdown reveals further differentiation. Northern and northwestern sub-basins consistently show low susceptibility due to stable geomorphology and protective vegetation. Downstream units exhibit a more heterogeneous pattern driven by abrupt slope transitions, variable soil characteristics, and the expansion of agriculture onto erodible substrates. The eastern fringe remains the most critical hotspot, where steep topography and tightly spaced drainage channels jointly promote rapid soil loss and localized mass movements.
These results carry clear implications for land and water management. High-susceptibility sectors should be prioritized for targeted interventions such as terracing, reforestation, controlled grazing, and slope-stabilization structures. Moderate-susceptibility areas require preventive action to avoid future degradation under increasing land-use pressure. Low-susceptibility zones should be preserved, as their gentle relief and vegetation play an essential role in buffering runoff and reducing sediment transfer toward the reservoir and downstream ecosystems.
4.2. Hydrological Variability
4.2.1. Weighting of Indicators and Weight Matrix
To ensure transparency and reproducibility of the multi-criteria decision-making (MCDM) procedure, the relative importance of the flood susceptibility indicators was formalized using a pairwise comparison matrix, following the principles of the Analytic Hierarchy Process (AHP). The matrix was constructed based on hydrological relevance reported in the literature for semiarid basins, expert judgment, and the observed spatial correspondence between historical flood occurrences and each predictor.
Flood generation in the Gorgol Basin is primarily controlled by runoff concentration and soil saturation processes, which justify the dominant role assigned to the Topographic Wetness Index (TWI) and proximity to rivers. Drainage density plays a key role in flood propagation and response time, while slope exerts a secondary but non-negligible influence by controlling runoff velocity and infiltration capacity (Table 3).
Table 3.
Pairwise comparison matrix of flood susceptibility indicators.
The values in the matrix express the relative dominance of one indicator over another using Saaty’s fundamental scale. For example, TWI is considered moderately more important than proximity to rivers and strongly more important than drainage density and slope, reflecting its role in identifying saturation-prone areas and runoff accumulation zones.
The pairwise comparison matrix was normalized, and the final weights were obtained by averaging the normalized rows. A consistency check was performed to ensure logical coherence of the judgments, yielding a Consistency Ratio (CR) below the commonly accepted threshold of 0.10, indicating satisfactory consistency (Table 4).
Table 4.
Final weights of flood susceptibility indicators.
These weights were subsequently used in the weighted linear combination model to compute the composite Flood Susceptibility Index (FSI).
4.2.2. Weighted Linear Combination Model
The composite flood susceptibility index (FSI) was calculated as:
where all indicators were previously normalized to a common scale between 0 and 1. The resulting FSI values range from 0 (low flood susceptibility) to 1 (very high flood susceptibility).
FSI = 0.35 TWInorm + 0.30 Dnorm + 0.20 DDnorm + 0.15 Slopenorm
4.3. Reclassification into Susceptibility Classes
Thresholds were derived from:
- natural breaks in the data distribution,
- hydrological reasoning (TWI > 11, DD > 2.5 km/km2),
- spatial coincidence with historical flood inventories and satellite flood maps (Table 5).
Table 5. Flood Susceptibility Index (FSI) Classification and Interpretation.
The analysis of specific discharge records across the Gorgol basin shows marked hydrological variability between upstream and downstream tributaries. Most headwater streams maintain persistently low flows, with specific discharges rarely exceeding 2 L/s/ha. By contrast, downstream tributaries exhibit pronounced fluctuations in response to rainfall inputs, with peak discharges rising to values above 0.9 m3/s during wet periods (Figure 8). Seasonal variations are clearly defined: average discharges during winter and early autumn were 3–5 times higher than those measured in late spring and summer, when flows frequently dropped below 0.1 m3/s or became intermittent. This strong seasonality underscores the dominance of rapid surface runoff and the limited influence of sustained baseflow during dry months.
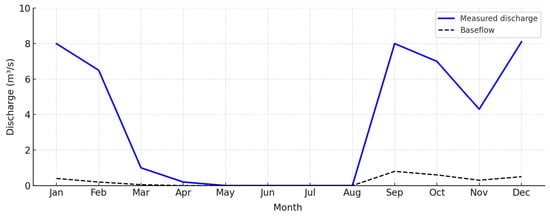
Figure 8.
Long-term series from 19 June 1903 to 8 September 2022, of the Podor_J1 station.
The flood susceptibility map derived from the MCDA framework reveals distinct spatial patterns throughout the main river course, primary and secondary tributaries of the watershed (Figure 9). Approximately 42% of the basin falls into the null to low-susceptibility class, largely corresponding to gently sloping uplands and well-drained terrain. Moderate susceptibility accounts for roughly 25%, forming broad transitional zones surrounding the central basin. High and very high susceptibility classes jointly represent about 33% of the total area. These more vulnerable zones are concentrated along densely structured drainage corridors, at sub-basin confluences, and across low-lying depressions adjacent to major tributaries of the River. The convergence of steep slopes, elevated TWI values, and high drainage density in these sectors results in spatial clusters that are highly prone to rapid flow accumulation and inundation.
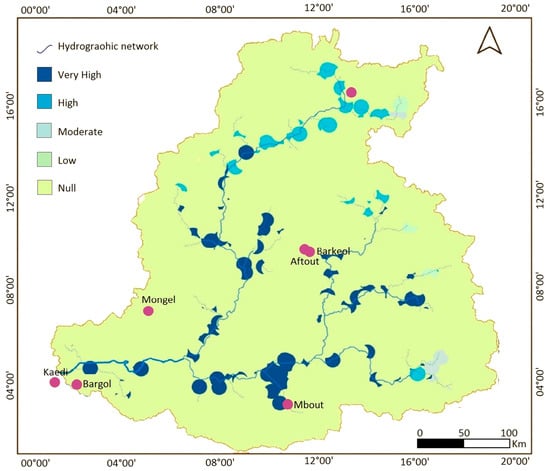
Figure 9.
Flood-Prone Areas Map of the Gorgol Basin.
The cities of Kaedi, Barogal, Barkewol, and Mbout face a direct and growing threat from seasonal flooding. During the rainy season, these flood events are becoming more frequent and intense, often escalating into severe storms. This troubling trend is closely linked to broader shifts in regional weather patterns, driven by the ongoing impacts of climate change. The persistent lack of maintenance and dredging of these waterways has significantly worsened the overall situation.
The relative contribution of each indicator to the composite index mirrors the hydrological behavior observed in the field. Areas characterized by TWI values exceeding 11, slopes steeper than 18–20°, and drainage densities above 2.5 km/km2 consistently align with the high-susceptibility classes. Proximity analyses show that nearly 70% of historically flooded locations occur within 250 m of a permanent or seasonal watercourse. These spatial relationships highlight the strong hydro-geomorphic coupling that governs flood generation in the basin.
Hydrological dynamics within the sub-watersheds further illustrate the heterogeneity of flood responses. Several downstream sub-basins (especially those feeding directly into the Gorgol River) concentrate runoff rapidly during storm events, producing peak discharges that commonly reach 0.91 m3/s and in some years exceed 1.2 m3/s. This behavior contrasts with upstream areas, where peak flows remain significantly lower and flood propagation is more attenuated. The geometry of the drainage network plays a decisive role: sub-basins with elongated shapes and high bifurcation ratios show faster and more synchronized hydrograph responses, amplifying downstream flood hazards.
Observed flood impacts confirm the severity of these hydrological conditions. Recurrent inundations have led to extensive soil erosion, loss of croplands, and damage to rural infrastructure. Sediment transport has intensified in high-susceptibility sectors, contributing to the gradual infilling of rivers, lakes, and reservoirs (including the Foum Gleita dam). Recent events illustrate these vulnerabilities. The 2022 flood season, one of the most destructive in recent decades, affected 31 high-alert localities across the basin. The F. Gleita–Kaedi sector was particularly impacted, as exceptional inflows combined with the full closure of the Kaedi gate bridge at maximum water level, producing widespread inundation and additional structural damage. These observations align with the spatial predictions of the susceptibility model, providing strong validation of its reliability.
4.4. Integrated Soil Erosion and Flood Susceptibility Mapping in the Gorgol Basin
The integrated assessment of soil erosion intensity and flood susceptibility offers a robust and operational framework for identifying priority intervention zones within the Gorgol Basin (Figure 10). The combined zoning highlights hydro-sedimentary hotspots where moderate to severe erosion overlaps with high to very high flood potential, revealing areas exposed to compounded degradation and hazard. These critical zones are predominantly located along major river corridors, floodplains, sub-basin confluences, and slope–valley transition areas, where intense rainfall promotes rapid runoff concentration, enhances soil detachment on hillslopes, and triggers downstream inundation.

Figure 10.
Integrated Map of Flood-Prone Areas and Soil Erosion Susceptibility in the Gorgol Basin.
In the eastern and southeastern sectors of the basin, steep gradients, high LS values, dense drainage networks, and weakly protected soils act in concert to intensify both hillslope erosion and flood propagation. These conditions favor the rapid transfer of sediments toward downstream reaches, increasing channel instability and flood impacts. In such areas, effective management should focus on upstream interventions, including reforestation, terracing, controlled grazing, and slope-stabilization measures aimed at reducing runoff velocity and sediment yield at the source.
By contrast, the central lowlands are characterized by moderate erosion rates but elevated flood susceptibility, largely driven by high soil moisture conditions, low relief, and close proximity to river channels. In these zones, flooding is primarily governed by saturation excess and lateral flow processes rather than slope-controlled erosion. Management strategies should therefore emphasize floodplain zoning, channel maintenance, sediment retention structures, and the preservation of natural storage areas to attenuate flood peaks and limit sediment redistribution.
The spatial convergence of erosion-prone slopes and flood-susceptible lowlands confirms the role of flood-prone areas as key sediment transfer and deposition pathways, linking upland erosion sources to downstream floodplains, agricultural lands, and reservoirs. This coupling highlights the limitations of sectoral approaches that address erosion or flooding in isolation. Instead, the integrated soil erosion–flood potential zoning provides a decision-support tool that enables coordinated planning, supports the prioritization of nature-based and structural measures, and enhances the resilience of land and water systems under increasing hydro-climatic variability.
4.5. Comparison with Previous Studies
These results are in line with flood susceptibility assessments in semi-arid African basins, such as the Senegal River catchment [39,40] and the Niger Inner Delta [41,42], where topography, drainage density, and proximity to rivers were key determinants of spatial flood patterns [43]. The inclusion of TWI and weighted overlay GIS approaches confirms the consistency of our methodology with established practices in similar climatic and geomorphic settings [44]. Observed impacts, including soil erosion, cropland loss, and infrastructure damage (Foum Gleita dam, Kaedi–Gorgol sector), highlight the practical relevance of the susceptibility maps for land and water management. Targeted interventions should prioritize high-susceptibility areas, while moderate zones require preventive measures and low-susceptibility zones need preservation [45].
The spatial patterns of soil erosion susceptibility identified in the Gorgol Basin align closely with RUSLE-based assessments from other semi-arid African river systems, particularly the Senegal and Niger River basins. In these regions, rainfall erosivity and topographic forcing are widely recognized as the primary controls on soil loss, with the highest erosion rates occurring on steep, dissected uplands and along convergent hillslope–channel transition zones [17,46]. This pattern reflects the combined effect of intense convective rainfall and concentrated surface runoff, characteristic of Sahelian hydrological conditions [47,48].
The observed spatial variability of soil erodibility in the Gorgol Basin, with elevated K-factor values in fine-textured, weakly structured soils low in organic matter, is consistent with findings from similar semi-arid landscapes in West Africa [49,50]. Such soils are particularly prone to detachment by raindrop impact, especially when surface crusting occurs during the rainy season. The pronounced influence of the LS factor further confirms the critical role of slope gradient and slope length in amplifying erosion processes, in agreement with regional and continental-scale studies [20,51].
The mitigating effect of vegetation cover observed in this study also supports previous research demonstrating the protective function of forested and savanna ecosystems in reducing runoff velocity and soil detachment, whereas cultivated or degraded lands with limited surface cover are highly susceptible to erosion [52]. Furthermore, the clustering of high erosion susceptibility along major drainage corridors and near reservoir inflows parallels reports from other Sahelian basins, highlighting enhanced sediment transfer to downstream channels and storage infrastructures, often resulting in accelerated siltation [53,54].
5. Adaptation and Mitigation Practices
Adaptation and mitigation efforts in the Gorgol Basin should be prioritized in areas identified as highly susceptible to both soil erosion and flooding. On the steep eastern and southeastern slopes, where concentrated runoff and dense drainage networks exacerbate soil loss, key interventions include terracing, contour bunding, and cover cropping to reduce detachment, complemented by small check dams or gabions in critical tributaries to slow flow and encourage sediment deposition. In low-lying flood-prone farmlands and urban areas along major drainage corridors (particularly near Kaedi, Barkewol, and Mbout) micro-retention basins, riparian buffer strips, and targeted channel modifications are recommended to manage seasonal inundation and safeguard infrastructure.
These site-specific measures combine soil and water conservation with flood mitigation to enhance both ecological and socio-economic resilience. By aligning interventions with mapped vulnerability zones, management efforts can be efficiently focused to minimize sediment transfer, reduce infrastructure damage, and strengthen adaptive capacity across the basin’s most at-risk areas.
6. Conclusions
This study of the Gorgol watershed tributaries has provided insights into the spatial variability of flow dynamics and soil erosion processes within a semi-arid basin. Through the characterization of sub-watersheds, thematic mapping, and hydrological analysis, we produced a spatially explicit assessment of both erosion and flood susceptibility. Application of the RUSLE model enabled quantification of soil loss across the basin and identification of the most vulnerable zones, while hydrological analyses highlighted key patterns of discharge, hydrograph dynamics, and flood occurrences. These findings collectively enhance understanding of how geomorphology, land-cover, and drainage networks interact to shape erosion and flood processes in semi-arid African basins.
From a scientific standpoint, the integrated use of GIS-based RUSLE modeling with multi-criteria flood susceptibility analysis provides a reproducible and adaptable framework for risk assessment in comparable watersheds. This approach demonstrates the potential for combining physically based erosion modeling with hydrological risk mapping to inform basin-scale management and support evidence-based decision-making. The study also yields several practical implications for sustainable watershed management. Integrated interventions tailored to sub-basin-specific conditions can optimize water resource protection and rehabilitate degraded hydrosystems. Conservation measures, including restricted-use zones and buffer establishment, can safeguard ecologically sensitive areas. Restoration of degraded landscapes (such as bare lands, steep slopes, and headwater zones) using nature-based techniques can enhance ecological resilience. Moreover, community engagement and awareness initiatives are essential to mitigate unsustainable practices such as bush burning, deforestation, artisanal mining, and overgrazing. Continuous monitoring and research are necessary to refine understanding of hydrological and geomorphological dynamics, enabling adaptive and evidence-driven management. Despite these contributions, the study has some methodological limitations. The RUSLE model provides long-term average estimates and may not capture short-duration, high-intensity storm events or localized mass movements. The weighting of flood susceptibility indicators relies on expert judgment and literature-derived assumptions, which may introduce uncertainties. Data gaps, particularly in high-resolution discharge measurements and records of conservation practices, may affect the precision of spatial predictions. This research establishes a site-specific framework for managing soil erosion and flood susceptibility in the watershed. By linking environmental processes with socio-economic realities, the study provides actionable insights for sustainable basin management and highlights opportunities for further research to reduce uncertainties and strengthen adaptive planning.
Author Contributions
Conceptualization, M.A.E.M.A.; methodology, M.A.E.M.A.; software, M.A.E.M.A.; validation, M.A.E.M.A., R.H. and M.B.; formal analysis, M.A.E.M.A.; investigation, M.A.E.M.A.; resources, M.A.E.M.A.; data curation, M.A.E.M.A.; writing—original draft preparation, M.A.E.M.A.; writing—review and editing, R.H., M.B., M.G. and Y.H.; visualization, M.A.E.M.A.; supervision, M.B.; project administration, M.B. All authors have read and agreed to the published version of the manuscript.
Funding
This research received no external funding.
Data Availability Statement
All data generated or analyzed during this study are included in this published article. For additional data requests, please contact the first author M.A.E.M.A., who will provide access upon request.
Acknowledgments
This research was conducted under the supervision of IAWRSMB-Tunisia and the Laboratory of Applied Research in Engineering Geology, Geotechnics, Water Sciences, and Environment, Farhat Abbas University, Setif, Algeria. The authors sincerely thank the editor and anonymous reviewers for their constructive comments, and acknowledge Basim Asghar (Umm Al-Qura University) and Khan Shuhab (University of Houston) for their scientific contributions.
Conflicts of Interest
The authors declare no conflicts of interest.
References
- Nicholson, S.E. The West African Sahel: A review of recent studies on the rainfall regime and its interannual variability. ISRN Meteorol. 2013, 2013, 453521. [Google Scholar] [CrossRef]
- Sylla, M.B.; Giorgi, F.; Pal, J.S.; Gibba, P.; Kebe, I.; Nikiema, M. Projected changes in the annual cycle of high-intensity precipitation events over West Africa for the late twenty-first century. J. Clim. 2015, 28, 6475–6488. [Google Scholar] [CrossRef]
- Wilcox, C.; Vischel, T.; Panthou, G.; Bodian, A.; Blanchet, J.; Descroix, L.; Quantin, G.; Cassé, C.; Tanimoun, B.; Kone, S. Trends in hydrological extremes in the Senegal and Niger Rivers. J. Hydrol. 2018, 566, 531–545. [Google Scholar] [CrossRef]
- Nicholson, S.E. Climate of the Sahel and West Africa. Available online: https://oxfordre.com/climatescience/display/10.1093/acrefore/9780190228620.001.0001/acrefore-9780190228620-e-510 (accessed on 1 October 2025).
- Maou, A.; Souadnia, S.; Faqeih, K.; AlAmri, A.; Hadji, R.; Alamri, S.M.; Harizi, K.; Alamery, E.; Sonia, G.; Leila, B.; et al. Assessing flash flood occurrences and hazard zones along the mediterranean coasts: A GIS and mapping techniques approach in the Wadi Saf Saf Basin, Northeast Algeria. Front. Earth Sci. 2025, 13, 1594364. [Google Scholar] [CrossRef]
- Chagnaud, G.; Panthou, G.; Vischel, T.; Lebel, T. A synthetic view of rainfall intensification in the West African Sahel. Environ. Res. Lett. 2022, 17, 044005. [Google Scholar] [CrossRef]
- Diop, S.B.; Ekolu, J.; Tramblay, Y.; Dieppois, B.; Grimaldi, S.; Bodian, A.; Blanchet, J.; Rameshwaran, P.; Salamon, P.; Sultan, B. Climate change impacts on floods in West Africa: New insight from two large-scale hydrological models. Nat. Hazards Earth Syst. Sci. 2025, 25, 3161–3184. [Google Scholar] [CrossRef]
- Saley, I.A.; Salack, S. Present and future of heavy rain events in the Sahel and West Africa. Atmosphere 2023, 14, 965. [Google Scholar] [CrossRef]
- Gianoli, F.; Weynants, M.; Brink, A. Land degradation and the Convergence of Evidence in the Sahel. In Water and Land in the Sahel; Routledge: Milton Park, UK, 2025; pp. 128–140. [Google Scholar]
- Gao, D.; Yin, J.; Wang, D.; Yang, Y.; Lu, Y.; Chen, R. Modelling and validation of flash flood inundation in drylands. J. Geogr. Sci. 2024, 34, 185–200. [Google Scholar] [CrossRef]
- Sylla, M.B.; Nikiema, P.M.; Gibba, P.; Kebe, I.; Klutse, N.A.B. Climate change over West Africa: Recent trends and future projections. In Adaptation to Climate Change and Variability in Rural West Africa; Springer: Cham, Switzerland, 2016; pp. 25–40. [Google Scholar]
- Rameshwaran, P.; Bell, V.A.; Davies, H.N.; Kay, A.L. How might climate change affect river flows across West Africa? Clim. Chang. 2021, 169, 21. [Google Scholar] [CrossRef]
- Nkrumah, F.; Vischel, T.; Panthou, G.; Klutse, N.A.B.; Adukpo, D.C.; Diedhiou, A. Recent trends in the daily rainfall regime in southern West Africa. Atmosphere 2019, 10, 741. [Google Scholar] [CrossRef]
- Bodian, A.; Diop, L.; Panthou, G.; Dacosta, H.; Deme, A.; Dezetter, A.; Ndiaye, P.M.; Diouf, I.; Vischel, T. Recent trend in hydroclimatic conditions in the Senegal River Basin. Water 2020, 12, 436. [Google Scholar] [CrossRef]
- Masso, C. CGIAR Environmental Assessment-April 2024; CGIAR: Montpellier, France, 2024. [Google Scholar]
- Orange, D. Hydroclimatologie du Fouta Djalon et Dynamique Actuelle d’un vieux Paysage Lateritique (Afrique de l’Ouest); Persee-Portail des revues scientifiques en SHS; Sciences Géologiques, Université Louis Pasteur: Strasbourg, France, 1992; Volume 93, Available online: https://www.persee.fr/doc/sgeol_0302-2684_1992_mon_93_1 (accessed on 1 October 2025).
- Renard, K.G.; Foster, G.R.; Weesies, G.A.; McCool, D.K.; Yoder, D.C. Predicting Soil Erosion by Water: A Guide to Conservation Planning with the Revised Universal Soil Loss Equation (RUSLE); Agricultural Handbook 703; United State Department of Agriculture: Washington, DC, USA, 1997; 407p. [Google Scholar]
- Prasannakumar, V.; Shiny, R.; Geetha, N.; Vijith, H. Spatial prediction of soil erosion risk by remote sensing, GIS and RUSLE approach: A case study of Siruvani river watershed in Attapady valley, Kerala, India. Environ. Earth Sci. 2011, 64, 965–972. [Google Scholar] [CrossRef]
- Mahleb, A.; Hadji, R.; Zahri, F.; Boudjellal, R.; Chibani, A.; Hamed, Y. Water-borne erosion estimation using the revised universal soil loss equation (RUSLE) model over a semiarid watershed: Case study of Meskiana Catchment, Algerian-Tunisian border. Geotech. Geol. Eng. 2022, 40, 4217–4230. [Google Scholar] [CrossRef]
- Wischmeier, W.H.; Smith, D.D. Predicting Rainfall Erosion Losses: A Guide to Conservation Planning; Handbook No. 537; U.S. Department of Agriculture: Washington, DC, USA, 1978.
- Roose, E.J. Use of the universal soil loss equation to predict erosion in West Africa. In Soil Erosion: Prediction and Control; Soil Conservation Society of America: Ankeny, IA, USA, 1978; pp. 60–74. [Google Scholar]
- El Yacoubi, S.; Fargette, M.; Faye, A.; Junior, W.d.C.; Libourel, T.; Loireau, M. A multilayer perceptron model for the correlation between satellite data and soil vulnerability in the Ferlo, Senegal. Int. J. Parallel Emergent Distrib. Syst. 2017, 34, 3–12. [Google Scholar] [CrossRef]
- Kouli, M.; Soupios, P.; Vallianatos, F. Soil erosion prediction using the revised universal soil loss equation (RUSLE) in a GIS framework, Chania, Northwestern Crete, Greece. Environ. Geol. 2008, 57, 483–497. [Google Scholar] [CrossRef]
- Haregeweyn, N.; Tsunekawa, A.; Nyssen, J.; Poesen, J.; Tsubo, M.; Tsegaye Meshesha, D.; Schütt, B.; Adgo, E.; Tegegne, F. Soil erosion and conservation in Ethiopia: A review. Prog. Phys. Geogr. 2015, 39, 750–774. [Google Scholar] [CrossRef]
- Fenta, A.A.; Tsunekawa, A.; Haregeweyn, N.; Poesen, J.; Tsubo, M.; Borrelli, P.; Panagos, P.; Vanmaercke, M.; Broeckx, J.; Yasuda, H.; et al. Land susceptibility to water and wind erosion risks in the East Africa region. Sci. Total Environ. 2020, 703, 135016. [Google Scholar] [CrossRef]
- Guduru, J.U.; Jilo, N.B. Assessment of rainfall-induced soil erosion rate and severity analysis for prioritization of conservation measures using RUSLE and Multi-Criteria Evaluations Technique at Gidabo watershed, Rift Valley Basin, Ethiopia. Ecohydrol. Hydrobiol. 2022, 23, 30–47. [Google Scholar] [CrossRef]
- Ugese, A.A.; Ajiboye, J.O.; Ibrahim, E.S.; Gajere, E.N.; Itse, A.; Shaba, H.A. Soil loss estimation using remote sensing and RUSLE model in Koromi-Federe catchment area of Jos-East LGA, Plateau State, Nigeria. Geomatics 2022, 2, 499–517. [Google Scholar] [CrossRef]
- Okou, F.A.; Tente, B.; Bachmann, Y.; Sinsin, B. Regional erosion risk mapping for decision support: A case study from West Africa. Land Use Policy 2016, 56, 27–37. [Google Scholar] [CrossRef]
- Taib, H.; Hadji, R.; Hamed, Y. Erosion patterns, drainage dynamics, and their environmental implications: A case study of the hammamet basin using advanced geospatial and morphometric analysis. J. Umm Al-Qura Univ. Appl. Sci. 2023, 11, 235–250. [Google Scholar] [CrossRef]
- Sanchez Moreno, J.F. The Power of Rain: Rainfall Variability and Erosion in Cape Verde; University of Twente: Enschede, The Netherlands, 2012. [Google Scholar]
- Adamou, S.N.; Gourfi, A.; Touré, A.A.; Daoudi, L. Érosion hydrique au sud-ouest du Niger: Impacts des facteurs naturels et anthropiques sur les pertes en sols. Geomorphol. Process. Environ. 2022, 28, 77–92. [Google Scholar] [CrossRef]
- Thiaw, I.; Dacosta, H. Mapping of soil erosion risk in the Diarha watershed using RUSLE, RS and GIS. Am. J. Remote. Sens. 2017, 5, 30. [Google Scholar] [CrossRef]
- Hara, F.; Achab, M.; Emran, A.; Mahe, G. Study of soil erosion risks using RUSLE Model and remote sensing: Case of the Bouregreg watershed (Morocco). Proc. Int. Assoc. Hydrol. Sci. 2020, 383, 159–162. [Google Scholar] [CrossRef]
- DHI. Climate and Environmental Vulnerability Analysis; IFAD: Capo Verde, Africa, 2015. [Google Scholar]
- Desmet, J.P.J.; Govers, G. A GIS procedure for automatically calculating the USLE LS Factor on topographically complex landscape units. J. Soil Water Conserv. 1996, 51, 427–433. [Google Scholar] [CrossRef]
- Stone, R.P.; Hilborn, D. Universal Soil Loss Equation—Fact Sheet; Ministry of Agriculture, Food and Rural Affairs Ontario: Guelph, ON, Canada, 2012. [Google Scholar]
- Hurni, H. Paleoglaciated landscapes in Simen and other high-mountain areas of Ethiopia. In Landscapes and Landforms of Ethiopia; Springer: Dordrecht, The Netherlands, 2015; pp. 139–146. [Google Scholar]
- Tamene, L.; Le, Q.B. Estimating soil erosion in sub-Saharan Africa based on landscape similarity mapping and using the revised universal soil loss equation (RUSLE). Nutr. Cycl. Agroecosyst. 2015, 102, 17–31. [Google Scholar] [CrossRef]
- Bouamrane, A.; Boutaghane, H.; Bouamrane, A.; Dahri, N.; Abida, H.; Saber, M.; Kantoush, S.A.; Sumi, T. Soil erosion susceptibility prediction using ensemble hybrid models with multicriteria decision-making analysis: Case study of the Medjerda basin, northern Africa. Int. J. Sediment Res. 2024, 39, 998–1014. [Google Scholar] [CrossRef]
- Gebremichael, A.; Gebremariam, E.; Desta, H. GIS-based mapping of flood hazard areas and soil erosion using analytic hierarchy process (AHP) and the universal soil loss equation (USLE) in the Awash River Basin, Ethiopia. Geosci. Lett. 2025, 12, 12. [Google Scholar] [CrossRef]
- Sané, B.; Faye, C.; Sané, T. Evaluation de l’érosion hydrique des sols dans deux bassins versants non jaugés, Djibonker et Agnak, (Basse Casamance Méridionale, Sénégal). Dynamiques environnementales. J. Int. Géosci. Environ. 2022, 49–50, 128–156. [Google Scholar]
- Salhi, A.; Benabdelouahab, S.; Heggy, E. Growing soil erosion risks and their role in modulating catastrophic floods in North Africa. Int. J. Appl. Earth Obs. Geoinf. 2024, 133, 104132. [Google Scholar] [CrossRef]
- Almouctar, M.A.S.; Wu, Y.; An, S.; Yin, X.; Qin, C.; Zhao, F.; Qiu, L. Flood risk assessment in arid and semi-arid regions using Multi-criteria approaches and remote sensing in a data-scarce region. J. Hydrol. Reg. Stud. 2024, 54, 101862. [Google Scholar] [CrossRef]
- Tramblay, Y.; Villarini, G.; Saidi, M.E.; Massari, C.; Stein, L. Classification of flood-generating processes in Africa. Sci. Rep. 2022, 12, 18920. [Google Scholar] [CrossRef]
- Fenglin, W.; Ahmad, I.; Zelenakova, M.; Fenta, A.; Dar, M.A.; Teka, A.H.; Belew, A.Z.; Damtie, M.; Berhan, M.; Shafi, S.N. Exploratory regression modeling for flood susceptibility mapping in the GIS environment. Sci. Rep. 2023, 13, 247. [Google Scholar] [CrossRef] [PubMed]
- Vrieling, A.; Sterk, G.; de Jong, S.M. Satellite-based estimation of rainfall erosivity for Africa. J. Hydrol. 2010, 395, 235–241. [Google Scholar] [CrossRef]
- Valentin, C.; Rajot, J.-L.; Mitja, D. Responses of soil crusting, runoff and erosion to fallowing in the sub-humid and semi-arid regions of West Africa. Agric. Ecosyst. Environ. 2004, 104, 287–302. [Google Scholar] [CrossRef]
- Naba, C.; Ishidaira, H.; Magome, J.; Souma, K. Exploring the Potential of Soil and Water Conservation Measures for Climate Resilience in Burkina Faso. Sustainability 2024, 16, 7995. [Google Scholar] [CrossRef]
- Roose, E. Land Husbandry: Components and Strategy; FAO Soils Bulletin: Rome, Italy, 1996; Volume 70. [Google Scholar]
- Bationo, A.; Fening, J.O.; Kwaw, A. Assessment of soil fertility status and integrated soil fertility management in Ghana. In Improving the Profitability, Sustainability and Efficiency of Nutrients Through Site Specific Fertilizer Recommendations in West Africa Agro-Ecosystems: Volume 1; Springer International Publishing: Cham, Switzerland, 2018; pp. 93–138. [Google Scholar]
- Le Roux, J.; Morgenthal, T.; Malherbe, J.; Pretorius, D.; Sumner, P. Water erosion prediction at a national scale for South Africa. Water SA 2018, 34, 305. [Google Scholar] [CrossRef]
- Traore, K.M.; Bakary, N.M.; Tambou, A.T. Assessment of soil erosion in the Autonomous District of Abidjan, Côte d’Ivoire. Int. J. Environ. Agric. Res. (IJOEAR) 2023, 9, 40–55. [Google Scholar] [CrossRef]
- Femmam, H.; Femmam, K.; Mekaoussi, H.; Amiour, M. Time series prediction of specific erosion in the Koudiet Lemdaour dam watershed Batna region, Algeria. Larhyss J. 2025, 62, 153–172. [Google Scholar]
- Saikia, L.; Mahanta, C. A mass balance approach in sediment budgeting of large alluvial rivers with special emphasis on the Brahmaputra in Assam. Indian Assoc. Sedimentol. 2021, 38, 15–24. [Google Scholar] [CrossRef]
Disclaimer/Publisher’s Note: The statements, opinions and data contained in all publications are solely those of the individual author(s) and contributor(s) and not of MDPI and/or the editor(s). MDPI and/or the editor(s) disclaim responsibility for any injury to people or property resulting from any ideas, methods, instructions or products referred to in the content. |
© 2025 by the authors. Licensee MDPI, Basel, Switzerland. This article is an open access article distributed under the terms and conditions of the Creative Commons Attribution (CC BY) license.