Abstract
Numerical modeling methods were used to study the combined effects of the autumn thermal bar and river inflow mineralization on deep-water renewal processes in Lake Baikal. A cross-section from the Boldakov River to Maloye More strait characterized by great depths was chosen for the study. Numerical experiments showed that under low levels of river mineralization, downwelling in the thermal bar front played a key role in water mixing. Under high levels of mineralization, the crucial factor was the large-scale near-slope circulation appearing when the stable temperature stratification of deep waters was broken. The haline characteristics of river inflow influenced the time of thermal bar appearance and the speed of propagation in the open lake. Moreover, it was shown that eddy structures can form on both sides of the thermal bar only under minor differences between river and lake mineralization levels.
1. Introduction
Active instrumental research on Lake Baikal has been performed since the mid-twentieth century [1,2], and today, there is a large pool of data that have been accumulated on the physical and chemical characteristics of Baikal water [3,4,5]. Nevertheless, the mechanism of the lake water renewal remains poorly described and is of great scientific and practical interest, because the course of dynamic processes in the lake is influenced by the combination of external (wind, radiative fluxes, geothermal heat flux, characteristics of river tributaries, etc.) and internal (effects of temperature and pressure on water density) factors [4,6,7].
The interaction between surface Baikal waters and deep-water layers under the impact of pressure on the water density has yet to be studied in detail. However, the results of the vertical measurements of temperature, water-dissolved oxygen, and fluorochlorocarbon concentrations, as well as other parameters, pointed to the presence of mechanisms of upper- and deep-water mixing [4,6,7].
Surface-layer water temperature in the lake is determined by the absorption of solar energy, convective mixing due to wind stress, and microscale turbulence [8]. The pressure impact on the temperature of the maximum density (temperature of maximum density decreases by 0.21 °C for every 100 m) limits free convective heat exchange to 250–300 m in spring and autumn [9].
Registered low temperatures and high values of dissolved oxygen concentrations signal the presence of deep-water convection. One of the hypotheses of its formation points to occasional wind impact on the lake surface [10].
Another hypothesis, formulated by Shimaraev and proven by numerous instrumental measurements [4,9,11], concerns cabbeling accompanying the thermal bar. For example, measurements conducted during an international hydrophysical experiment [4] showed that thermal bar formation under the influence of mineralized and warm waters from the Selenga River initiated intensive water exchange between deep- and surface-water layers in the lake.
The thermal bar is a narrow zone where surface waters with a temperature close to the temperature of the maximum density (Tmd) begin to sink [12,13]. In autumn, it is a temperature and density front separating cold (below 4 °C) and warm (above 4 °C) lake water. Under the influence of the thermal bar, the warm water current slides down from the river and sinks below the depth of the mesothermal maximum, transferring surface waters to great depths. A leading role in the thermal bar formation in Lake Baikal is played by its tributaries, both in spring and in autumn, despite their much lower water content [14]. Additionally, research showed that the timing of formation and destruction of the thermal bar depended on wind force and direction [7,15], as well as bottom bathymetry [16]. Numerical modeling also demonstrated that wind stress caused intensive vertical mixing and leads to homothermy across the entire shallow water area. It confirmed the key role of wind in the propagation of cooled water down to deeper layers [17]. The observations also revealed a mechanism connected to the density current of surface waters with higher mineralization along the slope and as warm intrusions under the bottom thermal bar boundary [4,18].
Field measurements of the thermal bar in Baikal began in the 1960s [19] and continue today. Studies in an international experiment [4] demonstrated a temperature decrease in the near-bottom waters and an increase in oxygen concentration long before the thermal bar formation, which may have been caused by forced convection—eddy current appearing due to the action of tributary waters sliding downward along the slope. In spring and autumn (May–June and November–January), the stable vertical temperature stratification weakens because the temperatures of deep and surface waters become equal (~3.5 °C) [9]. At this moment, additional forces (wind friction, underwater currents, and changes in the mineralization gradient) may cause surface waters to slide down, where their density will be equal to the density of deeper waters, and thus, the water column turns over [7,20].
The influence of vertical near-slope circulations from the coastal area on the renewal of Baikal waters was substantiated by both observations [3,5,21] and the results of numerical modeling [7]. The influence of mineralization on deep convection was particularly significant in Central Baikal, bringing warmer water into the lake in late spring and colder water in late autumn, thus resulting in hydrostatic instability.
Precipitation waters make up only about 13% of the overall annual discharge in Baikal, and consequently, the chemical composition of lake water is mostly defined by the chemical composition of its tributaries. Baikal waters are classified as low-mineralized soft waters of a hydrocarbonate class, type 1 calcium group, according to the classification by Alekin [2]. They are close to the composition of its tributary water in terms of major ions and are very different in terms of biogenic elements, organic matter, and gas components. An increase in mineralization in river discharge water is typical during autumn, when the influence of highly mineralized underwater springs becomes stronger. In spring, on the contrary, mineralization drops due to snow alimentation. Throughout the year, the mineralization of tributary waters for the Baikal basin does not change by more than 150–250%.
The following five groups of Baikal tributaries were described [2] according to their degree of mineralization:
- (1)
- Very low mineralization. Tributaries of mostly southern and northern ends of Baikal, with a small catchment basin and mainly of a snow alimentation type. They freeze or have insignificant water discharge in winter. The total mineralization of these tributaries is 20–40 mg/L and does not exceed 50 mg/L.
- (2)
- Tributaries with a mineralization of 50–100 mg/L. Mountain rivers with catchment basins in mountain ranges in the vicinity of Baikal.
- (3)
- Tributaries with a mineralization of 100–200 mg/L. Such are the Selenga and Barguzin rivers and some lesser rivers. Owing to the structure of their catchment basins and insignificant base alimentation compared to that of rain, they maintain low mineralization levels.
- (4)
- A small number of tributaries with a mineralization of 200–300 mg/L, located in the areas of carbonate occurrence (the Malaya Buguldeika, the Haluri, the Ilga, and others).
- (5)
- Tributaries with mineralization above 300 mg/L. The Bolshaya Buguldeika is the only tributary of Baikal in this group. Apart from it, the group includes some smaller streams in Olkhon Island that feed from highly mineralized waters deep underground.
The aim of this work is to study the influence of river discharge mineralization on the deep-water renewal processes in Lake Baikal during thermal bar formation using numerical modeling.
2. Materials and Methods
2.1. Numerical Model
In this study, a two-dimensional section is adopted with the justification that gradients normal to the lake shore are much greater than gradients parallel to the shore, which are neglected. To take the Coriolis force related to the Earth’s rotation and the effect of wind into account, the longshore velocity (v, in the y-direction) was introduced into our model. The physical processes to be simulated are assumed to be homogenous along the direction across the river mouth—the Oy axis. The Ox axis is directed towards the lake, and Oz is directed vertically upwards (Figure 1). A nonhydrostatic model [17,22] reproducing the thermohydrodynamic processes in a deep lake includes the momentum equations (Equations (1)–(3)), equations of continuity (Equation (4)), energy (Equation (5)), and salinity balance (mineralization) in the lake (Equation (6)), as follows:
where u, v are the horizontal velocity components along the Ox and Oy axes, respectively; w is the vertical velocity component; Ωx, Ωy, and Ωz are the vector components of the Earth rotation’s angular velocity; g is the acceleration of gravity; cp is the specific heat capacity; T is the temperature; S is the salinity; p is the pressure; ρ0 is the water density at standard atmospheric pressure; and temperature TL and salinity SL are the reference temperature and salinity of the lake, respectively.
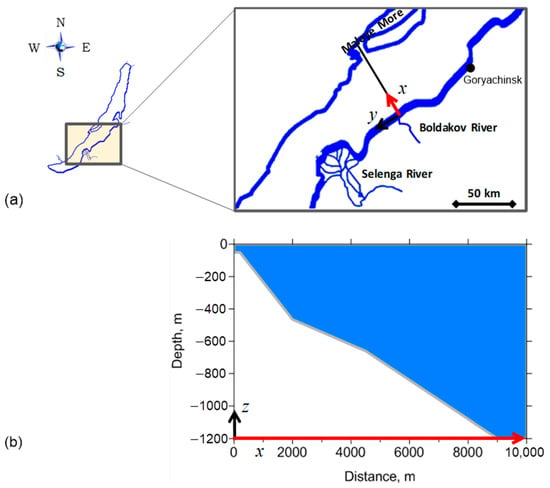
Figure 1.
Map of the Lake Baikal transect (a) and calculation domain (b). The length of Ox (the red axis) corresponds to the length of the calculation domain.
The initial conditions for the governing equations were set as follows:
where TL and SL are the temperature and salinity in the lake, respectively.
Boundary conditions were considered
- (a)
- at the surface of the lake
- (b)
- at the solid boundaries
- (c)
- at the river inflow boundary
- (d)
- at the open boundary, where the following conditions for the radiation type [23] were set:
The phase velocity cφ is calculated here from the space and time trends φ in the domain near the boundary.
The closure of the system was achieved with a k–ω turbulence model [24] and algebraic relations for turbulent viscosity and diffusion [25]. The equation of state [26] adopted in the model is valid in the ranges of 0 ≤ T ≤ 30 °C, 0 ≤ S ≤ 0.6 g/kg, 0 ≤ p ≤ 180 bar.
The problem was solved numerically using the method of finite volumes, when scalar values (temperature, salinity, and turbulent terms) were defined in the centers of mesh cells, while velocity components were defined in the midpoints of cell edges. For the approximation of the basin bathymetry by the numerical domain, we used the method of blocking fictitious domains as follows [27]: The components of velocity were set to zero where the viscosity coefficient was very high in the excluded area. A numerical algorithm for calculating the velocity and scalar value field was based on the Crank–Nicolson finite difference method. For the approximation of convective terms in the equations, an upstream QUICK scheme was used [28]. The coordination of the calculated speed and pressure fields was achieved through the original SIMPLED procedure for currents with buoyancy, which is a modified SIMPLE method [27]. The SIMPLED algorithm adjusts speed and pressure fields accounting for density variations in a gravitational term of Equation (3). The system of finite difference equations was solved with the incomplete factorization [29] and relaxation methods at every time step. A more detailed description of the model and the numerical method of the solution for Equations (1)–(6) with initial and boundary conditions (7)–(11) is given in [25].
2.2. Study Area and Problem Parameters
Numerical experiments were conducted for various values of river discharge mineralization (Table 1) for the transect of the Boldakov River–Maloye More strait in Lake Baikal (Figure 1a) over the calculation domain of 10 km × 1.2 km (Figure 1b). The transect is located 70 km north of the Selenga River delta, in the central basin of Lake Baikal, which extends from the Selenga River in the south to the Ushkan Islands in the north [30]. Although the different mineralization levels of tributaries are from distinct regions, we should carry out simulations under the same initial and boundary conditions (except for mineralization) in order to correctly compare the results. Bathymetry data corresponding to the given transect were taken from Ref. [14].

Table 1.
Values of river inflow mineralization in numerical experiments.
Field observations show that the basic physical changes during the thermal bar evolution occur from the shore to the lake center, while flow characteristics are mainly homogeneous in the direction parallel to the shoreline [31,32,33]. Therefore, the thermal bar dynamics on the cross-section selected can be described accurately by the model presented.
The calculation domain was a uniform orthogonal grid with steps hx = 50 m and hz = 5 m. The time step was 30 s. The grid size, time step, and other calculation parameters used in this study were the same as in Ref. [22], where the adequacy of the model proposed was confirmed.
The initial and boundary conditions adopted for our model are based on observation data in Central Baikal [1,34] and the numerical modeling of physical processes in large lakes [25,35]. The initial water temperature in numerical experiments had a vertically inhomogeneous distribution, reflecting the temperature regime of Central Baikal in October [1]. The water temperature in the river discharge mouths was initially 1.5 °C and decreased by 0.02 °C per day. Lake water mineralization was 96 mg/L [1]. Tributary water speed when entering the lake was 0.5 cm/s (approximately corresponding to the maximum velocity values of the Srednyaya arm [34]. Horizontal turbulent viscosity and diffusion coefficients were taken as Kx = Dx = 5 m2/s [35]. Heat fluxes coming to the water surface were parametrized according to formulas from [36], using meteorological data from a weather station in Goryachinsk village from 1 November 2015 to 30 November 2015. The values Hgeo, , and were taken as zero in numerical experiments.
3. Results
All experiments showed the formation of an along-the-slope current of various speeds on day 5. In experiments 1 and 2 (Figure 2(a’2,b’2)), the speed of this current did not exceed 0.4 cm/s, while its maximum speed was registered 4500 m away from the river mouth. In experiment 3 (Figure 2(c’2)), the maximum current speed was 0.5 cm/s and, unlike in previous experiments, near-maximum values of along-the-slope current speed were registered closer to the river mouth—500–1000 m away from it. Circulation was observed in the thermoinert area. In experiments 4 and 5 (Figure 2(d’2,e’2)), near-bottom current speed increased significantly, up to 3 cm/s and 4 cm/s, respectively. With distance from the mouth, it slowed to below 1 cm/s, as follows: 4500 m away from the river mouth in experiment 4 (Figure 2(d’2)) and 6500 m in experiment 5 (Figure 2(e’2)). In both experiments, a large-scale along-the-slope eddy was formed. On day 10 in experiment 5 (Figure 3(a’)), comparatively high values of near-bottom current speed remained the same at a considerable distance from the river mouth as follows: 6500 m away from the river mouth, the current speed was >2 cm/s. On day 20, however, (Figure 3(b’)) its maximum speed increased significantly up to 6 cm/s, and a second eddy was formed, which is the reverse of the along-the-slope eddy (its center was located 210 m deep and 2700 m away from the river mouth). Note that on day 5 in experiments 1 and 2 (Figure 2(a’2,b’2)), surface waters slid down further (toward the open lake) than the Tmd position, in experiment 3 (Figure 2(c’2)) near the Tmd position, and in experiments 4 and 5 (Figure 2(d’2,e’2)) closer to the coast. On days 10 and 20 in experiment 5 (Figure 3(a’,b’)), dense, highly mineralized water slid down near the river mouth, despite the significant horizontal propagation of the thermal bar.
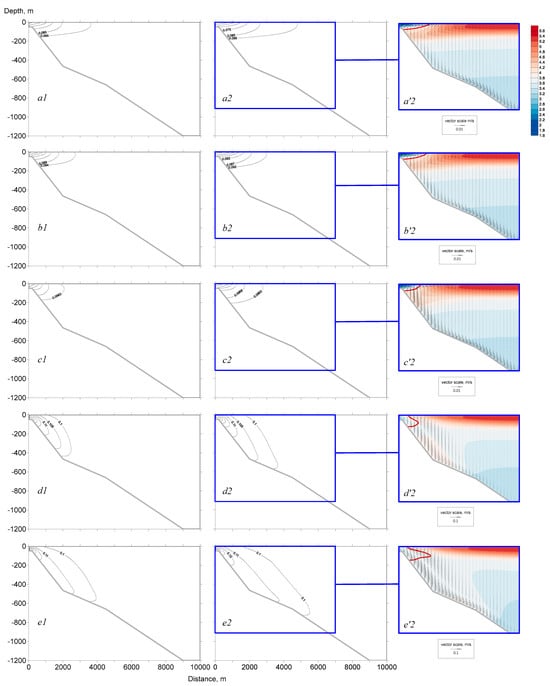
Figure 2.
Mineralization distribution [g/L] in numerical experiments with various values of river inflow mineralization: (a1,a2,a’2) SR = 0.02 g/L (experiment 1); (b1,b2,b’2) SR = 0.05 g/L (experiment 2); (c1,c2,c’2) SR = 0.1 g/L (experiment 3); (d1,d2,d’2) SR = 0.2 g/L (experiment 4); and (e1,e2,e’2) SR = 0.3 g/L (experiment 5) on day 3 (1) and 5 (2). Colored fragments show the thermohydrodynamic situation on day 5, temperature distribution, velocity field, and temperature of maximum density (red line).
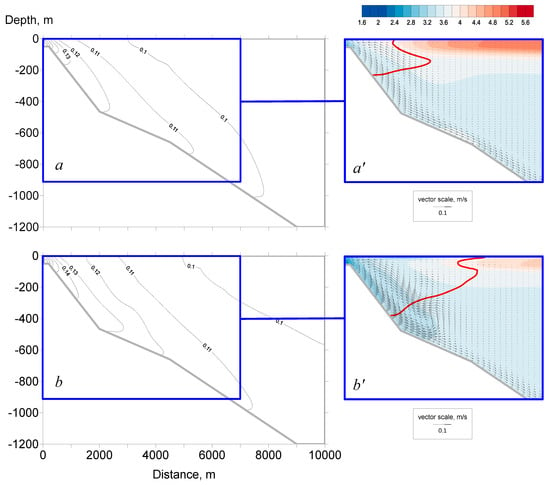
Figure 3.
Mineralization distribution [g/L] in the case of SR = 0.3 g/L (experiment 5) on day 10 (a) and 20 (b). Colored fragments (a’,b’) show the thermohydrodynamic situation, temperature distribution, velocity field, and temperature of maximum density (red line) on day 10 and 20, respectively.
Judging from the location of Tmd on the lake surface (Figure 4), the thermal bar was formed on day 1 in experiments 1, 2, and 3, and on day 3 in experiments 4 and 5. It can be concluded that, by increasing the mineralization of river discharge water, the thermal bar was formed later. Remarkably, in experiments 1 and 2, as well as in experiments 4 and 5, the thermal bar was formed around the same time. For a few days after the thermal bar formation, the speed of its horizontal development depended on mineralization. Two days after the thermal bar had been formed, it moved horizontally by 1.1 km in experiment 1, by 0.9 km in experiment, by 0.75 km in experiment 3, by 0.4 km, in experiment 4, by 0.45 km and in experiment 5. However, the overall dynamics of Tmd location on the surface of the basin demonstrated that the average speed of horizontal propagation of the thermal bar slowed with the increase in mineralization of river discharge waters as follows: the average propagation speed was 318 m/day in experiment 1, 307 m/day in experiment 2, 294 m/day in experiment 3, and 288 m/day in experiments 4 and 5.
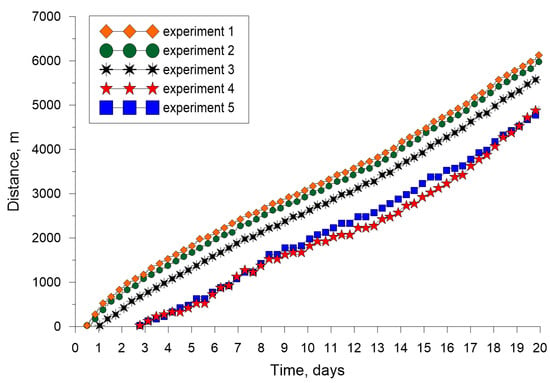
Figure 4.
Dynamics of the location of the maximum density temperature at the lake surface in numerical experiments with various values of river inflow mineralization: SR = 0.02 g/L (experiment 1); SR = 0.05 g/L (experiment 2); SR = 0.1 g/L (experiment 3); SR = 0.2 g/L (experiment 4); and SR = 0.3 g/L (experiment 5).
Less mineralized water from experiments 1 and 2 tended to propagate over the lake surface, but it has a weak influence on the intensity of cooling of the open lake surface in comparison with other experiments. The Tmd location on the lake surface showed that the surface water near the river mouth cooled faster when mineralization of the river discharge was lower, mostly, however, due to earlier thermal bar formation. The more mineralized water from experiments 4 and 5 slid down the slope. Its propagation was accelerated with the growing mineralization, which could be seen from the along-the-slope current speed, as well as the water temperature decrease with an increase in mineralization in the area. Water from experiment 3 was the closest to the water in the basin in mineralization, and although its mineralization was higher than that in the basin, as in experiments 4 and 5, this water propagated across the surface, which was more similar to water from experiments 1 and 2. The chronoisopleths of mineralization at 6000 m from the river mouth (Figure 5) demonstrated that water mineralization farther away from the river mouth changed faster when the difference in mineralization of tributary and lake water was greater. Less mineralized tributary water changed at smaller depths, while higher mineralized changed closer to the bottom. In experiment 1, mineralization started to change significantly in the upper 50 m layer on day 8, in experiment 2 in the same upper 50 m layer on day 10, in experiment 4 at the depth of 600 m on day 8, and in experiment 5 at the depth of 650 m on day 5. Further variations in mineralization in experiments 1 and 2 occurred closer to the surface and in experiments 4 and 5 closer to the bottom. In experiment 3, changes in mineralization were minor and could be traced at the depth of 50 m on day 9. On day 20 in experiment 1, water mineralization at the surface was <87 mg/L, while in experiment 2 only 89–91 mg/L. Similarly, on day 20 in experiment 5, bottom water mineralization was >113 mg/L, while in experiment 4 only 103–105 mg/L. In experiment 3, there was a major difference in mineralization with the water on the lake surface, which was nearly 96.5 mg/L on day 20.
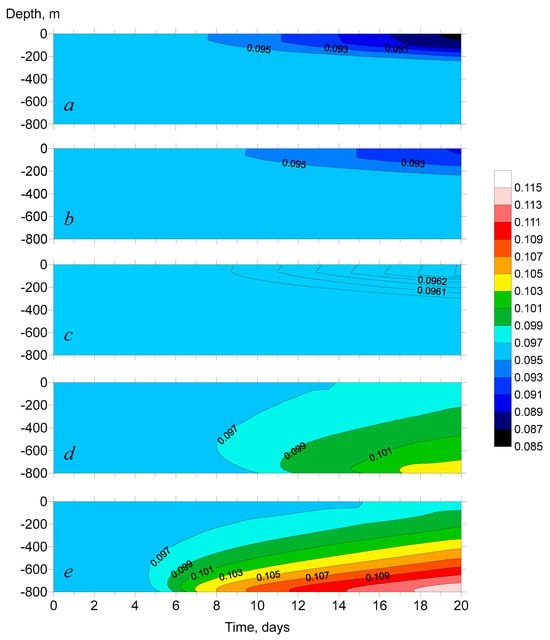
Figure 5.
Chronoisopleths of mineralization (g/L) at x = 6000 m in numerical experiments with various values of river inflow mineralization: (a) SR = 0.02 g/L (experiment 1); (b) SR = 0.05 g/L (experiment 2); (c) SR = 0.1 g/L (experiment 3); (d) SR = 0.2 g/L (experiment 4); and (e) SR = 0.3 g/L (experiment 5).
4. Discussion
4.1. Near-Slope Convection
Numerical modeling showed that the mineralization of river discharge influences both the time of formation of the thermal bar and the speed of its propagation, which agrees with the results for the autumn thermal bar in the Selenga River delta [17]. The speed of the thermal bar front propagation decreased by no more than 10%, with the growth of discharge mineralization from 50 mg/L to 200 mg/L. When the discharge mineralization was lower than the Lake Baikal mineralization, buoyancy kept lighter discharge waters on the lake surface and mixing occurred in the subsurface layer down to the depth of 200 m (Figure 2(a1,a’2,b1,b’2)). It increased the cooling rate on the surface and the horizontal propagation speed of the thermal bar front. The more intensive cooling of the near-surface layer of lake waters provoked earlier thermal bar formation than that from more mineralized discharge (Figure 4). Near-slope speed here was lower than in experiment 3, when mineralization of the discharge and the lake nearly coincided (Figure 2(c’2)). The summer temperature stratification of Baikal waters below 100 m under discharge mineralization lower than lake mineralization did not change in 5 days. At the same time, the water surface cooled up to 3 km away from the river mouth in the case of minor discharge mineralization (20 mg/L) (Figure 2(a2)). With the increase in discharge mineralization, the 4 °C isotherm went deeper, and heat exchange involved deeper waters; meanwhile, the thermal bar propagation away from the coast declined, and consequently, the surface cooled closer to the tributary (1.5 km). The drop in surface cooling under growing discharge mineralization was also demonstrated during the numerical modeling of the autumn thermal bar in Kamloops Lake [20] and in the Selenga shallow water area in Lake Baikal [17]. With the increase in discharge mineralization, the propagation of the thermal bar front slowed, which agrees with the numerical results for the Selenga River [29].
When discharge water mineralization (200 mg/L) was significantly higher than Baikal water mineralization, highly mineralized, and consequently, denser tributary waters slid down the slope to great depths, which provoked the formation of an eddy current. Temperature rose in the center of the near-slope eddy at 200–600 m depth, which indicated that warmer lake surface waters (3.8–4.0 °C) reach this area. When mineralization grew to 300 mg/L (Figure 2(e’2)), this temperature pattern was not observed, while warmer waters slid even deeper, down to 600–700 m, due to the higher speed, where the area of increased temperature (3.8–4.0 °C) was registered near the slope.
Thus, numerical results demonstrated the influence of along-the-slope currents on the renewal of Lake Baikal deep waters, which was observed in the lake during field studies [37]. Bottom bathymetry also had an impact. A near-slope eddy was formed in the area with a less steep slope, where additional resistance to the current took place. Moreover, in the studied transect with a considerable bottom slope, due to the gradient of mineralization and temperature (density), the near-the-slope current had a greater influence on vertical mixing than mixing at the thermal bar front. This agrees well with the conclusion that the thermal bar impact is more pronounced under a gentler bottom slope [16].
Intensive eddy mixing under high discharge mineralization led to the destruction of summer temperature stratification deeper than 200 m already on day 5, and by day 10, the temperature in the calculation domain nearly evened out (3.2 °C) at a depth below 200 m (Figure 2(e’2)). On day 20, further cooling was registered in deeper waters due to along-the-slope current (Figure 3b). Thus, a great vertical mineralization gradient resulted in the destruction of stable temperature stratification of deep waters close to Tmd [8].
The numerical experiments confirmed that with the absence of wind stress, which is one of the most significant factors of large-scale vertical circulation formation [4,7,17], the influence of mineralization on the development of the thermal bar, and especially the intensity of along-the-slope currents, became more prominent.
4.2. Circulation at the Thermal Bar Front
Under a slight difference between mineralization in discharge and lake waters (experiment 3) (Figure 2(c’2)), the velocity field showed that waters with maximum density and a temperature of 3.8–4 °C slid down in front of the thermal bar to a depth of about 250 m, where Tmd is lower for the given mineralization. This downward current caused the eddy formation in the subsurface layer behind the thermal bar front. Eddy current contributed to a more intensive mixing and temperature decrease in the subsurface layer on the lake-wise side of the thermal bar. The obtained values also correctly described the Tmd decrease with depth.
Under low discharge water mineralization (experiments 1 and 2) a downwelling at the front was registered, but the eddy behind the thermal bar was not formed and temperature stratification in the lake was almost unbroken on day 5. While mixing with low-mineralized tributary waters, lake water mineralization declined, and consequently, Tmd grew and warmer waters compared to experiment 3 went down from the surface (Figure 2(c’2)).
When discharge water was highly mineralized (experiments 3 and 4), an intensive near-slope current caused the 4 °C water to go deeper compared to previous experiments. The area around the isotherm became part of the near-slope eddy current, and the higher mineralization was, the more intensive it became.
On day 10, under high mineralization, at depths below 300 m, the isotherm was settled due to the intensive heat exchange provoked by intensive eddy mixing in the near-slope area (Figure 3a). At the same time, because of high mineralization, cooling from the surface declined and winter temperature stratification in the subsurface layer also slowed.
It is worth noting that the formation of eddy structures on both sides of Tmd was observed only at close values of tributary and lake mineralization. Under low discharge mineralization, no eddy was formed in the thermoinert area, while under high mineralization, an intensive near-slope current involved the thermoactive area (Figure 6). Nonetheless, even for low discharge mineralization (20 mg/L), the speed of the near-slope current was much higher than the speed of the circulation current around the thermal bar (Figure 6).
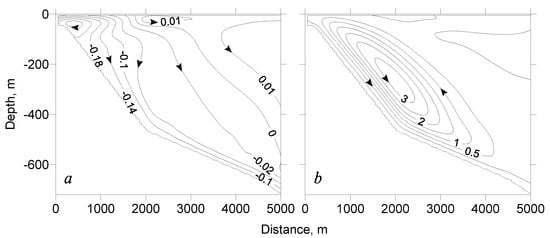
Figure 6.
Streamlines [m2/s] on day 3 in the cases of (a) SR = 0.02 g/L (experiment 1) and (b) SR = 0.3 g/L (experiment 5).
In all experiments on day 5, along-the-slope currents with different speeds were formed. In experiments 1 and 2 (Figure 2(a’2,b’2)) this current speed did not exceed 0.4 cm/s, and its maximum speed was registered 4500 m from the river mouth. In experiment 3 (Figure 2(c’2)), the maximum current speed was 0.5 cm/s, and unlike in previous experiments, close-to-maximum values of along-the-slope speed were registered closer to the river mouth—500–1000 m from it.
5. Conclusions
The numerical study of the processes of vertical mixing in Lake Baikal during the autumn thermal bar formation allowed us to draw the following conclusions:
- An increase in river discharge mineralization reduced the cooling speed from the lake surface, and consequently, slowed the formation of autumn thermal bar and then slowed the thermal bar propagation toward the open lake.
- With small differences in values of lake and tributary water mineralization, eddy currents were formed on both sides of the thermal bar.
- Along-the-slope currents influenced deep-water convection more, the higher discharge mineralization was.
- A large vertical mineralization gradient led to the destruction of stable temperature stratification of deep waters with temperature close to Tmd.
- With low tributary mineralization, mixing was greatly influenced by vertical currents on the thermal bar front.
- Due to the effect of the thermal bar, mixing in the upper 250 m layer occurred under any mineralization.
Author Contributions
Conceptualization, B.T.; methodology, B.T.; software, D.D., A.B. and B.T.; validation, D.D. and B.T.; formal analysis, V.C. and N.T.; investigation, V.C., N.T. and B.T.; writing—original draft preparation, V.C., N.T. and B.T.; writing—review and editing, B.T.; visualization, A.B. and D.D.; supervision, B.T. All authors have read and agreed to the published version of the manuscript.
Funding
This research was funded by the Russian Science Foundation, grant number 23-71-10020.
Data Availability Statement
The datasets are available upon request from the corresponding author.
Acknowledgments
This study was funded by the Russian Science Foundation (project No. 23-71-10020, https://www.rscf.ru/en/project/23-71-10020/, accessed on 23 April 2025). We are very grateful to Jean Kollantai, MSW, for the style review.
Conflicts of Interest
The authors declare no conflicts of interest.
References
- Shimaraev, M.N.; Verbolov, V.I.; Granin, N.G.; Sherstyankin, P.P. Physical Limnology of Lake Baikal: A Review; BICER: Irkutsk, Russia; Okayama, Japan, 1994; 81p. [Google Scholar]
- Galazij, G.I.; Votintsev, K.K. Problems of Baikal; Nauka: Novosibirsk, Russia, 1978. (In Russian) [Google Scholar]
- Wuest, A.; Ravens, T.M.; Granin, N.G.; Kosis, O.; Schurter, M.; Sturm, M. Cold intrusions in Lake Baikal: Direct observational evidence for deep-water renewal. Limnol. Oceanogr. 2005, 50, 184–196. [Google Scholar] [CrossRef]
- Shimaraev, M.N.; Grachev, M.A.; Imboden, D.M.; Okuda, S.; Granin, N.G.; Kipfer, R.; Levin, L.A.; Endo, S. Internation-al hydrophysical experiment in Lake Baikal: Spring deep water renewal. Dokl. Acad. Nauk. 1995, 343, 824–827. (In Russian) [Google Scholar]
- Troitskaya, E.S.; Shimaraev, M.N. Cases of mass development of intrusions in Lake Baikal and the correlation of intrusions with atmospheric circulation processes. Limnol. Freshw. Biol. 2022, 6, 1712–1719. [Google Scholar] [CrossRef]
- Shimaraev, M.N.; Gnatovsky, R.; Yu Blinov, V.V.; Ivanov, V.G. On the issue of Baikal deep-water renewal. Dokl. Akad. Nauk. 2011, 438, 121–124. (In Russian) [Google Scholar]
- Akitomo, K.; Tanaka, K.; Awaji, T.; Imasato, N. Deep Convection in a Lake Triggered by Wind: Two-Dimensional Numerical Experiments with a Nonhydrostatic Model. J. Oceanogr. 1995, 51, 171–185. [Google Scholar] [CrossRef]
- Ravens, T.M.; Kocsis, O.; Wuest, A.; Granin, N. Small-scale turbulence and vertical mixing in Lake Baikal. Limnol. Oceanogr. 2000, 45, 159–173. [Google Scholar] [CrossRef]
- Shimaraev, M.N.; Granin, N.G. Temperature stratification and the mechanism of convection in Lake Baikal. Dokl. Akad. Nauk. SSSR 1991, 321, 381–385. (In Russian) [Google Scholar]
- Carmack, E.C.; Wiess, R.F. Convection in lake: An example of thermobaric instability. In Deep Convection and Deep Water Formation in the Oceans; Chu, P.C., Gascard, J.C., Eds.; Elsevier Science Publishers: Amsterdam, The Netherlands, 1991; pp. 215–228. [Google Scholar]
- Shimaraev, M.N.; Domysheva, V.M.; Gnatovskii, R.Y.; Blinov, V.V.; Sakirko, M.V. The influence of deep convection on aeration of thebotto m zone in Baikal. Geogr. Nat. Resour. 2016, 37, 212–219. [Google Scholar] [CrossRef]
- Forel, F.A. La congélation des lacs Suisses et savoyards pendant l’hiver 1879–1880. Lac Léman. L’Écho Des Alpes. 1880, 3, 149–161. [Google Scholar]
- Blokhina, N.S.; Pokazeev, K.V. A unique natural phenomenon is the thermal bar. Earth Universe 2015, 6, 78–88. (In Russian) [Google Scholar]
- Likhoshway, Y.V.; Kuzmina, A.Y.; Potyemkina, T.G.; Potyemkin, V.L.; Shimaraev, M.N. The distribution of diatoms near a thermal bar in Lake Baikal. J. Great Lakes Res. 1996, 22, 5–14. [Google Scholar] [CrossRef]
- Blokhina, N.S. The influence of wind on the development of a thermal bar and currents in reservoirs of different depths during ice cover melting. Mosc. Univ. Phys. Bull. 2015, 70, 319–325. [Google Scholar] [CrossRef]
- Malm, J. Spring circulation associated with the thermal bar in large temperate. Hydrol. Res. 1995, 26, 331–358. [Google Scholar] [CrossRef]
- Tsydenov, B.O. A numerical study of the thermal bar in shallow water during the autumn cooling. J. Great Lakes Res. 2019, 45, 715–725. [Google Scholar] [CrossRef]
- Hohmann, R.; Kipfer, R.; Peeters, F.; Piepke, G.; Imboden, D.M.; Shimaraev, M.N.; Hohmann, R.; Kipfer, R.; Peeters, F.; Piepke, G.; et al. Processes ofdeep-water renewal in Lake Baikal. Limnol. Oceanogr. 1997, 42, 841–855. [Google Scholar] [CrossRef]
- Sherstyankin, P.P. On the maximum density temperature and thermobaric properties of deep fresh waters on an example of Lake Baikal. Dokl. Akad. Nauk. 2000, 375, 107–111. (In Russian) [Google Scholar]
- Tsydenov, B.O. Numerical Modeling of the Effect of Inflow Water Mineralization in the Dynamics of the Autumnal Thermal Bar in Kamloops Lake. Mosc. Univ. Phys. Bull. Phys. Astron. 2018, 73, 94–100. [Google Scholar] [CrossRef]
- Schmid, M.; Budnev, N.M.; Granin, N.G.; Sturm, M.; Schurter, M.; Wuest, A. Lake Baikal deepwater renewal mystery solved. Geophys. Res. Lett. 2008, 35. [Google Scholar] [CrossRef]
- Tsydenov, B.O. Simulating phytoplankton growth during the spring thermal bar in a deep lake. J. Mar. Syst. 2019, 195, 38–49. [Google Scholar] [CrossRef]
- Orlanski, I. A simple boundary condition for unbounded hyperbolic flows. J. Comput. Phys. 1976, 21, 251–269. [Google Scholar] [CrossRef]
- Wilcox, D.C. Reassessment of the scale-determining equation for advanced turbulence models. AIAA J. 1988, 26, 1299–1310. [Google Scholar] [CrossRef]
- Tsydenov, B.O.; Kay, A.; Starchenko, A.V. Numerical modeling of the spring thermal bar and pollutant transport in a large lake. Ocean Model. 2016, 104, 73–83. [Google Scholar] [CrossRef]
- Chen, C.T.; Millero, F.G. Precise thermodynamic properties for natural waters covering only limnologies range. Limnol. Oceanogr. 1986, 31, 657–662. [Google Scholar] [CrossRef]
- Patankar, S. Numerical Heat Transfer and Fluid Flow; CRC Press: Boca Raton, FL, USA, 1980; 197p. [Google Scholar]
- Leonard, B. A stable and accurate convective modeling procedure based on quadratic upstream interpolation. Comput. Methods Appl. Mech. Eng. 1979, 19, 59–98. [Google Scholar] [CrossRef]
- Buleev, N.I. The method of incomplete factorization for solving two-dimensional and three-dimensional equations of the diffusion type. Zh. Vychisl. Matem. I Matem. Fiz. 1970, 10, 1042–1044. (In Russian) [Google Scholar] [CrossRef]
- Galazii, G.I. Atlas of Lake Baikal; Federal Service of Geodesy and Cartography of Russia: Moscow, Russia, 1993.
- Moll, R.A.; Bratkovich, A.; Chang, W.Y.B.; Pu, P. Physical, chemical, and biological conditions associated with the early stages of the Lake Michigan vernal thermal front. Estuaries 1993, 1, 92–103. [Google Scholar] [CrossRef]
- Tikhomirov, A.I. Thermal Regime of Large Lakes; Nauka: Leningrad, Russia, 1982; 232p. (In Russian) [Google Scholar]
- Tsvetova, E.A. Numerical modelling of hydrodynamic processes responsible for propagation of contaminants in a deep basin. Comput. Technol. 1997, 2, 102–108. [Google Scholar]
- Sinukovich, V.N.; Zharikova, N.G.; Zharikov, V.D. River Selenga runoff in its delta. Geogr. Nat. Resour. 2004, 64–69. (In Russian) [Google Scholar]
- Holland, P.R.; Kay, A.; Botte, V. A numerical study of the dynamics of the riverine thermal bar in a deep lake. Environ. Fluid Mech. 2001, 1, 311–332. [Google Scholar] [CrossRef]
- Tsydenov, B.O. The effects of heat fluxes on phytoplankton distribution in a freshwater lake. Atmos. Ocean. Opt. 2021, 34, 591–598. [Google Scholar] [CrossRef]
- Shimaraev, M.N.; Granin, N.G.; Zhdanov, A.A. Deep ventilation of Lake Baikal waters due to spring thermal bars. Limnol. Oceanogr. 1993, 38, 1068–1072. [Google Scholar]
Disclaimer/Publisher’s Note: The statements, opinions and data contained in all publications are solely those of the individual author(s) and contributor(s) and not of MDPI and/or the editor(s). MDPI and/or the editor(s) disclaim responsibility for any injury to people or property resulting from any ideas, methods, instructions or products referred to in the content. |
© 2025 by the authors. Licensee MDPI, Basel, Switzerland. This article is an open access article distributed under the terms and conditions of the Creative Commons Attribution (CC BY) license (https://creativecommons.org/licenses/by/4.0/).