Abstract
Water replenishment projects (WRP) are widely regarded by lake managers as an effective method for ecological restoration. But studies on multiple water receiving lakes indicate that multi-source water supplementation may exacerbate spatial heterogeneity in water quality. The primary causes are the uneven quality of external water sources and the morphology of the lakes themselves. Hangzhou’s West Lake, which relies on a single water source, also exhibits ecological differences between its lake areas. To explain this phenomenon from a hydrodynamic perspective, this study employs Delft3D model simulations to determine the spatiotemporal heterogeneity in the impact of artificial water replenishment on local water renewal times (LWRT) across different lake areas. The results indicate that, compared to natural conditions, WRP shortens the typical LWRT at most sites in West Lake and reduces the seasonal variation amplitude of LWRT. The WRP impedes local water exchange capacity in certain lake areas during specific months, potentially creating stagnant zones. Moreover, the spatiotemporal heterogeneity of its impact on West Lake’s hydrodynamic conditions amplifies differences in flow rhythms between lake regions, leading to fragmented water movement. This may ultimately compromise the integrity of the lake’s overall ecological environment. Managers of receiving lakes should consider increasing monitoring frequency and the number of monitoring stations to address more complex water quality conditions. Future designers of WRPs should incorporate the prevention of fragmented hydrodynamic conditions as an evaluation criterion in diversion scheme planning. This study provides references and evidence for lake ecological management and research on the impact mechanisms of WRPs on shallow lakes.
1. Introduction
Lakes are vital components of terrestrial ecosystems, playing an irreplaceable role in maintaining regional environmental stability and meeting human livelihood needs [1,2]. However, lakes worldwide are facing diverse ecological degradation risks due to excessive human activities and climate change [3,4,5,6]. While controlling primary disturbance sources, lake managers worldwide commonly implement artificial water replenishment projects (WRP) as a key approach to restore lake ecosystems. For example, lakes such as the Great Salt Lake [7], Lake Okeechobee [8,9], and Salvadoran coastal wetland lakes [10] in USA; Lake Urmia in Iran [11]; the Murray-Darling Basin in Australia [12,13]; the Aral Sea in Uzbekistan [14]; and China’s Poyang Lake [15,16], Baiyangdian [17,18,19,20], and Wulansuhai Lake [21,22] have all benefited to varying degrees from WRPs of different forms and scales. In these cases, WRPs—whether by increasing natural river flow or diverting external water into lakes—have demonstrated positive effects in addressing lake shrinkage, declining water levels, and eutrophication. Numerous related studies confirm the effectiveness of WRPs in restoring lake ecosystems [23,24].
However, due to constraints such as lake morphology, local hydrological conditions, and uneven spatiotemporal distribution of water resources, some WRPs involve complex designs. For instance, Baiyangdian in North China employs a multi-source water diversion scheme [18,20], while landscape lakes along the Yongding River use reclaimed water as the primary source for artificial supplementation [25]. Some WRPs may exert excessive external influence on partial or entire lakes, causing certain negative impacts. The most common consequences include fragmented water quality and ecological conditions in the water [20,26,27,28] receiving lakes, leading to reduced ecosystem stability and biodiversity loss [13]. Some researchers view this phenomenon optimistically, suggesting that increasing water exchange frequency and connectivity between lake regions can effectively mitigate the fragmentation caused by WRPs [13,20]. Others, however, argue that artificial water circulation may disrupt natural stratification and generate waves that hinder improvements in water clarity [29,30]. The divergence in opinions among scholars may stem from the unclear mechanisms behind the ecological fragmentation caused by WRPs. Some attribute it to water quality differences among multiple sources in multi-source diversion systems. However, even shallow lakes with a single water source, like Hangzhou’s West Lake, have exhibited significant spatial water quality differences after WRP [31]. Others argue that lake morphology, topography, and the layout of water diversion routes should not be overlooked [27,32]. For example, research on Lake Okeechobee demonstrates that improvements in its water quality result from the combined effects of internal hydrodynamic processes and external nutrient loading [8]. Other studies have also confirmed that hydrodynamic processes significantly influence key water quality parameters in lakes, such as algal concentration [33,34], dissolved oxygen levels [35,36], and water clarity [37,38,39]. But current research on this phenomenon still primarily focuses on water quality indicators. Incorporating hydrodynamic factors such as hydraulic retention time into existing evaluation metrics may be a crucial approach to mitigating the negative impacts and enhancing the ecological benefits of artificial water diversion. Nevertheless, more evidence and results from additional lakes are needed before implementation.
In large-scale, high spatiotemporal resolution studies of lake flow fields, the contribution of numerical models is indispensable. Particularly in shallow lakes with low flow velocities like West Lake, where velocity monitoring is easily disrupted [40], hydrodynamic numerical models significantly reduce the difficulty and cost of data acquisition. Researchers have utilized common hydrodynamic or hydro-ecological coupled models such as MIKE 21 [41], Delft3D [42,43,44], and EFDC [20,24,45] to design and evaluate the impacts of one or multiple diversion schemes on the overall or local hydro-ecological conditions of receiving lakes, including Baiyangdian [20], Chagan Lake [46], and Chaohu Lake [41]. Simultaneously, the water exchange capacity of local areas is a critical factor in evaluating hydrological connectivity and a major influencer of the ecological environment [16,47]. But most indicators used in existing studies to evaluate lake water exchange capacity can only measure the duration of exchange between local lake areas and external water bodies, such as water age [48,49], water retention time [50,51], and water renewal time [52,53]. These indicators are primarily influenced by the distance between the study region and the water inlets, making them unsuitable for evaluating the exchange capacity between local lake areas and surrounding waters, as well as the hydrological connectivity among different lake zones. Additionally, the release of endogenous pollutants from sediments in West Lake is easily disturbed by tourist activities, exhibiting high randomness. Consequently, the aforementioned indicators derived from tracer concentration calculations are inadequate for accurately assessing the capacity of local lake areas to withstand stochastic endogenous pollution. In conclusion, using numerical models to design sensitivity experiments, combined with hydrodynamic indicators tailored to the specific characteristics of the water receiving lake to evaluate outcomes, may be an effective approach for predicting the ecological restoration effects of WRPs and preventing its negative impacts.
Similarly to many water receiving lakes mentioned above, the WRP in West Lake—a shallow urban landscape lake in eastern China—has improved its overall water quality while simultaneously introducing spatiotemporal heterogeneity. This study aims to investigate whether the hydrodynamic characteristics of West Lake exhibit spatiotemporal heterogeneity similar to water quality parameters after the implementation of the WRP, and to quantitatively assess the WRP’s impact on the hydrodynamic conditions in different regions of the lake. Based on the Delft3D hydrodynamic model, this study designed sensitivity experiments to simulate the spatiotemporal distribution of the two-dimensional flow field in West Lake under both natural conditions and actual artificial water replenishment conditions from 2021 to 2023. Using this foundation, the local water renewal time (LWRT) responses to WRP across different lake areas were calculated, thereby analyzing the causes of hydrodynamic differences between lake regions following the implementation of the WRP. The results of this study demonstrate that the influence of WRP on the West Lake’s hydrodynamics is spatiotemporally heterogeneous. This heterogeneity may be one of the reasons why a single-source WRP leads to spatial and temporal variations in water quality. The study also validates the feasibility of employing hydrodynamic indicators as a metric for evaluating the ecological benefits of similar shallow-lake diversion projects. The findings of this study identify hydrodynamically vulnerable areas and key monitoring periods in West Lake under the current diversion scheme, providing practical guidance for daily water quality monitoring and optimized internal water diversion scheduling. The novelty of this study lies in its use of multi-year, measured diversion and drainage data—as opposed to idealized design schemes—to define the boundary conditions for the hydrodynamic model. Furthermore, it employs an improved hydrodynamic parameter as an evaluation metric. Consequently, our sensitivity experiments more accurately reflect the seasonal variations in the local water exchange capacity of the receiving lake, thus providing new hydrological insights into how WRP influences the seasonal flow patterns in different regions of a shallow lake.
2. Materials and Methods
2.1. Description of the Study Area
As shown in Figure 1, Hangzhou’s West Lake is located in southeastern China and is a world-renowned urban landscape lake. It has a surface area of approximately 6.5 km2, a relatively flat bottom, and an average depth of 2.27 m (Figure 1b). In addition to serving as a water source for urban and surrounding agricultural areas, West Lake also plays a role in regulating the water level of the Qiantang River and preventing urban flooding. The West Lake area is influenced by the subtropical monsoon, resulting in distinct seasonal patterns in precipitation and wind fields. As shown in Figure 2a,b, the second quarter experiences higher precipitation with prevailing easterly and southerly winds, while the fourth quarter has lower precipitation dominated by westerly and northerly winds.
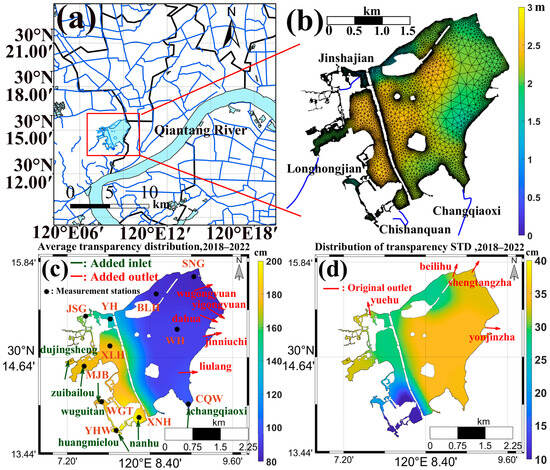
Figure 1.
(a) West Lake’s geographical location and surrounding water system. (b) Measured water depth distribution, computational grid, and locations of the 4 main inflow rivers. (c) Spatial distribution of average measured transparency in West Lake (2018–2022), locations of 11 water quality monitoring stations, and added water diversion and drainage outlets from the WRP. (d) Spatial distribution of transparency STD in West Lake and the original 4 outflow locations.
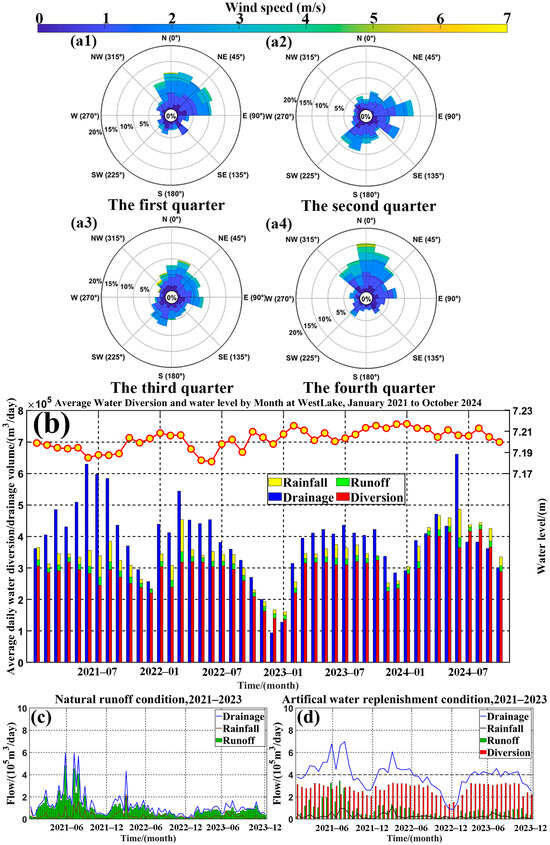
Figure 2.
Seasonal wind rose diagrams for 2021–2023: (a1) First Quarter, (a2) Second Quarter, (a3) Third Quarter, (a4) Fourth Quarter. (b) Measured water level of West Lake (red line), daily precipitation (yellow bars), daily runoff input (green bars), and recorded water diversion (red bars)/drainage (blue bars) data from the WRP, January 2021 to October 2024. (c) Case 1: drainage, precipitation, and runoff in West Lake under natural conditions (excluding artificial diversion data), January 2021 to December 2023. (d) Case 2: drainage, precipitation, runoff, and water diversion in West Lake under actual artificial WRP conditions, January 2021 to December 2023.
Before the implementation of the WRP, the primary water sources for West Lake were precipitation and inflows from 4 major rivers (Figure 1b). Lake water discharged into urban canals through 4 original outlets (Figure 1d). In the late 20th century, West Lake experienced prolonged eutrophication due to industrial, agricultural, and domestic wastewater, as well as tourism-related pollution within its watershed. This led to a decline in biodiversity and a significant reduction in its tourism value. To fundamentally improve the lake’s water quality, the Hangzhou municipal government implemented the West Lake Water Replenishment Project. In addition to controlling nutrient loads from river inflows, 6 new inlets were established on the western side to introduce water from the Qiantang River, treated through sedimentation ponds, with a designed diversion capacity of 400,000 m3/day. Meanwhile, 5 new outlets were added on the eastern side, forming the current “6 inlets and 9 outlets, east-to-west” water replenishment pattern [54]. Simultaneously, 11 water quality monitoring stations were established within the lake to track the ecological conditions of key lake regions, as shown in Figure 1c. These stations are: Shaoniangong (SNG), Jinshagang (JSG), Beilihu (BLH), Yuehu (YH), Xilihu (XLH), Waihu (WH), Changqiaowan (CQW), Xiaonanhu (XNH), Yuhuwan (YHW), Wuguitan (WGT), and Maojiabu (MJB).
Previous studies have demonstrated that the WRP reduces the overall water retention time of West Lake from approximately one year under natural conditions to about one month [55]. Consequently, pollutant concentrations were effectively lowered, and biodiversity was restored [31]. However, the uneven spatial distribution of inlets and outlets has led to significant ecological differences among lake areas, as large volumes of high-quality diverted water are concentrated in the western region. The average water transparency (represented by Secchi disk depth, SDD) data from key monitoring stations in West Lake provided by the management department from 2018 to 2022 shows that stations in the western lake areas, such as XNH, have significantly higher water clarity and lower transparency standard deviation (STD) compared to stations in the eastern lake areas like BLH. This indicates greater ecological stability during seasonal changes [56].
2.2. Data Description
The hydrodynamic model in this study was driven by the runoff inflow to the lake and measured water diversion and drainage data. The meteorological forcing for the model, comprising wind and precipitation, was sourced from daily monitoring data provided by a monitoring station located near the sedimentation tank. The station also provided West Lake water level data, which was used to estimate natural inflows excluding those from the 4 major rivers.
Figure 2b shows the actual daily average water diversion volume, actual daily average drainage volume, daily average precipitation input (calculated from rainfall), daily average runoff input, and water level of West Lake from January 2021 to October 2024. It can be observed that after the implementation of the WRP, the water level of West Lake remained stable at around 7.2 m throughout the year, with fluctuations of approximately 2 cm. By controlling the drainage volume, the management authorities maintained a general balance between water diversion and drainage, ensuring a relatively stable water level. But the actual diversion volume is constrained by the efficiency of sedimentation ponds, natural conditions of the water source, and the discharge capacity of the outlets, resulting in deviations from the designed daily target of 400,000 m3. In practice, daily diversion volumes exhibit large fluctuations, with notable seasonal variations across months. Overall, diversion volumes are relatively lower from November to January and higher during the rest of the year. The runoff input into West Lake is primarily influenced by precipitation [57,58]. The runoff data of the 4 major rivers used in this study were derived from a fitted curve based on measured runoff and precipitation [59].
The water quality data used in this study primarily included total phosphorus (TP), total nitrogen (TN), and water transparency. These data were obtained from the monthly average measurements provided by the West Lake management department from 11 key monitoring stations, whose spatial distribution is described in the previous section (Figure 1c). The selection of these water quality parameters was based on the fact that TP and TN are key indicators of lake eutrophication, while water transparency is a critical metric for assessing the aesthetic value and ecological health of urban landscape lakes [60,61]. These parameters were primarily used to assess the correlation between their coefficients of variation (CV) and that of the LWRT, and to investigate the consistency between the instability of the hydrodynamics and that of the water quality environment. The temporal resolution and period of the data are provided in Table 1.

Table 1.
Data sources and time periods used in the study.
2.3. Experimental Configuration: Natural Runoff and Actual Implementation of WRP
To investigate the impact of the WRP on the local water exchange capacity of West Lake, this study established 2 computational cases with different boundary conditions: Case 1 (natural conditions) and Case 2 (artificial conditions). By comparing the simulated flow field results under both scenarios from January 2021 to December 2023, the influence of artificial WRP on the natural flow patterns across different lake regions was evaluated. Apart from the modified boundary conditions, identical precipitation and wind field data were used as driving inputs for both cases. The boundary conditions for the 2 cases are shown in Figure 2c,d, respectively. Figure 2c (Case 1) displays the precipitation (brown solid line), runoff (green bars), and discharge (blue solid line) of West Lake from January 2021 to December 2023, excluding the water diversion volume. The drainage is allocated proportionally to the 4 original outlets based on the design. Figure 2d (Case 2) illustrates the precipitation, runoff, actual discharge, and diversion volume (red bars) of West Lake during the same period.
2.4. Numerical Model Configuration
Delft3D (D-Flow FM Version 1.2.177.142431) is a widely used comprehensive numerical model for aquatic environments developed by Delft University of Technology in the Netherlands. It integrates modules for hydrodynamics, waves, sediment transport, water quality and ecology, and tracer tracking. As mentioned in the introduction, its core hydrodynamic module solves the continuity equation and the Navier–Stokes equations, enabling accurate simulation of high-resolution water movement within the study area. This helps researchers understand and predict the movement and interactions of water, substances, and energy in both natural and artificial environments. The model has been successfully applied in lakes worldwide [62,63], including West Lake [64]. The coupling between different modules enables it to simulate interactions among processes such as water flow, waves, sediment transport, water quality, and ecology, making it a commonly used and essential tool in water resources and environmental research.
In previous research [59], we calibrated and validated the model’s parameterization scheme using vertically averaged flow velocity measurements from multiple stations in West Lake, obtained through buoy-mounted acoustic Doppler current profiler (ADCP) deployments as conducted by You et al. [40]. This study continues to adopt the previously established model configuration. The computational grid and water depth distribution used in this study are shown in Figure 1b. The grid consists of 52,978 cells, with refinement applied near shorelines and artificial embankments to better capture water exchange processes between different lake areas. The bathymetry data of West Lake were obtained from field measurements conducted in May 2024. In this study, in addition to the previously used Mean Absolute Error (MAE) and Root Mean Square Error (RMSE), we also used the Nash-Sutcliffe Efficiency coefficient (NSE) to evaluate the discrepancy between measured and simulated flow velocities. Furthermore, we analyzed Delft3D’s capability in simulating flow direction in West Lake. The calculation methods for each metric are as follows:
In Equations (1)–(3), xi and yi represent the measured and simulated flow velocity values, respectively, and n is the number of sample points.
2.5. Local Water Renewal Time and Statistical Evaluation Metrics
To evaluate the local water exchange capacity between specific lake areas and their surrounding waters, we applied the calculation method for overall lake hydraulic retention time [65] to individual grid cells in the hydrodynamic model in our earlier research [59]. This yielded an indicator: LWRT based on water flux across grid cell boundaries. This indicator considers only hydrodynamic factors and disregards water quality conditions in adjacent areas. It can be used to identify stagnant zones and prevent nutrient accumulation in low-flow areas. In previous studies, this metric has been confirmed as one of the key factors influencing local water transparency in West Lake [59]. But whether the WRP can significantly reduce this indicator remains questionable. The calculation process is as follows:
In Equation (4), ρ represents water density, hcell denotes the average water level of the grid cell, Scell is the area of the grid cell, Qedge signifies the flow rate across the boundary, m indicates the number of grid cell boundaries, and kc is a geometric correction parameter used to eliminate the influence of geometric variations between grid cells on the LWRT. In Equation (5), Lcell represents the total length of the grid cell boundaries, and hlake denotes the average water level of the lake.
In this study, the Signed Percentage Error and Mean Signed Percentage Error (MSPE) were employed to evaluate the impact of WRP on the LWRT time series of each lake area under natural conditions. To determine whether WRP had a significant effect on the LWRT at key stations, the Mann–Whitney U test was applied [66,67,68], as it does not require normally distributed data and is less sensitive to outliers. Skewness (SK) was used to assess the influence of the WRP on the right-skewness of LWRT data at typical key stations.
In Equations (6)–(8), yi represents the LWRT value under artificial conditions (Case 2) at a specific time, xi denotes the corresponding LWRT value under natural conditions (Case 1), and n is the sample size. A negative MSPE indicates that the local water exchange capacity in the study area has improved due to WRP. A positive SK value indicates right-skewed data, where the mean is greater than the median, suggesting the presence of large outliers in the dataset. The larger the SK value, the more pronounced the right-skewness.
3. Results
3.1. Model Validation
A comparison between simulated and measured flow velocities and directions in West Lake is shown in Figure 3, with the spatial distribution of specific sampling locations detailed in previous work [40,59]. The MAE for velocity simulation was 3.35 mm/s, and the RMSE was 4.78 mm/s. Tukey’s Fences analysis reveals that under high wind speed conditions (23 August 2013), the errors of 2 sets of simulated flow velocities significantly deviated from the overall level (Figure 3a). The likely cause of these substantial errors at these 2 stations is the discrepancy between the actual water depth of West Lake in 2013 and the depth measured in 2024. The overall accuracy of the model is comparable to the simulation accuracy achieved by You et al. using EFDC [40]. After excluding extreme outliers, the NSE between simulated and measured flow velocities is 0.79, which indicating satisfactory performance. In total, 28% of the samples had a flow direction simulation error within 15°, while 72% of the samples had an error within 90°. Some stations showed relatively large directional deviations, which may be related to interference in measured data caused by occasional factors such as boat activity.
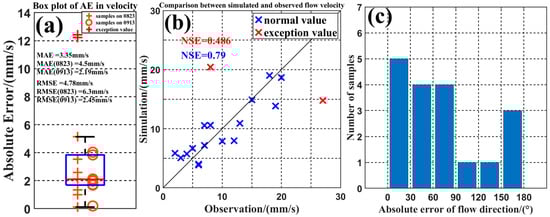
Figure 3.
(a) Box plots of simulated absolute errors for vertically averaged flow velocity in West Lake on 23 August and 13 September 2013 (red crosses indicate outliers). (b) Scatter plot of velocity comparison. (c) Histogram of flow direction simulation errors.
Under non-extreme weather conditions such as high winds, the simulated flow velocities from the model demonstrate high reliability, with an average error ranging from 2 to 5 mm/s. The primary sources of model error likely stem from discrepancies between the actual diversion data and the design scheme, as well as insufficient spatiotemporal resolution of the input wind field.
3.2. Correlation Between LWRT and Key Water Quality Parameters
The relationship between water transparency and LWRT at monitoring stations in West Lake is complex, with correlations exhibiting varying characteristics under different water quality conditions and showing no significant monotonic trend [59]. However, as shown in Figure 4a, stations exhibiting more stable transparency (lower CV in SDD) during seasonal changes also tend to have more stable LWRT (lower CV in LWRT). The Spearman correlation test results indicate a correlation coefficient of ρs = 0.49 between the CV of SDD and the CV of LWRT, with a significance level of p = 0.13, indicating a non-significant positive correlation. Similarly, as shown in Figure 4b–d, the CV for TN and TP at each monitoring station exhibit positive correlations with the CV of LWRT at varying significance levels. This suggests that maintaining a relatively stable hydrodynamic environment may be consistent with sustaining stable water quality and aquatic ecological conditions. However, the significance levels indicate that the current results are only suggestive rather than conclusive. The low significance may be attributed to the limited number of monitoring stations and insufficient sample size. Increasing the spatial resolution of monitoring stations in the future could yield more compelling evidence.
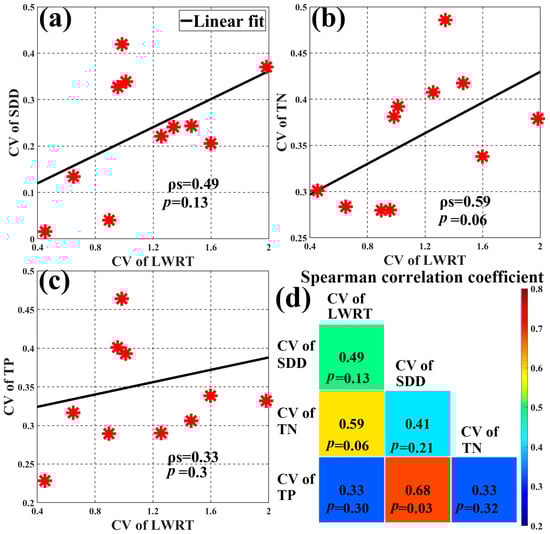
Figure 4.
Linear regression results and Spearman correlation coefficients for (a) the CV of SDD, (b) the CV of TN, and (c) the CV of TP, obtained from 11 monitoring stations, against the CV of LWRT. (d) Pairwise Spearman’s correlation coefficients and significance levels among the four parameters.
3.3. Impact of the WRP on Monthly LWRT at Key Stations
As shown in Figure 5, under the artificial conditions, the median monthly LWRT at over half of the key stations (SNG, JSG, YH, CQW, XNH, WGT) decreased compared to natural conditions throughout the year. The most obvious reduction was observed at the XNH station, where the 90% confidence upper limit of LWRT under artificial conditions was lower than the 90% confidence lower limit under natural conditions for all corresponding months. In contrast, the remaining stations showed an increase in the median LWRT under artificial conditions compared to natural conditions for varying numbers of months. This phenomenon was most pronounced at the MJB station, where the median LWRT was higher under artificial conditions for more than half of the months. When extreme values are taken into account and the data are considered as a whole, only 5 key stations (SNG, YH, CQW, XNH, WGT) exhibit negative MSPE values across all months. The remaining stations show a decrease in local water exchange capacity under artificial conditions for varying numbers of months. This phenomenon remains most evident at the MJB station, where the MSPE values are positive across all months. As shown in Figure 6a, during the entire study period, 7 stations (SNG, JSG, YH, CQW, XNH, YHW, and WGT) located near water inlets or outlets exhibited negative MSPE values. In contrast, 3 central lake stations (BLH, XLH, and WH), situated farther from water inlets and outlets, showed low positive MSPE values. The MJB station, influenced by complex hydrodynamic conditions due to its proximity to river estuary and multiple inlets, recorded relatively high positive MSPE values. Thus, although the WRP effectively reduces the median LWRT at most key stations, its overall reduction in LWRT values is limited to small areas, exhibiting certain spatial heterogeneity.
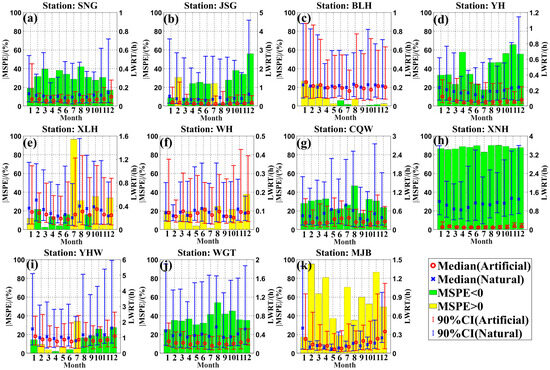
Figure 5.
Median and 90% confidence intervals (CI) of monthly LWRTs at 11 key stations: (a) SNG, (b) JSG, (c) BLH, (d) YH, (e) XLH, (f) WH, (g) CQW, (h) XNH, (i) YHW, (j) WGT, (k) MJB under natural conditions (Case 1, blue x) and artificial conditions (Case 2, red O).
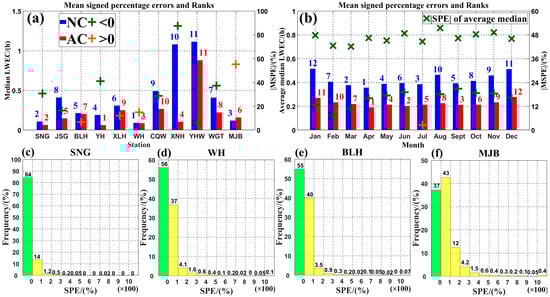
Figure 6.
(a) Median LWRTs and corresponding rankings at 11 key stations under both natural (blue) and artificial (red) conditions. (b) Average of median LWRTs across all key stations by month under both natural and artificial conditions. Histograms of SPE for stations (c) SNG, (d) WH, (e) BLH, and (f) MJB.
To demonstrate the impact of the WRP on the seasonal variation trends of LWRT at each station, this study ranked the monthly median LWRT values for all 11 stations from smallest to largest under both natural conditions and artificial conditions. Linear fitting and Spearman’s footrule distance calculations were then performed. The results in Figure 7 showed that the WRP reduced the impact of seasonal variations on the monthly median LWRT at most stations, meaning the amplitude of seasonal fluctuations in monthly median LWRT was attenuated. Among the 11 key stations, only BLH showed a steeper linear fitting slope under the artificial conditions compared to natural conditions. The remaining stations exhibited varying degrees of slope reduction, with XNH again demonstrating the most pronounced change. Spearman’s footrule distance results indicate that, among all stations, the WRP had the most obvious impact on the seasonal variation trends of LWRT at the BLH station (Spearman’s footrule distance = 38) and the XNH station (Spearman’s footrule distance = 34). However, the manner in which the WRP influenced these 2 stations differed substantially. The BLH station, located far from the shoreline, exhibited minimal seasonal variation in LWRT under natural conditions, with a fitting slope of 0.0036—the lowest among all stations—indicating weak seasonal differences in monthly median LWRT. Under artificial conditions, the slope increased to 0.0065. This change was primarily due to an extension of the median LWRT in January and March, and a reduction in July and October under the WRP’s influence. Consequently, the seasonal variation in hydrodynamic conditions at the BLH station became more pronounced under the influence of the WRP. In contrast, the XNH station exhibited the opposite trend. The WRP exerted a decisive influence on its flow field structure, reducing the fitting slope from 0.041 under natural conditions to 0.0048. This led to an obvious decrease in seasonal variation in monthly median LWRT and a substantial alteration of its natural seasonal rhythm. Meanwhile, the WH and MJB stations experienced minimal impact on their monthly median LWRT seasonal patterns from WRP (Spearman’s footrule distance = 16), largely preserving their inherent seasonal trends.
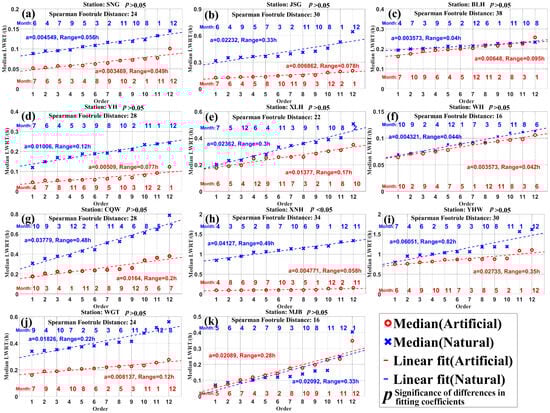
Figure 7.
Sorting of monthly LWRT medians from smallest to largest for the 11 key stations: (a) SNG, (b) JSG, (c) BLH, (d) YH, (e) XLH, (f) WH, (g) CQW, (h) XNH, (i) YHW, (j) WGT, (k) MJB under natural conditions (Case 1, blue x) and artificial conditions (Case 2, red O).
Based on the monthly median LWRT across all stations as the evaluation metric, WRP had the greatest impact on West Lake’s local water renewal capacity in August (SPE = −54.5%) and the least in March (SPE = −42.2%) (Figure 7b). Using the monthly MSPE of LWRT as the evaluation metric, all months except July (MSPE = 2.6%) showed negative values. September exhibited the most significant reduction in LWRT due to WRP (MSPE = −20.9%), while February showed the mildest effect (MSPE = −7.4%). The main reason for this discrepancy is that the LWRT at most stations does not follow a normal distribution and contains significant outliers. Using the median as the evaluation metric helps mitigate the influence of these outliers and reflects the typical level of LWRT. The histograms of SPE for selected representative stations are shown in Figure 7c–f. Taking the SNG station as an example, monitoring sites near water inlets or outlets predominantly exhibited negative SPE values, indicating that WRP enhanced local water exchange capacity under most conditions. Only in a few instances were SPE values positive, and no extreme values with SPE > 1000% were observed. For stations such as WH and BLH, which were located far from the shoreline, the WRP reduced LWRT values compared to natural conditions for more than half of the time. However, it also led to extreme prolongation of LWRT in some instances. At these 2 stations, SPE exceeded 1000% for 0.14% and 0.07% of the period, respectively, exerting a non-negligible impact on the data’s mean values and intensifying the overall right-skewness of the time list. At the MJB station, located near multiple water diversion inlets and stream inflow, SPE values were positive for more than half of the time, with SPE exceeding 1000% during 0.43% of the period. Whether evaluated by median or MSPE, the LWRT at this station showed some prolongation under artificial conditions compared to natural conditions, warranting close attention from managers.
3.4. Seasonal Differences in the Influence of WRP on the Spatial Distribution of LWRT
As shown in Figure 8, under natural conditions, the median LWRT for the entire West Lake from 2021 to 2023 was 0.19 h, with an interquartile range (IQR) of 0.111 h. The median LWRT exceeded 0.8 h in several key monitoring areas, including JSG, northern MJB, central XLH, WGT, YHW, XNH, CQW, and central BLH. These areas with limited water exchange capacity are mostly concentrated in the western part of West Lake, while most stations in the eastern part exhibit good water exchange capacity, with only some areas near islands and shorelines showing longer median LWRT. Areas accounting for 0.092% of the total lake area had a median LWRT exceeding 720 h, identified as stagnant water risk zones (marked with red “x” symbols), which were concentrated near the shoreline. Under artificial conditions, the median LWRT for the entire West Lake area was 0.121 h, with an IQR of 0.0656 h, both of which showed a decrease compared to natural conditions. Thus, while the WRP improved the typical LWRT level in West Lake, it also made the median LWRT more consistent and concentrated across most areas. Under artificial conditions, the area of stagnant water risk zones with a median LWRT exceeding 720 h was reduced to 0.052% of the total lake area. Although the risk zones were significantly reduced, they were not completely eliminated. Moreover, the stagnant water risk zones under artificial conditions were not a subset of those under natural conditions—for example, 2 new risk zones emerged near the northern area of BLH station.
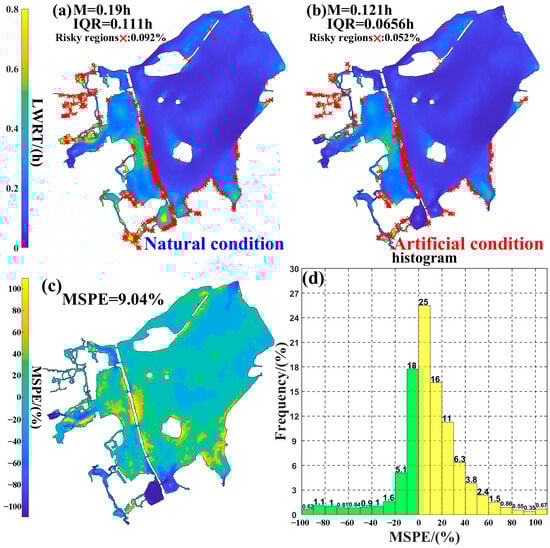
Figure 8.
Spatial distribution of median LWRT in West Lake under (a) natural conditions and (b) artificial conditions from 2021 to 2023. (c) Distribution of MSPE for LWRT in different areas of West Lake. (d) Histogram of MSPE for different areas of West Lake (area-weighted).
In the main lake areas, the median LWRT at several key stations near newly added water inlets decreased, with the most obvious reductions observed at XNH, CQW, and WGT. Areas with LWRT greater than 0.8 h were substantially reduced. However, under artificial conditions, extensive areas with a median LWRT exceeding 0.8 h still persisted in northern JSG, northern MJB, central XLH, and central BLH. When using the median as the evaluation metric, approximately 77.6% of the lake area exhibited a smaller median LWRT under artificial conditions. However, when using MSPE as the evaluation metric, only 30.7% of the lake area had an MSPE value less than 0. As shown in Figure 8, these areas are mostly concentrated near the inlets or outlets. This result indicates that while the WRP can improve the typical local water renewal capacity in most areas, it also leads to obvious prolongation of LWRT under specific conditions in many regions compared to natural conditions.
The impact of the WRP on the spatial distribution of LWRT in West Lake is also influenced by seasonal factors. Figure 9 and Figure 10, respectively, illustrate the spatial distribution and histograms of MSPE for LWRT in West Lake under natural conditions and artificial conditions for each month during the study period. The results indicated that from the first to the fourth quarter, the effectiveness of the WRP in reducing the LWRT in various lake areas of West Lake increased progressively each quarter. In the first quarter, a large positive MSPE value was observed in the vicinity of the CQW station in the southeastern part of West Lake, as well as across an extensive area near the XLH station in the western part of the lake, indicating an obvious degradation of hydrodynamic conditions under the influence of WRP. The lake-wide MSPE for all 3 months in the first quarter exceeded 10%, which was above the average of all months. Specifically, the MSPE reached 19.3% in March, the highest value recorded in any month. Furthermore, the areas of the lake with an MSPE greater than 100% accounted for 3.5% and 3.2% of the total lake area in February and March, respectively, signifying severely restricted natural exchange capabilities in these regions. In the second quarter, the negative impact of WRP on the LWRT near the CQW station in the southeastern part of West Lake decreased. However, the lake-wide MSPE remained above 10%, and the lake area with an MSPE greater than 100% showed a reduction compared to the first quarter. In the third quarter, the negative impact of the WRP on the LWRT in West Lake decreased monthly. Specifically, in September, the lake area with an MSPE of less than 0 accounted for 55%, a percentage only lower than the 60.5% recorded in November among all months. Nonetheless, areas near key stations such as XLH and CQW remained the most adversely affected by WRP. During the fourth quarter, the lake-wide MSPE in West Lake was below 0 across all months, making it the quarter with the most obvious improvement in LWRT due to WRP. Notably, November recorded an MSPE of −2.7%, standing as the only month out of the 12 where this indicator showed a negative value. Additionally, the local water exchange capacity in the open waters near the WH station improved substantially during this period, while the lake area with an MSPE greater than 100% was the smallest among all quarters.
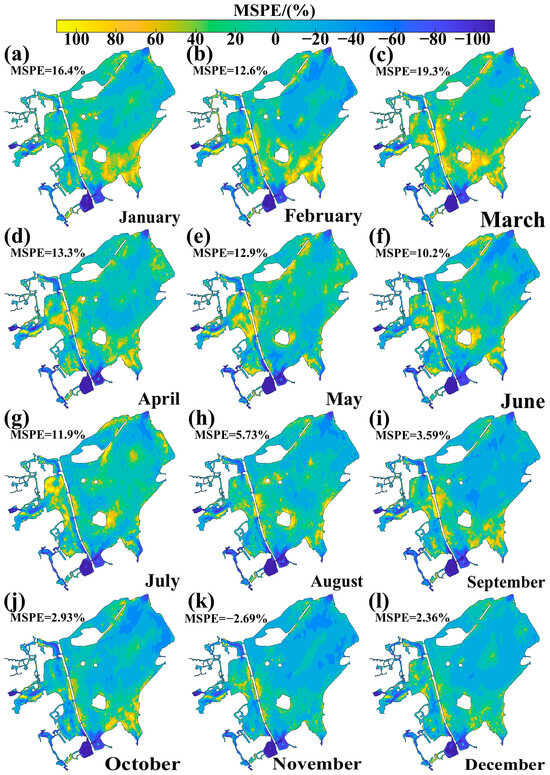
Figure 9.
Spatial distribution of monthly MSPE for LWRT in West Lake from (a) January to (l) December.
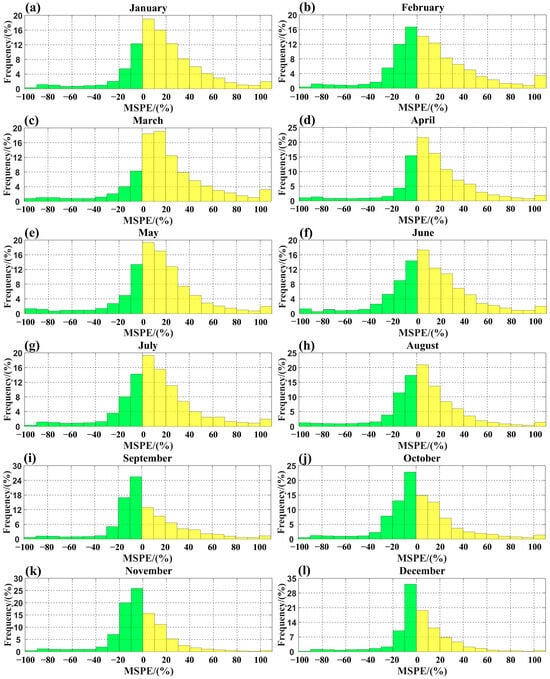
Figure 10.
Area-weighted histograms of monthly MSPE for LWRT in West Lake from (a) January to (l) December.
In summary, the impact of the WRP on the local water exchange capacity in West Lake was heterogeneous in both time and space. Spatially, while the existing WRP strategy effectively shortened the local water exchange time in areas near the inlets, it potentially prolonged it in lake regions distant from the inlets and outlets. Consequently, the current water quality monitoring stations may not fully represent the average condition of the entire lake. Therefore, increasing the number of monitoring stations and enhancing their spatial resolution may be necessary in the future. In terms of temporal distribution, the existing actual WRP was most effective in improving the local water exchange capacity across all regions of West Lake during the fourth quarter, while its effectiveness was least pronounced in the first quarter. For certain months, adjusting the flow rate of water diversion and drainage in the sedimentation tanks may be necessary to mitigate negative impacts on the lake’s original flow field structure.
3.5. Impacts of the WRP on Flow Directions at Key Stations
The LWRT can only measure the rate of water exchange between the study area and adjacent lake regions, but cannot reflect whether the direction of this exchange is unidirectional. Therefore, further analysis of the impact of WRP on the flow field in the study area should be conducted based on flow direction changes at typical monitoring sites under both natural and artificial conditions. Figure 11a,b display the average flow direction and its STD for each month at the 11 key monitoring stations under both natural and artificial conditions. Under natural conditions, the average monthly flow directions at stations WH, CQW, and MJB exhibited minimal variation, whereas the monthly mean flow directions at the other stations were obviously influenced by seasonal changes, showing substantial shifts between different months. Under artificial conditions, the monthly mean flow directions at most stations underwent certain alterations, accompanied by a weakening of seasonal variations. Only the monthly mean flow directions at stations XLH, BLH, and YHW still exhibited relatively distinct seasonal variations. In contrast, the flow directions at the remaining stations showed minimal differences between months. This was particularly evident at the XNH station, located near the main water inlet, where the flow direction was extremely unidirectional. WRP had a deterministic influence on the flow direction at this station, a finding that is consistent with the LWRT results. The impact of WRP on both the seasonal and intra-monthly variations in flow direction at key stations in West Lake demonstrated a certain degree of heterogeneity compared to natural conditions.
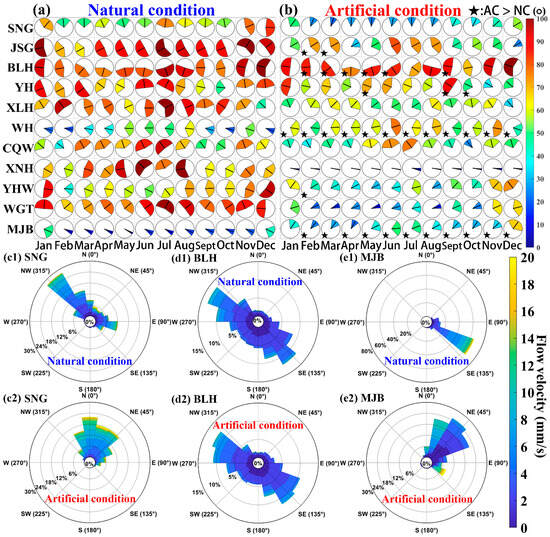
Figure 11.
(a,b) Monthly mean flow direction and STD at 11 key stations in West Lake under natural and artificial conditions for different months. In (b), the black pentagrams indicate stations where the STD of flow direction under artificial conditions exceeds that under natural conditions for the corresponding month. Flow rose diagrams for stations (c1,c2) SNG, (d1,d2) BLH, and (e1,e2) MJB under natural and artificial conditions.
Under artificial conditions, the STD of flow direction decreased across all months for approximately half of the key monitoring stations, with the most pronounced reduction observed at XNH. Although the monthly mean flow direction at XLH continued to show obvious seasonal variation, its monthly flow direction STD decreased consistently compared to natural conditions. For stations JSG, YHW, and YH, the flow direction STD under artificial conditions was higher than under natural conditions for no more than 3 months, and these were consistently months when the stations’ intrinsic monthly flow direction STD was already low. In contrast, stations BLH, WH, and MJB exhibited a higher monthly flow direction STD under artificial conditions for more than half of the months. Among these, the difference in the flow direction STD for station BLH between the 2 conditions was relatively small across all months, with the annual flow direction STD changing by only 2.1% due to WRP. The monthly mean flow direction at BLH was also minimally affected. This indicates that, consistent with the LWRT findings, the impact of the WRP on the flow direction at station BLH was limited. The pattern observed at WH station was similar to that at the BLH station, with only minor northward deflections in the monthly mean flow direction occurring in June and August. However, the monthly flow direction STD at WH station increased across all months, resulting in a 48.3% rise in the total flow direction STD due to WRP. This indicates that while the WRP did not substantially alter the seasonal pattern of the monthly mean flow direction at station WH, it increased the directional variability. This effect was opposite to that observed at most other stations. As for station MJB, its monthly mean flow direction exhibited no significant seasonal variation under either natural or artificial conditions. However, the WRP increased the station’s overall flow direction STD by 60.9%, resulting in a more complex local flow field under most months. This enhanced its connectivity and exchange capacity with a broader range of surrounding water bodies.
The flow rose diagrams in Figure 11c–e provide a more detailed visualization of the flow velocity distribution by direction for 3 key stations under both natural and artificial conditions, serving to further substantiate the preceding analysis. Consistent with the analytical results above, WRP had a relatively limited impact on the flow direction distribution at stations such as BLH. Its primary effect was an increased frequency of flow directions that originally had low occurrence probabilities under natural conditions, thereby enhancing connectivity along pathways that previously experienced limited water exchange. In contrast, the flow directions at most other stations, represented by SNG, became more concentrated in 1 or several specific directions under the influence of the WRP. The project generally reduced the seasonal variability in flow direction at most stations, leading to a more homogenized flow field structure. However, it also resulted in a more uniform distribution of flow directions in some areas, demonstrating significant spatial heterogeneity in its effects.
4. Discussion
4.1. WRP Increased the Stagnant Water Risk at Several Stations by Amplifying the SK of LWRT
Based on the aforementioned results, it can be observed that compared to natural conditions, the median LWRT in most areas of West Lake decreased under artificial conditions. However, MSPE revealed that the overall level of LWRT in most areas was negatively impacted by the WRP. The LWRT samples at all stations under both cases showed a right-skewed distribution, with a large discrepancy between the mean and median. This indicates that the datasets contained a notable number of outliers. The average proportion of these outliers, identified using the interquartile range method, was 7.5% and 7.3% for the 11 stations in the two cases, respectively. Therefore, the median value, being unaffected by extremes, better reflects the typical level of the data. In contrast, while the MSPE reflects the overall level of the sample, it assigns important weight to extreme values. Both indicators have their respective strengths and limitations.
To better illustrate the differences in LWRT under the 2 cases at key monitoring stations, Figure 12 presents violin plots of LWRT under both natural and artificial conditions for these stations. Based on the changes in the shape of the LWRT histograms at each station, the BLH, XLH, WH, and MJB stations (Figure 12c,e,f,k)—which had positive MSPE values (Figure 7a)—showed no substantial morphological changes. In contrast, the other stations with negative MSPE values exhibited significant changes, displaying a distinct flattening of the distribution (a higher frequency at the peak but a correspondingly smaller LWRT value at that peak). With the exception of JSG, the CV of these stations exhibiting flattened violin plots under artificial conditions were also lower. This demonstrates that the current WRP design effectively improved and stabilized the local water exchange capacity at most monitoring stations.
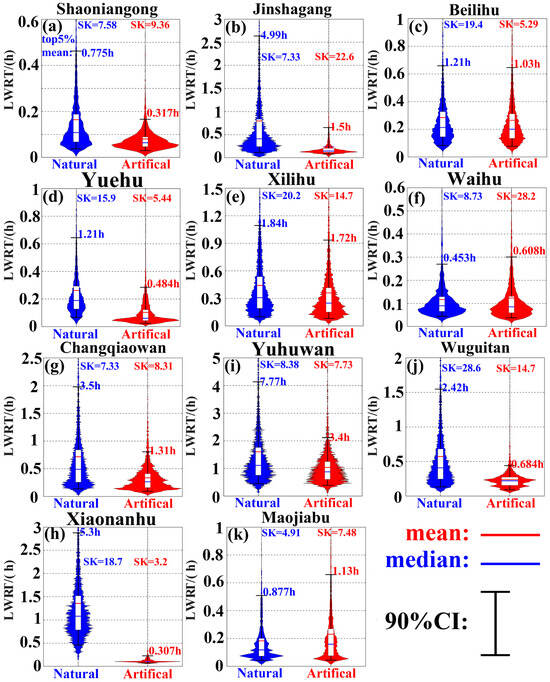
Figure 12.
Histograms of LWRT under natural and artificial conditions at each station: (a) SNG, (b) JSG, (c) BLH, (d) YH, (e) XLH, (f) WH, (g) CQW, (h) XNH, (i) YHW, (j) WGT, (k) MJB, along with the mean of the top 5% maximum values. (Red line: mean value; blue line: median value; black line: 90% confidence interval).
However, the changes in SKs presented in Figure 12 indicate that the WRP was less effective at improving the extreme values of LWRT compared to its effect on the median. The SK was higher under artificial conditions at nearly half of the key stations, exacerbating the right-skewness of the data. This result is relative. In absolute terms, the median, mean, and the average of the top 5% of maximum LWRT values at the vast majority of stations were lower under artificial conditions than under natural conditions. There was no absolute aggravation of extreme LWRT values or stagnant water risk, and thus no cause for concern regarding hypoxia or vertical stratification resulting from reduced water mobility [42,69]. But an amplified SK indicates increased asymmetry in the sample distribution. This means that these stations have a higher probability of experiencing extreme LWRT values that deviate from the typical level, which also represents an ecological risk that cannot be ignored. Consequently, this places greater demands on the early warning and monitoring capabilities of lake management authorities.
In contrast, several stations exhibited an absolute increase in stagnant water risk. For example, at WH station, although WRP did not obviously alter the mean (105.6%) or median (95.4%) of LWRT, it increased the mean of the top 5% maximum LWRT values and the SK to 134.2% and 323% of their natural levels, respectively. This substantially lowered the lower limit of its water exchange capacity, creating a tangible risk of water stagnation. This phenomenon is not unique to West Lake. Multiple water receiving lakes of WRPs have demonstrated significantly less improvement in hydrodynamic conditions in open water areas compared to bay areas [52,70]. Perhaps a more rationally planned WRP implementation scheme could mitigate this issue. The situation at MJB station was similar. But compared to WH station, which is located in open water region, MJB has a more complex flow field and experienced a greater negative impact on its water exchange capacity from the WRP. This warrants attention from management authorities to prevent the formation of stagnant zones. Beyond directly improving hydrodynamic conditions, planting emergent aquatic plants or introducing nitrogen-fixing microorganisms in low-flow areas may also be effective strategies for addressing water quality deterioration in stagnant zones and promoting the ecological stability of lakes or wetlands [71,72]. In contrast, although WRP also did not substantially reduce the mean (93.1%) or median (94.2%) of the LWRT at the BLH station, it decreased the SK of LWRT to 27.3% of the level observed under natural conditions. This resulted in an improved lower limit for the station’s water exchange capacity under extreme scenarios, thereby reducing its potential for stagnant water formation.
4.2. Spatiotemporal Heterogeneity in the Impact of the WRP on LWRT
The analysis in Section 3.3 did not address the significance of the LWRT differences. To intuitively and concretely demonstrate the spatiotemporal heterogeneity of the WRP’s impact on the LWRT of West Lake, we conducted Spearman correlation checks and Mann–Whitney U tests on the monthly LWRT data from the 11 key stations under 2 conditions. As shown in Figure 13l, the WRP significantly altered the LWRT in more than half of the stations across all months, with these affected stations located in bays adjacent to the inlets or outlets. As for the WH and BLH stations, which are located in open waters far from the shoreline, their LWRT was the least affected by the WRP. Both stations showed no significant difference in LWRT compared to natural conditions for 7 months. This finding is consistent with the analysis in the previous section and is a common phenomenon in lakes receiving water from WRPs.
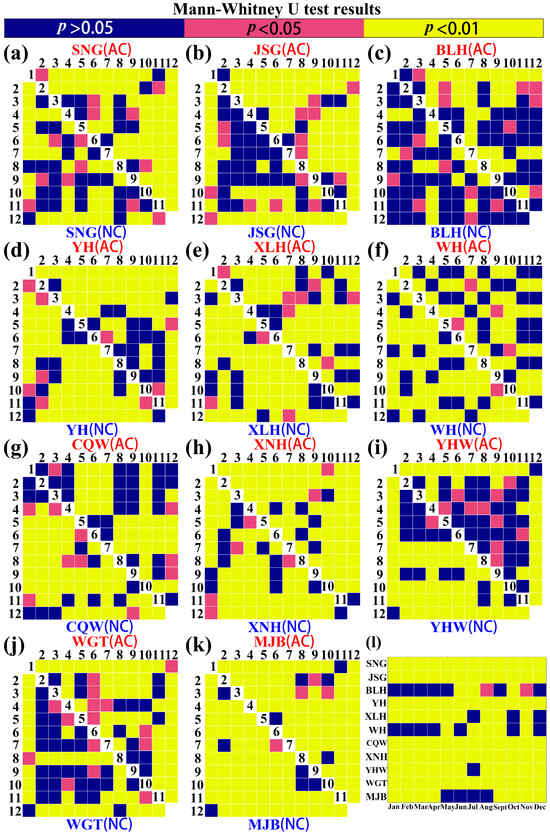
Figure 13.
(a–k) Results of Mann–Whitney U tests for LWRT between different months under natural conditions (lower triangle) and artificial conditions (upper triangle) at 11 stations in West Lake. (l) Results of Mann–Whitney U tests for LWRT between natural and artificial conditions across different months at the 11 stations. Yellow: very significant difference in median local water exchange time (p < 0.01); light red: significant difference (p < 0.05); blue: no significant difference (p > 0.05).
The Spearman correlation coefficients displayed in Figure 14 provide a more detailed representation of the correlation between LWRT under artificial and natural conditions for each station across different months. It is evident that the impact of the WRP exhibits strong spatial and temporal heterogeneity. Considerable differences in the Spearman correlation coefficients exist not only between different stations within the same month but also for the same station across different months. This phenomenon is also not unique to West Lake. Similarly, as a shallow lake, Wang Lake also exhibited spatial heterogeneity in hydrodynamics and water quality following the implementation of a WRP [27]. Furthermore, the local water exchange capacity of Dongting Lake, a large shallow lake, demonstrated significant seasonal differences due to runoff changes caused by upstream water conservancy projects, with shorter water exchange times in spring and summer compared to autumn and winter [73]. The current WRP scheme has unevenly affected the response capacity of different areas in West Lake to the external environment under natural conditions. This may be one of the reasons for the significant spatiotemporal heterogeneity in LWRT and the notable differences in water quality currently observed between the lake regions of West Lake. This situation differs somewhat from the water quality structure fragmentation in Lake Baiyangdian, which was caused by uneven quality of external inputs in its multi-source WRP [20].
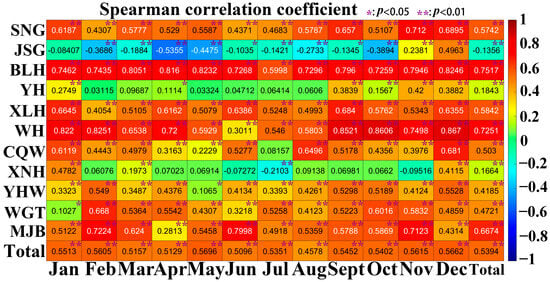
Figure 14.
Spearman correlation coefficients of LWRT between natural and artificial conditions for 11 stations across different months.
In addition to the influence of seasonal variations in natural factors such as wind fields and precipitation on the effectiveness of WRP, the diversion and drainage volumes in West Lake are subject to external factors including precipitation, source water quality, and the efficiency of sedimentation tanks. The unevenness of the actual diverted water volume may, to some extent, exacerbate the seasonal heterogeneity in the project’s impact on the LWRT of West Lake [74,75,76].
4.3. WRP Increased the Differences in the Seasonal Rhythm of LWRT Between Various Stations
Figure 13a–k sequentially present the Mann–Whitney U test results for LWRT data between 2 different months at the 11 key stations, under natural (lower triangle) and artificial conditions (upper triangle). Figure 15d shows the number of month combinations with no significant difference in median LWRT under natural (blue) and artificial (red) conditions at each station. Under natural conditions, station BLH had the highest number of month combinations showing no significant difference in median LWRT (43/66), followed by stations JSG (28/66), WGT (28/66), SNG (25/66). In contrast, the majority of monthly comparisons at station MJB (60/66) exhibited significant differences in median LWRT. Under artificial conditions, the total number of month combinations across all stations showing no significant difference in median LWRT decreased from 212 under natural conditions to 188. This indicates a slight increase in the significance of seasonal differences in median LWRT. Among these, the differences in LWRT were significant for most month combinations at stations XNH (59/66), JSG (58/66), and MJB (61/66). Station BLH still maintained a relatively high number of month combinations with no significant difference in median LWRT (28/66). However, unlike under natural conditions, this number no longer far exceeded that of other stations. Stations WH (26/66), CQW (26/66), and YHW (30/66) exhibited comparable quantities of such month combinations.
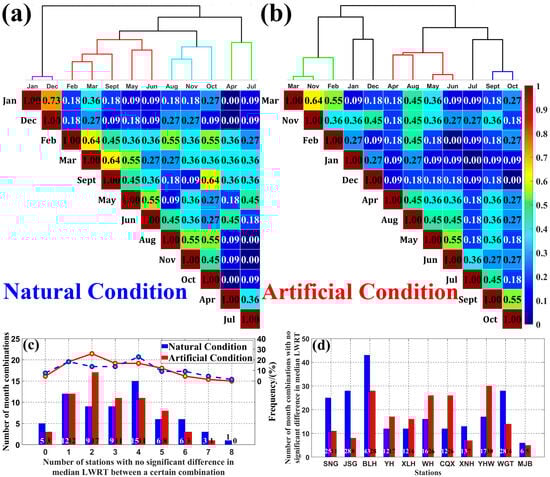
Figure 15.
(a,b) Frequency of non-significant LWRT differences observed across 66 month-combinations at 11 stations under natural and artificial conditions, and the clustering results of months based on this frequency. (c) Number of month-combinations exhibited no significant LWRT differences at 0–8 stations. (Blue dashed line: frequency of occurrence under natural condition; red solid line: frequency of occurrence under artificial condition). (d) Number of month-combinations exhibited no significant LWRT differences at key stations under natural and artificial conditions.
To investigate whether the specific month combinations showing no significant LWRT difference were consistent between natural and artificial conditions across different stations in West Lake, Figure 15a,b, respectively, display the frequency of the 66 month combinations which showed no significant LWRT difference across the 11 stations, and the clustering of these months based on this frequency. Under natural conditions, the flow field in West Lake exhibited distinct seasonal divisions and could be clustered into 4 groups: (January, December), (February, March, May, June, September), (August, October, November), and (April, July). Under artificial conditions, the seasonal characteristics of the lake-wide flow field in West Lake underwent huge changes, resulting in a more complex rhythm. In addition to 3 main month clusters, 3 months—January, December, and June—exhibited distinct water exchange capacities that differed from all 3 clusters, demonstrating their unique individual characteristics. Figure 15c reveals the underlying cause of these results by showing the number of month combinations that exhibited no significant LWRT differences across 0 to 8 stations, under both natural and artificial conditions. It shows that, compared to natural conditions, under artificial conditions most month combinations tend to exhibit no significant LWRT difference at only 1–3 stations, while fewer combinations show such consistency across more than 6 stations. This result indicates that under artificial conditions, the rhythmic patterns differ across the lake. A rhythm observed at 1 station is likely shared by only 1 or 2 other stations, rather than by 6 or 7. This finding is novel. Current research primarily focuses on the divergence in water quality and ecological trends between different lake areas of water receiving lakes, while overlooking the divergence in their hydrodynamic seasonal rhythms. Only a handful of studies have indicated that WRPs alter the original seasonal hydrodynamic rhythms of the receiving lakes, or even play a determining role in shaping new ones [23,77]. Although WRP reduced the amplitude of seasonal variation in LWRT at most stations, the enhanced spatial heterogeneity between stations resulted in a more fragmented and variable overall seasonal rhythm for the lake compared to natural conditions.
5. Conclusions
Based on the Delft3D hydrodynamic model, this study simulated the distribution of LWRT in West Lake under both natural and artificial WRP conditions from 2021 to 2023, using actual natural hydrological data and water diversion/drainage records. The study further analyzed the impact of the WRP on the water exchange capacity at 11 key monitoring stations in the lake across different months. The results indicated that the WRP enhanced the local water exchange capacity at most stations and reduced the seasonal amplitude of the median LWRT. The impact of the WRP on the hydrodynamic environment of West Lake exhibited significant spatiotemporal heterogeneity. While it enhanced the typical local water exchange capacity lake-wide, it also reduced this capacity in approximately 24.6% of the lake’s area. Furthermore, the effectiveness of the project’s impact varied considerably across different months. This amplified the differences in flow field rhythms between various lake regions, leading to a fragmentation trend in the lake’s hydrodynamic environment. Ultimately, this may compromise the integrity of the overall ecosystem and could lead to the emergence of stagnant water zones in areas such as MJB station. These findings are consistent with observations of hydrodynamic environments in other water receiving lakes, such as Wang Lake, and align with the spatiotemporal heterogeneity observed in West Lake’s water quality, which matches the study’s expectations. This consistency can be regarded as evidence supporting the hypothesis that WRPs may contribute to ecological fragmentation in receiving lakes. This insight will help researchers better understand the phenomenon and aid in preventing its occurrence in future WRPs. Furthermore, the study offers actionable recommendations for managing similar water bodies. Specifically, water management authorities should increase the number of monitoring stations and the frequency of observations after project implementation to address the potentially more complex lake environment. Additionally, fully accounting for the seasonal variations in the lake’s response to WRP is crucial for mitigating negative environmental impacts and optimizing project costs.
This study is currently in its preliminary stages and has several limitations. The primary drawback is that most of its conclusions are based solely on the impact of the WRP on the spatiotemporal distribution pattern of LWRT in West Lake. In subsequent work, we will build upon the existing hydrodynamic model to further integrate a water quality model. By designing sensitivity experiments, we will comprehensively compare the impacts of altered hydrodynamic conditions on the ecological structure of West Lake under varying external nutrient inputs. This will ultimately enable a quantitative assessment of the specific contribution of hydrodynamic fragmentation to the spatiotemporal differences in the lake’s transparency. Secondly, the currently available time series data for measured water quality and flow velocity are relatively short in duration and limited to 2 dimensions. This has resulted in limited statistical significance and persuasiveness for some of the conclusions. In subsequent work, we will enhance three-dimensional monitoring capabilities and increase the spatiotemporal resolution of data collection. This effort will simultaneously improve lake management practices and accumulate a more robust dataset for future research. Third, this study only investigated the impact of the existing WRP scheme on the LWRT of West Lake. It neither proposed improvement plans or specific supplementary measures, nor did it assess the resilience of the current scheme under extreme events such as typhoons and prolonged droughts. Following the completion of the aforementioned plan, we will utilize the coupled hydrodynamic–water quality model integrated with machine learning algorithms to develop a WRP scheme capable of effectively reducing the spatiotemporal differences in transparency and mitigating ecological risks in West Lake.
Author Contributions
Conceptualization, P.X., L.Z. and X.Z.; methodology, P.X., L.Z. and Z.M.; validation, P.X. and L.Z.; formal analysis, P.X. and Q.W.; investigation, L.R., J.Y. and Y.Z.; resources, L.R., J.Y. and Y.Z.; data curation, P.X., L.R., J.Y. and Y.Z.; writing—original draft preparation, P.X. and L.Z.; writing—review and editing, P.X. and L.Z.; visualization, P.X. and Q.W.; supervision, Z.M. and L.R.; project administration, L.Z., X.Z. and Z.M.; funding acquisition, Z.M. All authors have read and agreed to the published version of the manuscript.
Funding
This work was supported in part by the National Natural Science Foundation of China under Grant 61991454, in part by the National Key Research and Development Program of China under Grant 2023YFC3107605, in part by the Oceanic Interdisciplinary Program of Shanghai Jiao Tong University under Grant SL2022ZD206, and in part by the Scientific Research Fund of Second Institute of Oceanography, MNR under Grant SL2302.
Data Availability Statement
The original contributions presented in this study are included in the article. Further inquiries can be directed to the corresponding authors.
Acknowledgments
We are grateful to the anonymous reviewers for their constructive comments and helpful suggestions. We are grateful to Wei Wu from Hangzhou West Lake Administration for his valuable assistance in the revision of this paper.
Conflicts of Interest
Authors Lihua Rao, Jun Yang, and Yinying Zhou were employed by the company Hangzhou West Lake Administration. The remaining authors declare that the research was conducted in the absence of any commercial or financial relationships that could be construed as a potential conflict of interest.
References
- Weyhenmeyer, G.A.; Chukwuka, A.V.; Anneville, O.; Brookes, J.; Carvalho, C.R.; Cotner, J.B.; Grossart, H.P.; Hamilton, D.P.; Hanson, P.C.; Hejzlar, J.; et al. Global Lake Health in the Anthropocene: Societal Implications and Treatment Strategies. Earths Future 2024, 12, e2023EF004387. [Google Scholar] [CrossRef]
- Pi, X.H.; Luo, Q.Q.; Feng, L.; Xu, Y.; Tang, J.; Liang, X.Y.; Ma, E.Z.; Cheng, R.; Fensholt, R.; Brandt, M.; et al. Mapping global lake dynamics reveals the emerging roles of small lakes. Nat. Commun. 2022, 13, 5777. [Google Scholar] [CrossRef] [PubMed]
- King, L.; Devey, M.; Leavitt, P.R.; Power, M.J.; Brothers, S.; Brahney, J. Anthropogenic forcing leads to an abrupt shift to phytoplankton dominance in a shallow eutrophic lake. Freshw. Biol. 2024, 69, 335–350. [Google Scholar] [CrossRef]
- Wang, W.J.; Shi, K.; Wang, X.W.; Zhang, Y.L.; Qin, B.Q.; Zhang, Y.B.; Woolway, R.I. The impact of extreme heat on lake warming in China. Nat. Commun. 2024, 15, 70. [Google Scholar] [CrossRef]
- Maslennikova, A.; Udachin, V.; Deryagin, V.; Artemyev, D.; Filippova, K.; Gulakov, V.; Udachin, N.; Aminov, P. Sediment records of lake eutrophication and oligotrophication under the influence of human activity and climate warming in the Urals metallurgical region (Russia). Hydrobiologia 2023, 850, 1669–1698. [Google Scholar] [CrossRef]
- Cao, Z.G.; Melack, J.M.; Liu, M.; Kutser, T.; Duan, H.T.; Ma, R.H. Shifts, Trends, and Drivers of Lake Color Across China Since the 1980s. Geophys. Res. Lett. 2023, 50, e2023GL103225. [Google Scholar] [CrossRef]
- Grineski, S.E.; Mallia, D.; Collins, T.W.; Araos, M.; Lin, J.C.; Anderegg, W.R.L.; Perry, K. Harmful dust from drying lakes: Preserving Great Salt Lake (USA) water levels decreases ambient dust and racial disparities in population exposure. One Earth 2024, 7, 1056–1067. [Google Scholar] [CrossRef]
- Shin, S.; Her, Y.; Muñoz-Carpena, R.; Yu, X. Quantifying the contribution of external loadings and internal hydrodynamic processes to the water quality of Lake Okeechobee. Sci. Total Environ. 2023, 883, 163713. [Google Scholar] [CrossRef]
- Julian, P., II; Welch, Z. Understanding the ups and downs: Application of hydrologic restoration measures for a large subtropical lake. Lake Reserv. Manag. 2022, 38, 304–317. [Google Scholar] [CrossRef]
- Turner, R.E.; Swenson, E.M.; Lee, J.M.; Milan, C.S. Mass removal efficiencies in water and consequences after a river diversion into coastal wetlands: Second thoughts. Hydrobiologia 2024, 851, 1607–1623. [Google Scholar] [CrossRef]
- Safaie, A.; Jamaat, A. Numerical study of hydrodynamics and salinity transport processes in a hypersaline lake: A case study of Lake Urmia. Adv. Water Resour. 2024, 185, 104632. [Google Scholar] [CrossRef]
- Sheldon, F.; Rocheta, E.; Steinfeld, C.; Colloff, M.J.; Moggridge, B.; Carmody, E.; Hillman, T.; Kingsford, R.T.; Pittock, J. Are environmental water requirements being met in the Murray-Darling Basin, Australia? Mar. Freshw. Res. 2024, 75, MF23172. [Google Scholar] [CrossRef]
- Khurana, J.; Bino, G.; Hawke, T. Impacts of river regulation and fragmentation on platypuses in the northern Murray-Darling Basin. Mar. Freshw. Res. 2024, 75, MF24037. [Google Scholar] [CrossRef]
- Bao, A.M.; Yu, T.; Xu, W.Q.; Lei, J.Q.; Jiapaer, G.; Chen, X.; Komiljon, T.; Khabibullo, S.; Sagidullaevich, X.B.; Kamalatdin, I. Ecological problems and ecological restoration zoning of the Aral Sea. J. Arid Land 2024, 16, 315–330. [Google Scholar] [CrossRef]
- Wang, Z.X.; Xiao, Y.; Zhang, T.T.; Xu, C.; Gu, R.; Liu, J.M. Effects of a proposed hydraulic project on the surface water connectivity in Poyang Lake floodplain system, China: Numerical simulation and geostatistical analysis. J. Hydrol.-Reg. Stud. 2023, 50, 101593. [Google Scholar] [CrossRef]
- Huang, A.; Liu, X.; Peng, W.; Dong, F.; Ma, B.; Li, J.; Wang, W. Spatiotemporal characteristics, influencing factors and evolution laws of water exchange capacity of Poyang Lake. J. Hydrol. 2022, 609, 127717. [Google Scholar] [CrossRef]
- Pu, Z.; Bai, J.; Zhang, Q.; Tian, K.; Yang, W.; Zhao, Y.-W. Ecological water replenishment through optimal allocation of lake water in water-scarce areas based on channel selection and replenishment period: A case study of China’s Baiyangdian Lake. Sci. Total Environ. 2024, 956, 177340. [Google Scholar] [CrossRef]
- Sun, B.W.; Chen, W.; Li, N.; Wang, W.J.; Fu, C.F.; Liu, Y.Z.; Gao, X.P. Quantifying the effects of submerged aquatic vegetation on internal loading in lake: A modeling study of the largest shallow lake in North China br. Sci. Total Environ. 2022, 853, 158593. [Google Scholar] [CrossRef] [PubMed]
- Xu, R.-z.; Wang, Y.-s.; Yin, D.-c.; Wang, X.-q. Seasonal and Spatial Variation Characteristics of Surface Water Quality and Influencing Factors in Baiyangdian Lake. Huanjing Kexue 2025, 46, 1382–1394. [Google Scholar] [CrossRef]
- Zhou, X.; Sun, B.; Chen, G.; Zhang, Y.; Wang, H.; Gao, X.; Han, Z.; Liu, X. Water quality evolution of water-receiving lakes under the impact of multi-source water replenishments. J. Hydrol.-Reg. Stud. 2024, 53, 101832. [Google Scholar] [CrossRef]
- Yu, H.; Shi, X.; Sun, B.; Zhao, S.; Wang, S.; Yang, Z.; Han, Y.; Kang, R.; Chen, L. Effects of water replenishment on lake water quality and trophic status: An 11-year study in cold and arid regions. Ecotoxicol. Environ. Saf. 2024, 281, 116621. [Google Scholar] [CrossRef] [PubMed]
- Liu, B.; Yang, L.; Cui, C.; Wan, W.; Liang, S. Is water replenishment an effective way to improve lake water quality? Case study in Lake Ulansuhai, China. Front. Environ. Sci. 2024, 12, 1392768. [Google Scholar] [CrossRef]
- Shi, X.; Wang, S.; Zhao, S.; Sun, B.; Yu, H.; Zhang, F.; Zhang, Q. Evaluating the effects of ecological water replenishment on lake water exchange in semi-arid regions insights from an 11-year modeling study. J. Environ. Manag. 2025, 391, 126491. [Google Scholar] [CrossRef]
- Sun, B.; Wang, G.; Chen, W.; Li, W.; Kong, F.; Li, N.; Liu, Y.; Gao, X. Integrated modeling framework to evaluate the impacts of multi-source water replenishment on lacustrine phytoplankton communities. J. Hydrol. 2022, 612, 128272. [Google Scholar] [CrossRef]
- Pan, C.; Guo, Z.; Luo, M. A Simulation Experiment on Quality Dynamics of Reclaimed Water under Different Flow Exchanges. Int. J. Environ. Res. Public Health 2022, 19, 13091. [Google Scholar] [CrossRef] [PubMed]
- Sun, B.; Li, N.; Wang, G.; Gao, X.; Zhou, X.; Kong, F. Contribution for lake phytoplankton community succession under multi-source artificial hydrological regulation. J. Environ. Manag. 2024, 372, 123351. [Google Scholar] [CrossRef]
- Tang, C.; He, C.; Li, Y.; Acharya, K. Diverse responses of hydrodynamics, nutrients and algal biomass to water diversion in a eutrophic shallow lake. J. Hydrol. 2021, 593, 125933. [Google Scholar] [CrossRef]
- Zhou, H.; Chen, Y.; Ye, Z.; Li, Y.; Zhu, C. River-Lake System Connectivity Effectively Reduced the Salinity of Lake Water in Bosten Lake, Northwest China. Water 2022, 14, 4002. [Google Scholar] [CrossRef]
- Zhang, Y.; Zhu, J.; Hu, W.; Chen, Q.; Peng, Z.; Qin, H.; Luo, J. Hydrodynamic effects and water environment improvement of topographic reconstruction in shallow lakes. J. Hydrol. 2024, 634, 131125. [Google Scholar] [CrossRef]
- Xu, J.; Luo, M.; Ba, D.; Wu, G.; Xu, L.; Jeong, T. Numerical Simulation Study on the Layered Phenomenon of Lakes and Reservoirs Destroyed by a Forced Circulation Device. J. Mar. Sci. Eng. 2022, 10, 665. [Google Scholar] [CrossRef]
- You, A.; Wu, Z.; Han, Z.; Yang, J.; Hua, L. Spatial and temporal distributions and variations of nutrients in the West Lake, Hangzhou, after the implementation of integrated water management program (1985–2013). Hupo Kexue 2015, 27, 371–377. [Google Scholar] [CrossRef]
- Zhou, Q.; Chen, H.; Cheng, B.; Cheng, Y.; Guo, B. A Study of the Effect of Lake Shape on Hydrodynamics and Eutrophication. Sustainability 2025, 17, 1720. [Google Scholar] [CrossRef]
- Zhang, H.; Qi, P. Numerical optimization study of the nanfei river ecological water replenishment plan. Environ. Eng. Manag. J. 2024, 23, 1259–1269. [Google Scholar] [CrossRef]
- Ao, D.; Wei, L.; Pei, L.; Liu, C.; Wang, L. Simulation Study on the Optimisation of Replenishment of Landscape Water with Reclaimed Water Based on Transparency. Int. J. Environ. Res. Public Health 2023, 20, 4141. [Google Scholar] [CrossRef]
- Kroes, D.E.; Day, R.H.; Kaller, M.D.; Demas, C.R.; Kelso, W.E.; Pasco, T.; Harlan, R.; Roberts, S. Hydrologic Connectivity and Residence Time Affect the Sediment Trapping Efficiency and Dissolved Oxygen Concentrations of the Atchafalaya River Basin. Water Resour. Res. 2022, 58, e2021WR030731. [Google Scholar] [CrossRef]
- Zhang, X.; Duan, B.; He, S.; Lu, Y. Simulation study on the impact of ecological water replenishment on reservoir water environment based on Mike21—Taking Baiguishan reservoir as an example. Ecol. Indic. 2022, 138, 108802. [Google Scholar] [CrossRef]
- Zhou, Y.; Lv, Y.; Dong, J.; Yuan, J.; Hui, X. Factors Influencing Transparency in Urban Landscape Water Bodies in Taiyuan City Based on Machine Learning Approaches. Sustainability 2025, 17, 3126. [Google Scholar] [CrossRef]
- Zhou, Y.; Lv, Y.; Dong, J.; Yuan, J.; Hui, X. Sensitivity Analysis of Urban Landscape Lake Transparency Based on Machine Learning in Taiyuan City. Sustainability 2024, 16, 7026. [Google Scholar] [CrossRef]
- Liao, Y.; Li, Y.; Shu, J.; Wan, Z.; Jia, B.; Fan, Z. Water Transparency Prediction of Plain Urban River Network: A Case Study of Yangtze River Delta in China. Sustainability 2021, 13, 7372. [Google Scholar] [CrossRef]
- You, A.; Hua, L.; Han, Z.; Zhang, J. Field observation and simulation study of three-dimensional flows in West Lake, Hangzhou. J. Hydroelectr. Eng. 2017, 36, 111–120. [Google Scholar]
- Huang, M.; Ma, F.; Kuang, W.; Sun, Y. Study on the effect of ecological water replenishment on the spatial and temporal distribution of water quality in Chaohu Lake based on MIKE21. Environ. Pollut. Control 2024, 46, 463–470,477. [Google Scholar]
- Kwak, D.H.; Kim, K.M.; Choi, Y.H.; Nguyen, H.H.T.; Jeong, Y.H. Evaluating vulnerable zones and spatiotemporal dynamics in Saemangeum lake under sluice gate operation. Reg. Stud. Mar. Sci. 2025, 90, 104442. [Google Scholar] [CrossRef]
- Zheng, X.N.; Wu, D.X.; Huang, C.Q.; Wu, Q.Y.; Guan, Y.T. Impacts of hydraulic retention time and inflow water quality on algal growth in a shallow lake supplied with reclaimed water. Water Cycle 2022, 3, 71–78. [Google Scholar] [CrossRef]
- Kim, S. Sluice Gate Operation and Managed Water Levels Improve Predicted Estuarine Lake Water Quality. Civ. Eng. J.-Tehran 2025, 11, 244–278. [Google Scholar] [CrossRef]
- Liu, J.W.; Zhang, Q.; Wang, Z.P.; Yang, B.; Li, Y. Study of artificial water replenishment for wetland restoration. Water Environ. J. 2022, 36, 105–114. [Google Scholar] [CrossRef]
- Zhang, L.; Hipsey, M.R.; Zhang, G.X.; Busch, B.; Li, H.Y. Simulation of multiple water source ecological replenishment for Chagan Lake based on coupled hydrodynamic and water quality models. Water Sci. Technol.-Water Supply 2017, 17, 1774–1784. [Google Scholar] [CrossRef]
- Wu, M.; Xu, G.; Zhang, Y.; Lin, L.; Sun, Q. Tracer movement and residence time distribution simulation: An initiative to improve the wetland water environment in the Helan Mountain impact plain. Ecol. Inform. 2024, 82, 102682. [Google Scholar] [CrossRef]
- Liu, Y.; Zhong, R.; Bao, A.; Liu, T. Diagnostic Simulation of Water Age in Small Lake of Bosten Lake. Water 2021, 13, 1996. [Google Scholar] [CrossRef]
- Peng, F.; Li, K.; Liang, R.; Li, X.; Zhang, P.; Yuan, Q.; Ji, Q.; Zhu, Z.; Wang, Y. Shallow lake water exchange process before and after water diversion projects as affected by wind field. J. Hydrol. 2021, 592, 125785. [Google Scholar] [CrossRef]
- Huang, A.; Liu, X.; Dong, F.; Peng, W.; Ma, B.; Han, Z.; Yang, X. Long-term variations in hydraulic residence time of floodplain lakes and their response to water conservancy projects. Ecol. Indic. 2024, 169, 112778. [Google Scholar] [CrossRef]
- Jiang, M. Modeling Water Residence Time and Connectivity in the Northern Indian River Lagoon. Estuaries Coasts 2023, 46, 1170–1189. [Google Scholar] [CrossRef]
- Wu, M.; Xu, G.; Niu, X.; Fu, Z.; Liao, X. Study on Water Replacement Characteristics of Xinghai Lake Wetland Based on Landscape Water Quality Objectives. Water 2023, 15, 1374. [Google Scholar] [CrossRef]
- Dawidek, J.; Ferencz, B. Water Renewal Time in Lakes with Transformed Water Distribution in the Catchment Areas. Water 2024, 16, 384. [Google Scholar] [CrossRef]
- Lin, F.; Ye, X.; Jiao, L.; Wu, Z.; Yang, J.; Xu, J. Effects of comprehensive protection project to the ecological environment of West Lake in Hangzhou. J. Water Resour. Water Eng. 2007, 18, 52–55. [Google Scholar] [CrossRef]
- Deng, K.; Wu, Z.; Zhang, G.; Xu, J.; Yang, J.; Mao, Y.; Jiang, H. Benifits of the restoration projects on West Lake: Evidence of chlorophyll-a change (1998–2007). Hupo Kexue 2009, 21, 518–522. [Google Scholar] [CrossRef]
- Zheng, X.; Luo, N.; Pei, H. Assessment of Spatio-Temporal Changes of Water Quality in West Lake, Hangzhou Using SOFM Neural Network. J. Biomath. 2007, 22, 317–322. [Google Scholar]
- He, W.; Jin, J.; Shao, D.; Shao, Y. Application of Mathematical Modeling Method in Test Area of Hangzhou. China Water Wastewater 2013, 29, 148–150. [Google Scholar]
- Yang, F.; Jiang, Y.-f.; Wang, C.-c.; Huang, X.-n.; Wu, Z.-y.; Chen, L. Characteristics of Nitrogen and Phosphorus Losses in Longhong Ravine Basin of Westlake in Rainstorm Runoff. Huanjing Kexue 2016, 37, 141–147. [Google Scholar] [CrossRef] [PubMed]
- Xu, P.; Zhang, L.; Zhang, X.; Mao, Z.; Rao, L.; Yang, J.; Zhou, Y. Simulation of Water Renewal Time in West Lake Based on Delft3D and Its Environmental Impact Analysis. Water 2025, 17, 2847. [Google Scholar] [CrossRef]
- Chang, N.; Zhang, Q.; Wang, Q.; Luo, L.; Wang, X.C.; Xiong, J.; Han, J. Current status and characteristics of urban landscape lakes in China. Sci. Total Environ. 2020, 712, 135669. [Google Scholar] [CrossRef]
- Chang, N.; Luo, L.; Wang, X.C.; Song, J.; Han, J.; Ao, D. A novel index for assessing the water quality of urban landscape lakes based on water transparency. Sci. Total Environ. 2020, 735, 139351. [Google Scholar] [CrossRef]
- Hu, R.; Xu, W.; Yan, W.; Wu, T.; He, X.; Cheng, N. Comparison between Machine-Learning-Based Turbidity Models Developed for Different Lake Zones in a Large Shallow Lake. Water 2023, 15, 387. [Google Scholar] [CrossRef]
- Xu, J.J.; Pan, J.Y.; Devlin, A.T. Variations in chlorophyll-a concentration in response to hydrodynamics in a flow-through lake: Remote sensing and modeling studies. Ecol. Indic. 2023, 148, 110128. [Google Scholar] [CrossRef]
- Xia, X.; Cao, F.; Lou, Z. A Study on the Numerical Simulation of Flow Field in West Lake in Response to Diversion Works. Shanghai Environ. Sci. 2008, 27, 99–103,128. [Google Scholar]
- Gilboa, Y.; Friedler, E.; Talhami, F.; Gal, G. A novel approach for accurate quantification of lake residence time—Lake Kinneret as a case study. Water Res. X 2022, 16, 100149. [Google Scholar] [CrossRef]
- Sin, Y.; Lee, H. Changes in hydrology, water quality, and algal blooms in a freshwater system impounded with engineered structures in a temperate monsoon river estuary. J. Hydrol.-Reg. Stud. 2020, 32, 100744. [Google Scholar] [CrossRef]
- Gu, Y.; Zhang, P.; Qin, F.; Cai, Y.; Wang, X. Impact of multi-temporal and spatial landscape patterns on the water quality of the Nanfei River. J. Agro-Environ. Sci. 2024, 43, 1580–1589. [Google Scholar]
- Buta, B.; Wiatkowski, M.; Gruss, L.; Tomczyk, P.; Kasperek, R. Spatio-temporal evolution of eutrophication and water quality in the Turawa dam reservoir, Poland. Sci. Rep. 2023, 13, 9880. [Google Scholar] [CrossRef]
- Shinohara, R.; Matsuzaki, S.I.S.; Watanabe, M.; Nakagawa, M.; Yoshida, H.; Kohzu, A. Heat Waves Can Cause Hypoxia in Shallow Lakes. Geophys. Res. Lett. 2023, 50, e2023GL102967. [Google Scholar] [CrossRef]
- Wu, T.; Su, B.L.; Wu, H.X.; Wang, S.R.; Wang, G.Q.; Ratnaweera, H.; Weerakoon, S.B.; Zhang, Z.B.; Yao, B. Scenario optimization of water supplement and outflow management in the Yilong Lake based on the EFDC model. Hydrol. Res. 2022, 53, 519–531. [Google Scholar] [CrossRef]
- Serra, T.; Font, E.; Soler, M.; Barcelona, A.; Colomer, J. Mean residence time of lagoons in shallow vegetated floodplains. Hydrol. Process. 2021, 35, e14065. [Google Scholar] [CrossRef]
- Zhao, F.; Zhan, X.; Xu, H.; Zhu, G.; Zou, W.; Zhu, M.; Kang, L.; Guo, Y.; Zhao, X.; Wang, Z.; et al. New insights into eutrophication management: Importance of temperature and water residence time. J. Environ. Sci. 2022, 111, 229–239. [Google Scholar] [CrossRef]
- Long, Y.; Cao, J.; Xiong, W.; He, H.; Ren, P. Spatiotemporal pattern of water age in Dongting Lake before and after the operation of the Three Gorges Project. J. Hydrol.-Reg. Stud. 2024, 55, 101902. [Google Scholar] [CrossRef]
- Ding, Y.; Liu, H.F.; Yang, W.; Xing, L.M.; Tu, G.Q.; Ru, Z.M.; Xu, Z.H. The assessment of ecological water replenishment scheme based on the two-dimensional lattice-Boltzmann water age theory. J. Hydro-Environ. Res. 2019, 25, 25–34. [Google Scholar] [CrossRef]
- Le, H.N.; Shintani, T.; Nakayama, K. A Detailed Analysis on Hydrodynamic Response of a Highly Stratified Lake to Spatio-Temporally Varying Wind Field. Water 2023, 15, 565. [Google Scholar] [CrossRef]
- Liu, S.; Ye, Q.H.; Wu, S.Q.; Stive, M.J.F. Wind Effects on the Water Age in a Large Shallow Lake. Water 2020, 12, 1246. [Google Scholar] [CrossRef]
- Lu, H.; Lu, X.; Wang, K.; Liu, W.; Yao, Y.; Chen, L. Temporal variation of hydrological regime and water quality status between 2014–2020 in Gucheng Lake. Hydro-Sci. Eng. 2023, 6, 75–83. [Google Scholar] [CrossRef]
Disclaimer/Publisher’s Note: The statements, opinions and data contained in all publications are solely those of the individual author(s) and contributor(s) and not of MDPI and/or the editor(s). MDPI and/or the editor(s) disclaim responsibility for any injury to people or property resulting from any ideas, methods, instructions or products referred to in the content. |
© 2025 by the authors. Licensee MDPI, Basel, Switzerland. This article is an open access article distributed under the terms and conditions of the Creative Commons Attribution (CC BY) license (https://creativecommons.org/licenses/by/4.0/).