Abstract
To provide a theoretical basis for sound barrier technology for fish, the effects of sound intensity and frequency on negative phonotaxis in adult bighead carp, Hypophthalmichthys nobilis, (weight 1.42–2.20 kg, body length 45.1–54.8 cm) were tested using underwater sound equipment in a pool with sound absorbing material to reduce sound reflection. There were two primary findings: (1) The cumulative times that fish remained in the high, medium and low sound intensity areas were significantly different (p < 0.001). The cumulative time decreased as sound intensity increased, demonstrating negative phonotaxis by the test fish towards high sound intensity. The cumulative time that fish remained in the high sound intensity area was less than in the control area and the difference was highly significant (p < 0.001). This strongly negative phonotaxic response can be exploited in developing sound barriers for guiding fish. Negative phonotaxis could be used to guide fish away from hazards and along migration routes, to help prevent exotic fish invasion, and to improve spawning success by preventing migration into tributaries where habitat has been severely impacted by dams or other human activities. (2) Adult H. nobilis respond differently to different frequencies of single-frequency sound. Higher-frequency sound (300–1000 Hz) produced a stronger negative phonotaxic response than lower-frequency sound (50–200 Hz), and the difference in cumulative times was highly significant (p < 0.001). Thus, high-frequency sound is more effective than low-frequency sound for producing negative phonotaxis. This research demonstrates that negative phonotaxis is affected by sound intensity and frequency. However, for a given application and target species, additional research should be carried out to determine the most effective combination of acoustic parameters.
1. Introduction
Many hydropower projects have been developed around the world, bringing huge economic and social benefits, but negatively impacting fish habitats [1]. In the absence of human intervention, fish will enter the tail water pipeline during maintenance of the tail water pipeline of the generator. The tail water pipeline is drained during maintenance, posing a threat to fish safety, affecting maintenance work, and disturbing the highly coordinated operation of the hydropower project. To guide fish away from dangerous areas, plastic mesh or metal mesh barriers are traditionally used, but these can affect tail water discharge, accumulate debris and act as a substrate for biofouling. In recent years, barriers based on electric current, light and sound have attracted attention [2,3]. However, electric barriers can affect the physiological health of fish [4,5]. This study will investigate the response of fish to sound.
Fish perceive sound mainly by the inner ear, swim-bladder, lateral line and auditory center [6,7]. Cyprinids are ostariophysans, a superorder characterized by the Weberian apparatus connecting the swim-bladder to the inner ear and amplifying sound waves [8]. The movement of fish in response to sound is defined as phonotaxis, which can be positive (fish swim toward the sound) or negative (fish swim away from the sound). Fish barrier technology based on sound is an application of negative phonotaxis.
Sound barrier technology could become important for managing and protecting fishery resources. There are four primary uses for sound barriers: guiding fish away from hazardous areas; guiding fish during migration; preventing exotic fish invasion; and improving spawning success by preventing migration into tributaries where habitat has been severely impacted by dams or other human activities [2,3,9]. There is also potential for developing novel applications for selectively guiding a target fish species using a combination of positive and negative phonotaxis [10,11,12,13].
Sound is created by vibrations that travel as waves of energy and most sounds in nature are a mixture of sound waves. Broadband sound waveforms such as boat motors or pile driving affect fish behavior [11,12,14,15,16], and fish response is known to be particularly strong to sounds associated with predators [13,17]. Neo et al. (2014 and 2015) found that pulsed sound affects fish behavior more strongly than continuous sound. Sound intensity, frequency and particle motion are primary acoustic properties of sound waveform [10,18]. Qin et al. (2020) reported that negative phonotaxis increased with sound intensity in the Tu-fish (Schizopygopsis younghusbandi) [17]. The sensitivity of different fish species to sound frequency varies [9,19]. Although the particle motion/acceleration could be important to negative phonotaxis, it was not included in our study because controlling the shape of a transient acoustic waveform is difficult and the possible shapes are endless.
The bighead carp (Hypophthalmichthys nobilis) is an Asian carp widely distributed in China and the carp has a Weberian apparatus [8]. The species is considered invasive in many countries, particularly the United States and Canada. In China, negative phonotaxis could be used to guide bighead carp to a suitable habitat, and in other countries it could be used to restrict their movement. Researching negative phonotaxis in bighead carp is theoretically and practically significant. Culotta et al. (2024), Kramer et al. (2024) and Frett et al. (2025) evaluated a boat motor sound and dissolved CO2 as a bighead carp deterrent [20,21,22]. Vetter et al. (2017) compared the differences in the effects of single-frequency sound and broadband sound on behavior in bighead carp [15]. Dennis et al. (2019) reported a complex sound coupled with an air curtain efficiently blocked bighead carp passage [23]. To support the development of effective sound barrier technology for bighead carp, the effects of sound intensity and frequency on negative phonotaxis should be studied.
The experimental hypothesis was that sound intensity and frequency affect the phonotaxic response of adult bighead carp. In this study, sounds of different intensity and frequency were generated in the experimental pool, fish negative phonotaxis was observed and recorded and the hypothesis was verified using statistical analysis. Our results will provide basic data to support the development of effective sound barrier technology for bighead carp.
2. Materials and Methods
2.1. Fish
Adult H. nobilis (1.42–2.20 kg, 45.1–54.8 cm) were obtained from an aquaculture operation in Shanghai, China. The fish farming ponds were in rural areas, so the acoustic scene around the fish living environment was natural. Hence, before this study, the tested fish had never encountered the experimental single-frequency sound, which is good for the experimentation. Fish were acclimated to experimental conditions for one week after being transported to the laboratory. Water temperature and dissolved oxygen (DO) were measured with a portable multi-meter (HQ30d, Hach Company, Loveland, CO, USA). In the holding pool, the water temperature ranged from 15.3 °C to 20.8 °C and DO was maintained at >7.0 mg/L using an air pump. Fish size was approximately equal among treatment groups.
2.2. Apparatus
The experimental pool was acoustically modified with sound adsorbing material (similar to porous sponge) to reduce sound reflection, minimizing constructive and destructive interference of sound waves to produce a more uniform sound field in the pool (Figure 1). The underwater sound was produced by generating an electrical signal of the desired frequency (Hz) and intensity (mV) (AFG31000, Tektronix Inc., Beaverton, OR, USA), and then converting the electrical signal to an acoustic signal with an underwater speaker (Sound generator, UW350, Data Physics Corp., San Jose, CA, USA; amplifier, SS1000T, Data Physics Corp., San Jose, CA, USA). The sound intensity (dB) in the pool was measured with a digital hydrophone (icListen HF SC2-ETH, Ocean Sonics Ltd., Truro Heights, NS, Canada) at 40 locations, as indicated in Figure 2.
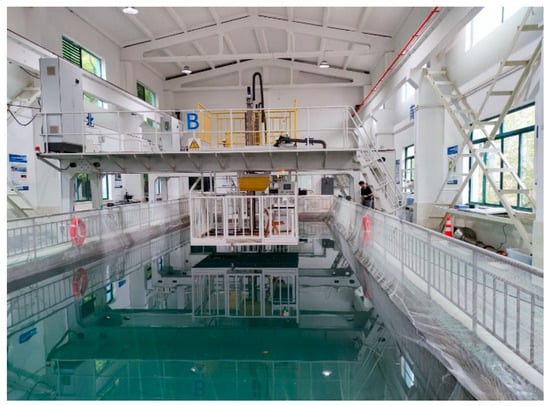
Figure 1.
The experimental pool.
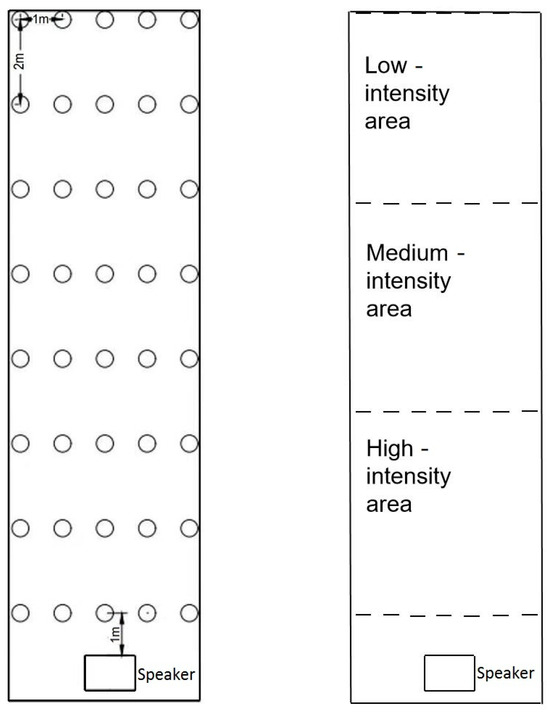
Figure 2.
Positions of speaker and points for measuring sound intensity in the pool (left), and low, medium and high sound intensity areas of the pool (right).
2.3. Experimental Procedure
The water depth in the experimental pool was 2 m. The speaker was placed 1 m below the surface and the sound intensity at 1 m was measured at 40 points. The positions of the speaker and measuring points are shown in Figure 2. The experimental pool was divided into three rectangular areas of the same size, based on the distance from the speaker. Sound intensity decreases as it moves away from the source, so the area closest to the underwater speaker is the high sound intensity area, the area furthest to the energy converter is the low sound intensity area and the area in between is the medium sound intensity area (Figure 2).
H. nobilis was selected for testing, with 20 fish in each treatment group and electrical signal frequency (Hz) and intensity (mV) of the signal generating equipment as the experimental variables. Treatments included eight frequencies (50 Hz, 100 Hz, 200 Hz, 300 Hz, 400 Hz, 500 Hz, 800 Hz, 1000 Hz) and eight intensities (300 mV, 400 mV, 500 mV, 600 mV, 700 mV, 800 mV, 900 mV, 1000 mV), giving a total of 64 treatment groups and 6 control groups (20 fish in each group) with no sound. Each test lasted 20 min and fish movement and position were obtained from video recordings of the tests. The time that fish spent (cumulative retention time) in pool areas of high, medium and low sound intensity during the 20 min test period were determined from the video recordings.
2.4. Data Analysis
The sound intensity throughout the pool was calculated by Kriging interpolation using Golden software Surfer (version 8.0, www.goldensoftware.com) (as described in Section 2.4. and shown in Figure 2). The cumulative times that fish spent in the high, medium and low sound intensity areas were obtained using Tracker software (version 5.1.5, www.physlets.org/tracker, accessed on 8 July 2023). The proportion (%) of cumulative time that each fish spent in each sound intensity area for each treatment and the control were then calculated. The resulting data was analyzed and graphed using OriginLab Origin software (version 90E, www.originlab.com). The data on the proportions of time spent in each sound intensity area deviated significantly from normality, based on the Lilliefors test (p < 0.05). The homogeneity of variance among the proportions was tested using Levene’s test and differences in variance were significant (p < 0.05). Therefore, a non-parametric analysis of variance (Kruskal–Wallis ANOVA and Mann–Whitney) was used in this investigation.
3. Results
Sound intensity in the pool decreases with distance from the source. The sound intensity distributions at three frequencies (100 Hz, 500 Hz and 1000 Hz) at an electric signal intensity of 800 mV are shown in Figure 3. Among the three frequencies, sound intensity decreases the most with a distance of 100 Hz.
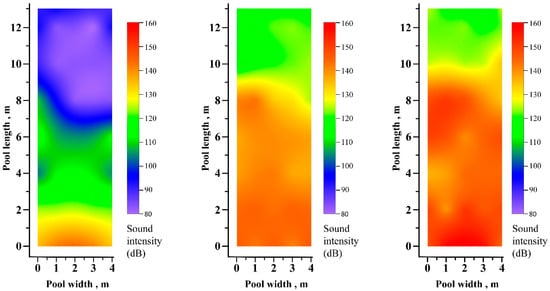
Figure 3.
Left, tested in 100 Hz. Middle, tested in 500 Hz. Right, tested in 1000 Hz. Sound intensity distributions (dB) in the test pool for frequencies of 100 Hz, 500 Hz and 1000 Hz, all originating from an electrical signal intensity of 800 mV.
In 33 of the 64 treatments, deterrence was near complete, with fish spending only 0–2% of their time in the high sound intensity area (Table 1) and most of the highly effective treatments were at frequencies of 300–1000 Hz.

Table 1.
Proportions of cumulative time that fish (20 fish in each group) spent in the low, medium and high sound intensity areas for all treatment groups. In each matrix element, the first percentage listed is for the low sound intensity area, the second is for the medium sound intensity area and the third is for the high sound intensity area.
Based on the 64 treatments, there were significant differences in the proportions of cumulative time that fish spent in the high, medium and low sound intensity areas (p < 0.001). The proportions of cumulative time in the low, medium and high sound intensity areas decreased as sound intensity increased (52.2 ± 28.6%, 43.3 ± 24.8%, 4.6 ± 5.8%, respectively, Figure 4). In the control (repeated six times), the proportions of cumulative time that fish spent in the three areas were 25.2 ± 8.2%, 52.2 ± 9.7%, 22.6 ± 11.5% (Figure 4). There was no significant difference in the cumulative time fish spent in the high and low sound intensity areas (p = 0.689), but the cumulative time fish spent in the medium sound intensity area was significantly higher than in the low or high sound intensity area (p < 0.001) (Figure 4). The cumulative times that fish spent in the low sound intensity area were significantly different between experimental and control tests (p = 0.028), as was the difference between the experimental and control groups in the high sound intensity area (p < 0.01). In the absence of negative phonotaxis, fish tended towards the middle of the pool.
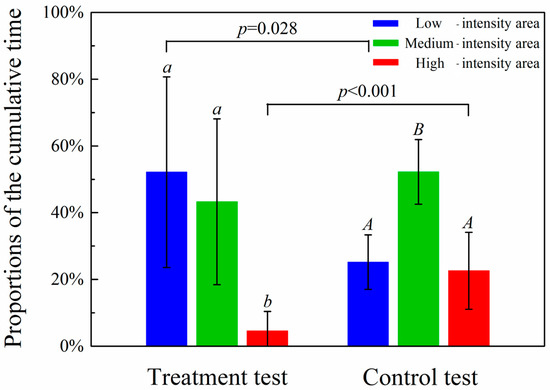
Figure 4.
Proportions (mean ± SD) of the cumulative time fish spent in the low, medium and high sound intensity areas (lower case letters, a and b, indicate significant differences between treatment groups, while upper case letters, A and B, indicate significant differences within the control group. The p-value indicates significant differences between the treatment test and control test).
Figure 5 shows the proportions of the cumulative time that fish spent in the high sound intensity area for each frequency treatment group. The proportions in higher sound frequency conditions (300–1000 Hz) were significantly lower than the proportions in lower sound frequency conditions (50–200 Hz) (p < 0.001).
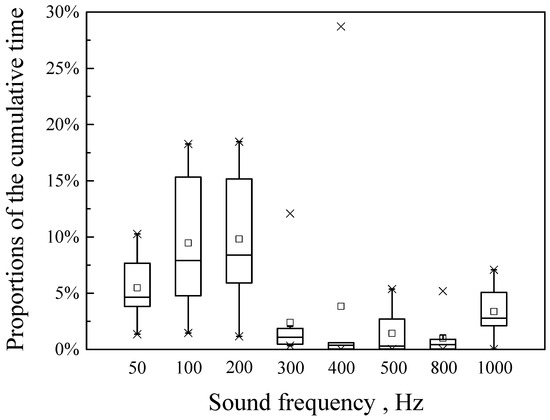
Figure 5.
Box and whisker plots of the cumulative time spent by fish in the high sound intensity area at different frequencies. The box represents the interquartile range (25–75%), the line inside the box represents the median, the symbol □ represents the mean, whiskers extend from the box to SD and the symbol × represents the minimum and maximum values.
4. Discussion
In this study, adult bighead carp displayed a negative phonotaxic response and the response varied with sound intensity and frequency. This negative phonotaxic response can be exploited in developing sound barriers to guide fish away from hazardous areas, to guide fish during migration, to help prevent exotic fish invasion, and to limit fish migration into tributaries where their habitat has been negatively impacted by dams or other human activities [2,3,9]. While sound can be used to guide fish, achieving 90–100% effectiveness is difficult [16,17]. Furthermore, migrating fish may be more highly motivated to move through a sound barrier than fish tested in a pool. However, using sound to guide fish is less harmful than an electric current and installing sound barriers is easier and less expensive than installing and operating electric barriers. While the use of negative phonotaxis in fish resource management shows promise, continued research will be required.
4.1. Effect of Sound Intensity on Fish Behavior
The cumulative time that fish spent in the low, medium and high sound intensity areas decreased with increasing sound intensity (52.2 ± 28.6%, 43.3 ± 24.8%, 4.6 ± 5.8%, respectively, Figure 4). The increase in negative phonotaxic response displayed by H. nobilis with increased sound intensity is consistent with the results obtained for Larimichthys crocea [24]. In the control, with increasing sound intensity, the proportions of the cumulative time fish spent in the three areas were 25.2 ± 8.2%, 52.2 ± 9.7% and 22.6 ± 11.5% (Figure 4). There were no significant differences in the proportions of cumulative time that fish spent in the high and low sound intensity areas (p = 0.689), and the proportion of the cumulative time that fish spent in the medium sound intensity area was significantly higher than either the low or high sound intensity areas (p < 0.001) (Figure 4). This is attributed to the shelter provided by the mobile platform (Figure 1) (fish may have a tendency to rest in sheltered places and this may help them avoid predators) and avoidance of the physical barrier at each end of the pool.
The proportions of the cumulative time fish spent in the high sound intensity areas in the experimental test were significantly less than that in the control test (p < 0.001), which indicated that the test fish showed negative phonotaxis to the generated sound. However, 4.6 ± 5.8% of test fish time was spent in the high sound intensity area, indicating that the effect is not as strong as the drive to escape from natural enemies.
In this study, the sound intensity in the high-intensity area (single-frequency sound) is ~150 dB (Figure 3), and the bighead carp showed negative phonotaxis (Figure 4). Vetter et al. (2017) [15], Dennis et al. (2019) [23] and Frett et al. (2025) [22] also performed experiments with a sound intensity of ~150 dB (complex sound) and obtained similar results. Therefore, ~150 dB is an effective sound intensity for deterring bighead carp and its effectiveness should be further confirmed in field deterrence applications in the future.
4.2. Effect of Sound Frequency on Fish Behavior
This study found that H. nobilis response differed with the frequency of single-frequency sound. The cumulative time spent at higher sound frequencies (300–1000 Hz) was significantly lower than that at lower sound frequencies (50–200 Hz) (p < 0.001) (Figure 5, Table 1). Liu et al. (2019) reported that different frequencies of single-frequency sound (500–3000 Hz) did not have a significant effect on the position of Bilobed-lip schizothoracin (Ptychobarbus kaznakovi) [16]. The difference between the results of Liu et al. (2019) [16] and this study is likely due to the different frequency range of the experimental sound. Zhan et al. (2023) reported that most fish hear in the frequency range of 50–1000 Hz [25]. While the range of 50–1000 Hz was used in this study, Liu et al. (2019) used the range of 500–3000 Hz [16]. The difference in results may also be due to variation in frequency sensitivity among fish species [8]. Vetter et al. (2017) reports that, while broadband sound was better for deterring bighead carp, single-frequency sounds at 500 Hz and 1000 Hz can also deter bighead carp [15]. In this study, 300–1000 Hz were effective sound frequencies for deterring bighead carp (Figure 5), and their effectiveness should be further confirmed in field deterrence applications in the future.
4.3. Suggestions for Future Studies on Fish Negative Phonotaxis and Sound Barrier Technology
Many studies have reported that fish display avoidance behavior to certain sounds [26,27,28], but knowledge of the hearing ability and phonotaxic behavior of different fish species is crucial for developing sound barrier technology [19]. The fish we tested (H. nobilis) displayed a higher negative phonotaxic response to higher sound intensity (Figure 4). Comparing high sound intensity areas of different frequency ranges, the test fish spent significantly less time in an area when the sound frequency was high (300–1000 Hz) than when the frequency was low (50–200 Hz) (p < 0.001) (Figure 5), indicating that high-frequency sound gives a more negative phonotaxic response. It should be noted that excessive sound intensity could damage the inner ear, viscus, metabolism and other aspects of fish health [26,29]. Therefore, we suggest evaluating the effects of high sound intensity on fish health and identifying appropriate acoustic conditions (intensity and frequency) for sound barriers. It should be noted that these results in this study cannot be extrapolated to other species or families, as morphological traits and trophic behaviors may significantly alter the outcomes. In this study, there were ex situ model tests which have certain limitations; therefore, we should further confirm these results with in situ experiments.
This study was conducted with static water. The effect of flowing water on negative phonotaxis needs to be explored. Sound barriers, electric barriers and light barriers are all important technologies for fishery resource management and protection, and the three technologies each have advantages and disadvantages [30,31,32]. Currently, the three barrier technologies are studied separately and independently, but combining the three technologies may be necessary for developing safe and effective barrier technology.
Author Contributions
Methodology, S.Z.; Formal analysis, W.Y. and Z.T.; Investigation, Y.T. and W.H.; Data curation, C.Z. and G.Y.; Writing—original draft, Y.T. and L.C.; Writing—review and editing, L.C. All authors have read and agreed to the published version of the manuscript.
Funding
This work was supported by the National Nature Science Foundation of China (Grant number: U2340218), the National Key Research and Development Program of China (Grant number: 2022YFE0117400) and China Yangtze Power Co., Ltd. Foundation (Grant number: Z152202018).
Institutional Review Board Statement
The care and use of experimental animals in this study complied with institutional guidelines and policies of the Institutional Animal Care and Use Committee in the Institute of Hydroecology, Ministry of Water Resources and Chinese Academy of Sciences (IHE). The Institutional Animal Care and Use Committee of the IHE approved the testing method in this study.
Data Availability Statement
The data supporting the findings of this study are available upon reasonable request. Interested parties can obtain the data by contacting the corresponding author.
Acknowledgments
We gratefully acknowledge the provision of the experimental location by the Fishery Machinery and Instrument Research Institute of the Chinese Academy of Fishery Sciences, David Johnson (Ferrum College, USA) and two anonymous reviewers for their comments and suggestions in this paper.
Conflicts of Interest
Authors Yun Tan, Wanshuang Yi, Zhengyang Tang and Chunhui Zhang were employed by the company China Yangtze Power, involved in this research. The remaining authors declare that the research was conducted in the absence of any commercial or financial relationships that could be construed as a potential conflict of interest. The funders had no role in the design of the study; in the collection, analyses or interpretation of data; in the writing of the manuscript; or in the decision to publish the results.
References
- Zhang, H.; Kang, M.; Shen, L.; Wu, J.; Li, J.; Du, H.; Wang, C.; Yang, H.; Zhou, Q.; Liu, Z.; et al. Rapid change of Yangtze fisheries and its implications for global freshwater ecosystem management. Fish Fish. 2020, 710, 136242. [Google Scholar] [CrossRef]
- Bullen, C.R.; Carlson, T.J. Non-physical fish barrier systems: Their development and potential applications to marine ranching. Rev. Fish Biol. Fish. 2003, 13, 201–212. [Google Scholar] [CrossRef]
- Noatch, M.R.; Suski, C.D. Non-physical barriers to deter fish movements. Environ. Rev. 2012, 20, 71–82. [Google Scholar] [CrossRef]
- Stolbunov, I.; Salienko, S.N.; Barkhalov, R.M.; Rabazanov, N.I. Influence of electric fields of a fish protection device on fish of the Dagestan coast of the Caspian sea. Arid Ecosyst. 2024, 14, 540–546. [Google Scholar] [CrossRef]
- Kim, J.; Mandrak, N.E. Effects of a vertical electric barrier on the behaviour of rainbow trout. Aquat. Ecosyst. Health Manag. 2019, 22, 183–192. [Google Scholar] [CrossRef]
- Rogers, L.; Lozier, N.R.; Sapozhnikova, Y.P.; Diamond, K. Functional plasticity of the swim bladder as an acoustic organ for communication in a vocal fish. R. Soc. Proc. R. Soc. B 2023, 290, 20231839. [Google Scholar] [CrossRef] [PubMed]
- Veith, J.; Chaigne, T.; Svanidze, A.; Dressler, L.E.; Hoffmann, M.; Gerhardt, B.; Judkewitz, B. The mechanism for directional hearing in fish. Nature 2024, 631, 118–124. [Google Scholar] [CrossRef]
- Vetter, B.J.; Brey, M.K.; Mensinger, A.F. Reexamining the frequency range of hearing in silver (Hypophthalmichthys molitrix) and bighead (H. nobilis) carp. PLoS ONE 2018, 13, e0192561. [Google Scholar] [CrossRef]
- Smejkal, M.; Barton, D.; Duras, J.; Horky, P.; Muska, M.; Kubecka, J.; Pfauserova, N.; Tesfaye, M.; Slavik, O. Living on the edge: Reservoirs facilitate enhanced interactions among generalist and rheophilic fish species in tributaries. Front. Environ. Sci. 2023, 11, 1099030. [Google Scholar] [CrossRef]
- Neo, Y.Y.; Seitz, J.; Kastelein, R.A.; Winter, H.V.; TenCate, C.; Slabbekoorn, H. Temporal structure of sound affects behavioural recovery from noise impact in European seabass. Biol. Conserv. 2014, 178, 65–73. [Google Scholar] [CrossRef]
- Murchy, K.A.; Cupp, A.R.; Amberg, J.J.; Vetter, B.J.; Fredricks, K.T.; Gaikowski, M.P.; Mensinger, A.F. Potential implications of acoustic stimuli as a non-physical barrier to silver carp and bighead carp. Fish. Manag. Ecol. 2017, 24, 208–216. [Google Scholar] [CrossRef]
- Nissen, A.C.; Vetter, B.J.; Rogers, L.S.; Mensinger, A.F. Impacts of broadband sound on silver (Hypophthalmichthys molitrix) and bighead (H. nobilis) carp hearing thresholds determined using auditory evoked potential audiometry. Fish Physiol. Biochem. 2019, 45, 1683–1695. [Google Scholar] [CrossRef]
- Jesus, J.; Cortes, R.; Teixeira, A. Acoustic and light selective behavioral guidance systems for freshwater fish. Water 2021, 13, 745. [Google Scholar] [CrossRef]
- Zhang, Q.; Bloecher, N.; Evjemo, L.D.; Fore, M.; Kelasidi, E. Avoidance behaviours of farmed Atlantic salmon (Salmo salar L.) to artificial sound and light: A case study of net-pen mariculture in Norway. Front. Robot. AI 2025, 12, 1657567. [Google Scholar] [CrossRef]
- Vetter, B.J.; Murchy, K.A.; Cupp, A.R.; Amberg, J.J.; Gaikowski, M.P.; Mensinger, A.F. Acoustic deterrence of bighead carp (Hypophthalmichthys nobilis) to a broadband sound stimulus. J. Great Lakes Res. 2017, 43, 163–171. [Google Scholar] [CrossRef]
- Liu, G.; Wu, Y.; Shen, X.; Hu, Y.; Qin, X.; Tian, W.; Liu, L.; Wang, X.; Shi, X. Laboratory experiments demonstrate that the hissing of the Chinese alligator can effectively inhibit movement of flower fish Ptychobarbus kaznakovi. Hydrobiologia 2019, 836, 97–108. [Google Scholar] [CrossRef]
- Qin, X.; Liu, Y.; Shen, X.; Wu, Y.; Tian, W.; Liu, Y.; Wang, X.; Shi, X.; Liu, G. Spatial avoidance of tu-fish Schizopygopsis younghusbandi for different sounds may inform behavioural deterrence strategies. Fish. Manag. Ecol. 2020, 27, 10–19. [Google Scholar] [CrossRef]
- Neo, Y.Y.; Ufkes, E.; Kastelein, R.A.; Winter, H.V.; TenCate, C.; Slabbekoorn, H. Impulsive sounds change European seabass swimming patterns: Influence of pulse repetition interval. Mar. Pollut. Bull. 2015, 97, 111–117. [Google Scholar] [CrossRef]
- Lovell, J.M.; Findlay, M.M.; Nedwell, J.R.; Pegg, M.A. The hearing abilities of the silver carp (Hypopthalmichthys molitrix) and bighead carp (Aristichthys nobilis). Comp. Biochem. Physiol. Part A 2006, 143, 286–291. [Google Scholar] [CrossRef] [PubMed]
- Culotta, J.; Vetter, B.J.; Mensinger, A.F. Acoustic and Carbon Dioxide Deterrents for Invasive Bigheaded Carps (Hypophthalmichthys molitrix and H. nobilis). In The Effects of Noise on Aquatic Life: Principles and Practical Considerations; Popper, A.N., Sisneros, J.A., Hawkins, A.D., Thomsen, F., Eds.; Springer International Publishing: Cham, Switzerland, 2024; pp. 1505–1521. [Google Scholar]
- Kramer, C.A.; Culotta, J.; Ervin, M.L.; Mensinger, A.F.; Vetter, B.J. Effect of broadband boat motor sound on the schooling behavior of invasive bigheaded carp. In The Effects of Noise on Aquatic Life: Principles and Practical Considerations; Popper, A.N., Sisneros, J.A., Hawkins, A.D., Thomsen, F., Eds.; Springer International Publishing: Cham, Switzerland, 2024; pp. 831–839. [Google Scholar]
- Frett, M.W.; Kozarek, J.L.; Berry, A.L.; Mensinger, A.F. Evaluating CO2 and sound as an invasive bigheaded carp deterrent in a model lock and dam. Environ. Pollut. 2025, 372, 126056. [Google Scholar] [CrossRef]
- Dennis, C.E.; Zielinski, D.; Sorensen, P.W. A complex sound coupled with an air curtain blocks invasive carp passage without habituation in a laboratory flume. Biol. Invasions 2019, 21, 2837–2855. [Google Scholar] [CrossRef]
- Lin, T.; Liu, X.; Wang, C.; Zhang, D. Effects of ship noise pressure level on swimming, feeding behaviors and immuno-physiological indicators of Larimichthys crocea juveniles. Mar. Fish. 2020, 42, 61–72. [Google Scholar]
- Zhan, H.; Li, X.; Ni, M.; Zhang, Z.; Da, W.; Wang, Y.; Liu, Z.; Liu, Y.; He, C.; Shi, X.; et al. Research status and prospect of noise effect on fish. J. Hydroecol. 2023, 44, 142–147. [Google Scholar]
- Cox, K.; Brennan, L.P.; Gerwing, T.G.; Dudas, S.E.; Juanes, F. Sound the alarm: A meta-analysis on the effect of aquatic noise on fish behavior and physiology. Glob. Change Biol. 2018, 24, 3105–3116. [Google Scholar] [CrossRef] [PubMed]
- Putland, R.L.; Montgomery, J.C.; Radford, C.A. Ecology of fish hearing. J. Fish Biol. 2019, 95, 39–52. [Google Scholar] [CrossRef]
- Barbeau, J.; Mazzei, R.; Rodriguez, M.A.; Proulx, R. Fish responses to underwater sounds depend on auditory adaptations: An experimental test of the effect of motorboat sounds on the fish community of a large fluvial lake. Ecol. Evol. 2024, 14, e10946. [Google Scholar] [CrossRef] [PubMed]
- Debusschere, E.; Hostens, K.; Adriaens, D.; Ampe, B.; Botteldooren, D.; DeBoeck, G.; DeMuynck, A.; Sinha, A.K.; Vandendriessche, S.; VanHoorebeke, L.; et al. Acoustic stress responses in juvenile sea bass Dicentrarchus labrax induced by offshore pile driving. Environ. Pollut. 2016, 208, 747–757. [Google Scholar] [CrossRef]
- Li, W.; Bai, Y.; Li, Y.; Wu, Y.; Zhang, J.; Huang, X.; Zhang, Z.; Shi, X. Avoidance behavior of juvenile silver carp Hypophthalmichthys molitrix to four different sounds. J. Hydroecol. 2025, 46, 173–181. [Google Scholar]
- Yi, W.; Cai, L.; Tan, Y.; Xu, B.; Li, J.; Liu, L.; Xu, L.; Johnson, D.; Zhu, S.; Yang, G. Pulse frequency and water velocity determine crossing probability in pulsed direct-current fish barriers. Fishes 2025, 10, 510. [Google Scholar] [CrossRef]
- Kowalski, D.A.; Gardunio, E.I.; Garvey, C.A. Evaluating the effects of an electric barrier on fish entrainment in an irrigation canal in Colorado. River Res. Appl. 2022, 38, 539–547. [Google Scholar] [CrossRef]
Disclaimer/Publisher’s Note: The statements, opinions and data contained in all publications are solely those of the individual author(s) and contributor(s) and not of MDPI and/or the editor(s). MDPI and/or the editor(s) disclaim responsibility for any injury to people or property resulting from any ideas, methods, instructions or products referred to in the content. |
© 2025 by the authors. Licensee MDPI, Basel, Switzerland. This article is an open access article distributed under the terms and conditions of the Creative Commons Attribution (CC BY) license (https://creativecommons.org/licenses/by/4.0/).