Abstract
The operation of the Three Gorges Dam (TGD) has profoundly influenced sediment dynamics in the Three Gorges Reservoir (TGR), yet the long-term evolution of runoff–sediment interactions remains insufficiently quantified. Based on long-term hydrological data (1970–2023), this study analyzed the characteristics of runoff and sediment load and evaluated the impacts of the TGD on their relationship within the reservoir area. Results showed that TGD operation significantly altered sediment transport patterns and reshaped the runoff–sediment relationship, although these effects were constrained by temporal variations in upstream water and sediment supply. From 2003 to 2012, sediment transport regulation reached 11.7%, 50.9%, and 80.5% at Qingxichang, Wanxian, and Yichang stations, respectively, while regulation of the runoff–sediment relationship was 20.0% and 50.0% at Qingxichang and Wanxian. During 2013–2023, under the influence of cascade reservoirs in the upper Yangtze River, sediment regulation changed to 8.3%, 60.3%, and 75.2% at the three stations, with runoff–sediment regulation degrees of 21.7% and 54.2% at Qingxichang and Wanxian. The regulation effect displayed a clear spatial gradient, intensifying downstream along the reservoir. These findings demonstrate the dual role of TGD and upstream cascade reservoirs in shaping runoff–sediment dynamics, providing new insights into sediment management and ecological protection in large regulated rivers.
1. Introduction
The interaction between runoff and sediment transport is a key factor in river morphology, water resource management, and watershed ecosystem stability [1,2,3,4,5]. This relationship evolves under the combined influences of natural and human factors [6]. Natural drivers such as precipitation, topography, soil, vegetation, and climate change shape runoff and sediment generation within basins [7,8,9]. Anthropogenic influences, including reservoir regulation, land use change, vegetation restoration, and river engineering, alter hydrological processes and sediment transport pathways [10,11,12]. These dual forces create pronounced spatial and temporal variations in runoff–sediment dynamics [13,14]. Consequently, changes in the runoff–sediment relationship reflect both natural hydrological evolution and human interventions, particularly large-scale hydraulic projects [15,16,17,18].
The Three Gorges Reservoir (TGR), one of the largest hydraulic engineering projects worldwide, has substantially modified runoff and sediment processes in the Yangtze River Basin since its commissioning in 2003 [19,20,21]. Runoff–sediment interactions within the reservoir are regulated by upstream inflow and internal storage operations, leading to increasingly complex spatiotemporal dynamics. Quantitative evaluation of these processes is essential for assessing dam impacts, improving reservoir management strategies, and protecting riverine ecosystems.
In recent years, research on the influence of the TGR on runoff–sediment processes in the Yangtze River Basin has advanced considerably. Numerous studies have demonstrated that dam operation has markedly reduced downstream sediment flux, thereby reshaping erosion–deposition patterns and driving channel evolution in the middle and lower reaches of the Yangtze River [22,23,24,25,26]. In parallel, investigations into runoff and sediment load trends in major tributaries of the upper basin (e.g., the Min, Jialing, and Wu rivers) have provided basin-scale insights, revealing long-term trajectories of upstream hydrological and sediment dynamics [10,27,28,29]. Intra-reservoir morphology—especially the fluctuating backwater zone—has been documented to exhibit distinct deposition/erosion mosaics, but its runoff–sediment relationship is still under-explored [30,31].
Methodologically, long-term trend and change-point tools are widely used, while wavelet and coherence analyses resolve multi-scale periodicity and phase relations among hydro-climatic drivers, discharge and sediment [32,33,34,35,36,37]. Coupling has been examined using cross-wavelet and double-cumulative diagnostics [38,39,40,41], but most applications focus on a single station or the inflow–outflow contrast, offering limited resolution of within-reservoir evolution.
Despite these advances, three knowledge gaps remain. First, most studies adhere to an “inflow–outflow” perspective, with limited attention to the internal evolution of runoff–sediment relationships across multiple control points inside the reservoir. Second, although climate and human impacts have been broadly assessed, the specific role of dam operation has seldom been explicitly isolated from concurrent influences (e.g., tributary inputs, upstream cascade regulation. Third, existing research typically addresses a single dimension—trend, abrupt change, or periodicity—rather than adopting an integrated, multi-metric framework to resolve spatiotemporal heterogeneity. Clarifying these gaps is essential for sediment management, navigation safety, and lake–delta sustainability under continued large-dam regulation.
To address the above, we establish a four-station within-reservoir framework for the TGR—covering the inflow control station (Table 1), two internal stations (Qingxichang and Wanxian), and the outflow station at Yichang—using 1970–2023 runoff and sediment records. We (i) implement an integrated assessment of trend, abrupt change, periodicity, and coupling; (ii) isolate the dam-operation signal by contrasting pre- and post-impoundment periods across internal stations and boundary stations; and (iii) quantify reach-scale heterogeneity of runoff–sediment relations inside the reservoir, beyond the conventional inflow–outflow dichotomy. We apply Sen’s slope, the Mann–Kendall test, mean-difference t-tests, continuous wavelet transform and cross-wavelet coherence, together with double-cumulative diagnostics, to systematically resolve multi-scale evolution and coupling. The results reveal the spatiotemporal heterogeneity of TGR regulation and provide a reproducible template for large-reservoir diagnostics applicable to other mega-dam systems.

Table 1.
Control stations of the TGR in each Operation stage.
2. Materials and Methods
2.1. Study Area and Data
The TGR basin lies within the subtropical monsoon zone, where climate conditions are strongly influenced by the Asian monsoon and display pronounced seasonal variability [42]. The basin features highly complex terrain, including mountains, hills, and the Sichuan Basin, with elevation differences exceeding 2000 m. The TGR, situated in the upper Yangtze River, is the largest reservoir in the basin. It is a channel-type reservoir formed along the natural river course following dam construction [43]. The reservoir covers a catchment area of 68,040 km2, with a water surface exceeding 1000 km2, and extends approximately 660 km in length [44,45].
This study used flow and sediment transport data measured from 1970 to 2023 at major hydrological stations in the TGR region. The data were taken from the Yangtze River Hydrological Yearbook. The stations include Zhutuo, Cuntan, Beibei, Wulong, Qingxichang, Wanxian, and Yichang. Beibei and Wulong represent the hydrological conditions of the Jialing River and the Wujiang River, which are the main tributaries entering the reservoir. Yichang serves as the outflow control station. The inflow control stations (Ruku) varied across different operational stages of the TGD. From January 1970 to May 2003, during the pre-impoundment stage, Qingxichang served as the control station. From June 2003 to August 2006, during the cofferdam impoundment stage, Qingxichang served as the control station. From September 2006 to September 2008, during the initial impoundment stage, Cuntan and Wulong were again the control stations. From October 2008 to October 2020, during the 175 m experimental impoundment stage, Zhutuo, Beibei, and Wulong served as the control stations. After October 2020, during the normal operation stage, Zhutuo, Beibei, and Wulong have remained as the control stations. The spatial distribution of the stations is shown in Figure 1.
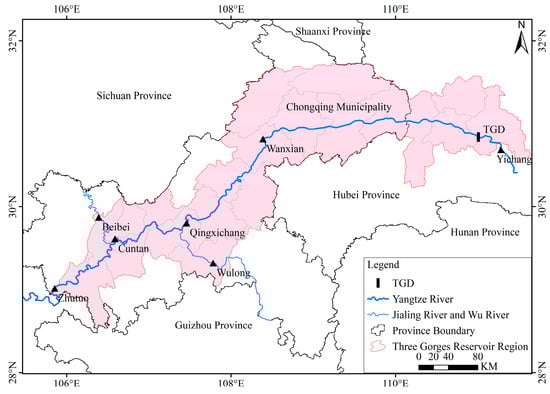
Figure 1.
Distribution of key hydrological control stations in the TGR.
The long-term time-series data for runoff and sediment load are complete, with no missing years. Quality control was performed, and no outliers or inconsistencies were detected, and no imputations or corrections were required. Homogeneity tests were conducted on runoff and sediment load, revealing that station changes do not compromise series continuity for runoff and sediment load.
2.2. Methods
2.2.1. Trend Analysis and Abrupt Detection
In this study, the Sen’s Slope estimator [46] and Mann–Kendall (M-K) trend test [47,48] were used to analyze temporal trends in hydrological data, such as river discharge and sediment transport. Both non-parametric methods are robust to outliers, missing values, and non-normal distributions. The Sen’s Slope quantifies the trend’s rate of change, while the M-K test assesses its statistical significance. Together, these methods offer a comprehensive approach for identifying long-term trends in hydrological data. Sen’s slope estimator is calculated as follows:
where and represent sequential values at times and , respectively. An upward trend is denoted by a positive slope (>0), whereas a downward trend is signified by a negative slope (<0).
In the M–K test, the null hypothesis assumes that the time series () consists of independent and identically distributed random variables, that is, there is no monotonic trend. The alternative hypothesis is two-sided and states that a monotonic trend (either increasing or decreasing) exists in the series. The test statistic is defined as:
where is the normal distribution, and its mean value is 0, and its variance is 1. The formula of the M-K statistic is greater than, equal to and less than zero, respectively:
In the bilateral test, for a given confidence level , the original hypothesis is rejected if . Exceeding this critical value means that the time series exhibits a statistically significant monotonic trend at the chosen significance level . A positive value indicates an upward (increasing) trend, whereas a negative value indicates a downward (decreasing) trend. For a two-sided test under the standard normal approximation, values of approximately 1.65, 1.96, and 2.58 are commonly used as critical thresholds for significance at the 90%, 95%, and 99% confidence levels, respectively.
When applying the M-K test to detect changes in a sequence, the ordered sequence is constructed as follows:
where and denote the mean and variance of , respectively. Under the null hypothesis, the standardized statistic approximately follows a standard normal distribution. For a given significance level , a significant trend is identified when . To obtain the backward series, the original time series xxx is reordered in reverse (from the last observation to the first), and the same calculations are carried out to compute the corresponding statistics.
By analyzing and , the changes in the sequence can be further examined to identify the exact point of mutation. If is greater than 0, the sequence exhibits an upward trend; if less than 0, the sequence shows a downward trend. When and exceed the critical threshold, the upward or downward trend is considered significant. If the curves of and intersect and the intersection point lies between the critical lines, the corresponding moment of the intersection point indicates the beginning of the sudden change.
We standardized runoff and sediment time series using z-score transformation, applied separately to each variable: , where and are the series mean and population standard deviation computed over 1970–2023. The standardized values are unitless (mean = 0, SD = 1) and were used only for visualization.
2.2.2. Mean Difference t-Test
When multiple intersection points are detected in a time series using the M-K test, further verification is needed to determine if these points represent statistically significant abrupt changes. The mean difference t-test method is commonly employed for this purpose. In this method, the time series is divided into two segments: before and after the intersection point. If the mean difference between these two periods exceeds the critical threshold at a specified significance level, the intersection point is considered a statistically significant change point [14]. The statistic T was defined as:
where and are the sample lengths of the two sequences before and after the mutation year, and are the means, and are the standard deviations, is the joint sample variance. When a certain significant level α is given, if , there is a significant difference between the means on both sides of the mutation point at the significant level of , i.e., there is an abrupt change at that point.
2.2.3. Wavelet Analysis Methods
Wavelet analysis is widely employed to examine the periodicity and correlations within climatic and hydrological time series data [17,49]. In order to comprehend the correlation of time series data, the continuous wavelet transform (CWT) was originally introduced for the purpose of identifying spatiotemporal variations in oscillation periodicity, runoff and sediment time series. The continuous wavelet function is expressed as follows:
where is the wavelet transform coefficient; is the known signal; is the complex Morlet mother wavelet function; is the scale factor, indicating the periodic length; and is the translation parameter, representing the time shift.
2.2.4. Cross-Wavelet Transform
Cross-coherence analysis, incorporating both the cross wavelet transform (XWT) and the wavelet transform coherence (WTC) methodologies, was utilised to examine the coherence and phase relationship between river discharge and sediment load time series. The XWT is a particularly useful tool for revealing potential causal relationships by identifying time-frequency regions with shared high power and analysing the relative phase angles between the two variables. The WTC has the capacity to ascertain the scales and situations in which two-time series exhibit comparable cyclic patterns. Furthermore, it is able to determine the phase difference between the two time-frequency series [17,50,51]. The definition of WTC between the and time series is as follows:
where represents the cross-wavelet spectrum and reveals the cross-covariance of two series and . denotes the wavelet transform of the time series of at frequency scales, represents the complex conjugate of the wavelet transform for the time series of head , and is a smoothing operator. is a scale or frequency parameter, is the time or shift parameter, and is used to convert energy density.
2.2.5. Double Accumulation Curve
The double mass curve method [52] is widely used to test consistency and detect changes in the relationship between two variables. It plots the cumulative value of one variable against that of another over the same period in a Cartesian coordinate system. The slope of the curve represents the sediment transport rate, i.e., the ratio of sediment load to discharge. An increasing slope indicates increased sediment transport for a given discharge, while a decreasing slope indicates reduced sediment transport capacity [53,54,55].
The slope of the cumulative curve represents the amount of sediment carried per unit of water and thus reflects the strength of the water–sediment relationship. A significant change in slope indicates a change in sediment-transport capacity—i.e., an adjustment of the water–sediment relationship—typically driven jointly by climate change and human activities. Accordingly, the rate of change in cumulative-curve slope can quantitatively evaluate the TGD impact on the reservoir’s water–sediment relationship. Slope changes at the inflow station are mainly attributed to climate variability and human activities in the upper Yangtze, meaning upstream alterations are expressed at inflow. By contrast, slope changes within the reservoir are influenced not only by upstream factors but also by local climate variability and human activities. In the contribution-analysis model, the study period is divided into a “natural-river period” and a “TGD-disturbance period.” During the natural-river period, the slope difference between the inflow station and the other stations reflects the intensity of reservoir-area climate and human-activity effects prior to TGD construction. Therefore, assuming these reservoir-area effects remain relatively constant, we use the inflow station’s slope change as a reference and attribute the difference between the theoretical and observed slopes at the other stations to the construction and operation of the TGD, thereby enabling a quantitative assessment of the TGD’s impact on the reservoir’s water–sediment relationship. The contribution-rate calculation formula is as follows:
where is the contribution rate of the Three Gorges Project (TGP) to the reservoir’s water–sediment relationship; and are the slopes of the cumulative curves at the inflow and reservoir stations during the natural-river period; and are the corresponding slopes during the calculation period.
3. Results
3.1. Runoff and Sediment Time-Varying Characteristics
The Sen’s slope estimator was applied to analyze runoff and sediment load trends in the TGR. Their significance was tested with the M-K test, where p < 0.05 indicated statistical significance. Overall, the TGR showed non-significant changes in runoff but significant reductions in sediment load, with variations among stations (Figure 2).
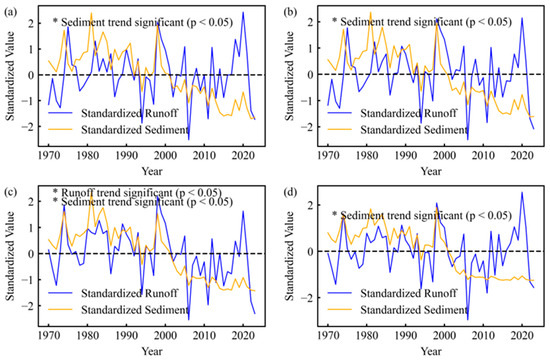
Figure 2.
Annual Trend of Runoff and Sediment load (Standardized). (a) Ruku; (b) Qingxichang; (c) Wanxian; (d) Yichang. * Pass the significance test.
At Ruku and Qingxichang, runoff displayed slight increasing trends, averaging 110.17 million m3/a (p = 0.85) and 26.24 million m3/a (p = 0.92), respectively. These increases were not significant. In contrast, sediment loads decreased markedly, by 9.01 million t/a and 9.52 million t/a (both p < 0.01). Wanxian Station showed stronger changes: both runoff and sediment load declined significantly, at 939.37 million m3/a (p = 0.02) and 11.24 million t/a (p < 0.01), indicating a synchronous downward trend. At Yichang, runoff declined slightly but not significantly, at 102.93 million m3/a (p = 0.76), while sediment load decreased significantly by 12.22 million t/a (p < 0.01). Together, these results show an asynchronous pattern across the TGR, with relatively stable runoff but substantial sediment reduction.
From a multi-year perspective (1970–2023), average annual runoff at Ruku, Qingxichang, Wanxian, and Yichang stations was 372.32, 383.54, 396.65, and 424.03 billion m3, respectively. Runoff increased steadily downstream, reflecting tributary contributions to the main stream (Figure 3). This produced an overall inflow–outflow increase of about 13.9%. Sediment, however, showed signs of retention within the reservoir. Mean annual sediment loads were 309.76, 303.87, 304.26, and 296.48 million t at the four stations, respectively.
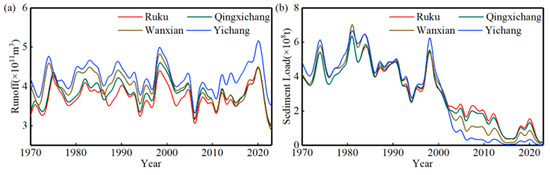
Figure 3.
Annual Time Series of Runoff and Sediment load during 1970–2023. (a) Runoff; (b) Sediment load.
3.2. Runoff and Sediment Situation Variation Identification
The M-K test (Figure 4) shows significant temporal variations in runoff and sediment load within the TGR. For runoff, most long-term statistics at the stations remain within the critical limits (±1.96), indicating that overall upward or downward trends are not significant. However, stage-specific fluctuations are evident. At Ruku (Figure 4a), runoff showed a non-significant increase from 1970 to 2010, a non-significant decrease from 2011 to 2017, and then a non-significant increase from 2017 to 2023. The UF and UB curves intersected around 2006 and 2012, suggesting possible fluctuations or mutation points. At Qingxichang (Figure 4c), runoff remained stable overall. Although it increased slightly, the trend was not significant, and no mutation points were detected. In contrast, Wanxian (Figure 4e) displayed a clear decline in runoff between 2016 and 2023. The UF and UB curves intersected in 2005 and 2019, highlighting potential abrupt changes. At Yichang (Figure 4g), runoff declined after 2007, though not significantly. Intersection points appeared in 2001 and 2017, indicating some degree of abrupt change.
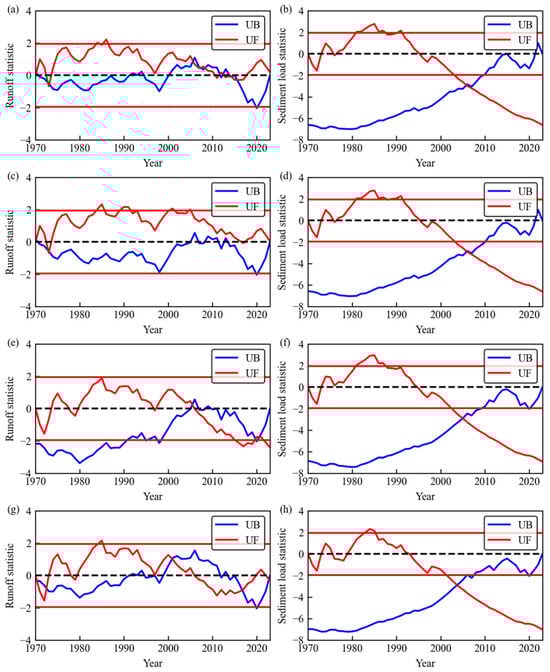
Figure 4.
Mann–Kendall statistics of Runoff and Sediment load. (a) Ruku Runoff; (b) Ruku Sediment load; (c) Qingxichang Runoff; (d) Qingxichang Sediment load; (e) Wanxian Runoff; (f) Wanxian Sediment load; (g) Yichang Runoff; (h) Yichang Sediment load.
In contrast to runoff, sediment load displayed more concentrated and significant changes. Since 2003 (2001 at Yichang), all stations recorded a significant downward trend. Sediment load variations at the Ruku (Figure 4b) and Qingxichang (Figure 4d) stations were highly consistent. From 1970 to 1972, a slight, non-significant decrease occurred, followed by a slight increase from 1973 to 1980. Between 1981 and 1991, sediment load rose significantly. From 1992 to 2002, the trend shifted to a non-significant decrease, and from 2003 to 2023, it declined significantly. Intersection points were concentrated around 2006. At Wanxian (Figure 4f), sediment load decreased significantly after 2003, with a turning point in 2005. At Yichang (Figure 4h), a sustained and significant decline began in 2001, with an intersection point in 2003—slightly earlier than at the other stations.
To verify the reliability of the M-K test, a mean difference t-test was applied. The significance level was set at 0.01, with a critical t-value of 2.704. This test improved the accuracy of mutation detection. Results showed no significant runoff mutations at any station except Wanxian. At Ruku, although the M-K test suggested possible mutation points, all t-test values were below 2.704, confirming no significant mutations. Runoff at Qingxichang also showed no significant changes. Wanxian, however, exhibited strong mutation features. Test statistics were 3.686 in 2005 and 2.545 in 2019. Only the 2005 value exceeded the threshold, indicating a significant mutation that year. At Yichang, statistics were 1.249 in 2001 and −0.962 in 2017, both below the threshold, confirming no significant runoff changes.
Compared with runoff, sediment transport showed stronger and more consistent mutation signals across stations. t-test values were high at all locations and far above the significance threshold, indicating robust mutation. The mutation intensity also increased gradually from upstream to downstream. At the Inlet, the t-value was 8.043 in 2006; at Qingxichang, 8.162 in the same year; at Wanxian, 10.430 in 2005; and at Yichang, 13.206 in 2003. All values exceeded 2.704 by a wide margin, confirming significant sediment load changes across the TGR.
3.3. Periodic Fluctuations in Runoff and Sediment
As shown in Figure 5, both runoff and sediment load exhibit significant periodic variations across multiple time scales, forming multi-scale periodic structures that reflect typical patterns of temporal evolution. In the figure, red areas indicate wet periods and blue areas indicate dry periods. The wavelet variance diagram obtained from wavelet transform analysis (see Figure A1) further reveals the amplitude characteristics of internal periodic oscillations. Larger oscillation amplitudes indicate stronger periodicity and aid in identifying the dominant periods.
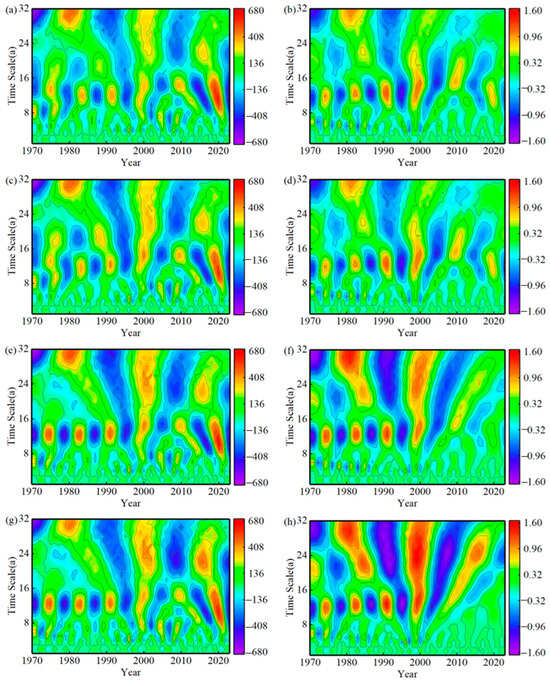
Figure 5.
Wavelet analysis diagram of Runoff and Sediment load. (a) Ruku Runoff; (b) Ruku Sediment load; (c) Qingxichang Runoff; (d) Qingxichang Sediment load; (e) Wanxian Runoff; (f) Wanxian Sediment load; (g) Yichang Runoff; (h) Yichang Sediment load.
In terms of runoff, the Ruku runoff displayed cycles longer than 30 years between 1970 and 2023, with three “abundant–dry” cycles gradually evolving into a 20–23a cycle. Despite these changes, the overall cycle structure remained relatively stable. On medium scales, three periods (7–10a, 12–14a, and 17–20a) were observed from 1970 to 1977. After 1978, the structure reorganized into two periods (12–14a and 17–20a), and after 1994, only the 12–15a period persisted. On shorter scales, a 3–5a cycle was evident, with signal strength increasing markedly between 1995 and 2010. The wavelet variance confirmed 3–5a, 12–14a, and 20–23a as key periods of runoff variability, with 12–14a identified as dominant.
Similar periodic features were observed at Qingxichang, Wanxian, and Yichang, with comparable dominant periods and evolutionary trends. However, only a 22–24a period was detected at Wanxian and Yichang on the medium scale. Comparison across stations revealed that periodic signal strength generally increased downstream.
In terms of sediment load, the patterns at Ruku and Qingxichang between 1970 and 2023 were broadly consistent, with similar distributions of signal strength. On large scales, both stations showed cycles longer than 30 years. On medium scales, two main periods (12–13a and 19–21a) were evident from 1970 to 2000, evolving into a single 15–17a period after 2000. On short scales, a 4–6a cycle occurred between 1970 and 2000. The wavelet variance confirmed that 4–6a, 12–13a, and 19–21a were important components of sediment variability, with 12–13a dominant.
At Wanxian and Yichang, sediment load evolution followed a similar trajectory but with stronger reorganization of periodic structures. Between 1970 and 1980, four cycles were detected (4–6a, 12–13a, 22–24a, and 30–32a), with 12–13a dominant. From 1980 to 2000, the 22–24a and 30–32a cycles merged. After 2000, the 4–6a cycle disappeared, while the 12–13a cycle persisted and gradually merged with a newly formed longer cycle.
3.4. Synergistic Evolution of Runoff and Sediment
As can be shown in Figure 6a, which illustrates the cross-wavelet power spectrum, the Ruku, runoff and sediment transport exhibited two resonance periods of 0–3a and 8a during the period from 1990 to 1995. Of these, the 8a period exhibited significantly higher resonance energy than the 0–3a period. During the 0–3a period, the phase relationship evolved from initial synchrony to a pattern in which runoff ahead sediment load by 1/8 of a cycle. During the 8a period, runoff consistently preceded sediment load by 1/8 of a cycle. Additionally, a 0–2a resonance period emerged between 2005 and 2010, during which the runoff and sediment load remained in phase.
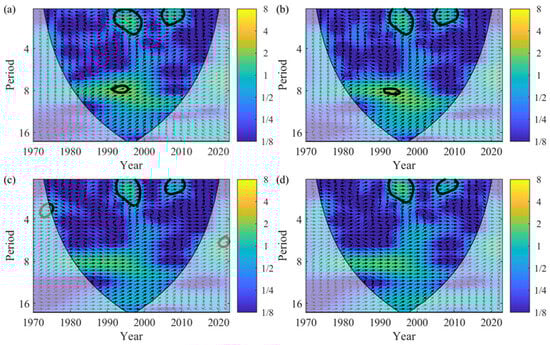
Figure 6.
Cross-wavelet power spectrum of runoff and sediment load. (a) Ruk; (b) Qingxichang; (c) Wanxian; (d) Yichang.
The resonance characteristics at the Qingxichang station were highly consistent with those at the Ruku station. The same resonance periods were observed: 0–3a and 8a between 1990 and 1995, and 0–2a between 2005 and 2010. Similar phase relationships were evident throughout these periods. At the Wanxian station, the relationship between runoff and sediment load exhibited a simpler periodic structure, with a resonance period of 0–3a occurring during both the 1990–1995 and 2005–2010 periods. During the earlier period, the relationship transitioned from synchrony to a phase in which the runoff ahead the sediment load by 1/8 of a cycle. In contrast, during the latter period, the runoff consistently ahead the sediment load by the same phase difference. The resonance periods at the Yichang station were similar to those at Wanxian, being concentrated within the 0–3a range during the periods 1990–1995 and 2005–2010, and exhibiting closely aligned phase relationships. However, notably, the resonance energy at Wanxian and Yichang during 2005–2010 was lower than at the Ruku and Qingxichang stations. This suggests a degree of decoupling between runoff and sediment load, as well as reduced coherence in their interaction.
Cross-wavelet coherence analysis reveals that the relationship between runoff and sediment load in the TGR area has undergone significant change over the past 50 years, demonstrating a clear scale effect. Strong coherence was observed during the 0–3a and 6–12a periods, and the phase relationship exhibited clear temporal evolution. In the early years, runoff generally preceded sediment load, whereas in recent years they tended to move in sync.
In detail, the coherence spectrum of the runoff–sediment relationship at the Ruku (Figure 7a) reveals substantial coherence (R2 > 0.8) over the 0–3a period from 1992 to 2010. From 1992 to 2002, sediment load lagged behind runoff by 1/8 of a cycle, corresponding to a lag of approximately four months. From 2003 to 2010, the relationship shifted towards phase synchrony. In addition, significant coherence (R2 > 0.8) was observed during the 1985–2010 period at the 6–12a phase. The phase relationship shows that, from 1985 to 2005, runoff led sediment load by 1/8 of the cycle, corresponding to a lag of approximately one year. From 2006 to 2010, however, the two variables shifted to synchronous changes. At Qingxichang (Figure 7b), the coherence spectrum indicates a high level of consistency between the runoff–sediment relationship at the 0–3a period during 1992–2010 and that at the Ruku station, with strong coherence (R2 > 0.8). However, during the 7–12a period from 1985 to 2010, runoff consistently led sediment load by 1/8 of the cycle, corresponding to a lag of approximately one year. No clear synchronous phase was observed.
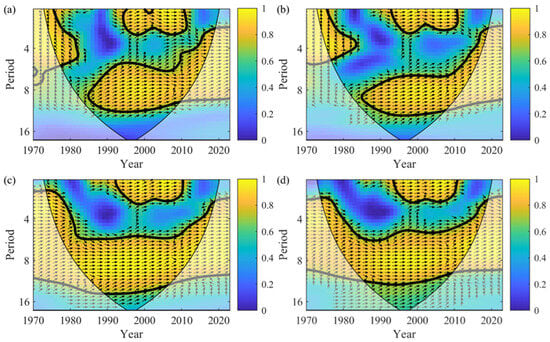
Figure 7.
Cross-wavelet coherence spectrum of runoff and sediment load. (a) Ruk; (b) Qingxichang; (c) Wanxian; (d) Yichang.
The coherence spectra at the Wanxian and Yichang stations exhibit similar characteristics. Both stations exhibit significant coherence and comparable phase evolution patterns at the 0–3a and 6–12a periods. Specifically, significant coherence (R2 > 0.8) was observed at Wanxian Station (Figure 7c) during the 0–3a period from 1992 to 2010. From 1992 to 1996, runoff and sediment load changed synchronously. From 1997 to 2010, however, runoff ahead sediment load by 1/8 of the cycle, with a lag of approximately four months. During the 6–12a period from 1985 to 2005, the runoff–sediment relationship was largely synchronous. At the 6–12a period during 1985–2005, the relationship was predominantly synchronous. At Yichang Station (Figure 7d), significant coherence (R2 > 0.8) was also observed at the 0–3a period during 1992–2010. From 1992 to 2000, runoff and sediment load changed synchronously. However, from 2001 to 2010, runoff ahead sediment load by 1/8 of the cycle, or approximately four months. Throughout the 6–12a period from 1985 to 2005, the relationship remained synchronous.
3.5. Runoff and Sediment Relationship in Different Periods
As shown in Figure 8, runoff–sediment relationships at TGR stations have changed markedly over the past 50 years. Overall, they show a stepwise weakening pattern, with sediment transport rates (STR) declining continuously in distinct stages. For the main reservoir stations (Ruku, Qingxichang, and Wanxian), four stages were identified: 1970–1991 (P1), 1992–2001 (P2), 2002–2011 (P3), and 2012–2023 (P4). Due to its unique location, the Yichang station is divided into three stages: 1970–1991 (Y1), 1992–2002 (Y2), and 2003–2023 (Y3).
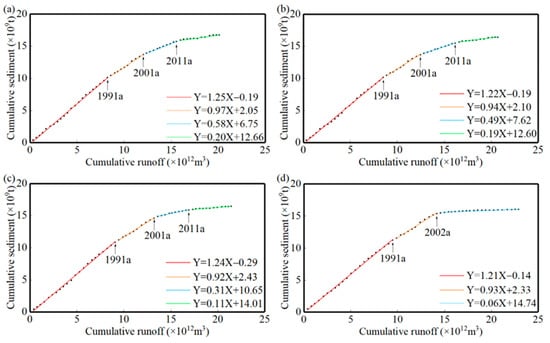
Figure 8.
Double accumulation curve of runoff–sediment load. (a) Ruku; (b) Qingxichang; (c) Wanxian; (d) Yichang.
At Ruku, the STR declined steadily from 1.25 to 0.20 kg/m3, an 84.0% reduction. The stage-specific values were 1.25, 0.97, 0.58, and 0.20 kg/m3. The downward trend was continuous, with goodness of fit (R2) above 0.98 in all stages. The sums of squared residuals were 0.342, 0.047, 0.005, and 0.022, indicating stable runoff–sediment relationships. Qingxichang followed a similar trajectory. The STR decreased from 1.22 to 0.18 kg/m3, an 85.2% reduction. The stage-specific values were 1.22, 0.94, 0.49, and 0.19 kg/m3, slightly lower than at Ruku. Model fits were excellent, with R2 above 0.99 in the first three stages. The sums of squared residuals were 0.344, 0.056, 0.004, and 0.016, suggesting fluctuations were minimal except in P4, where irregularity increased slightly.
At Wanxian, the decline in STR was the most dramatic, with values of 1.24, 0.92, 0.31, and 0.11 kg/m3, representing a total decrease of 91.1%. During P3, the STR dropped sharply to 0.31 kg/m3, a 66.3% decline compared with P2. This reduction was much greater than those at Ruku (40.2%) and Qingxichang (47.9%) during the same period. Although R2 values exceeded 0.96 across all stages, the sum of squared residuals reached 0.012 in P3, much higher than at the other stations, reflecting stronger fluctuations in runoff–sediment interactions. The relatively similar residuals at Ruku, Qingxichang, and Wanxian in P1 and P2 suggest consistent relationships during these earlier stages, while the abrupt change at Wanxian in P3 indicates stronger external disturbances.
At Yichang, runoff–sediment relationships showed more concentrated and intense changes. The STR declined from 1.21 to 0.06 kg/m3, a 95.0% reduction, the largest observed across all stations. Stage-specific values were 1.21, 0.93, and 0.06 kg/m3. During Y3, the STR fell to its lowest level among all sites, highlighting the strong impact of anthropogenic regulation. Although R2 values remained high in Y1 and Y2 (0.99 and 0.99), the fit decreased substantially in Y3 (0.91). The sum of squared residuals rose to 0.045, indicating greater fluctuations and weaker regularity in downstream runoff–sediment relationships.
4. Discussion
4.1. Impact of the TGD on Runoff and Sediment Transport Processes
The operation of the TGD has significantly altered runoff and sediment transport in the reservoir region. Its impact on runoff is limited, but its effect on sediment load is pronounced and, for stations within the reservoir-affected reach (Qingxichang–Wanxian–Yichang), intensifies from upstream to downstream. At Ruku, runoff and sediment load are not directly influenced by TGR impoundment. Instead, they are mainly affected by medium- and small-scale hydraulic projects upstream [56,57]. As shown in Table 2, runoff at this station remained relatively stable, with the multi-year average increasing slightly from 307.56 billion m3 in 1970–2002 to 368.01 billion m3 in 2003–2023, an increase of about 1.8%. Sediment load, however, declined markedly, from an average of 420.8 million t in 1970–2002 to 202.7 million t in 2003–2012 (−51.8%), and then to 74.1 million t in 2013–2023 (−82.4%). These results indicate that while runoff remained stable, sediment input underwent significant changes. Similar patterns have been reported in earlier studies [10,58,59,60]. Zhang et al. [61] research suggests that approximately 44.9% of the reduction in sediment transport was due to upstream cascade development, and 35% was caused by soil and water conservation measures and other potential factors.
Table 2.
Average runoff volume and sediment load.
At Qingxichang, both upstream factors and TGR regulation influence hydrological processes. Runoff decreased slightly from 388.81 billion m3 in 1970–2002 to 375.26 billion m3 in 2003–2023, a change of 3.5%. Sediment load fell much more sharply, from 420.50 million t in 1970–2002 to 178.80 million t in 2003–2012 (−57.5%), and further to 67.70 million t in 2013–2023 (−83.9%). The contribution of the TGD to this reduction was about 11.7% in 2003–2012 and 8.3% in 2013–2023, indicating that large-scale upstream hydraulic projects reduced the dam’s influence on sediment processes in this reach.
By contrast, Wanxian experienced stronger impacts from dam regulation. Runoff declined from 412.44 billion m3 in 1970–2002 to 371.85 billion m3 in 2003–2023, a reduction of 9.8%, which was greater than at Qingxichang. Sediment load dropped from 449.80 million t in 1970–2002 to 113.80 million t in 2003–2012 (−74.7%), and further to 40.90 million t in 2013–2023 (−90.9%). The TGR accounted for about 50.9% of this decline in 2003–2012 and 60.3% in 2013–2023, suggesting that cascade reservoir operation upstream amplified the dam’s effect on sediment transport at this station.
As the outflow station, Yichang reflects the integrated influence of the TGD. Runoff decreased slightly from 429.54 billion m3 in 1970–2002 to 415.38 billion m3 in 2003–2023 (−3.3%), highlighting the stabilizing role of the reservoir in regulating discharge. Sediment load, however, showed the largest decline among all stations, falling from 465.60 million t in 1970–2002 to 48.20 million t in 2003–2012 (−89.6%), and to 14.80 million t in 2013–2023 (−96.8%). The TGR accounted for about 80.5% of this reduction in 2003–2012 and 75.2% in 2013–2023.
By analyzing the longitudinal distribution of sediment load, we found that before 2002 the sediment load tended to increase downstream, whereas during the two sub-periods between 2003 and 2023 it decreased along the channel. The primary reason is that before 2002 the reach was a natural river channel and exhibited an overall erosional tendency. After the operation of the TGD, the water and sediment transport processes in the reservoir area were altered, causing sediment to be trapped in the reservoir. Consequently, the sediment load shows a decreasing trend in the downstream direction.
Overall, multi-year changes in runoff in the reservoir area are small. The largest change was in Wanxian (9.8%), while the smallest change was in Yichang (3.3%). By contrast, sediment transport showed sharp declines, with cumulative reductions above 90% at both Wanxian and Yichang. The influence of the TGR on sediment load exceeded 50%, underscoring its dominant role in sediment dynamics. Under current conditions of stable inflow but sharply reduced sediment input, the varied responses observed at different stations emphasise the spatial heterogeneity of the dam’s impact on runoff and sediment load dynamics within the reservoir area.
These spatially differentiated responses highlight a fundamental feature of large dam regulation: (i) runoff is buffered and remains relatively close to its natural regime, whereas (ii) sediment transport is strongly suppressed and progressively decoupled from upstream supply. This behaviour is closely related to the specific operation of the TGD, including the “storing clear and releasing muddy” strategy and pronounced seasonal water-level fluctuations. In the Three Gorges Reservoir, more than 90% of the annual water and sediment inflow occurs during the flood season, and both sediment input and net deposition are therefore concentrated in this period [62]. When sediment-laden floods enter the reservoir at relatively low water levels, flow deceleration in the backwater zone together with the large storage capacity promotes intense deposition in the upper and middle reservoir reaches, even though turbid-flood release from the dam allows part of the suspended load to pass downstream. During subsequent impoundment and high-water-level periods in the late flood and post-flood seasons, further increases in water depth and residence time favour additional settling of the remaining suspended sediment, whereas in the non-flood season the stored water is relatively clear and sedimentation is limited [63]. As a result, the sediment signal exported downstream during both flood-regulation and dry-season operation has already been strongly filtered by reservoir trapping. These operation-induced changes in flow regime, residence time and sediment settling/resuspension provide a hydrodynamic explanation for the progressive decoupling of runoff and sediment and for the observed weakening of sediment periodicity under dam regulation. Such decoupling implies substantial alterations in downstream channel morphology, delta evolution and aquatic habitats, even under apparently “stable” discharge conditions. In the context of the TGD, the more than 90% reduction in sediment load at Wanxian and Yichang indicates that the reservoir has become the dominant sediment sink in the upper Yangtze, with far-reaching implications for long-term river–reservoir–delta co-evolution.
4.2. Impacts of the TGD Operation on Abrupt Changes and Periodicity of Runoff and Sediment Load
The regulation and storage operations of the TGD have reshaped the temporal dynamics of water and sediment processes in the reservoir area. The system now shows three main features: concentrated abrupt changes, reconstructed periodicity, and greater sensitivity in sediment transport than in runoff.
Mutation analysis revealed limited responses in runoff but pronounced changes in sediment load. At Ruku, Qingxichang, and Yichang, runoff remained stable, while Wanxian showed a significant mutation in 2005, coinciding with the first impoundment phase of the reservoir. This indicates that the abrupt change at Wanxian was directly linked to dam operations. Sediment load behaved differently. Significant abrupt changes occurred at Ruku and Qingxichang in 2006. At Ruku, sediment variability was mainly controlled by upstream inflows, with little direct influence from the dam. At Qingxichang, a sharp change was observed in early 2006, slightly preceding the direct effect of TGD impoundment. By contrast, sediment load mutations at Wanxian and Yichang closely matched the timing of dam impoundments, suggesting direct regulation by reservoir operations.
The impact of the TGD on periodic evolution shows a spatial gradient: weaker for runoff, stronger for sediment load; smaller at the reservoir tail, greater at the reservoir head. Runoff retained a nested, multiscale periodic structure with a stable dominant cycle of 12–14 years, both before and after dam operation. The periodicities at Qingxichang, Wanxian, and Yichang remained synchronized with those at Ruku, indicating that natural hydrological rhythms were largely preserved. Sediment transport, however, displayed strong spatial restructuring. At Ruku and Qingxichang, multi-periodic structures persisted with a dominant 12–13a cycle and only minor changes. In contrast, Wanxian and Yichang experienced major reorganizations: short-term cycles disappeared, mid-term cycles were reconstructed, and energy weakened across all frequency bands. These changes indicate increased irregularity and a strong dam-driven disturbance of sediment rhythms.
Analysis of the coefficient of variation (CV) further highlights these differences. Before the dam (1970–2002), sediment load CVs at all stations were around 0.28, suggesting consistent temporal variability under natural conditions. After the dam (2003–2023), CVs declined slightly at Ruku (0.26, −7.1%) and Qingxichang (0.27, −3.6%), showing limited regulation effects. By contrast, CVs rose sharply at Wanxian (0.42, 50.0%) and Yichang (0.67, 125.0%). This surge in variability indicates intensified instability in downstream sediment transport and a substantial disruption of natural patterns.
These results confirm that TGD operation has primarily altered the timing and variability of sediment transport, while runoff has retained much of its natural periodic structure. This selective sensitivity of sediment dynamics directly addresses the study objective of distinguishing how dam regulation differentially affects water and sediment processes over multiple temporal scales.
4.3. Spatial Characteristics and Underlying Mechanisms of Runoff–Sediment Relationship Evolution in the TGR Region
Since the implementation of the TGD, the runoff–sediment relationship in the reservoir area has shown marked spatial heterogeneity and stage-specific changes. This reflects the complex interplay between natural processes and human regulation. The spatial pattern discovered here is largely consistent with observations of other large dam systems around the world, in which major reservoirs typically exhibit significant sediment retention and relatively small runoff variations [19,20,21,22,23,24,25,26]. From the perspective of the inflow–reservoir–outflow system, dam regulation increases gradually downstream, shifting from upstream areas dominated by natural processes to downstream areas dominated by engineering control.
During the first two stages (P1 and P2), the runoff–sediment relationship was largely unaffected by the TGP. Differences in STR were minimal, with a maximum difference in only 3.0% in P1. This indicates that runoff and sediment processes were primarily controlled by upstream supply, while the influence of climate and local human activities within the reservoir was limited. The continuous decline in sediment input from upstream was the dominant factor shaping the runoff–sediment relationship during these stages.
Clear spatial differences emerged in P3. STR declined most sharply at Qingxichang and Wanxian [64,65]. At Wanxian, STR fell by 66.3%, reflecting strong sediment retention caused by impoundment [66,67]. The residual sum of squares at Wanxian (0.012) was also much higher than at Qingxichang (0.004), suggesting greater variability and sensitivity to external disturbances. This indicates a stronger hydrodynamic response to TGD regulation at Wanxian, consistent with the spatial gradient pattern: the closer to the dam, the greater the regulation and the weaker the natural response.
Using changes in STR at Ruku as a reference, dam regulation at Qingxichang was estimated at about 20.0% in stage P3 and 21.7% in stage P4. Wanxian showed a stronger response, with regulation effects reaching 50.0% in stage P3 and 54.2% in stage P4. These results indicate that the TGD has become increasingly involved in runoff–sediment processes in the reservoir area, with engineering control intensifying over time. At Yichang, the runoff–sediment relationship reflected the main operational phases of the dam and displayed only three distinct stages. The relationship between runoff and sediment load has changed markedly, indicating a substantial decoupling from natural processes. At Yichang, the runoff–sediment relationship is now predominantly governed by dam regulation.
4.4. Limitations
Several limitations should be noted. Sen’s slope and the Mann–Kendall test are prone to spurious significance and biased slopes under autocorrelation, long-term persistence, and strong seasonality. Change-point detection is sensitive to sample length and extreme values. Double cumulative curves assume long-term linearity and stationarity, involve subjective breakpoint identification, and poorly capture nonlinearity and lags in runoff–sediment relationships.
Within this context, the findings characterize the influence of the Three Gorges Dam on water and sediment transport in the reservoir reach. Future work should integrate multi-station sediment records with de-tailed cascade-reservoir operation data across the Yangtze River basin to more precisely quantify the drivers of water and sediment transfer.
5. Conclusions
Understanding the impacts of large-scale hydraulic projects on water and sediment processes is essential for refined watershed management and ecological protection. Using long-term data (1970–2023) from the TGR, this study applied multiple analytical methods to examine runoff and sediment dynamics and to evaluate how operation of the TGD has influenced the runoff–sediment relationship. The main conclusions are as follows:
- (1)
- The influence of the TGD on runoff and sediment load exhibits marked spatial and temporal variability. Regulation effects increase progressively along the flow path, with stronger impacts observed closer to the dam.
- (2)
- Sediment transport processes have shifted from limited influence upstream to strong regulation downstream, establishing the TGD as the dominant control on reservoir sediment fluxes.
- (3)
- The TGD has progressively reshaped the runoff–sediment relationship, underscoring its central role in driving hydrological and sedimentary changes in the Yangtze River.
- (4)
- Understanding the impacts of the TGP on the water–sediment relationship in the reservoir area provides a practical basis for coordinated operation of the TGD and upstream cascade reservoirs, as well as for refined sediment management in the reservoir.
Author Contributions
Conceptualization, Y.L.; methodology, Y.L.; software, Y.L.; validation, X.T., J.C. and J.J.; formal analysis, Y.L.; investigation, H.D.; data curation, H.D.; writing—original draft preparation, Y.L. and J.C.; writing—review and editing, Y.L. and J.C.; visualization, Y.L.; supervision, J.J.; project administration, J.C. and X.T.; funding acquisition, J.C., X.T. and S.W. All authors have read and agreed to the published version of the manuscript.
Funding
This research was supported by the National Natural Science Foundation of China (Grant Numbers 42371071, 42207104); and Water Resources Bureau of Chongqing Municipal (CQS23C01036).
Data Availability Statement
The data presented in this study are available on request from the corresponding author due to some data being confidential.
Acknowledgments
The authors express gratitude to those who carefully inspected and gave advice for the improvement of this paper.
Conflicts of Interest
The authors declare no conflicts of interest.
Appendix A

Figure A1.
Wavelet analysis variance diagram of Runoff and Sediment load. (a) Ruku Runoff; (b) Ruku Sediment load; (c) Qingxichang Runoff; (d) Qingxichang Sediment load; (e) Wanxian Runoff; (f) Wanxian Sediment load; (g) Yichang Runoff; (h) Yichang Sediment load.
References
- Fortesa, J.; Ricci, G.F.; García-Comendador, J.; Gentile, F.; Estrany, J.; Sauquet, E.; Datry, T.; De Girolamo, A.M. Analysing hydrological and sediment transport regime in two Mediterranean intermittent rivers. CATENA 2021, 196, 104865. [Google Scholar] [CrossRef]
- Petts, G.E.; Amoros, C. The Fluvial Hydrosystems; Springer: Dordrecht, The Netherlands, 1996; pp. 1–12. [Google Scholar]
- Qi, Z.; Cai, Y.; Lin, J.; Xie, Y.; Yao, L.; Zhang, P.; Wang, Y.; Guo, H. Coupled high-resolution GCM downscaling framework for projecting dynamics and drivers of ecosystem services in Pearl River Basin, China. Ecol. Indic. 2023, 154, 110770. [Google Scholar] [CrossRef]
- Vercruysse, K.; Grabowski, R.C.; Rickson, R.J. Suspended Sediment Transport Dynamics in Rivers: Multi-Scale Drivers of Temporal Variation. Earth Sci. Rev. 2017, 166, 3852. [Google Scholar] [CrossRef]
- Wohl, E.; Bledsoe, B.P.; Jacobson, R.B.; Poff, N.L.; Rathburn, S.L.; Walters, D.M.; Wilcox, A.C. The natural sediment regime in rivers: Broadening the foundation for ecosystem management. BioScience 2015, 65, 358–371. [Google Scholar] [CrossRef]
- Hu, Y.; Li, D.F.; Deng, J.Y.; Yue, Y.; Zhou, J.X.; Chai, Y.F.; Li, Y.T. Mechanisms controlling water-level variations in the Middle Yangtze River following the operation of the Three Gorges Dam. Water Resour. Res. 2022, 58, e2022WR032338. [Google Scholar] [CrossRef]
- Syvitski, J.P.; Milliman, J.D. Geology, geography, and humans battle for dominance over the delivery of fluvial sediment to the coastal ocean. J. Geol. 2007, 115, 1–19. [Google Scholar] [CrossRef]
- Tang, J.; Liu, G.; Xie, Y.; Duan, X.W.; Wang, D.A.; Zhang, S. Annual variation of ephemeral gully erosion in a cultivated catchment. Geoderma 2021, 401, 115166. [Google Scholar] [CrossRef]
- Walling, D.E. Measuring Sediment Yield from River Basin. In Soil Erosion Research Methods; Soil and Water Conservation Society (U. S.), Lal, R., Eds.; CRC Press: Boca Raton, FL, USA, 1994; pp. 39–81. [Google Scholar]
- Yan, H.C.; Zhang, X.F.; Xu, Q. Variation of runoff and sediment inflows to the Three Gorges Reservoir: Impact of upstream cascade reservoirs. J. Hydrol. 2021, 603, 126875. [Google Scholar] [CrossRef]
- Zuazo, V.D.; Pleguezuelo, C.R.; Peinado, F.M.; De Graaff, J.; Martínez, J.F.; Flanagan, D.C. Environmental impact of introducing plant covers in the taluses of terraces: Implications for mitigating agricultural soil erosion and runoff. CATENA 2011, 84, 79–88. [Google Scholar] [CrossRef]
- Zhang, X.X.; Song, J.X.; Wang, Y.R.; Sun, H.T.; Li, Q. Threshold effects of vegetation coverage on runoff and soil loss in the Loess Plateau of China: A meta-analysis. Geoderma 2022, 412, 115720. [Google Scholar] [CrossRef]
- Jia, L.; Yu, K.X.; Li, Z.B.; Li, P.; Zhang, J.Z.; Wang, A.N.; Ma, L.; Xu, G.C.; Zhang, X. Temporal and spatial variation of rainfall erosivity in the Loess Plateau of China and its impact on sediment load. CATENA 2022, 210, 105931. [Google Scholar] [CrossRef]
- Zhang, H.L.; Meng, C.C.; Wang, Y.J.; Wang, Y.Q.; Li, M. Comprehensive evaluation of the effects of climate change and land use and land cover change variables on runoff and sediment discharge. Sci. Total Environ. 2020, 702, 134401. [Google Scholar] [CrossRef] [PubMed]
- Buendia, C.; Bussi, G.; Tuset, J.; Vericat, D.; Sabater, S.; Palau, A.; Batalla, R.J. Effects of afforestation on runoff and sediment load in an upland Mediterranean catchment. Sci. Total Environ. 2016, 540, 144–157. [Google Scholar] [CrossRef] [PubMed]
- Shao, Y.; Mu, X.; He, Y.; Chen, K. Variations in runoff, sediment load, and their relationship for a major sediment source area of the Jialing River basin, southern China. Hydrol. Process. 2021, 35, e14297. [Google Scholar] [CrossRef]
- Wang, J.; Shi, B.; Zhao, E.; Yuan, Q.; Chen, X. The Long-Term Spatial and Temporal Variations of Sediment Loads and Their Causes of the Yellow River Basin. CATENA 2022, 209, 105850. [Google Scholar] [CrossRef]
- Yin, S.; Gao, G.; Li, Y.; Xu, Y.J.; Turner, R.E.; Ran, L.; Wang, X.; Fu, B. Long-Term Trends of Streamflow, Sediment Load and Nutrient Fluxes From the Mississippi River Basin: Impacts of Climate Change and Human Activities. J. Hydrol. 2023, 616, 128822. [Google Scholar] [CrossRef]
- Hu, J.Y.; Xie, Y.H.; Tang, Y.; Li, F.; Zou, Y.A. Changes of vegetation distribution in the east Dongting Lake after the operation of the Three Gorges Dam, China. Front. Plant Sci. 2018, 9, 582. [Google Scholar] [CrossRef]
- Jin, Z.W.; Feng, L.; Liu, Y.J.; Liu, Y.; Xu, D.; Liu, Z.X. Impact of dam construction on sediment transport capacity: A case study of the Three Gorges Reservoir. Hydrol. Process. 2024, 38, e15147. [Google Scholar] [CrossRef]
- Li, B.; Yang, G.; Wan, R.; Lai, X.; Wagner, P.D. Impacts of hydrological alteration on ecosystem services changes of a large river-connected lake (Poyang Lake), China. J. Environ. Manag. 2022, 310, 114750. [Google Scholar] [CrossRef]
- Deng, S.; Xia, J.; Liu, X.; Zhou, M.; Mao, Y.; Xu, Q. Contributions of different sources to sediment transport in the Middle Yangtze River under intensive channel degradation. CATENA 2022, 217, 106511. [Google Scholar] [CrossRef]
- Guo, L.; Su, N.; Zhu, C.; He, Q. How have the river discharges and sediment loads changed in the Changjiang River basin downstream of the Three Gorges Dam? J. Hydrol. 2018, 560, 259–274. [Google Scholar] [CrossRef]
- Lai, X.H.; Jia, J.P.; Hou, Y.B.; Jiang, J.; Li, M.T.; Chen, J.; Wei, W. Changes in riverbed morphology in the middle Yangtze River (Yichang–Chenglingji) after the construction of the Three Gorges Dam. Hydrol. Sci. J. 2023, 68, 2373–2387. [Google Scholar] [CrossRef]
- Yang, Z.S.; Wang, H.J.; Saito, Y.; Milliman, J.D.; Xu, K.; Qiao, S.; Shi, G. Dam impacts on the Changjiang (Yangtze) River sediment discharge to the sea: The past 55 years and after the Three Gorges Dam. Water Resour. Res. 2006, 42, W04407. [Google Scholar] [CrossRef]
- Yang, S.L.; Xu, K.H.; Milliman, J.D.; Yang, H.F.; Wu, C.S. Decline of Yangtze River water and sediment discharge: Impact from natural and anthropogenic changes. Sci. Rep. 2015, 5, 12581. [Google Scholar] [CrossRef]
- Jin, H.Y.; Chen, X.H.; Zhong, R.D.; Pan, Y.J.; Zhao, T.; Liu, Z.Y.; Tu, X.J. Joint probability analysis of water and sediment and predicting sediment load based on copula function. Int. J. Sediment Res. 2022, 37, 639–652. [Google Scholar] [CrossRef]
- Liu, S.W.; Li, D.X.; Liu, D.H.; Zhang, X.F.; Wang, Z.L. Characteristics of sedimentation and sediment trapping efficiency in the Three Gorges Reservoir, China. CATENA 2022, 208, 105715. [Google Scholar] [CrossRef]
- Zhang, W.; Ren, J.Q.; Chen, Y.Q.; Yuan, J.; Li, X.; Zhu, J.Y. The important role of tributaries and flood events in sediment transport: A study on the spatiotemporal variability of water and sediment discharge upstream and downstream of the Three Gorges Reservoir. CATENA 2024, 234, 107594. [Google Scholar] [CrossRef]
- Gao, P.; Wang, Z.Y.; Siegel, D. Spatial and temporal sedimentation changes in the Three Gorges Reservoir of China. Lakes Reserv. Res. Manag. 2015, 20, 233–242. [Google Scholar] [CrossRef]
- Li, J.; Ge, H.; Ping, Y.R.; Dong, X.Y.; Zhu, L.L.; Ma, Y.C. Sedimentation Characteristics of the Fluctuating Backwater Area at the Tail of Cascade Reservoirs: A Case Study of the Three Gorges Reservoir. Water 2023, 15, 4011. [Google Scholar] [CrossRef]
- Han, J.Q.; Gao, J.N.; Luo, H. Changes and implications of the relationship between rainfall, runoff and sediment load in the Wuding River basin on the Chinese Loess Plateau. CATENA 2019, 175, 228–235. [Google Scholar] [CrossRef]
- Peng, T.; Tian, H.; Singh, V.P.; Chen, M.; Liu, J.; Ma, H.; Wang, J. Quantitative assessment of drivers of sediment load reduction in the Yangtze River basin, China. J. Hydrol. 2020, 580, 124242. [Google Scholar] [CrossRef]
- Ye, X.C.; Xu, C.Y.; Zhang, Z.X. Comprehensive analysis on the evolution characteristics and causes of river runoff and sediment load in a mountainous basin of China’s subtropical plateau. J. Hydrol. 2020, 591, 125597. [Google Scholar] [CrossRef]
- Martínez-Salvador, A.; Conesa-García, C. Estimation of suspended sediment and dissolved solid load in a Mediterranean semiarid karst stream using log-linear models. Hydrol. Res. 2019, 50, 43–59. [Google Scholar] [CrossRef]
- Torrence, C.; Compo, G.P. A practical guide to wavelet analysis. Bull. Am. Meteorol. Soc. 1998, 79, 61–78. [Google Scholar] [CrossRef]
- Zhang, Q.; Xu, C.Y.; Zhang, Z.; Chen, Y.D.; Liu, C.L. Spatial and temporal variability of precipitation over China, 1951–2005. Theor. Appl. Climatol. 2009, 95, 53–68. [Google Scholar] [CrossRef]
- Ghaderpour, E.; Ince, E.S.; Pagiatakis, S.D. Least-squares cross-wavelet analysis and its applications in geophysical time series. J. Geod. 2018, 92, 1223–1236. [Google Scholar] [CrossRef]
- Li, Z.W.; Xu, X.X.; Yu, B.F.; Xu, C.H.; Liu, M.X.; Wang, K.L. Quantifying the impacts of climate and human activities on water and sediment discharge in a karst region of southwest China. J. Hydrol. 2016, 542, 836–849. [Google Scholar] [CrossRef]
- Zhang, M.W.; Shi, K.B. Comprehensive analysis of water-sediment variation characteristics at the confluence of the upper reaches of the Weigan River and Heizi River with multiple methods and multiple influencing factors. Water Supply 2022, 22, 1275–1292. [Google Scholar] [CrossRef]
- Zhao, D.M.; Xiong, D.H.; Zhang, B.J.; He, K.L.; Wu, H.; Zhang, W.D.; Lu, X.N. Long-term response of runoff and sediment load to spatiotemporally varied rainfall in the Lhasa River basin, Tibetan Plateau. J. Hydrol. 2023, 618, 129154. [Google Scholar] [CrossRef]
- Yao, Y.; Ruan, L.; Li, H.; Zhou, W.J.; Yang, D.; Yu, J.H. Changes of meteorological parameters and lightning current during water impounded in Three Gorges area. Atmos. Res. 2013, 134, 150–160. [Google Scholar] [CrossRef]
- Wu, T.J.; Yang, H.B.; Li, Z.; Lu, H.F.; Yang, D.W. Modeling of flood routing for Three Gorges reservoir area based on MIKE11. J. Hydroelectr. Eng. 2014, 33, 51–57. [Google Scholar]
- Jiu, J.Z.; Wu, H.J.; Li, S. The Implication of land-use/land-cover change for the declining soil erosion risk in the Three Gorges Reservoir region, China. Int. J. Environ. Res. Public Health 2019, 16, 1856. [Google Scholar] [CrossRef]
- Li, Y.; Wang, C.H.; Peng, H.; Xiao, S.B.; Yan, D.H. Contribution of moisture sources to precipitation changes in the Three Gorges Reservoir region. Hydrol. Earth Syst. Sci. 2021, 25, 4759–4772. [Google Scholar] [CrossRef]
- Akihiko, I. Constraining size-dependence of vegetation respiration rates. Sci. Rep. 2020, 10, 4304. [Google Scholar] [CrossRef] [PubMed]
- Kendall, M.G. Further contributions to the theory of paired comparisons. Biometrics 1955, 11, 43–62. [Google Scholar] [CrossRef]
- Mann, H.B. Nonparametric tests against trend. Econom. J. Econom. Soc. 1945, 13, 245–259. [Google Scholar] [CrossRef]
- Lorenzo-Lacruz, J.; Morán-Tejeda, E.; Vicente-Serrano, S.M.; Hannaford, J.; García, C.; Peña-Angulo, D.; Murphy, C. Streamflow frequency changes across western Europe and interactions with North Atlantic atmospheric circulation patterns. Glob. Planet. Change 2022, 212, 103797. [Google Scholar] [CrossRef]
- Grinsted, A.; Moore, J.C.; Jevrejeva, S. Application of the cross wavelet transform and wavelet coherence to geophysical time series. Nonlinear Process. Geophys. 2004, 11, 561–566. [Google Scholar] [CrossRef]
- He, K.L.; Shi, H.W.; Chen, C.C.; Cheng, Y.; Liu, J. The study on the time lag of water level in the three gorges reservoir under the regulation processes. Hydrol. Res. 2021, 52, 734–748. [Google Scholar] [CrossRef]
- Searcy, J.K.; Hardison, C.H. Double-Mass Curves (No. 1541); US Government Printing Office: Washington, DC, USA, 1960.
- Ashagrie, A.G.; De Laat, P.J.; De Wit, M.J.; Tu, M.; Uhlenbrook, S. Detecting the influence of land use changes on discharges and floods in the Meuse River Basin—The predictive power of a ninety-year rainfall-runoff relation? Hydrol. Earth Syst. Sci. 2006, 10, 691–701. [Google Scholar] [CrossRef]
- Pirnia, A.; Golshan, M.; Darabi, H.; Adamowski, J.; Rozbeh, S. Using the Mann–Kendall test and double mass curve method to explore stream flow changes in response to climate and human activities. J. Water Clim. Change 2019, 10, 725–742. [Google Scholar] [CrossRef]
- Zhang, G.S.; Deng, A.J.; Chen, J.G.; Wang, D.W.; Lu, Q.; Xie, Y.Q. Improving the double mass curve method to analyse the variation trend of runoff and sediment load in watersheds. LHB 2023, 109, 2236971. [Google Scholar] [CrossRef]
- Walling, D.E.; Fang, D. Recent trends in the suspended sediment loads of the world’s rivers. Glob. Planet. Change 2003, 39, 111–126. [Google Scholar] [CrossRef]
- Wei, J.; He, X.B.; Bao, Y.H. Anthropogenic impacts on suspended sediment load in the Upper Yangtze river. Reg. Environ. Change 2011, 11, 857–868. [Google Scholar] [CrossRef]
- Wang, W.P.; Zhu, Y.L.; Dong, S.F.; Becker, S.; Chen, Y.F. Attribution of decreasing annual and autumn inflows to the Three Gorges Reservoir, Yangtze River: Climate variability, water consumption or upstream reservoir operation? J. Hydrol. 2019, 579, 124180. [Google Scholar] [CrossRef]
- Tang, X.; Tong, S.; Xu, G.; Huang, G.; Wang, T. Delayed response of sedimentation in the flood seasons to the pool level of the Three Gorges Reservoir. Adv. Water Sci. 2019, 30, 528–536. [Google Scholar]
- Tang, X.Y.; Tong, S.H.; Huang, G.X.; Xu, G.G.; Li, X.H.; Lei, K.; Yao, S.M. Characteristics of sedimentation and channel adjustment linked to the Three Gorges Reservoir. Int. J. Sediment Res. 2021, 36, 177–189. [Google Scholar] [CrossRef]
- Zhang, X.F.; Yan, H.C.; Yue, Y.; Xu, Q.X. Quantifying natural and anthropogenic impacts on runoff and sediment load: An investigation on the middle and lower reaches of the Jinsha River Basin. J. Hydrol. Reg. Stud. 2019, 25, 100617. [Google Scholar] [CrossRef]
- Deng, J.Y.; Xu, F.; Ma, C.Y.; Yang, C.R.; Zhao, Z.C.; Yue, H.Y. Analysis of the sediment deposition characteristics in the Three Gorges Reservoir and its influence factors. Environ. Earth Sci. 2024, 83, 476. [Google Scholar]
- Tang, X.Q.; Li, R.; Wu, M.; Zhao, W.H.; Zhao, L.Y.; Zhou, Y.J.; Bowes, M.J. Influence of turbid flood water release on sediment deposition and phosphorus distribution in the bed sediment of the Three Gorges Reservoir, China. Sci. Total Environ. 2019, 657, 36–45. [Google Scholar] [CrossRef]
- Liro, M.; Ruiz-Villanueva, V.; Mikuś, P.; Wyżga, B.; Castellet, E.B. Changes in the hydrodynamics of a mountain river induced by dam reservoir backwater. Sci. Total Environ. 2020, 744, 140555. [Google Scholar] [CrossRef]
- Wang, K.; Pang, Y.; He, C.; Li, P.H.; Xiao, S.B.; Shi, Q.; He, D. Three Gorges Reservoir construction induced dissolved organic matter chemistry variation between the reservoir and non-reservoir areas along the Xiangxi tributary. Sci. Total Environ. 2021, 784, 147095. [Google Scholar] [CrossRef]
- Li, X.T.; Liu, B.; Wang, Y.M.; Yang, Y.G.; Liang, R.F.; Peng, F.J.; Xue, S.D.; Zhu, Z.X.; Li, K.F. Hydrodynamic and environmental characteristics of a tributary bay influenced by backwater jacking and intrusions from a main reservoir. Hydrol. Earth Syst. Sci. 2020, 24, 5057–5076. [Google Scholar] [CrossRef]
- Xiang, R.; Wang, L.J.; Li, H.; Tian, Z.B.; Zheng, B.H. Water quality variation in tributaries of the Three Gorges Reservoir from 2000 to 2015. Water Res. 2021, 195, 116993. [Google Scholar] [CrossRef]
Disclaimer/Publisher’s Note: The statements, opinions and data contained in all publications are solely those of the individual author(s) and contributor(s) and not of MDPI and/or the editor(s). MDPI and/or the editor(s) disclaim responsibility for any injury to people or property resulting from any ideas, methods, instructions or products referred to in the content. |
© 2025 by the authors. Licensee MDPI, Basel, Switzerland. This article is an open access article distributed under the terms and conditions of the Creative Commons Attribution (CC BY) license (https://creativecommons.org/licenses/by/4.0/).