Abstract
Climate change is advancing, sea levels are rising, and peak river discharges are increasing. Accelerated sea level rise (SLR) may pose a significant threat to the long-term habitability of the Netherlands. In the short term, further reinforcement of flood defenses is required. However, the key long-term question is which adaptation strategy will most effectively manage flood risk in the Netherlands. As part of the SLR Knowledge Programme, research was conducted on various long-term strategies, focusing on the feasibility of three approaches: Protect, Advance, and Accommodate. The Protect and Advance strategies aim to reduce flood risk primarily through the prevention of flooding. The Accommodate strategy, particularly in its more extreme form, emphasizes Managed Retreat, following the precautionary principle, or seeks to mitigate flood consequences rather than invest in Prevention. This study examined the economic implications of two opposing cornerstone strategies, Protect and Managed Retreat, as well as hybrid strategies that integrate elements of both, across different sea level rise scenarios. Additionally, the study includes a forward-looking assessment of the potential impacts on the financial sector, with particular attention to catastrophe insurance and capital requirements aimed at mitigating default risk. The findings indicate that a Managed Retreat strategy represents a last-resort option and cannot be implemented effectively without concurrent protective measures. Furthermore, the annual flood risk is only marginally reduced under the Accommodate strategy, even when combined with protective interventions, while its associated costs significantly exceed those of the Protect strategy. A combined approach integrating protection with localized Accommodate measures that support multi-functional land use, such as nature-based solutions and water storage, appears to offer a more promising strategy, if these values cover the costs. The results can be used to evaluate the effectiveness of possible adaptation strategies to sea level rise.
1. Introduction
Currently, over 50% of the Netherlands is flood-prone [1] during storm surges of extreme river discharges, though such an area would not flood simultaneously. Climate change is accelerating, sea levels are rising, and river discharge volumes may increase, although the rate and magnitude remain uncertain [2]. Because of global warming, the projected sea level rise (SLR) at the end of this century may range from 0.28 to 0.73 cm in the low scenario and 0.59–1.24 in the high scenario [3], relative to 1995, depending on the CO2 emission scenario. Also, after 2100, a further increase in SLR is foreseen.
In the Dutch SLR Knowledge Programme, even greater sea level rises are anticipated because of the instability of the Antarctic land ice [4]. Different scenarios are considered, as described in Table 1. Research has been conducted into various long-term solutions for the Netherlands in response to rising sea levels and increasing river discharges due to climate change. To assess the implications of adaptation strategies, a range of various possible interventions have been explored, including the sustainability and stretchability of the current strategy [5] and long-term strategies as Protect, Advance and Accommodate [6].

Table 1.
Sea level rise in m relative to 1995 for four different scenarios.
While the extent of climate change is inherently uncertain, the decision to implement a long-term solution is not, as such decisions have immediate and lasting impacts on spatial planning and associated costs. All adaptation strategies imply a spatial footprint and influence risk, and therefore all have societal and financial consequences. Ref. [6] introduces the development of these strategies. The economic costs to implement these strategies and the remaining annual flood risk (defined as the probability of a flood event multiplied by the consequences). The impact on financial institutions, such as banks and insurances companies, has not been determined, and a better understanding is required [7]. Financial institutions integrate flood risk into reporting and regulatory frameworks like the European Central Bank’s (ECB) guidelines on climate-related and environmental risk [8]; climate stress-testing protocols [9]; EU regulations for the Corporate Sustainability Reporting Directive [10]; and Environmental, Social, and Governance (ESG) ratings [11]. The European Insurance and Occupational Pensions Authority [12] uses the 200-year return period loss or the total insured value as a solvency benchmark.
This study aims to assess the economic implications of long-term strategies and their impact on the insurability of long-term investment decisions. It also seeks to reflect on these long-term strategies and explore additional approaches that combine flood prevention measures with efforts to reduce flood consequences over time. The economic implications and associated annual flood risk are analyzed using a representative case study.
2. Long-Term Strategies
In most delta regions, various protection measures are already in place, often in combination with land use policies. These areas have evolved based on historical decisions, including land reclamation and past flood events. Accelerating SLR may necessitate a reassessment of current flood risk management strategies, as both costs and risks are expected to increase, and critical tipping points may be reached.
The IPCC [13] identified three categories of responses to sea level rise and climate change: Retreat, Accommodate, and Protect. Retreat and Accommodate involve policy shifts in which no measures are implemented to prevent flooding. Under the Retreat strategy, coastal zones are gradually abandoned, allowing ecosystems to migrate inland. The Accommodate strategy entails continued habitation in flood-prone areas, while reducing flood consequences through measures such as elevating buildings and providing emergency shelters. The Protect strategy aims to reduce the probability of flooding by implementing hard infrastructure (e.g., levees and storm surge barriers) and soft measures (e.g., dunes, mangroves, and nature-based solutions).
The SLR Knowledge Programme for sea level rise defined, using IPCC scenarios, four possible measures for the Netherlands [14,15]:
- Protect Open: A strategy based on protection with an open or closable (using storm surge barriers) connection between sea and rivers.
- Protect Closed: A strategy based on protection with a closed (using sluices and pumps) connection between sea and rivers.
- Advanced: Measures located seaward of the present coastline that aim to maintain the current safety against both coastal and fluvial flooding.
- Accommodate: Adapt land use to increasing salinization, waterlogging, and floods, e.g., by using flood-proof buildings, salt-tolerant crops, and intensifying new investments on higher ground. The latter part can be considered as ‘Managed Retreat’ measures. This strategy combines the Retreat and Accommodate strategy of the IPCC described in 1992 [13].
Considering either the precautionary principle or a risk-based approach (as currently applied in the Netherlands [16]), two contrasting policy cornerstones can be distinguished: Managed Retreat and Prevention.
The precautionary principle states that if a policy or action poses a potential risk to public health or the environment, such as levee reinforcements and lack of scientific consensus (e.g., regarding the pace and extent of climate change), the policy or action should be avoided [17]. The Managed Retreat variant is explicitly grounded in the precautionary principle because of the uncertainty of climate change. It entails a phased relocation of populations from vulnerable areas to safer regions over an extended time horizon, without further investments in flood protection. The Knowledge Programme suggests a Retreat timeline of approximately 100 years without levee upgrades [6].
In contrast, a risk-based approach allows for the implementation of measures to reduce either the probability or the consequences of flooding. This approach is also referred to as multi-layered safety [18] or multiple lines of defense [19,20]. Strategies such as Protect Open, Protect Closed, Advance, and the Living with Water variant of Accommodate fall under this framework. The recent literature [21] reclassifies Accommodate measures to classes linked to the precautionary principle as well as classes for a risk-based approach. Multiple variants of Prevention strategies can been developed, combining engineered flood defenses, hydraulic infrastructure, and nature-based solutions.
The Dutch flood risk management system is built on the principle of acceptable risk and multiple layer safety. For the basic level of protection, legally established safety standards that describe failure probabilities for levees are defined, combined with periodic evaluations that take climate change into account and offer reinforcements if needed. In high-value areas, preventive measures have proven to be the most cost-effective [16]. This strategy prioritizes continuous reinforcement of flood defenses but also attention for emergency management and land use planning.
Under extreme sea level rise scenarios, flood frequencies may exceed critical thresholds. If levees are not upgraded under a Retreat strategy, the likelihood of multiple floods per year increases significantly, resulting in substantial damage and potential loss of life. During the Managed Retreat period, increasing flood frequency can undermine the feasibility of recovery and reconstruction, as affected populations may eventually be forced to relocate regardless of policy.
Moreover, the present value of flood risk management measures is sensitive to the timing of investments and the applied discount rate. A longer transition period allows for cost distribution over time, potentially improving economic feasibility.
This study further develops and evaluates alternative long-term strategies that integrate elements of Protect and Accommodate, using various implementation timelines and expanding on the two strategic cornerstones (Table 2).
Table 2.
Long-term strategies.
3. Method
To quantify flood risk in the selected case study area, realistic parameter values and models currently used in flood risk assessments were applied. The analysis was deliberately simplified to avoid unnecessary complexity while preserving the representativeness of the results. The failure probability of the flood defenses is equal to the probability of flooding . The total economic value of the area was estimated based on the number of residential dwellings, where the average value per-dwelling value also implicitly includes the value of land and commercial assets. Furthermore, it is assumed that the economic growth rate in the project area mirrors the national average for the Netherlands.
Flood damage in year t, denoted as Cₜ, is described by Formula (1). It is calculated as the product of the number of flooded dwellings in year t(nₜ), the reconstruction cost per dwelling, and the water depth (d). The reconstruction cost is modeled as a factor (f1) of the market value of a dwelling (Vₜ, in EUR) in year t. The damage function (f2) reflects the relationship between damage and water depth (d). For simplicity, the estimated dwelling value is taken to be higher than the pure residential market value, as it includes land and business asset components.
Ct = nt × f1 × Vt × f2
The market value of properties increases over time according to a constant annual economic growth rate (g), as defined in Formula (2).
Vt = V0 × (1 + g)^t
The risk (), as defined in Formula (3), represents the expected annual flood damage in year t, conditional on a given climate scenario c. It is calculated as the product of the annual probability of flooding () and the associated flood damage (Ct). However, due to climate change, the expected damage is also projected to increase over time. We considered that after a flood, the area will be rebuild in the original state.
Specifically, the rise in sea level (), which varies by year t and climate scenario c is assumed to result in greater flood depths. Sea level rise leads to higher damage levels. The resulting increase in damage is expressed through a scaling factor (f3), which is derived based on the so-called decimation depth (). Factor f3 can be determined using current flood simulation models and established damage functions, while the decimation depth can be derived from water level statistics.
The investment costs () depend on the type of measure implemented (k), the year of implementation (t), and the climate scenario (c).
For investments in dike reinforcements (k = 1), the annual costs (see Formula (4)) are determined by the length of the dike to be reinforced (L) and the cost per kilometer of reinforcement. These costs consist of a fixed component (a) per reinforcement cycle and a variable component (b), which depends on the expected magnitude of the reinforcement effort. The latter is based on the projected increase in sea level over a 50-year design horizon, i.e., the difference between sea level in year t + 50 and year t(). In addition, dike reinforcement costs increase over time due to rising prices and material scarcity, captured by a cost escalation factor (h).
For the buyout of dwellings under the accommodation strategy (k = 2), the annual costs (see Formula (5)) are determined by the number of dwellings to be purchased in year i equal to the difference between the housing stock in year i and year i + 1 multiplied by a compensation factor (f4) and the market value of a dwelling in that year (Vi).
The present value of all costs over the full evaluation period (T) denoted as is calculated by discounting the annual expected risk () and investment costs () and I2,t) using a discount rate (Dj). The choice of discount rate reflects either an ethical or economic perspective, and low, medium, and high discount rate values (j) are considered in the analysis.
4. Case Study: Long-Term Strategies for the Netherlands
4.1. Introduction to Long-Term Strategies
In this study, we focus on the primary flood defenses in the Dutch Delta. Approximately thirteen centuries ago, inhabitants of the region that is now the Netherlands began constructing levees to protect against flooding. Today, the Netherlands is considered one of the safest deltas in the world. The last major flood caused by the failure of primary flood defenses occurred in 1953, when multiple levee breaches resulted in approximately 5% of the country being inundated. The current approach in the Netherlands can be described as combination of ‘Protect Open’ (as the Delta works) and ‘Protect Closed’ (as the lake IJssel) and is based on Prevention.
The current flood risk management approach is based on protection (safety standards that describe the acceptable failure probability of levee are set by law). The safety standards that have been in effect since 2017 are based on a minimization framework that balances the costs of levee reinforcement against expected flood risk [23]. Every 12 years, all primary defenses are re-evaluated based on updated estimates of hydraulic loads, which incorporate observed and projected climate change. When reinforcements are implemented, they are designed to remain effective for a forward-looking period of 50 years, using the climate scenario that is valid at the time of assessment. In addition to Prevention, land use planning is also promoted and emergency plans are implemented and regularly tested. All levees have to meet the safety standards by 2050.
To illustrate the impact and fundamental characteristics of long-term adaptation strategies, a highly simplified case study area was used to analyze the corner strategies, Protect and Accommodate and Retreat, and the eight additional strategies. Although a full Retreat out of the flood prone area of the Netherlands is already thought to be unrealistic the hybrid strategy for Accommodate as proposed [22] protects the Randstad area as economic center, Retreat and Accommodate is foreseen for the Low-Lying Netherlands and the Delta and River Region.
The case study area is based on the region of North Holland, located north of the North Sea Canal, excluding the island of Texel. The area of the case study is part of the area identified as ‘Low-Lying Netherlands’ in the strategy, Hybrid Accommodate (see Figure 1), alongside parts of Fryslân, Groningen, and Flevoland. The size of the case study area is approximately 5% of the Netherlands. It is assumed that the levees are reinforced in 2025, anticipating a lifetime of 50 years based on the moderate climate scenario. This means that a new levee reinforcement is foreseen in 2075, assuming a moderate climate scenario. The long-term strategies, as defined in Section 2, are further specified in Table 3.
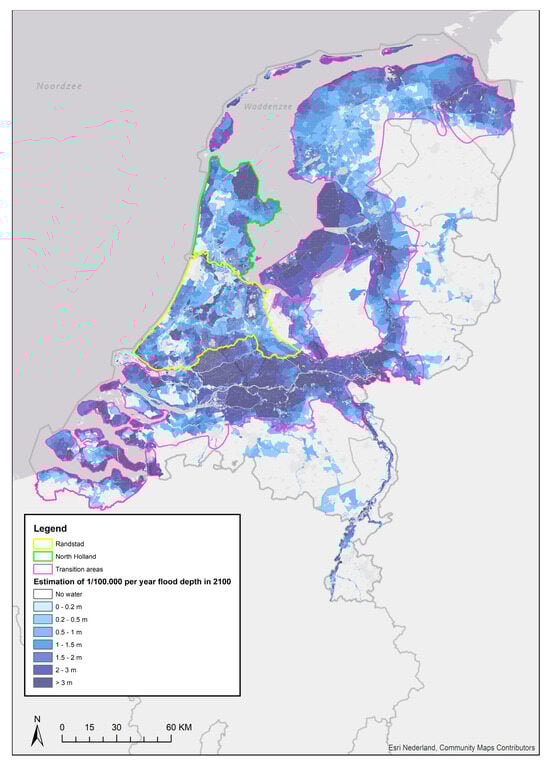
Figure 1.
Transition area in hybrid strategy of Knowledge Programme sea level rise: the Randstad and case study area.
Table 3.
Long-term strategies for the case study area.
4.2. Data
The failure probability of the flood defenses is equal to the probability of flooding , in line with current Dutch safety standards, and was set at 1/3000 per year. Each subsequent reinforcement is scheduled 50 years after the previous one, aligned with the corresponding climate scenario. When levees are not reinforced (Accommodate strategy), the failure probability increases over time. For each 0.5m of sea level rise (equal to the current difference between the water level equal to the safety standards and a water level which has a frequency that is 10 times lower), the failure probability is assumed to increase by a factor of 10 (see Figure 2).
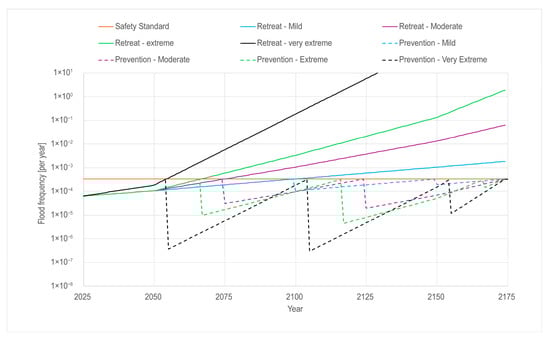
Figure 2.
Expected failure probability for climate scenarios with and without levee reinforcements.
The total economic value of the area was estimated based on 400,000 residential dwellings, where the average per-dwelling value also implicitly includes the value of land and commercial assets.
It is assumed that relocation under the Accommodate strategy occurs linearly over a 100-year period, meaning that an equal number of dwellings is relocated each year. This relocation process is set to commence in 2075, which corresponds with the anticipated timing of the next major flood defense reinforcement effort based on projections for moderate sea level rise, as used for the levee reinforcement in 2025 (designed to meet the safety standard in 2075). Furthermore, it is assumed that the economic growth rate in the project area mirrors the national average for the Netherlands. All other parameters are described in Table 4.
Table 4.
Parameters for case study.
Costs related to social support programs to prevent or reduce socio-economic imbalance and maintain public services have not been included in the analysis. Likewise, potential second-order effects on regional economic development have not been accounted for. In the protection strategy, it is assumed that areas that are already well-protected will not necessarily experience additional spatial or economic development, in part due to very low flood probability, the low risk awareness and the perceived adequacy of existing flood protection. Costs associated with climate-adaptive construction for new buildings, such as those resulting from stricter building regulations or elevated design requirements, are also not included in the current cost assessment.
5. Results
This section first presents the results for the two cornerstone strategies: Protect and Accommodate/Retreat. The second part discusses the outcomes of the additional, combined strategies.
To contextualize the magnitude of the associated costs, all values are expressed as a percentage of the present value of the Gross Regional Income (GRI) of the study area over the period until 2175. Since the study area represents approximately 5% of the national territory, it is assumed that its population generates 5% of the Netherlands’ Gross National Income (GNI), which currently amounts to approximately EUR 1000 billion per year [33]. It is further assumed that the selected long-term flood adaptation strategy does not influence the long-term growth trajectory of the GRI. For strategies that are implemented before 2175, the year of completion is used as the reference point for evaluating costs.
5.1. Cornerstone of Strategies ‘Prevention’ and ‘Managed Retreat
The total costs are the sum of the investment costs and annual risk (Table 5). The present value of these costs until the year 2175 are presented in Table 3 for the medium, low and high discount rate.
Table 5.
Present value for investment costs, annual risk and total costs for corners ‘Prevention’ and ‘Managed Retreat’ in EUR billion for different climate scenarios and discount rates.
The costs for the Prevention and Managed Retreat strategy are presented in Figure 3. For the Prevention strategy, investment costs are primarily associated with levee reinforcements based on a 50 year horizon. The timing of these reinforcements depends on the rate of sea level rise. If sea levels rise more rapidly than projected under the moderate scenario, reinforcements will be required earlier and height will be higher; conversely, if sea level rise progresses more slowly, the existing flood defenses will remain adequate for a longer period.
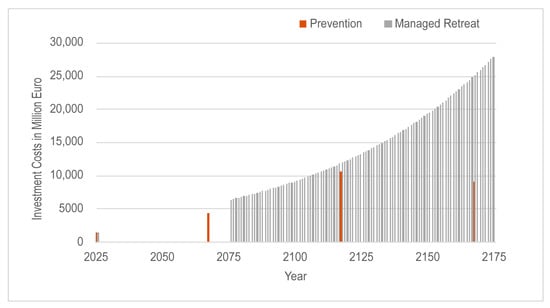
Figure 3.
Investments costs per year for Prevention and Managed Retreat in case of extreme sea level rise.
Assuming that the dike system is reinforced in 2025 with a design life of 50 years based on a moderate climate scenario, subsequent reinforcements would be required by 2100 under the mild scenario, by 2067 under the extreme scenario, and by 2055 under the very extreme scenario. It is important to note that higher rates of sea level acceleration will also result in greater required reinforcement volumes and costs.
For the Managed Retreat strategy, investment costs are driven by the relocation of approximately 4000 buildings per year over a 100-year period. These costs are assumed to be constant across all sea level rise scenarios, as the relocation timeline is not linked to the actual rate of sea level rise. However, the total cost of Managed Retreat is significantly higher than that of the Protect strategy.
Flood risk is determined by both the annual probability of a flood event and its associated consequences. Figure 2 illustrates the evolution of flood defense failure probabilities under different sea level rise scenarios for the Prevention and Managed Retreat strategies.
A key observation from Figure 2 is that, under extreme SLR scenarios, the probability of flooding under the Managed Retreat strategy increases to frequencies exceeding one event per year. While the Managed Retreat strategy results in a gradual reduction in potential flood consequences due to the phased relocation of residents, the overall risk is not proportionally reduced. After 50 years, approximately half of the dwellings in the flood-prone area will have been relocated, which significantly lowers exposure. However, total flood risk remains high, as climate change leads to greater flood depths and thus higher damage potential. In addition, property values are projected to increase over time due to economic growth, further amplifying potential losses (see Figure 4).
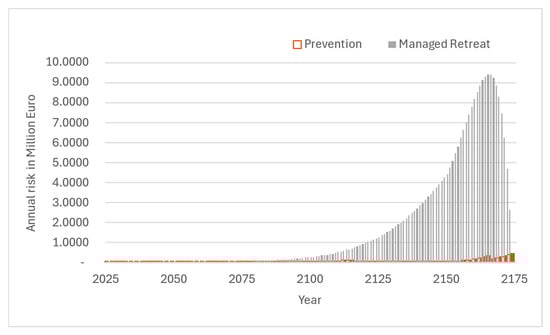
Figure 4.
Annual risk for Prevention and Managed Retreat per year in case of extreme sea level rise.
Under (very) extreme sea level rise scenarios, the total costs associated with the Managed Retreat strategy become prohibitively high, primarily due to the substantial increase in flood probability when flood defenses are not reinforced. In its current form, the Managed Retreat strategy appears unrealistic under extreme SLR.
Moreover, this analysis does not account for additional societal costs related to social cohesion and livability, such as demographic shifts, declining public services, and stranded assets. These unquantified impacts may further undermine the feasibility and acceptability of the strategy.
5.2. Additional Strategies
The present value of the total costs, annual risk and investments until the year 2175 are presented in Table 6 for a medium discount rate. The low and high discount rate are not taken into account because the results of the cornerstone strategies already show that the impact of the strategy outweighs the impact of the discount rate.
Table 6.
Present value for investment costs, annual risk and total costs for additional strategies in EUR billion for different climate scenarios and medium discount rate.
The results show that, for strategies without investments in preventive measures, the present value of flood risk increases substantially and is several times higher compared to strategies that include flood Prevention.
In all cases, the total costs associated with Managed Retreat exceed the combined costs of risk and investment in levee reinforcements. Among all Retreat-based strategies, total costs are lowest when levee reinforcements are included. This indicates that the cost of preventive measures is significantly lower than the cumulative annual risk in the absence of such measures.
The Spatial Reallocation of New Developments and Building-Level Adaptation Measures strategies do not result in significantly lower total costs compared to the Prevention strategy, mainly due to the relatively low annual risk in the protected area. However, it is important to note that the costs of spatial planning and building adaptation measures have not been included in this analysis. Inclusion of these costs would increase the total present value.
To reduce flood damage by 50% for flood depths exceeding sometimes multiple meters building adaptation measures have to be applied. In total, there are 400,000 residential structures and also commercial structures. If the average cost per building exceeds EUR 19,000, the present value of this strategy surpasses that of levee reinforcements under the very extreme climate scenario and a medium discount rate. For the extreme climate scenario, this cost threshold is EUR 12,500 per building.
The costs associated with the Post-Flood Retreat strategy are not included in the comparative analysis due to the uncertainty surrounding the timing of the flood event. As an indication, the present value of Retreat costs amounts to approximately EUR 72 billion if a flood occurs in 2100, EUR 7 billion if a flood occurs in 2500, and EUR 56 if the event occurs once every 3000 years corresponding to the current statutory safety standard.
6. Discussion
In the literature, there is a debate about potential adaptation strategies for sea level rise [34,35]. The literature states that management Retreat is in the long term the only possible solution in the face of ongoing climate change [21]. However, this moment might be far in the future. The question therefore remains: which choices can be made in the next decades of this century? This creates the opportunity to avoid costly measures, while the effectiveness of mitigation measures and future mitigation policy is uncertain. Ref. [7] describes the need for quantitative analyses for the Netherlands and a dialog to develop an adaptation discourse. This research describes a method to develop a first order of a quantitative assessment of different adaptation strategies.
The costs associated with the Managed Retreat strategy (defined as the relocation of residential areas over a 100-year period without further investment in flood defenses) are extremely high, both in absolute terms and relative to the Prevention strategy. These cost differentials become even more pronounced under accelerating sea level rise scenarios.
Under Managed Retreat, flood probabilities increase significantly in extreme sea level rise scenarios, raising serious doubts about the feasibility of completing the planned transition period. The increasing flood risk with an accelerating SLR poses a threat to the successful implementation of the strategy. Additionally, the rising frequency of flood events would have negative impacts on ecosystems and agricultural land.
The variant that combines Managed Retreat with Prevention yields the lowest total costs among the Retreat-based strategies, yet its costs remain at least 60 times higher than those of Prevention alone. Both the implementation costs and the residual annual risk costs are consistently and substantially higher for Retreat strategies compared to Prevention. While the relative cost gap narrows when higher discount rates are applied, doing so is conceptually inconsistent with the low (ethically motivated) discount rates typically advocated in the context of climate change mitigation [30]. Applying a higher discount rate as proposed by Nordhaus [32] reduces the present value of future damages, but this conflicts with the long-term, intergenerational objectives that underlie climate adaptation and sustainability policy.
From an economic perspective, Managed Retreat should therefore be regarded as a last-resort option. Managed Retreat is applicable only when Prevention becomes technically or financially infeasible or unwanted. The results also indicate that preventive measures must be maintained throughout the Retreat transition period. Failing to do so would initiate a high-risk transition phase. This underscores the need for regular reassessment of preventive strategies under evolving sea level rise projections.
For the current set of scenarios of SLR; however, there is no evidence to suggest that Prevention is no longer feasible. Notably, for less developed areas, the Managed Retreat costs might be less, so other outcomes can be possible.
6.1. Financial Market and Insurance
The cost of insuring assets and the capital requirements for banks and insurers are directly influenced by the magnitude and development of underlying risks. Under European Union regulation, Solvency II requires insurers to maintain sufficient capital to withstand a 1-in-200-year loss event [15]. Similar capital adequacy requirements apply to banks under relevant financial regulations.
Under Prevention strategies, flood risk remains broadly comparable to current levels, implying a limited impact on insurance premiums and capital buffers because of the low frequency. In contrast, under Managed Retreat strategies without accompanying preventive measures, flood risk increases significantly during the transition period when flood defenses are no longer reinforced. As a result, both insurance premiums and capital requirements are expected to rise accordingly.
Accommodate strategies that are combined with Prevention have a marginally positive impact on capital assessments, due to reduced exposure and moderated risk profiles. The Spatial Reallocation of New Developments strategy for new developments leads to a small reduction in the number of properties located in flood-prone areas. Likewise, Building-Level Adaptation Measures strategies reduce flood-related consequences by up to a factor of two through resilient construction measures. However, the investment costs required to achieve this reduction in consequences have not been included in the current analysis.
In the strategy, Localized Retreat to Support Flood Prevention, where 5% of the area is relocated to support preventive measures, exposure is reduced proportionally, assuming the relocated assets move to non–flood-prone areas. The Post-Flood strategy may introduce additional uncertainty for the investment climate. In particular, the potential for a future withdrawal from a region may deter long-term investment, as investors may favor locations perceived as less exposed or less uncertain.
For insurers and financial institutions, decisions related to Prevention are critical in managing exposure and ensuring regulatory compliance. Table 7 presents the projected flood probabilities without reinforcement measures under various sea level rise scenarios. While probabilities vary depending on the climate change trajectory, investment horizons of 30 years mean these differences may soon become relevant to underwriting and capital planning. Notably, under the Protect strategy, the maximum flood probability remains at 1/3000 per year.
Table 7.
Projected failure probabilities (1/n per year) for flood defenses without reinforcement, under various sea level rise scenarios.
To illustrate the evolution of yearly insurance costs for a property, the actuarially fair premium (equal to the annual risk) was estimated for the years 2100 and 2150. Under the Prevention strategy, premiums range from tens to several hundred euros per dwelling in 2100, and from hundreds to several hundred euros per dwelling in 2150. These values vary primarily due to (1) changing flood probabilities between reinforcement rounds and (2) increasing potential damage due to climate change. Note that the risk can also be reduced by more extreme safety standards.
Under the Managed Retreat strategy without Prevention, yearly insurance costs range from tens to over EUR 100,000 per dwelling per year in 2100, and from tens of thousands to far beyond current market values per dwelling in 2150, depending on the sea level rise trajectory. Once the probability of occurrence becomes too high, insurance may no longer be feasible. If flood events occur more frequently than recovery can be completed, areas can also not recover. At such potential risk levels, it becomes questionable whether banks would be willing to issue mortgages or provide financing for investments.
While post-disaster recovery can be rapid in some cases, the term “rapid” has to be considered relative to the frequency of flooding. Following the tsunami in Japan, for example, the affected region took approximately 10 years to restore protection capacity [36]. Therefore, it can be questioned if investments will be made after a flood during the transition period of Managed Retreat.
6.2. Societal Costs
Under the protection strategy, no substantial positive or negative effects on overall welfare are expected because of the low flood probability. Reference [37] suggests that flood protection can stimulate further spatial and economic development, potentially increase long-term exposure, and thus risk an effect known as maladaptation. However, in the Dutch context, protection levels are already extremely high, with a large portion of the population already living and working in delta regions. Combined with relatively low public awareness of water risks, the likelihood of significant maladaptation is considered limited.
In the Managed Retreat strategy, all developments (and in the Spatial Reallocation of New Developments strategies, only new developments) are expected to shift outside the project area. The number of dwellings within the area is assumed to decline gradually over a 100-year transition period, resulting in a fundamentally different spatial and demographic structure thereafter. This transition opens opportunities for industrial development in more strategic locations and the emergence of new urban centers outside the current flood-prone area.
However, there is a significant risk of social stratification. Those with sufficient resources may relocate early, while others may be left behind. Regional prosperity in the project area is likely to decline initially. Past experience from depopulating regions and stranded assets [38] shows that public services tend to deteriorate. Health outcomes are also generally worse in these areas, largely due to lower socioeconomic status and selective out-migration. Public services such as schools, banking, retail will come under pressure and require active government support. Disparities in welfare may emerge between those who relocate early and those who remain [39].
Large-scale investments, including those related to the energy transition, may also be jeopardized. Investors and businesses may be unwilling to commit to a region facing long-term depopulation and uncertainty. The risk of growing socioeconomic inequality between the retreating region and the rest of the country is considerable.
Empirical studies [40,41,42] on current housing markets in flood-prone areas have shown that flood risk is considered in the pricing of houses, the impact is a few % of the house price. However, a causal link has not been definitively established. Research on public awareness shows that the Dutch public is not aware of flood risk [43]. Only in recent years is the awareness of flood risk rising, but it is not taken into account by most buyers [44].
The literature shows that housing prices can temporarily drop by up to 10% following a flood event, but these effects tend to dissipate within 9 to 12 years [45]. This recovery period is relatively short compared to the expected return period of flood events under current safety standards. These impacts on house prices are given in the current Prevention strategy.
Under a Retreat strategy, the housing market in the project area may collapse, as demand plummets and residents are no longer free to choose where they live. Government intervention may be needed either by guaranteeing compensation for homeowners (as the state will eventually purchase these homes), or by purchasing and renting out all properties immediately. Whether this can be financed is a major question.
Elsewhere in the Netherlands, housing demand will rise, putting upward pressure on prices, especially as all accommodation zones are removed from the future housing stock. Although relocating 4000 homes per year seems technically feasible, the strategy must be scaled across multiple regions, not just the study area. Moreover, suitable land for new development is more limited under this strategy. Wealthier residents may choose to leave early and absorb financial losses, further widening socioeconomic disparities.
These impacts may be mitigated through compensatory measures, but this would significantly increase total costs. Key questions remain about the extent to which this transition can be effectively managed and whether a 100-year transition period is realistic or whether a more rapid, event-driven transition (e.g., post-disaster) may ultimately prove more feasible.
To guide this process effectively, better insight is needed into the potential consequences in terms of broad societal well-being, and how these impacts can be influenced or mitigated over time.
6.3. Total Costs
The costs associated with the Prevention strategy are broadly in line with current national expenditures under the Dutch Flood Protection Program (HWBP), which total approximately EUR 1 billion per year [46]. These costs are considered manageable, related to the GRI of approximately EUR 1000 billion per year [27]. In contrast, the costs of the Managed Retreat strategy are significantly higher.
Under very extreme sea level rise scenarios, the costs of Managed Retreat strategy exceed those of protection by a factor of more than 1000, regardless of the discount rate applied. In all other scenarios, the costs of Managed Retreat are at least ten times higher than those of protection over the entire period. This comparison excludes the potential costs of social support programs during the transition period, and it assumes that the economic development of the region is not negatively affected by the relocation strategy.
To place these costs in perspective: in 2024, the Dutch Government allocated more than EUR 80 billion in support measures related to the COVID-19 pandemic [47]. In 2023, the Dutch national debt stood at 46.5% of GNI, well below the European threshold of 60%, and the 2023 Budget Memorandum projected a public deficit of 3% of GNI, equivalent to about EUR 30 billion [48]. The costs for Managed Retreat, which represents only a fraction of the areas for which these strategies apply, are far greater. Direct Managed Retreat is hardly possible because the costs cannot be spread over many years because all people have to be compensated directly. The costs of reconstruction after a flood are far less than Retreat because the reconstruction costs are less than the market values of properties and the damage after a flood is a fraction of the maximum damage because of the water depth.
It should also be noted that the study area represents one of several comparable low-lying regions in the Netherlands. Therefore, implementing the Retreat or accommodation strategy at scale would be even more challenging particularly considering that additional costs such as demolition, social transition programs, and broader economic impacts have not been included in this analysis but are expected to increase the costs of management Retreat and Accommodate.
7. Concluding Remarks and Recommendation
This study shows the first estimation of the costs for potential adaptation strategies for the Netherlands. This study also shows a simplified method to assess the costs of adaptation strategies which can be applied in other delta areas worldwide.
From a financial and economic perspective in Dutch delta, Prevention remains the most attractive strategy to cope with sea level rise, as long as levee reinforcements remains feasible. From an economic perspective, Managed Retreat should therefore be regarded as a last-resort option. Strategies centered around large-scale relocation of people from flood-prone areas—even when combined with dike reinforcements—are financially and economically highly costly, and they tend to exacerbate challenges related to maintaining liveability in such areas. Managed Retreat is applicable only when prevention becomes technically or financially infeasible or unwanted, also from societal perspective. In case of a Retreat strategy, the results also indicate that preventive measures must be maintained throughout the Retreat transition period. Failing to do so would initiate a high-risk transition phase.
The strategies that focus on Accommodate (in combination with Prevention), by allocating new developments outside the flood zone and building codes, hardly reduce the annual risk but hold significant social or technical costs.
Localized Retreat to Support Flood Prevention (storage of water, nature-based solutions, integration in urban planning), as part of a Prevention strategy which requires more room, can be justified from a risk management perspective and integration with other challenges.
If protective infrastructure is not properly maintained, the consequences for the financial sector could be severe, due to increased capital requirements and elevated exposure to risk. This could lead to a withdrawal of financial actors, such as banks and insurance companies, and render insurance coverage for investments virtually unattainable.
It is recommended to conduct further research into the interaction between realistic long-term climate adaptation strategies based on Prevention in combination with local accommodation, insurability, investment conditions and the social impact. The method in this paper can be used for a first assessment to reduce the number of potential strategies for more detailed analyses. Additionally, it is recommended to explore, from a risk-based perspective, where spatial measures can effectively contribute to risk reduction, and how the associated land use can be aligned with other societal objectives and, for example nature development. Finally, greater insight is needed into how financial arrangements, such as pricing, requirements to obtain a loan or insurance, and permits for reconstruction, can support current risk management efforts and risk awareness, through improved coordination between government, the financial sector, citizens, and businesses.
Funding
This research received no external funding.
Data Availability Statement
The original contributions presented in this study are included in the article. Further inquiries can be directed to the corresponding author.
Conflicts of Interest
Author B. Kolen was employed by the company HKV Lijn in Water BV.
References
- Hoogendoorn, R. Key Figures on Population and Surface Area of Flood-Prone Areas in the Netherlands Protected by the Primary Flood Defence System; Deltares: Delft, The Netherlands, 2023. (In Dutch) [Google Scholar]
- IPCC. Climate Change 2022: Impacts, Adaptation and Vulnerability. Contribution of Working Group II to the Sixth Assessment Report of the Intergovernmental Panel on Climate Change; Cambridge University Press: Cambridge, UK, 2022. [Google Scholar]
- Royal Dutch Meteorological Institute (KNMI). KNMI Klimaatscenario’s voor Nederland; KNMI: De Bilt, The Netherlands, 2023. [Google Scholar]
- Ministry of Infrastructure and Water Management IenW. How Can the Netherlands Cope with Sea-Level Rise? Interim Report; Knowledge Programme on Sea-Level Rise: The Hague, The Netherlands, 2023. [Google Scholar]
- Friocourt, Y.; Blaas, M.; Bonte, M.; Vos, R.; Slomp, R.; Wilmink, R.; Lodder, Q.; Brakenhoff, L.; van Gool, S. The Impact of Extreme Sea Level Rise on the National Strategies for Flood Protection and Freshwater in the Netherlands. Water 2025, 17, 919. [Google Scholar] [CrossRef]
- van Alphen, J.; van der Biezen, S.; Bouw, M.; Hekman, A.; Kolen, B.; Steijn, R.; Zanting, H.A. Room for Sea-Level Rise: Conceptual Perspectives to Keep the Netherlands Safe and Livable in the Long Term as Sea Level Rises. Water 2025, 17, 437. [Google Scholar] [CrossRef]
- van Ginkel, K.; Rijken, B.; Hoogvliet, M.; van Veggel, W.; Botzen, W.J.W.; Filatova, T. How an Economic and Financial Perspective Could Guide Transformational Adaptation to Sea Level Rise. NPJ Clim. Action 2025, 4, 89. [Google Scholar] [CrossRef] [PubMed]
- European Central Bank ECB. Guide on Climate-Related and Environmental Risks Supervisory Expectations Relating to Risk Management and Disclosure; ECB: Frankfurt am Main, Germany, 2020. [Google Scholar]
- European Central Bank ECB. 2022 Climate Risk Stress Test; ECB: Frankfurt am Main, Germany, 2022. [Google Scholar]
- European Union EU. Directive (EU) 2022/2464 of the European Parliament and of the Council of 14 December 2022 Amending Regulation (EU) No 537/2014, Directive 2004/109/EC, Directive 2006/43/EC and Directive 2013/34/EU, as Regards Corporate Sustainability Reporting; EU: Strasbourg, France, 2022. [Google Scholar]
- European Union EU. Regulation (EU) 2024/3005 of the European Parliament and of the Council of 27 November 2024 on the Transparency and Integrity of Environmental, Social and Governance (ESG) Rating Activities, and Amending Regulations (EU) 2019/2088 and (EU) 2023/2859; EU: Strasbourg, France, 2024. [Google Scholar]
- European Insurance and Occupational Pensions Authority EIOPA. Delegated Regulation (EU) 2015/35 2015; European Insurance and Occupational Pensions Authority EIOPA: Frankfurt am Main, Germany, 2015.
- IPCC. Climate Change. The 1990 and 1992 IPCC Assessments; Printed in Canada; IPCC: Geneva, Switzerland, 1992. [Google Scholar]
- Van Alphen, J.; Haasnoot, M.; Diermanse, F. Uncertain accelerated sea-level rise, potential consequences and adaptive strategies in The Netherlands. Water 2022, 14, 1527. [Google Scholar] [CrossRef]
- Haasnoot, M.; Diermanse, F.; Kwadijk, J.; de Winter, R.; Winter, G. Strategieën voor Adaptatie aan Hoge en Versnelde Zeespiegelstijging; Deltares: Delft, The Netherlands, 2019. [Google Scholar]
- ENW. Fundamentals of Flood Protection; Ministry of Infrastructure and the Environment: The Hague, The Netherlands, 2017. [Google Scholar]
- EUR-Lex. Precautionary Principle; European Union: Brussels, Belgium, 2021; Available online: https://eur-lex.europa.eu/legal-content/EN/ALL/?uri=LEGISSUM:precautionary_principle (accessed on 8 July 2025).
- VenW. National Water Plan; Ministry of Transport Public Works and Water Management: The Hague, The Netherlands, 2009. [Google Scholar]
- Lopez, J.A. The Multiple Lines of Defense Strategy to Sustain Coastal Louisiana. J. Coast. Res. 2009, 10054, 186–197. [Google Scholar] [CrossRef]
- FBC. Lower Fraser Communities at Risk from Fraser River Flooding; Fraser Basin Council: Vancouver, BC, Canada, 2008. [Google Scholar]
- Kraan, C.; Haasnoot, M.; Mach, K.J. Expert perspectives on living with water as climate adaptation in the Netherlands. Environ. Res. Clim. 2025, 4, 015009. [Google Scholar] [CrossRef]
- Zanting, H.A.; Bouw, M. Oplossingsrichting ‘Meebewegen’ Verkennend Onderzoek voor Het Kennisprogramma Zeespiegelstijging; Knowledge Programme on Sea-Level Rise: The Hague, The Netherlands, 2023. [Google Scholar]
- Kind, J. Economically efficient flood protection standards for The Netherlands. J. Flood Risk Manag. 2014, 7, 103–117. [Google Scholar] [CrossRef]
- RVO. Sectorstudie Duurzame Gebouwen en Openbare Ruimte; Rijkdienst voor Ondernemend Nederland: The Hague, The Netherlands, 2024. [Google Scholar]
- RVO. Hernieuwbare Energie Bij Ingrijpende Renovatie; Rijkdienst voor Ondernemend Nederland: The Hague, The Netherlands, 2021. [Google Scholar]
- HV. Woningeigenaren Moeten Bij Een Ingrijpende Renovatie Verplicht Verduurzamen; HV: Groesbeek, The Netherlands, 2025. [Google Scholar]
- Centraal Bureau Statistiek CBS. 8 Miljoen Woningen in Nederland. 2021. Available online: https://www.cbs.nl/nl-nl/nieuws/2021/31/8-miljoen-woningen-in-nederland (accessed on 12 February 2025).
- De Bruijn, K.; Wagenaar, D.; Slager, K.; de Bel, M.; Burzel, A. Updated and Improved Method for Flood Damage Assessment: SSM2015 (Version 2); Deltares: Delft, The Netherlands, 2015. [Google Scholar]
- VEH. Woningmarkt in Actuele Cijfers; Vereniging Eigen Huis: Ameresfoort, The Netherlands, 2024; Available online: https://www.eigenhuis.nl/huis-kopen/woningmarkt (accessed on 13 February 2025).
- Stern. The Economics of Climate Change: The Stern Review; Cambridge University Press: Cambridge, UK; New York, NY, USA, 2007. [Google Scholar]
- MinFin. Rapport Werkgroep Discontovoet 2020; Ministerie van Financiën: The Hague, The Netherlands, 2020. [Google Scholar]
- Nordhaus, W.D. A Review of the Stern Review on the Economics of Climate Change. J. Econ. Lit. 2007, 45, 686–702. [Google Scholar] [CrossRef]
- CBS. Statline; Centraal Bureau Statistiek: The Hague, The Netherlands, 2025; Available online: https://opendata.cbs.nl/StatLine/#/CBS/nl/ (accessed on 8 July 2025).
- Galluccio, G.; Hinkel, J.; Fiorini Beckhauser, E.; Bisaro, A.; Biancardi Aleu, R.; Campostrini, P.; Casas, M.F.; Espin, O.; Vafeidis, A.T. Sea Level Rise in Europe: Adaptation Measures and Decision-Making Principles. In Sea Level Rise in Europe: 1st Assessment Report of the Knowledge Hub on Sea Level Rise (SLRE1); van den Hurk, B., Pinardi, N., Kiefer, T., Larkin, K., Manderscheid, P., Richter, K., Eds.; Copernicus Publications, State Planet, 2024; Available online: https://sp.copernicus.org/articles/3-slre1/6/2024/ (accessed on 7 December 2025).
- Haasnoot, M.; Di Fant, V.; Kwakkel, J.; Lawrence, J. Lessons from a decade of adaptive pathways studies for climate adaptation. Glob. Environ. Chang. 2024, 88, 102907. [Google Scholar] [CrossRef]
- Van Alphen, J. The Japanese Delta Works; Delta Programma Commissionairs Staff: The Hague, The Netherlands, 2024. [Google Scholar]
- Cardona, O.D.; Van Aalst, M.K.; Birkmann, J.; Fordham, M.; Mc Gregor, G.; Rosa, P.; Pulwarty, R.S.; Schipper, E.L.F.; Sinh, B.T.; Décamps, H. Determinants of Risk: Exposure and Vulnerability. In Managing the Risks of Extreme Events and Disasters to Advance Climate Change Adaptation. A Special Report of Working Groups I and II of the Intergovernmental Panel on Climate Change (IPCC); Cambridge University Press: Cambridge, UK; New York, NY, USA, 2012; pp. 65–108. [Google Scholar]
- Caldecot, B.; Harnett, E.; Cojoiany, T.; Kok, I.; Pfeiffer, A. Stranded Assets: A Climate Risk Challenge; Inter-American Development Bank: Washington, DC, USA, 2016. [Google Scholar]
- O’Donnell, T. Managed retreat and planned retreat: A systematic literature review. Philos. Trans. R. Soc. B Biol. Sci. 2022, 377, 20210129. [Google Scholar] [CrossRef] [PubMed]
- Eichholtz, P.; Kok, N.; Weenink, P. Overstromingsrisico Beïnvloedt Woningwaarde, Maar Impact Is Beperkt. ESB. 2025. Available online: https://esb.nu/overstromingsrisico-beinvloedt-woningwaarde-maar-impact-is-beperkt/ (accessed on 20 May 2025).
- Niu, D.; Eichholtz, P.; Kok, N. Asymmetric information provision and flood risk salience. J. Hous. Econ. 2025, 68, 102060. [Google Scholar] [CrossRef]
- Van Reeken, J.; Phlippen, S. Is Flood Risk Already Affecting House Prices? Lessons Learned from an Impact Assessment Study in the Netherlands; ABN: Amsterdam, The Netherlands, 2022. [Google Scholar]
- OECD. Water Governance in the Netherlands: Fit for the Future? OECD Studies on Water; OECD Publishing: Paris, France, 2014. [Google Scholar]
- H2O. Peiling HWBP: Steeds Meer Nederlanders Bang voor Overstroming. H2O Actueel, 6 February 2023. [Google Scholar]
- Mutlu, A.; Roy, D.; Filatova, T. Capitalized value of evolving flood risks discount and nature-based solution premiums on property prices. Ecol. Econ. 2023, 205, 107682. [Google Scholar] [CrossRef]
- UVW. Waterschapsbelastingen 2025 Voorwoord Het Hoe en Waarom; Unie van Waterschappen: The Hague, The Netherlands, 2025. [Google Scholar]
- Rekenkamer. Coronarekening Mei 2023 (Editie 8); The Hague, The Netherlands, 2023; Available online: https://www.rekenkamer.nl/onderwerpen/corona/coronarekening/conronarekening-mei-2023 (accessed on 8 July 2025).
- MinFin. Rijksbegroting; Ministerie van Financiën: The Hague, The Netherlands, 2023; Available online: https://www.rijksfinancien.nl/financieel-jaarverslag/2023/2793520#:~:text=De%20EMU%2Dschuld%20in%202023%20bedroeg%20480%2C7%20miljard%20euro,de%20ontwikkeling%20van%20de%20schuld.&text=In%202023%20bleef%20de%20Nederlandse,weergegeven%20in%20figuur%201.3.2 (accessed on 8 July 2025).
Disclaimer/Publisher’s Note: The statements, opinions and data contained in all publications are solely those of the individual author(s) and contributor(s) and not of MDPI and/or the editor(s). MDPI and/or the editor(s) disclaim responsibility for any injury to people or property resulting from any ideas, methods, instructions or products referred to in the content. |
© 2025 by the author. Licensee MDPI, Basel, Switzerland. This article is an open access article distributed under the terms and conditions of the Creative Commons Attribution (CC BY) license (https://creativecommons.org/licenses/by/4.0/).