Abstract
The escalating sea-level rise associated with global climate change increasingly threatens estuary regions with salinity intrusion, particularly in complex river network systems where both ecological integrity and socio-economic development are at risk. While tracer techniques are commonly employed in salinity intrusion research, numerical models capable of quantifying multi-source contributions and tracing intrusion pathways in such complex settings remain underdeveloped. This study introduces a multi-source tracer-aided modeling approach to analyze and mitigate salinity intrusion, enabling quantification of the relative contributions of various salinity sources at targeted locations. Using the Telemac-2D hydrodynamic model, we simulated salinity intrusion in the Xinbu Island estuary, Hainan Province, China. A multi-source particle tracer method was implemented to delineate intrusion pathways, leading to the formulation of targeted control strategies based on simulation outcomes. Results demonstrate that measures informed by source proportion and intrusion path analysis are highly effective: under discharge conditions of 181 m3/s and 296 m3/s, salinity levels in the northern river network were significantly reduced. This study provides a valuable framework for addressing similar salinity challenges in vulnerable estuarine environments worldwide.
1. Introduction
Estuary areas, especially those with complex river networks, serve as vital hubs for ecological diversity and economic activities where 70% of the world’s population dwells [1]. Nevertheless, their unique hydrological environment creates convergence zones where salinity intrusion intensifies disproportionately compared to open coasts [2]. Salinity intrusion has become a major global threat to the availability of freshwater resources, particularly in densely populated river delta regions. Under salinity intrusion conditions, the pollution of drinking water sources and agricultural irrigation water poses a severe threat to human health and food security. Salt stress significantly impairs seed germination by compromising water uptake capacity and inducing ionic imbalances within seeds, ultimately leading to reduced crop yields and compromised agricultural productivity [3,4]. Concurrently, tidal dynamics alter aquifer salinity distributions around estuaries through density-driven processes, resulting in the degradation of freshwater wetlands and species migration, thereby exerting substantial pressure on fragile estuarine ecosystems [5,6,7]. These combined impacts restrict the sustainable development of estuaries with complex river networks. At present, many scholars have studied salinity intrusion and obtained a wealth of research achievements [8]. The main research methods are statistical analysis, numerical simulation, and so on. Arslan et al. [9] sampled and performed chemical analysis of groundwater wells along the coast of the Bafra Plain, and found that excessive pumping led to seawater intrusion and alkaline soil with high pH values. Becker et al. [10] analyzed the main physical mechanisms affecting the salinity structure of the Cape Fear estuary based on observational hydrological and hydrodynamic data and found that the tide level and tidal range significantly affect salinity structure. Parsa et al. [11] proposed an empirical model based on scaling analysis of governing equations to quantify salt intrusion length, offering a data-efficient alternative to complex numerical simulations. By using a three-dimensional EFDC model, Jeong et al. [12] quantified salinity intrusion distances up to 50.72 km in the Geum River estuary under drought conditions. Abdalla [13] introduced ionic ratios as a main research object to assess salinity intrusion and to identify salinity sources in the Jazan coastal aquifer. Tran Anh et al. [14] used Mike 1D and 2D hydrodynamic models to simulate the future flow and salinity intrusion of the Hau River in Vietnam’s Mekong Delta. He et al. [15] used a 3D hydrodynamics–salinity–tracer numerical model to study the Wanquan River estuary in China, analyzing the effects of runoff and sea-level changes under various scenarios and comparing their impacts on the estuary. They found that runoff was related to relevant indicators, while sea-level changes were linearly related, with runoff changes having a more significant impact. However, in intricate river networks with multiple estuaries, salinity sources are inherently mixed. Traditional single-tracer methods can only reflect the overall salinity distribution of simple river channels. In complex water networks, multi-channel hydrodynamic interactions and tidal phase differences make it impossible to identify and quantify the specific contributions of individual estuaries under specific tidal and flow conditions. Therefore, while substantial advances exist in salinity intrusion research, two critical gaps persist: (1) under the influence of multiple sources on the estuary, it is difficult to determine the source of salinity intrusion. (2) Quantitative analysis in highly complex river networks remains limited. In this paper, we develop a novel multi-source tracer-aided modeling approach that surpasses conventional 2D salinity models. By adding unique tracers at each estuary, our model not only simulates the bulk salinity distribution but, more importantly, determines and quantifies the contribution ratio of each salinity source at any location within the complex network. This capability addresses a critical gap in existing models by enabling precise identification of dominant intrusion pathways, which is essential for formulating targeted control strategies.
In the field of salinity intrusion control, the academic community has also achieved a wealth of results. Xu et al. [16] studied the salinity intrusion of the freshwater estuary of Humen estuary by using analytical models, predicting the salinity intrusion length of the estuary. Ijaz et al. [17] applied a hydrodynamic model and a water quality model to analyze the propagation of tides from the Arabian Sea into the Indus River and its subsequent effects on the longitudinal salinity distribution, indicating that the synergistic effect of optimizing fresh water quantity and estuary modification is one of the practical solutions to control salinity intrusion. Javadi et al. [18] presented the simulation optimization algorithm to study the efficiency of salinity intrusion control under different management schemes. And a novel method to control salinity intrusion of coastal aquifers was proposed. Brockway et al. [19] analyzed the salinity intrusion of a funnel estuary in Incomati, Mozambique, obtaining the minimum river discharge that could meet the salinity intrusion’s pollution to water quality. Although scholars have many different views on the prevention and control measures of salinity intrusion, they generally focus on a single estuary management strategy. In fact, it is often difficult to achieve the expected prevention and control effectiveness under the realistic conditions of multi-tidal river reaches, multiple estuary distribution, and financial constraints. In view of this, it is essential to take a more comprehensive and refined approach in the formulation of coping strategies. This study is devoted to proposing a novel salinity intrusion control method by flow field change analysis. Through in-depth analysis of the complex changes in the flow field in different tidal intervals, the key regions that have a decisive influence on the salinity intrusion process are precisely located. Then, controlling strategies are optimized through targeted flow field modification at identified critical sections, enabling maximum salinity suppression with minimal intervention. This method not only goes beyond the limitations of traditional single-control measures but also explores a more efficient and economical strategy for salinity intrusion control. Under the complex and changeable hydrological environment, it provides a new perspective and reference for research and practice in related fields. This study is devoted to proposing a novel approach for saltwater intrusion analysis and control in complex river networks based on a multi-source tracer-aided modeling simulation. The organizational structure of this paper is as follows. The second section introduces the research area and data sources. The third section presents the methods framework, including the tracer-based model for simulating salinity intrusion, the simulation of salinity intrusion process based on traceability analysis, and the development of a salinity control strategy based on intrusion path identification. In the fourth section, the framework is applied to the research area, and the corresponding calculation results are obtained. Finally, it provides a quantitative discussion of the calculated results and compares the simulated results of salinity intrusion after the treatment.
2. Study Area and Data Sources
2.1. Study Area
Xinbu Island is located to the northeast of Haikou City, a delta plain formed by the estuaries of the Nandu River, Hainan province, China. The island slopes from south to north, with the highest elevation in the south reaching up to 4.8 m, generally ranging from 3.5 to 4.0 m. The northern coastal areas belong to the alluvial plain of the Nandu River delta, characterized by low and flat terrain with numerous shallow sandbars. The average elevation of the sandbars along the coastline is approximately 2 m, often subjected to floods from the Nandu River and storm surges. The original protective embankments have lost their functionality in many areas, with several segments completely eroded. Notably, the river network depicted in Figure 1 reflects conceptual planning-phase configurations. The island features a complex network of intersecting waterways, creating an intricate water system. There are a total of four outlets to the sea, including two natural river estuaries (the Nandu River and Henggou River) and two artificial river estuaries. In order to facilitate the description of the internal river, the Xinbu Island inland river network is divided into three parts. The northern part of Xinbu Island is grouped into the north river network, several internal river networks near the Henggou River are grouped into Xinbu Island domain 1, and several river networks near the Nandu River are grouped into Xinbu Island domain 2. The specific division results are shown in Figure 1. Xinbu Island was selected as the study area due to its representative complex river network with multiple estuaries, which presents a typical and challenging scenario for investigating multi-source salinity intrusion. Furthermore, its status as a developing area near Haikou City with existing salinity intrusion risks underscores the practical significance of this research for guiding future planning and protection efforts.
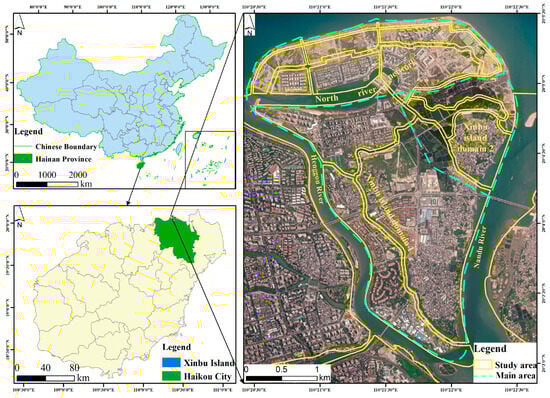
Figure 1.
Overview of the study area, divided into three areas like North river network, Xinbu Island domain 1 and Xinbu Island domain 2.
2.2. Data Sources
The basic data required for building the model in the study area are provided by China Communications Water Transportation Planning and Design Institute Hainan Co., Ltd., Haikou, Hainan Province, China. It mainly includes DEM data in the study area. The internal river channels in the island are artificial, with a depth of −2 m. Tidal data is from Xiuying Port in December 2020 in Haikou, Hainan. The maximum tide level on the 17th is 2.65 m, while the minimum tide level on the 16th is 0.07 m. The maximum tidal range is 2.55 m on the 15th. Since the maximum tide level and tidal range can reflect the maximum intrusion level, the tidal data of the 15th, 16th, and 17th are utilized. The Nandu River serves as the sole inflow condition in the study area, with a measured average flow of 181 m3/s over several years. The measured minimum flow is 1.40 m3/s, with an observed annual average maximum flow of 296 m3/s [20]. The basic data is shown in Table 1.

Table 1.
Basic data.
3. Method
A methodology for the analysis and control of salinity intrusion in complex river networks with multiple estuaries is presented in this work. The framework is shown in Figure 2. Firstly, a Telemac-2D hydrodynamics model was constructed, coupling the tracer module, where different tracers were set for different estuaries. Secondly, the concentration information of multi-source tracers was extracted using autonomous programming technology, obtaining the characteristic distribution of these tracers in spatio-temporal dimensions. Thirdly, through the in-depth analysis of the salinity intrusion contribution ratio of each estuary and the local flow field, a series of targeted control strategies were formulated. Finally, the implementation effect of these strategies was strictly evaluated and analyzed to ensure that the proposed programs were both scientific and practical, providing strong support for the effective management of salinity intrusion.
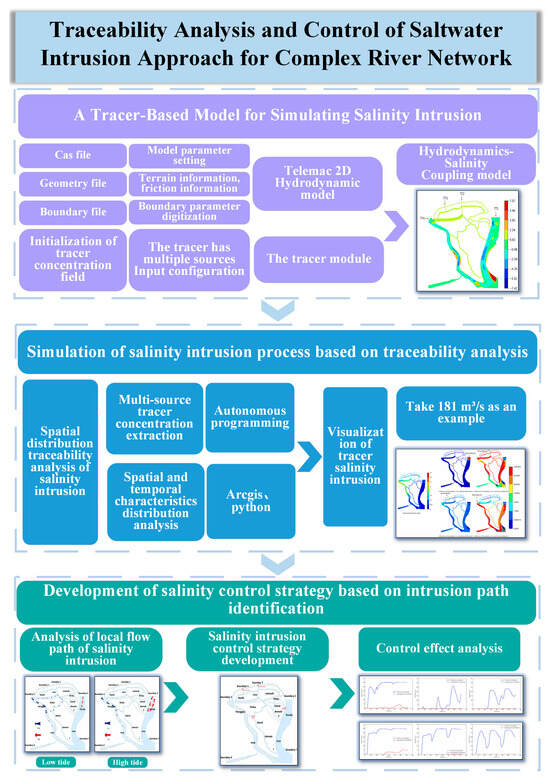
Figure 2.
Research flowchart.
3.1. Tracer-Based Salinity Intrusion Simulation Model
Telemac (Vision V8P4) is a fluid software developed by EDF’s National Hydraulic and Environmental Laboratory. Telemac-2D is applied for two-dimensional free-flow simulation, which outputs water depth, velocity, tracer, and other information for each grid point. Transient and steady state conditions can be simulated by using finite element method or finite volume method with triangular element to solve Saint-Venant equation. This study uses the hydrodynamic module and particle tracer module, with salinity effects activated. The Telemac-2D code simultaneously solves the following three fluid dynamics equations [21]:
where h is the water depth (m), Z is the free surface elevation (m), u and v are the velocity components (m/s), t is the time (s), Sh is the source or sink of fluid, x and y are the horizontal space coordinates (m), ve is the coefficient of viscosity, and Fx and Fy are the bottom bed friction coefficients. div represents the divergence calculation symbol and ∇v represents the symbol of the gradient operation.
The coupling simulation mechanism of water and tracer is realized by solving the tracer mass conservation and water balance equations simultaneously. The mass balance equation is as follows [22]:
where ρs represents the tracer mass concentration (mg/L), S represents the storage capacity of grid node (L), Ij and Ok is the flow rate of inflow mode j (side inflow) and outflow mode k (side outflow) (L s), ρIj represents the tracer mass concentration in the flow of inflow mode j (mg/L), and ρOk represents the tracer mass concentration in the flow of outflow mode k (mg/L).
The quality of the tracer is determined by the amount of water in the minimum calculation cell controlled by the model, and the quality of the tracer. The equation for calculating the quality of the region tracer of concern is as follows [22]:
where ρ represents the tracer mass concentration (mg/L), S represents the area of the minimum calculation unit in the surface water power system, h represents the simulated water depth (m), and k represents the calculation cell type containing tracers of the same type.
The flow of tracer is synchronized with the runoff process, and the accumulated mass of tracer is proportional to the amount of water. According to the principle of conservation of mass, the salinity ratio of different estuaries at different times can be calculated [22]:
where represents the water quantity of estuary i flowing into the channel at time t (m3), Vt represents the water volume of the study area at time t and is the sum of the water flow into the river at time t of all estuaries (m3), represents the tracer mass from estuary i in the study area at time t (g), and n indicates the number of source estuaries.
3.2. Salinity Intrusion Process Exploration Using Multi-Source Tracer Analysis
In order to further explore and accurately predict salinity intrusion in estuary areas, multi-source tracer analysis was introduced here. The results from the tracer-based salinity intrusion simulation model were explored by visual analysis of salinity distribution, using Python API (Vision 3.12) and Arcgis (Vision 10.8) software. The distribution proportions of different tracers in various river sections of the complex river network were statistically analyzed, obtaining the sources of salinity intrusion in each section. The process exploration results were able to provide data support for the subsequent control of salinity intrusion.
3.3. Salinity Control Measures Arrangement Based on Intrusion Path Recognition
In the estuary area, the salinity movement and the direction of the flow field were similar but different, and the distribution of salinity did not directly reflect its movement trend. In order to deeply understand the mechanism of salinity intrusion and explore effective control measures, this study combined the ebb and flow conditions under different working conditions, and simulated salinity intrusion and flow field distribution by constructing a Telemac-2D model with an integrated tracer module. Firstly, the salinity intrusion and flow field distribution cloud maps corresponding to the ebb and flow were drawn according to the simulation results. Visualization of salinity and flow fields under varying conditions enabled precise identification of dominant estuaries controlling salt intrusion. Concurrently, this approach pinpointed critical river network channels that accelerated salinity propagation. Then, by combining the above analysis, building facilities such as gates and flap gates were set up at the key locations, and the simulation process was repeated. By comparing the simulation results of buildings before and after installation, the rationality of these buildings and the inhibition effect on salinity intrusion were analyzed.
4. Results
4.1. Model Building and Validation
4.1.1. Boundary and Initial Conditions
The Surface Water Modeling System (SMS, Vision 11.2) is utilized to generate triangle meshes. The modeling scope for this project focuses solely on the surrounding marine areas and internal water network of Xinbu Island. The grid scale is set at 30 m, resulting in a total of 98,998 grid nodes and 186,887 triangular meshes. In order to ensure a high-quality grid, the angles of the triangular grids should fall within the range of 30–100 degrees, and the grid is locally encrypted (Figure 3). The time step is set to 0.1 s.
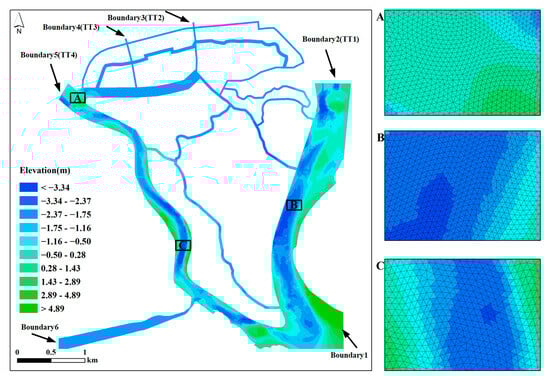
Figure 3.
Channel topography and grid data. (A: A is regional grid details; B: B is regional grid details; C: C is regional grid details).
In the study area, one inflow boundary and five outflow boundaries are set. In the initial condition, the open boundary 1 is set as the inflow condition of the specified flow, the tidal data is used as the outflow condition for the boundaries 2 to 5, and the fixed water level is maintained at the boundary 6. The initial water level of the model is set to 2 m. According to experience, the friction coefficient of natural rivers is set to 0.04 (range 0.03–0.25), and the friction coefficient of artificial rivers is set to 0.017 (range 0.017–0.16). After a 3 h simulation run, the resulting file is used for subsequent hot startup.
The simulation includes three working conditions: the upstream flow was measured as the minimum flow of 1.4 m3/s, the average annual flow of 181 m3/s, and the average annual flow of 296 m3/s. The downstream tidal level boundary was measured on 15–17 December 2020. The tracer concentration value of 30 mg/L assigned to each source (Boundaries 2–5) was selected as a conservative, representative value. This value is high enough to be clearly distinguishable from background levels (effectively zero in the initial conditions) and to minimize the relative impact of numerical diffusion, yet it is low enough to avoid significantly influencing the water density and thus the baroclinic flow dynamics, ensuring that the tracers act as passive scalars. All tracers within the computational domain were initialized at a concentration of 0 mg/L. Tracers were introduced at the open boundaries 2–5 as continuous sources synchronized with the tidal hydrodynamics. The concentration was held constant at 30 mg/L for incoming flow during flood tide. For outgoing flow during ebb tide, a zero-gradient boundary condition was applied, allowing tracers to freely advect and diffuse out of the domain without reflection. To ensure numerical stability and minimize artificial numerical diffusion, the model time step (1 s) was chosen to satisfy the Courant–Friedrichs–Lewy (CFL) condition (CFL < 1) throughout the domain, ensuring the stability of the explicit scheme used for advection. The working condition setting details are shown in Table 2.
Table 2.
Working condition settings.
4.1.2. Model Validation
The validation is based on laboratory-scale dam-break data due to the lack of field measurements. Morris’ experimental data [23] and Chang’s SHP simulation data [24] are used to verify the hydrodynamic module of the model.
As shown in Figure 4, the experimental setup consists of a giant channel that is 38 m long and 1.75 m wide, an aquifer, a gate, and a symmetrical triangle that is 6 m long. The initial state of the model is that the water depth at the left of the upstream is 0.75 m, the water depth at the end of the downstream rectangular channel is 0.15 m, and the water depth in other areas of the model is 0 m. The Manning roughness coefficient of the channel bed is 0.0125. The gate falls at 10 m per second. The time step of the model is 0.001 s, and the simulation time is 40 s.
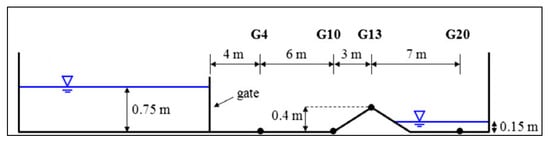
Figure 4.
Layout of dam-break flows in a straight channel (the CADAM dam-break experiment).
The water depth process line of G4, G10, G13, and G20 is shown in Figure 5. Telemac-2D represents the result of the Telemac-2D model, ‘TEST’ is the experimental result of Morris, and SHP is the simulation result of Chang. The simulation results of SHP agree with the experimental data. The simulation data of Telemac-2D is also in good agreement with the experimental results. The margin of error is less than 10% at G4, G10, and G13, and about 30% at G20. In addition, Telemac-2D is a two-dimensional numerical simulation software, and the hydrodynamic model of Telemac-2D is relatively reliable.
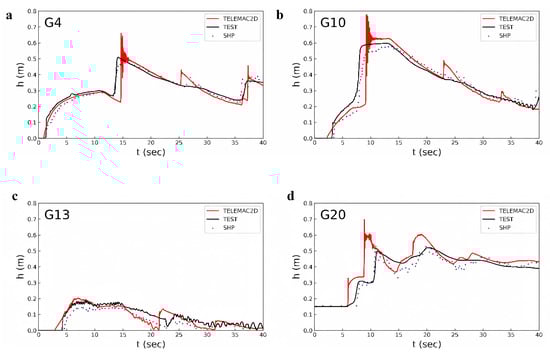
Figure 5.
Comparisons of the measured and simulated water depths at selected gauges. ((a): calibration of G4 position; (b): calibration of G10 position; (c): calibration of G13 position; (d): calibration of G20 position).
Telemac-2D software is widely used by scholars in hydraulic numerical simulation. A 2D numerical model is set up to study the hydrodynamics and tracer transport processes under different weather conditions, considering tide, mean wind, and maximum wind [25]. Moulinec et al. [26] obtained the average salinity evolution of a Lagoon through salinity simulations of Berre Lagoon. Compared with the measured data, the simulation results are good, indicating the Telemac-2D model is reliable for the salinity simulation.
4.2. Multi-Source Salinity Intrusion Results
The results of salinity intrusion under different inflow conditions were simulated based on the tracer-based salinity intrusion simulation model.
Figure 6, Figure 7 and Figure 8 show the salinity intrusion of different estuaries under different flow rates and different tide levels, where Figure a shows the total salinity ratio (%), and Figure b to Figure e, respectively, represent the distribution of salinity intrusion at their respective boundaries (%).
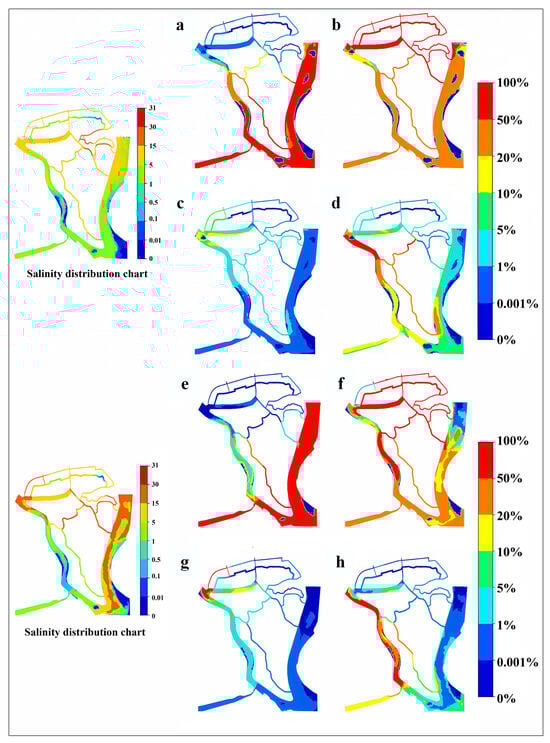
Figure 6.
Distribution of salinity and sources with 1.4 m3/s ((a–d) are the high-level distribution of tracer concentrations for TT1, TT2, TT3, and TT4 respectively; (e–h) are the low-level distribution of tracer concentrations for TT1, TT2, TT3, and TT4 respectively).
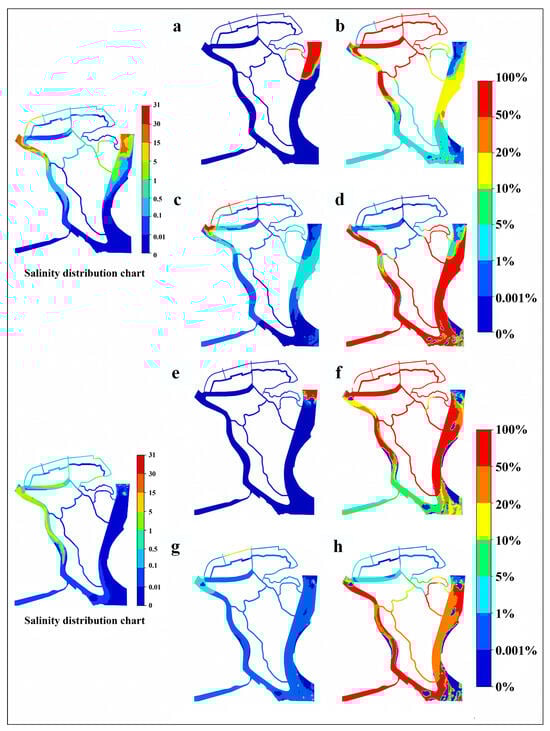
Figure 7.
Distribution of salinity and sources with 181 m3/s ((a–d) are the high-level distribution of tracer concentrations for TT1, TT2, TT3, and TT4 respectively; (e–h) are the low-level distribution of tracer concentrations for TT1, TT2, TT3, and TT4 respectively).
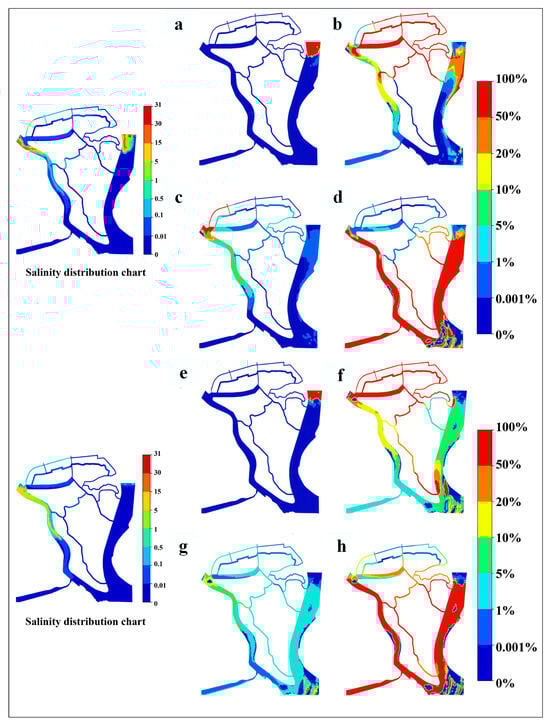
Figure 8.
Distribution of salinity and sources with 296 m3/s ((a–d) are the high-level distribution of tracer concentrations for TT1, TT2, TT3, and TT4 respectively; (e–h) are the low-level distribution of tracer concentrations for TT1, TT2, TT3, and TT4 respectively).
Figure 6 shows the distribution of salinity intrusion at high tide and low tide under 1.4 m3/s inflow upstream condition. At high tide, salinity invades almost the whole river network. The salinity intrusion is the most serious in the north river network, where the concentration reaches 15–30%. The Henggou River and Nandu River also reach 5–15%. The salinity ratios of the four open boundaries are also different. Boundary 2 is located at the estuary of the Nandu River, which affects the whole Nandu River, most of the Henggou River, as well as Xinbu Island domain 1, with a combined salinity contribution rate accounting for more than 50%. Boundary 3 has an impact on the north river network, where the salinity contribution rate is above 50%, and other areas are also between 20% and 50%. Boundary 4 exhibits negligible influence. The influence of boundary 5 is also limited, only spreading to Henggou River and the main water system of Xinbu Island domain 1 and parts of Nandu River. At low tide, the influence of salinity is more obvious, and most of the whole river network has traces of salinity, and the concentration is basically maintained above 5%. The salinity of boundary 2 completely invades the Nandu River and the upper reaches of Henggou River, the salinity contribution rate accounting for more than 50%. Boundary 3 has little effect on the river network of the island. The salinity contribution rate from boundary 4 in the estuary of Henggou River increases to 20–50%.
Figure 7 shows salinity intrusion distribution at high and low tide under 181 m3/s upstream flow. At high tide, salinity affects only the middle and lower Henggou River reaches and north river network, with concentrations of 0.1–5%. Boundary 2 exhibits influence confined to the Nandu River estuary (20–50% contribution). Boundary 3 impacts the entire network with 20–50% salinity contribution across all areas, while boundary 4 contributes minimally (below 1%). Boundary 5 dominates most regions (over 50% contribution) except the northern network. At low tide, salinity intrusion intensifies significantly in the Nandu River estuary, extending to Xinbu Island domain 2. Boundary 2 maintains over 50% contribution along the estuary, while boundary 3 shows reduced influence in the Nandu River estuary but consistently 20–50% elsewhere. Boundary 4 contributes 1–5% in Nandu’s middle reaches and 20–50% in Henggou’s estuary. Boundary 5 intensifies its influence (over 50% contribution) throughout both rivers.
Figure 8 shows salinity intrusion at high and low tide under 296 m3/s upstream flow. At high tide, the salinity intrusion reduces further: Henggou’s middle and lower reaches maintain 0.5–5% concentrations while Nandu estuary shows 5–15%. Boundary 2 influences only the Nandu estuary (over 50% contribution). Boundary 3 dominates the north river network (over 50% contribution), while contributing less than 20% in Henggou River and less than 50% in Nandu’s middle and lower reaches. Boundary 4 partially affects the north river network and Henggou’s middle and lower reaches (below 10% contribution). Boundary 5 impacts most areas (over 50% contribution) except the north river network, with pronounced influence in both rivers. At low tide, salinity is detectable only in Henggou’s middle and lower reaches (1–15%). Boundary 2 persists in the Nandu estuary (over 50%). Boundary 3 dominates the northern network (over 50%), influences Xinbu Island domain 1 and 2 (10–50%), and contributes less than 20% in the rivers. Boundary 4 maintains about 5% network-wide contribution, reaching 10% in Henggou’s middle and lower reaches. Boundary 5 remains the primary intrusion source (over 50% in main rivers, 20–50% in internal waterways).
The table below presents the statistical analysis of salinity contributions across different operating conditions (Table 3). The data clearly demonstrates that as upstream flow increases from 1.4 m3/s to 296 m3/s, the intrusion zones (contribution areas) of all tracer agents significantly shrink, reflecting runoff’s inhibitory effect on saline water intrusion. TT2 (Boundary 3) and TT4 (Boundary 5) exhibit notably higher contribution rates and influence ranges compared to TT1 and TT3, indicating these estuaries as primary salt intrusion sources. The marked variations in contribution rates for the same tracer across regions vividly illustrate the spatial differentiation characteristics of salt intrusion pathways in complex river networks.
Table 3.
Tracer Contribution Ranges at Key Locations Under Different Flow Conditions.
4.3. Results of Flow Field of Salinity Intrusion Channel
Since boundary 3 and boundary 4 are artificial estuaries, their channels are narrow and their discharge is low. In contrast, boundary 2 and boundary 5, as natural estuaries, have wider channels and larger discharge, which have a more significant impact on the propagation of salinity changes. Therefore, in this study, the main movement path and direction of salinity inflow at boundary 2 and boundary 5 are emphatically analyzed.
By visualizing the flow field of the two natural estuaries, it is not difficult to find that when the upstream flow is 1.4 m3/s, salinity can completely intrude into the upper reaches of Henggou River and Nandu River at the high tide level, and TT1 can even further spread to Xinbu Island domain 1. At low tide, it can also progress into Xinbu Island domain 2 and the north river network (Figure 9).
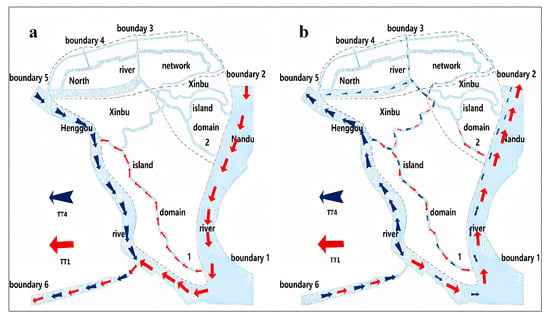
Figure 9.
Major paths of salinity intrusion with 1.4 m3/s ((a): high tide; (b): low tide).
When the upstream flow is 181 m3/s, it is found that the salinity cannot flow further upstream, and TT1 returns to the main river system of the island after being washed by the upstream flow, and the salinity is almost 0. TT4 is less affected by the upstream impact, and some salinity still spreads to the middle reaches of the Henggou River, and invades the north river network tributaries under the influence of the ebb tide (Figure 10).
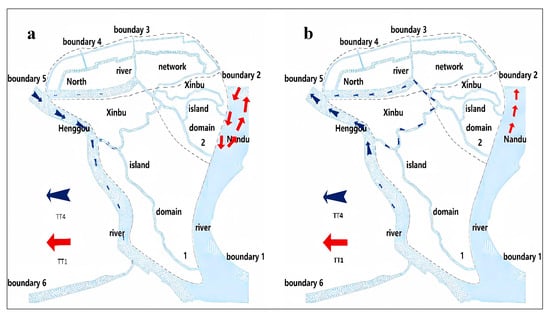
Figure 10.
Major paths of salinity intrusion with 181 m3/s ((a): high tide; (b): low tide).
In the case of 296 m3/s, the salinity evolution process is similar to that of 181 m3/s, and the upstream water has a greater influence on the salinity intrusion path (Figure 11).
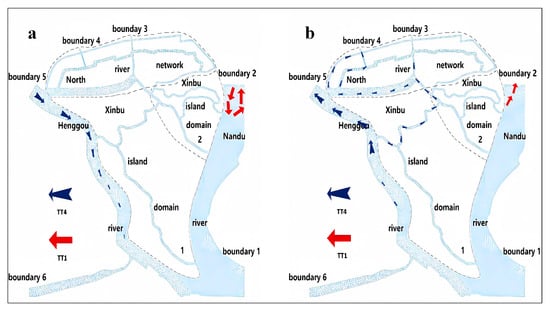
Figure 11.
Major paths of salinity intrusion with 296 m3/s ((a): high tide; (b): low tide).
4.4. Analysis of the Results of Measures Taken
In order to further obtain the salinity changes in the north river network, three locations were selected to study and analyze the salinity changes before and after the measures applied (Figure 12, Figure 13, Figure 14, Figure 15, Figure 16 and Figure 17). The exact locations are shown in Figure 18.
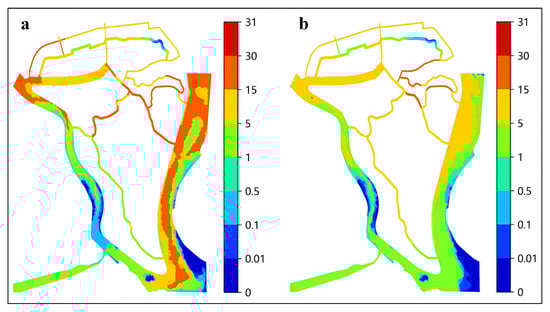
Figure 12.
Salinity distribution at 1.4 m3/s flow ((a): high tide; (b): low tide).
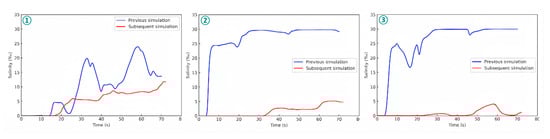
Figure 13.
The salinity concentration at the three locations changed under the flow rate of 1.4 m3/s (①, ②, and ③ represent the concentration changes before and after measures were applied at three different testing sites).
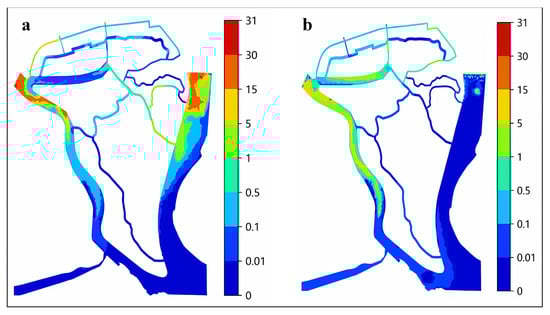
Figure 14.
Salinity distribution at 181 m3/s flow ((a): high tide; (b): low tide).
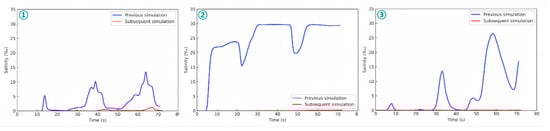
Figure 15.
The salinity concentration at the three locations changed under the flow rate of 181 m3/s (①, ②, and ③ represent the concentration changes before and after measures were applied at three different testing sites).
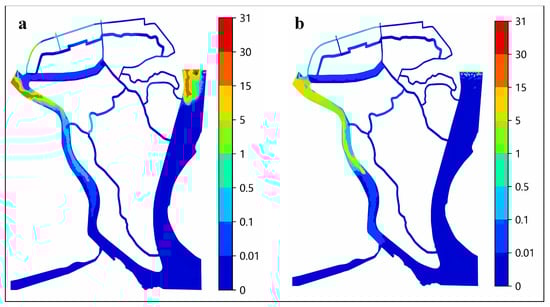
Figure 16.
Salinity distribution at 296 m3/s flow ((a): high tide; (b): low tide).
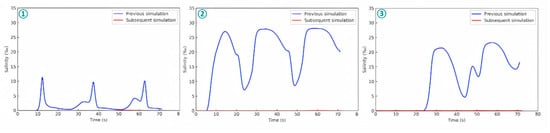
Figure 17.
The salinity concentration at the three locations changed under the flow rate of 296 m3/s (①, ②, and ③ represent the concentration changes before and after measures were applied at three different testing sites).
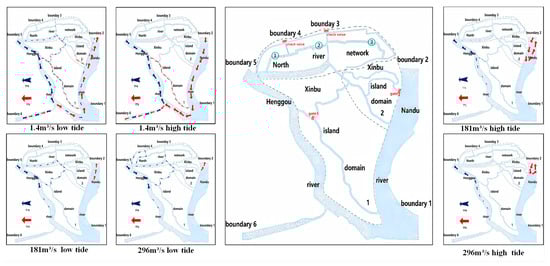
Figure 18.
Construction distribution (Positions ①, ②, and ③ represent the specific locations of three testing sites).
When the flow is 1.4 m3/s (Figure 12), significant salinity intrusion persists throughout both high and low tidal phases. The Nandu River maintains consistently elevated concentrations (5–30%), while the Henggou River estuary exhibits tidal variability: 15–30% during high tide and 5–15% at low tide. The salinity of the north river network is basically maintained at 1–15%. Spatial difference is evident on Xinbu Island, where Xinbu Island domain 2 experiences more severe intrusion (15–30%) compared to Xinbu Island domain 1 (1–15%). Implementation of control interventions at three monitoring points in the north river network demonstrates substantial reductions (Figure 13): Point 1 shows peak concentration reduction from 24% to 16% (8% decrease); Point 2 from 30% to 5% (25% decrease); and Point 3 from 30% to 4% (26% decrease).
When the flow is 181 m3/s (Figure 14), salinity concentrations decrease markedly in the Nandu River, the Henggou River, and Xinbu Island domain 1, falling below 0.1% at low tide. The north river network and Xinbu Island domain 2 show reduced salinity (0.1–5%). Estuary zones maintain 5–30% concentrations in the lower reaches of both rivers at high tide. After the application of the measures, the results analysis reveals further concentration reductions (Figure 15): Point 1 reaches a maximum of 3%, while Points 2 and 3 approach 0%, achieving reductions of 13% and 27%, respectively, from before applying measures. When the flow is 296 m3/s (Figure 16), salinity primarily concentrates within the natural estuaries. During high tide, concentrations reach 5–30% at both the Henggou River and Nandu River estuaries, while low tide maintains 5–15% at these locations. The main channel of the Nandu River becomes virtually salt-free (below 1%). Following intervention implementation (Figure 17), salinity concentrations at all monitoring points are reduced to 0%, with maximum concentration differences of 12% (Point 1), 27% (Point 2), and 23% (Point 3) compared to former conditions.
Table 4 presents the statistical analysis of salinity distribution and reduction at monitoring points under various operational conditions after implementing control measures. Across all flow rates, salinity levels at all three monitoring points showed significant decreases, demonstrating the universal effectiveness of the tracer-based control strategy. At low flow rates (1.4 m3/s), while absolute salinity values decreased markedly, complete elimination of salinity intrusion remained challenging (Point 1 maintained 16%). However, at higher flow rates (181 and 296 m3/s), the measures achieved complete desalination (0%). Points 2 and 3 exhibited optimal treatment efficacy across all conditions, particularly achieving 100% desalination rates at 181 m3/s and 296 m3/s, indicating these locations as critical control nodes.
Table 4.
Salinity reduction effects at monitoring points after implementing control measures.
5. Discussion
5.1. Location Analysis of Governance Measures
The rational deployment of flap gates in the estuary can significantly inhibit the salinity intrusion into the inland waters. Artificially constructed estuaries (boundaries 3 and 4) feature significantly narrower cross-sections and reduced discharge capacities compared to their natural counterparts (boundaries 2 and 5). These morphological constraints simplify hydrodynamic regimes while enabling cost-effective intervention. Based on the cost–benefit analysis and comprehensive consideration of the flow characteristics, flap gate deployment at boundaries 3 and 4 delivers the maximum salinity suppression relative to the infrastructure investment. Consequently, these engineered channels are prioritized as primary control locations.
Under a low-flow condition of 1.4 m3/s, the tracer from boundary 3 constituted over 50% of the salinity concentration in the northern river network. This dominant contribution identified it as a high-priority control point. Although its overall contribution was secondary, its influence intensified during specific tidal phases. At low tide under the 181 m3/s flow condition, the salinity contribution of boundary 4 to the Henggou River estuary reached 20–50%, marking it as another critical control location. Therefore, the installation of the gate at this key location will effectively control the salinity intrusion into the north river network, thereby improving the ecological environment of the northern inner bay and guaranteeing the sustainable development of the region.
By comparing and analyzing the flow field of 181 m3/s and 296 m3/s at high tide, we can draw the following conclusions: under a flow of 181 m3/s, due to the interaction between the upstream flow and the downstream tide level, salinity fluctuates in the estuary area farther from boundary 2 in Xinbu Island domain 2, but does not exceed the estuary limit. However, when the flow increases to 296 m3/s, the salinity retreats further to the estuary area closer to boundary 2. This suggests that estuaries close to boundary 2 are more susceptible to salinity intrusion, while estuaries far from boundary 2 are relatively safe. Salinity intrusion can be controlled more effectively by installing gates at estuaries closer to boundary 2. This targeted approach avoids the significantly higher costs associated with fortifying the entire coastline or the wider natural estuaries, maximizing the return on investment for coastal protection projects.
5.2. Innovation
The core advantage of the salt intrusion simulation model developed in this study is not the core algorithm of hydrodynamic simulation, Telemac-2D, which is a mature and verified model, but the innovative application of the multi-source tracer module to multi-estuary salt source apportioning in a complex river network.
5.2.1. Multi-Source Tracers Are Used to Accurately Distinguish Salinity Sources in Complex River Networks
In this study, multi-source tracers are used to accurately identify and distinguish the salinity sources from different locations in the complex river network system and multi-estuarine environment. While tracer techniques exist, most applications focus on single-source systems. Our model uniquely assigns distinct tracers to each of the four estuaries in a complex network, enabling quantitative source apportionment. This allows us to calculate the exact contribution ratio from each estuary to any location, as visualized in Figure 6, Figure 7 and Figure 8. This strategy significantly improves the accuracy of the salinity intrusion simulation and overcomes the limitation of the traditional salinity monitoring methods, with which it is difficult to clearly distinguish the contribution of salt from each source. By assigning a specific tracer to each salinity source, this study can accurately trace the source of salinity intrusion, and provide detailed and accurate data support for the subsequent salinity dynamic analysis and the formulation of control measures.
5.2.2. Precise Control Strategy Positioning Based on Comprehensive Analysis of Salinity Intrusion Flow Field
On the basis of simulating salinity intrusion by using tracer technology, this study integrates the comprehensive analysis of salinity intrusion flow fields to scientifically determine the optimal position of salinity control measures. By coupling tracers with high-resolution flow fields, we trace intrusion pathways at a granular scale, identifying critical convergence zones (e.g., the northern river network) that are not apparent with bulk salinity models. Through the systematic assessment of salinity concentration ratios and salinity intrusion paths in different locations and estuaries, this study accurately identifies key nodes and high-risk areas of salinity intrusion. On this basis, combined with the actual financial and technical constraints, this study proposes a series of targeted salinity intrusion control strategies to ensure the effectiveness and cost-effectiveness of measures. This innovative comprehensive analysis and strategic positioning method provides a scientific and feasible idea for salinity management in complex water systems and multi-estuarine environments. It also provides a valuable reference example for future research and solution of similar environmental problems.
5.3. Limitations
The limitations of this study are mainly reflected in three aspects: first, as a 2D depth-averaged model, it does not resolve vertical stratification, which can be important for salinity dynamics in deep estuaries. However, given the relatively shallow nature of the study area, the 2D approach is considered appropriate. Second, the accuracy of the model is contingent on the quality of input data, such as bathymetry and Manning’s roughness coefficients. As Xinbu Island is still in the planning stage, although we have validated the hydrodynamic core through dam collapse tests, they cannot capture estuarine-specific processes like density-driven flow or long-term tidal dispersion. Third, the model does not include factors like density-driven flow (baroclinic effects) in this specific application, which might play a secondary role compared to tidal and advective forces in this particular setting. But these limitations present opportunities for future research, such as employing a 3D model to investigate stratification effects. Finally, as the model is a planning stage model, the DEM data, roughness coefficient, and other data are all used in the current stage, so a sensitivity analysis was not carried out. After the project implementation, the follow-up field verification will be carried out.
6. Conclusions
In light of the escalating threat of saltwater intrusion to estuarine systems under global sea-level rise, this study developed a novel multi-source tracer-aided numerical modeling approach. This methodology successfully achieved quantitative source apportionment and precise tracing of intrusion pathways within a complex river network system. The application of the Telemac-2D model to the Xinbu Island estuary case study demonstrated the framework’s effectiveness and reliability in simulating complex hydrodynamic and salinity transport processes. The main conclusions of this study are summarized as follows:
- (1)
- By assigning unique conservative tracers to each estuary, the model overcame the limitation of conventional salinity models, which only reflect the total salinity distribution, and achieved accurate discrimination of salinity sources. The results demonstrate that this method can quantitatively reveal the salinity contribution ratio from different estuaries to specific areas within the river network under various hydrological conditions.
- (2)
- The quantitative source apportionment (contribution ratios) and intrusion path information obtained from tracer simulations formed the scientific basis for formulating highly effective control strategies. This study found that saltwater intrusion in key areas, such as the northern river network, is primarily dominated by specific estuaries. The targeted engineering measures designed based on these findings showed significant inhibitory effects in the simulations. For instance, under flow conditions of 181 m3/s and 296 m3/s, the salinity concentration at monitoring points in the northern river network decreased significantly after implementation, with a maximum reduction of up to 27%. This proves the high effectiveness of control strategies based on traceability analysis.
- (3)
- The study provides a robust methodological framework and a valuable reference for addressing similar salinity intrusion challenges in ecologically vulnerable and socio-economically critical estuarine regions worldwide. The cost-effectiveness of the strategy is demonstrated by its ability to achieve significant salinity suppression through targeted interventions at identified critical points, optimizing the use of often-limited management funds. Its operational feasibility is underpinned by the application of a standard, widely supported hydrodynamic model. Most importantly, the framework serves as a powerful tool for future-proofing coastal planning against sea-level rise, enabling stakeholders to test and optimize control strategies under various climate scenarios before implementation. This transition from reactive to proactive management is essential for the sustainable development of estuaries in the Anthropocene.
Author Contributions
J.L.: Writing, Software; H.L.: Writing; L.Z.: Methodology; D.H.: Writing, Software; W.Y.: Data Curation, Review. All authors have read and agreed to the published version of the manuscript.
Funding
The research was supported by Jilin Provincial Science and Technology Development Program Project (20230101207JC), National Natural Science Foundation of China (42201078), Natural Science Foundation of Tianjin City (24JCYBJC00680), Tianjin Science and Technology Enterprise Special Envoy Funding Project (No. 23YDTPJC00210), Chunhui Plan cooperative research project of the Ministry of Education, China (HZKY20220591-202200268), and the Major Science and Technology Projects of Zhongshan City (2022A1016).
Data Availability Statement
The datasets presented in this article are not readily available because the data are part of an ongoing study.
Conflicts of Interest
Author Lihong Zhang was employed by the company Beifang Investigation, Design & Research Co., Ltd.; Author De Hu was employed by the Key Laboratory of Coastal Engineering Hydrodynamics, CCCC. The remaining authors declare that the research was conducted in the absence of any commercial or financial relationships that could be construed as a potential conflict of interest.
References
- He, W.; Zhang, J.; Yu, X.; Chen, S.; Luo, J. Effect of Runoff Variability and Sea Level on Saltwater Intrusion: A Case Study of Nandu River Estuary, China. Water Resour. Res. 2018, 54, 9919–9934. [Google Scholar] [CrossRef]
- Jung, N.W.; Lee, G.; Dellapenna, T.M.; Jung, Y.; Jo, T.; Chang, J.; Figueroa, S.M. Economic Development Drives Massive Global Estuarine Loss in the Anthropocene. Earths Future 2024, 12, 13. [Google Scholar] [CrossRef]
- de la Reguera, E.; Veatch, J.; Gedan, K.; Tully, K.L. The effects of saltwater intrusion on germination success of standard and alternative crops. Environ. Exp. Bot. 2020, 180, 11. [Google Scholar] [CrossRef]
- Cao, T.; Han, D.; Song, X. Past, present, and future of global seawater intrusion research: A bibliometric analysis. J. Hydrol. 2021, 603, 14. [Google Scholar] [CrossRef]
- Werner, A.D.; Lockington, D.A. Tidal impacts on riparian salinities near estuaries. J. Hydrol. 2006, 328, 511–522. [Google Scholar] [CrossRef]
- Colon-Rivera, R.J.; Feagin, R.A.; West, J.B.; López, N.B.; Benítez-Joubert, R.J. Hydrological modification, saltwater intrusion, and tree water use of a Pterocarpus officinalis swamp in Puerto Rico. Estuar. Coast. Shelf Sci. 2014, 147, 156–167. [Google Scholar] [CrossRef]
- Guerra-Chanis, G.E.; Laurel-Castillo, J.A.; Schettini, C.A.; Kakoulaki, G.; Souza, A.J.; Valle-Levinson, A. Saltwater intrusion in estuaries with different dynamic depths. Reg. Stud. Mar. Sci. 2022, 51, 102186. [Google Scholar] [CrossRef]
- Yuan, Y.; Liang, D.; Rui, H. The numerical simulation and analysis of three-dimensional seawater intrusion and protection projects in porous media. Sci. China Ser. G-Phys. Mech. Astron. 2009, 52, 92–107. [Google Scholar] [CrossRef]
- Arslan, H.; Demir, Y. Impacts of seawater intrusion on soil salinity and alkalinity in Bafra Plain, Turkey. Environ. Monit. Assess. 2013, 185, 1027–1040. [Google Scholar] [CrossRef] [PubMed]
- Becker, M.L.; Luettich, R.A.; Mallin, M.A. Hydrodynamic behavior of the Cape Fear River and estuarine system: A synthesis and observational investigation of discharge–salinity intrusion relationships. Estuar. Coast. Shelf Sci. 2010, 88, 407–418. [Google Scholar] [CrossRef]
- Parsa, J.; Etemad-Shahidi, A. An empirical model for salinity intrusion in alluvial estuaries. Ocean Dyn. 2011, 61, 1619–1628. [Google Scholar] [CrossRef]
- Jeong, S.; Yeon, K.; Hur, Y.; Oh, K. Salinity intrusion characteristics analysis using EFDC model in the downstream of Geum River. J. Environ. Sci. 2010, 22, 934–939. [Google Scholar] [CrossRef] [PubMed]
- Abdalla, F. Ionic ratios as tracers to assess seawater intrusion and to identify salinity sources in Jazan coastal aquifer, Saudi Arabia. Arab. J. Geosci. 2016, 9, 40. [Google Scholar] [CrossRef]
- Tran Anh, D.; Hoang, L.P.; Bui, M.D.; Rutschmann, P. Simulating Future Flows and Salinity Intrusion Using Combined One- and Two-Dimensional Hydrodynamic Modelling—The Case of Hau River, Vietnamese Mekong Delta. Water 2018, 10, 897. [Google Scholar] [CrossRef]
- He, W.; Zhou, H.; Zhang, J.; Xu, H.; Liu, C. Combined effects of runoff increase and sea level rise on the water exchange and saltwater intrusion for an estuary bay in non-flood season. Hydrol. Process. 2022, 36, 16. [Google Scholar] [CrossRef]
- Xu, Y.; Zhang, W.; Zhu, Y.; Zheng, J. Analytical solution for salt intrusion in multiple-freshwater-source estuaries: Application to Humen Estuary. Environ. Earth Sci. 2017, 76, 661. [Google Scholar] [CrossRef]
- Wajid Ijaz, M.; Mahar, R.B.; Ansari, K.; Siyal, A.A. Optimization of salinity intrusion control through freshwater and tidal inlet modifications for the Indus River Estuary. Estuar. Coast. Shelf Sci. 2019, 224, 51–61. [Google Scholar] [CrossRef]
- Javadi, A.; Hussain, M.; Sherif, M.; Farmani, R. Multi-objective Optimization of Different Management Scenarios to Control Seawater Intrusion in Coastal Aquifers. Water Resour. Manag. 2015, 29, 1843–1857. [Google Scholar] [CrossRef]
- Brockway, R.; Bowers, D.; Hoguane, A.; Dove, V.; Vassele, V. A note on salt intrusion in funnel-shaped estuaries: Application to the Incomati estuary, Mozambique. Estuar. Coast. Shelf Sci. 2006, 66, 1–5. [Google Scholar] [CrossRef]
- Fu, C.J. Ecological Effect Analysis and High Efficiency Utilization of Water Resource For Nandujiang River Estuary; Tianjin University: Tianjin, China, 2008. (In Chinese) [Google Scholar]
- Hervouet, J.M. Hydrodynamics of Free Surface Flows: Modelling with the Finite Element Method; John Wiley & Sons Ltd.: Chichester, UK, 2007. [Google Scholar]
- Qi, W.C. Development of a Coupled Urban Hydrological-Hydrodynamic Model and Its Application; Tianjin University: Tianjin, China, 2022. (In Chinese) [Google Scholar]
- Morris, M.W. CADAM: Concerted Action on Dambreak Modelling; HR Wallingford Ltd.: Wallingford, UK, 2000. [Google Scholar]
- Chang, T.; Kao, H.-M.; Chang, K.-H.; Hsu, M.-H. Numerical simulation of shallow-water dam break flows in open channels using smoothed particle hydrodynamics. J. Hydrol. 2011, 408, 78–90. [Google Scholar] [CrossRef]
- Abouelsaad, O.; Matta, E.; Hinkelmann, R. Hydrodynamic response of artificial lagoons considering tide, wind and tracer—Case study El Gouna, Egypt. Reg. Stud. Mar. Sci. 2022, 52, 13. [Google Scholar] [CrossRef]
- Moulinec, C.; Denis, C.; Pham, C.-T.; Rougé, D.; Hervouet, J.-M.; Razafindrakoto, E.; Barber, R.; Emerson, D.; Gu, X.-J. TELEMAC: An efficient hydrodynamics suite for massively parallel architectures. Comput. Fluids 2011, 51, 30–34. [Google Scholar] [CrossRef]
Disclaimer/Publisher’s Note: The statements, opinions and data contained in all publications are solely those of the individual author(s) and contributor(s) and not of MDPI and/or the editor(s). MDPI and/or the editor(s) disclaim responsibility for any injury to people or property resulting from any ideas, methods, instructions or products referred to in the content. |
© 2025 by the authors. Licensee MDPI, Basel, Switzerland. This article is an open access article distributed under the terms and conditions of the Creative Commons Attribution (CC BY) license (https://creativecommons.org/licenses/by/4.0/).