Abstract
This study aimed to assess the impact and vulnerability of climate change by classifying 26 clusters of meteorologically homogeneous regions. To determine the optimal clustering method, both K-means and Gaussian Mixture Model (GMM) clustering were analyzed using the effective storage capacity to watershed area ratio. The optimal number of clusters was derived based on several evaluation metrics, including the Silhouette Score, Calinski-Harabasz Index, Akaike Information Criterion (AIC), and Bayesian Information Criterion (BIC). Ultimately, GMM clustering was identified as the optimal method, with the best clustering results obtained at k = 4 for an effective storage capacity of 100,000 to 400,000 tons and k = 5 for an effective storage capacity of 400,000 to 10,000,000 tons. Additionally, standard reservoirs applicable to agricultural production infrastructure design standards were identified based on homogeneous weather region clusters, the optimal clustering method, and centroid results. The findings of this study can serve as fundamental data for the development and revision of design standards, contributing to more climate-resilient agricultural infrastructure.
1. Introduction
According to the Global Risks 2024 Report by the World Economic Forum, the most critical global threat over both the short term (2 years) and long term (10 years) will be dominated by extreme climate phenomena and severe disruptions in the global ecological system [1]. These risks have intensified socio-environmental vulnerabilities worldwide, particularly in sectors that are directly dependent on weather conditions [2]. Korea’s agricultural industry is highly sensitive to these changes, with climate-related agricultural damage expanding more than five-fold—from approximately 40,000 ha in 2016 to 200,000 ha in 2020—resulting in rapidly growing economic and production losses [3]. This escalation demonstrates the urgent need for adaptive agricultural water management and infrastructure planning that accounts for climate uncertainty.
In recognition of these risks, the Korean government has introduced multiple legislative frameworks to strengthen national resilience to climate change. The Framework Act on Low Carbon, Green Growth requires national and regional administrations to establish and implement climate change adaptation measures, including vulnerability assessment, monitoring, and sector-specific adaptation planning. Likewise, the Framework Act on Agriculture, Rural Community and Food Industry mandates a periodic assessment of climate impacts every five years for the agricultural sector, with results published as foundational policy data. Responsibility for evaluation and field-based application is delegated across agencies: the Rural Development Administration (agriculture and rural regions), the Korea Forest Service (forestry), and the Korea Rural Community Corporation (KRC), which oversees agricultural water management and infrastructure, including reservoirs and irrigation systems [4,5,6]. These regulatory systems emphasize the need to evaluate climate change impacts scientifically, yet they do not fully present specific application methods for engineering design practices.
In January 2022, Korea revised its Design Standards for Agricultural Production Infrastructure (Irrigation of Farmland) to explicitly incorporate considerations related to sustainability, evolving farming practices, and climatic shifts. However, the accompanying technical commentary does not provide explicit quantitative guidelines or methods for applying climate change impacts to irrigation reservoir design. Consequently, design practitioners continue to follow the traditional approach of using a static 10-year drought frequency assumption, without systematic incorporation of climate-change-driven variability or probabilistic hydrological change [7]. Thus, although national policies and legislative systems have been strengthened, practical design implementation remains stagnant, and engineering tools have not yet evolved sufficiently to reflect climate-adaptive design.
Vulnerability assessment and stability modeling of infrastructure are critical research topics across various engineering disciplines. For instance, recent studies in mining engineering have utilized water injection softening modeling for hard roof management [8] and analyzed overburden failure characteristics under repeated mining conditions [9]. These studies highlight the importance of understanding structural behavior under extreme or changing conditions, offering valuable methodological insights that can be transferred to other infrastructure systems. Similarly, research on hydraulic and agricultural infrastructure has increasingly emphasized system reliability under climate change impacts, particularly focusing on water resource management. Reservoirs and irrigation systems must operate under uncertain environmental conditions, making their vulnerability evaluation and long-term stability modeling essential for sustainable agricultural production. Therefore, integrating physical characteristics, operational conditions, and regional hydrologic variability into the assessment framework can provide a more robust basis for design criteria and future management strategies.
Academic research has sought to address climate change impacts through vulnerability assessments, probabilistic hydrological modeling, and prediction of future extremes. For example, Kim et al. (2021) quantified agricultural drought vulnerability in reservoirs by evaluating climate exposure and regional sensitivity [5]. Nam et al. (2015) proposed a vulnerability assessment model and developed risk-based mapping using reservoirs equipped with automatic level gauges [10]. Jang (2006) applied Principal Component Analysis (PCA) to evaluate agricultural drought vulnerability across administrative districts [11]. Machine learning approaches have also been adopted; Kim et al. (2018) predicted reservoir storage rates using Naïve Bayes classification and multivariate regression based on meteorological predictors [12]. Furthermore, international and domestic research has emphasized the necessity of updating design standards under climate change. For example, Song et al. (2023) reviewed the current status of climate change vulnerability assessments and adaptation measures promoted by KRC, highlighting legal and institutional shortcomings in applying vulnerability assessments [13]. Yoon et al. (2021) employed K-Nearest Neighbor resampling and genetic algorithms to estimate future extreme rainfall for hydraulic facility design [14]. Hwang et al. (2018) highlighted uncertainties in flood design standards under climate scenarios through probabilistic flood estimations [15], and Wright et al. (2019) conducted statistical analyses to revise design standards based on shifting IDF characteristics [16]. Despite these advancements, most existing research focuses on flood control or water supply risk assessments; few studies propose practical application of climate-adaptive design parameters specifically for agricultural water utilization infrastructure.
International infrastructure policies similarly show progress but limited direct application. The UK introduced climate change allowances for the Thames Estuary to accommodate rising flood levels [17]. Japan revised agricultural road standards in response to increasing disaster frequency [18], and the U.S. Environmental Protection Agency has updated water treatment facility criteria to withstand extreme floods. In Korea, the Ministry of Environment selected the Han River basin for pilot application of probabilistic flood level estimations to modify river design standards [19,20], and KRC has begun reviewing irrigation design parameters to reflect climate changes for rice paddies [7]. Additionally, regional disaster management guidelines proposed climate-based surcharge rates for infrastructure performance targets [21]. These developments reflect growing recognition of climate-adaptive design, yet real-world implementation remains limited due to the lack of concrete technical methodologies.
Despite increasing efforts to incorporate climate change impacts into national policies and infrastructure guidelines, a clear methodological framework for translating climate vulnerability into practical design parameters for agricultural water systems remains insufficient. Existing studies have focused on hydrologic forecasting, vulnerability assessment, or probabilistic rainfall estimation; however, they do not provide engineering criteria that can be directly applied to determine climate-adaptive reservoir design values. Most research addresses flood control or regional drought risk mapping, but little attention has been given to establishing representative design reservoirs that reflect climate-induced hydrologic variability, reservoir storage characteristics, and regional meteorological homogeneity. As a result, irrigation reservoir design in Korea continues to rely on static drought frequencies, lacking robust metrics that integrate climate uncertainty into practical infrastructure planning.
To enhance the climate resilience of agricultural infrastructure, shifting from individual assessments to a representative model approach is critical for practical adaptation. This study establishes scientifically grounded “standard reservoirs” to bridge the gap between meteorological variability and infrastructure design. By analyzing 1687 reservoirs using optimized clustering techniques (including K-means and GMM), we derived representative models that reflect distinct hydrological behaviors across meteorologically homogeneous regions. The primary contribution of this study is the definition of central reservoir conditions that serve as a scalable baseline for vulnerability assessments. These proposed standard criteria provide a practical framework for policymakers and engineers to update design standards, ensuring that aging infrastructure can effectively withstand future climate uncertainties.
2. Materials and Methods
In this study, we classified 1678 reservoirs selected by the Korea Rural Community Corporation for climate change impact and vulnerability assessment into meteorologically homogeneous regions using the regional frequency analysis methodology outlined in the Ministry of Environment’s flood estimation guidelines. As part of this process, Thiessen polygons were generated. To analyze the data, we applied both K-means and Gaussian Mixture Model (GMM) clustering, using effective reservoir capacity and watershed area ratio as key variables. The optimal clustering method and the appropriate number of clusters were determined based on multiple evaluation metrics, including the Silhouette Score, Calinski-Harabasz Index, Akaike Information Criterion (AIC), and Bayesian Information Criterion (BIC). Finally, we identified standard reservoirs applicable to the design standards for agricultural production infrastructure by integrating the results of the meteorologically homogeneous regional clusters, the optimal clustering method, and the centroid locations corresponding to the selected number of clusters (Figure 1).
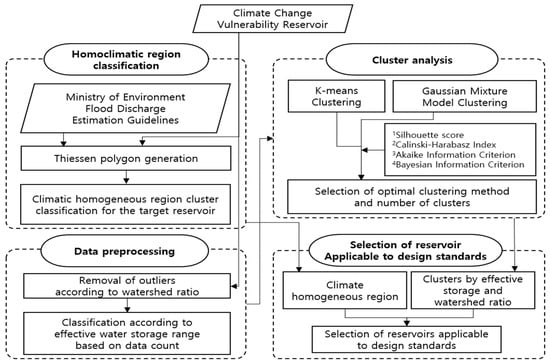
Figure 1.
Flow chart of the study.
2.1. Climate Change Vulnerability Assessment Reservoir
This study examined the application of design standards for agricultural production infrastructure (reservoirs) that incorporate the impacts of climate change. The analysis focused on 1687 reservoirs assessed by the Korea Rural Community Corporation for climate change impact and vulnerability based on Shared Socioeconomic Pathways (SSP) scenarios. The distribution of the target reservoirs is highest in Jeollanam-do, with 419 locations, followed by Gyeongsangbuk-do with 286. In contrast, Gwangju, Daegu, Daejeon, Busan, Sejong, Ulsan, Incheon, and Jeju have relatively fewer reservoirs compared to other regions (Table 1, Figure 2).

Table 1.
Target reservoir in this study.
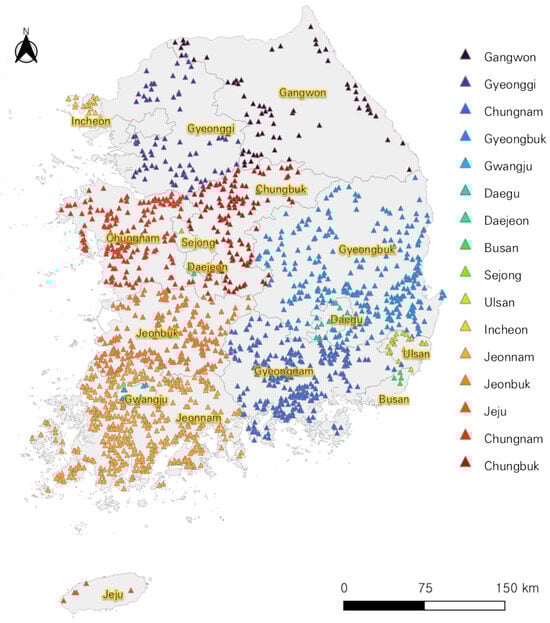
Figure 2.
Target reservoir.
2.2. Classification of Climatic Homogeneity Regions
In this study, we addressed the limitations of conventional point frequency analysis, such as short data recording periods and the lack of consideration for regional characteristics, by utilizing regional frequency analysis data from the Standard Guidelines for Flood Estimation [20]. Due to the nature of agricultural production infrastructure (reservoirs), these facilities are not typically located near weather observation stations. As shown in Figure 2, the large number of reservoir sites makes it challenging for the 103 ASOS (Automated Synoptic Observing System) stations to adequately represent the climatic conditions of all facilities. Regional frequency analysis is particularly useful when climatic data records are short or when estimating frequency distributions for an entire region. The Standard Guidelines for Flood Estimation developed by the Ministry of Environment classify 615 weather observation stations provided by organizations such as the Korea Meteorological Administration, Flood Control Office, K-water, and the Korea Rural Community Corporation into 26 clusters based on geomorphological similarities using the K-means method. This classification comprehensively considers hydrometeorological characteristics such as latitude–longitude, monthly rainfall, rainfall days, and mean annual precipitation, and it reflects region-specific rainfall temporal patterns by applying the modified Huff quartile method [20]. In this study, the 26 clusters were mapped to 1678 agricultural reservoirs through Thiessen polygon analysis to establish meteorologically homogeneous regions. However, clusters 9, 23, and 26 contain relatively fewer reservoir sites compared to other regions (Figure 3). Therefore, when determining reservoir design capacity in these clusters, the possibility of statistical bias must be considered, necessitating careful examination of local reservoir characteristics.
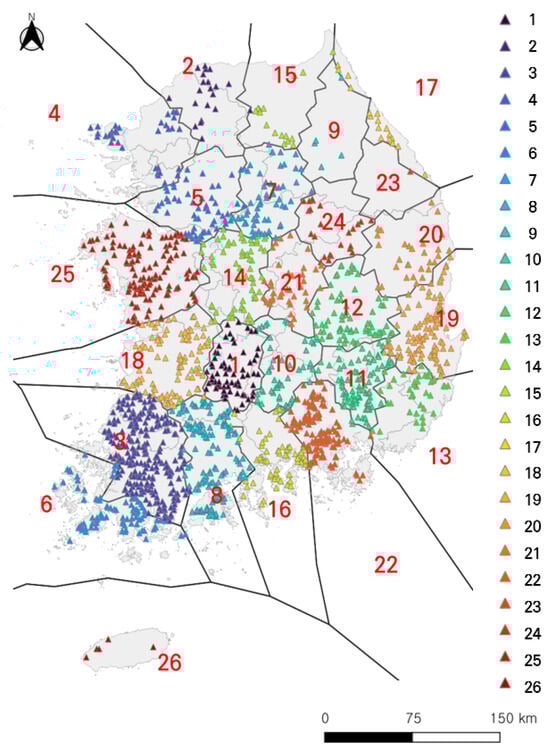
Figure 3.
Cluster classification of target reservoir.
2.3. Cluster Analysis and Performance Evaluation
In this study, we performed cluster analysis based on effective reservoir capacity and watershed ratio (the ratio of watershed area to beneficiary area), as these are key indicators reflecting the characteristics of each facility and serve as fundamental design criteria. Additionally, we evaluated cluster performance and determined the optimal number of clusters to derive the most suitable clustering configuration. The clustering methods applied in this study include K-means and Gaussian Mixture Model (GMM) Clustering. To assess clustering performance, we utilized the Silhouette Score, Calinski-Harabasz Index, Akaike Information Criterion (AIC), and Bayesian Information Criterion (BIC).
2.3.1. K-Means Clustering
K-means clustering is a widely used non-hierarchical clustering method that partitions data into k clusters, ensuring high similarity among data points within the same cluster while maintaining low similarity between different clusters [22,23,24]. This method is computationally efficient, easy to implement, and well-suited for large datasets. Additionally, it can be applied to various types of data and allows for straightforward cluster interpretation through the centroids of each cluster. However, K-means has certain limitations. The choice of the initial k value can significantly affect the results, and because it is a distance-based clustering method, its performance can be uncertain when clusters have irregular shapes or when the dataset contains many outliers. The K-means algorithm consists of three main steps: Calculating total variance using Euclidean distance, Assigning data points to clusters, Re-adjusting cluster centroids iteratively
where V represents the total variance, k denotes the number of clusters, Si is the set of points belonging to the μi refers to the centroid of the i-th cluster.
2.3.2. Gaussian Mixture Model Clustering
Gaussian Mixture Model (GMM) Clustering is an algorithm that assumes a dataset follows a Gaussian distribution and classifies data into multiple mixed Gaussian distributions when the overall data trend is non-uniform. This method is particularly effective for capturing non-linear relationships and, unlike K-means, can identify complex cluster shapes, including spherical and elliptical clusters. Additionally, GMM is less sensitive to outliers and allows for a probabilistic interpretation of the data. However, GMM has certain drawbacks: it is more computationally intensive, slower than K-means, and conceptually more complex, making it harder to understand and implement [2,25]. Considering variations in facility specifications such as effective reservoir capacity and watershed ratio due to geomorphological characteristics, this study applied the Gaussian Mixture Model Clustering method, which enables probabilistic cluster classification. GMM assumes a Gaussian distribution and utilizes the Expectation-Maximization (EM) algorithm, which iteratively estimates parameters by maximizing the log-likelihood function. The process involves setting initial values and introducing latent variables to refine the final parameter estimates.
where P(Xi) represents the probability density function of the Gaussian distribution, P(Zi = k|Xi) denotes the conditional probability of the k-th probability distribution, k is the number of clusters, Xi refers to the data, i is a p-dimensional vector, μk is the mean vector, ∑k is the covariance, θ(t) represents the parameter matrix.
2.3.3. Performance Evaluation
- Silhouette score
The Silhouette score is a metric used to evaluate the performance of clustering algorithms by measuring both the cohesion of data points within a cluster and the separation between different clusters. The score ranges from −1 to 1, where values closer to 1 indicate well-defined clusters, values near 0 suggest that a data point lies between clusters, and values closer to −1 indicate that a data point may have been incorrectly assigned. This metric is widely used to assess the quality of clusters generated by various clustering algorithms and to help determine the optimal number of clusters [26,27].
where s(i) represents the Silhouette score, i denotes the individual data index, a(i) is the average distance between the individual data point and other points in the same cluster, and b(i) refers to the average distance to the nearest cluster.
- 2.
- Calinski-Harabasz Index
The Calinski-Harabasz Index (CHI) is a metric used to evaluate clustering performance by measuring the ratio of between-cluster variance to within cluster variance, with higher values indicating better clustering quality. Unlike the Silhouette score, CHI provides insight into the overall cluster structure and is computationally efficient [28,29]. Similarly to the Silhouette score, CHI is commonly used to assess clustering performance and determine the optimal number of clusters.
where CH represents the Calinski-Harabasz Index, nE is the size of the dataset, k denotes the number of clusters, tr(Bk) is the trajectory of the between-group variance matrix, tr(Wk) is the trajectory of the within-cluster variance matrix, Cq refers to the set of points in cluster q, cq is the centroid of cluster q, cE is the centroid of cluster E, nq denotes the number of points in cluster q.
- 3.
- Akaike Information Criterion
The Akaike Information Criterion (AIC) is a metric used for cluster selection, balancing goodness of fit and model complexity to compare and evaluate different clustering solutions. A lower AIC value indicates a better-fitting model with lower complexity. Importantly, relative AIC values are more meaningful than absolute values. A difference of 2 or more between AIC values suggests a statistically significant difference between clustering models [30,31].
where AIC represents the Akaike Information Criterion, ln(L) is the maximum likelihood of the cluster, and k denotes the number of clusters.
- 4.
- Bayesian Information Criterion
The Bayesian Information Criterion (BIC) is a metric used for cluster selection, similar to AIC, as it evaluates both goodness of fit and model complexity. However, BIC imposes a stronger penalty for model complexity than AIC, making it more conservative in selecting the optimal number of clusters.
Typically, both AIC and BIC are considered together when assessing clustering performance to determine the most suitable clustering model [31,32].
where BIC represents the Bayesian Information Criterion, ln(L) is the maximum likelihood of the cluster, k denotes the number of clusters, and n refers to the number of data points.
2.3.4. Standard Reservoir Selection Methods Applicable to Design Criteria
In this study, we aimed to identify standard reservoirs applicable to design criteria by analyzing 26 clusters of homogeneous climate agricultural production infrastructure (reservoirs) and effective reservoir capacity-to-basin ratio data. This was achieved by selecting facilities located near the centroids of the optimal clusters. As a preliminary step in this selection process, it is important to recognize that effective reservoir capacity and basin ratios vary due to the unique characteristics of agricultural production infrastructure. To prevent degradation in clustering performance, data preprocessing and separation based on the number of data points are necessary. Accordingly, we designed a selection method for standard reservoirs that includes data preprocessing and separation of effective reservoir capacity-to-basin ratios for 1687 agricultural reservoirs. Additionally, we incorporated a selection process that integrates facilities classified into 26 climate-homogeneous regions with the optimal clustering methods and parameters, particularly those related to cluster centroids (Figure 4).
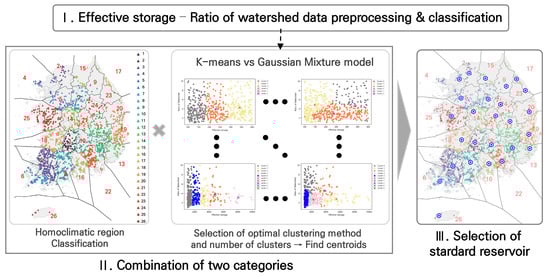
Figure 4.
Standard reservoir selection process applicable to design standard.
3. Results and Discussion
3.1. Data Preprocessing
Table 2 presents the maximum, minimum, and average values, along with the number of data points, for effective reservoir capacity and basin ratios in the target reservoir dataset. The basin ratio, calculated as the ratio of irrigated area to watershed area, had an average of 5.2 before preprocessing, with a maximum of 92.6 and a minimum of 0.01. To remove outliers, a box plot was applied using quartile thresholds, where the first quartile (Q1) and third quartile (Q3) were 2.5 and 5.4, respectively, and the interquartile range (IQR) was 2.9. Based on the conventional rule (Q1 − 1.5 × IQR = −1.85 < data < Q3 + 1.5 × IQR = 9.75), reservoirs with a basin ratio below 1 were classified as outliers, most of which were dual-purpose reservoirs with auxiliary water sources, and were thus excluded. After preprocessing, the basin ratio had an average of 3.8, a maximum of 10, and a minimum of 1, with 232 outlier data points removed. Figure 5 illustrates the box plot used for preprocessing the basin ratio.
Table 2.
Specification of target reservoir.
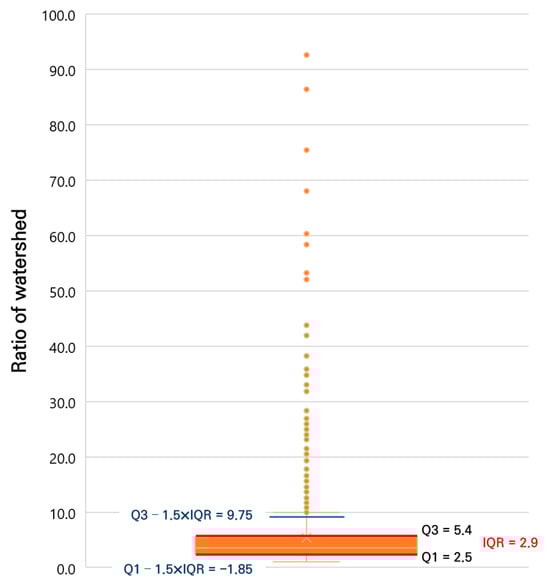
Figure 5.
Box plot for data pre-processing of ratio of watershed (the orange dots indicate data outliers).
Table 3 presents the distribution of reservoirs based on effective capacity ranges and the number of data points. There are 519 reservoirs in the range of 100,000 to 400,000 tons, 479 in the range of 400,000 to 1,000,000 tons, 422 in the range of 1,000,000 to 10,000,000 tons, and 26 reservoirs with a capacity exceeding 10,000,000 tons. Reservoirs with a capacity greater than 10,000,000 tons do not meet the minimum data requirements for cluster analysis. Additionally, these larger reservoirs are expected to require more diverse design considerations compared to those with smaller capacities. Therefore, they were excluded from the analysis.
Table 3.
Data by effective storage capacity of the target reservoir.
3.2. Optimal Clustering Method and Number of Clusters
Figure 6, Figure 7, Figure 8, Figure 9, Figure 10 and Figure 11 and Table 4 present the results of clustering and performance evaluation using K-means and Gaussian Mixture Model clustering for different numbers of clusters based on effective reservoir capacity ranges. The K-means clustering method produced clusters that did not account for the basin ratio in any case. As the number of clusters increased, the Silhouette score decreased, the Calinski-Harabasz Index (CHI) increased, and the Akaike Information Criterion (AIC) and Bayesian Information Criterion (BIC) initially showed maximum values at zero before following a decreasing trend. These results indicate limitations in selecting clusters based on the effective reservoir capacity-to-basin ratio.
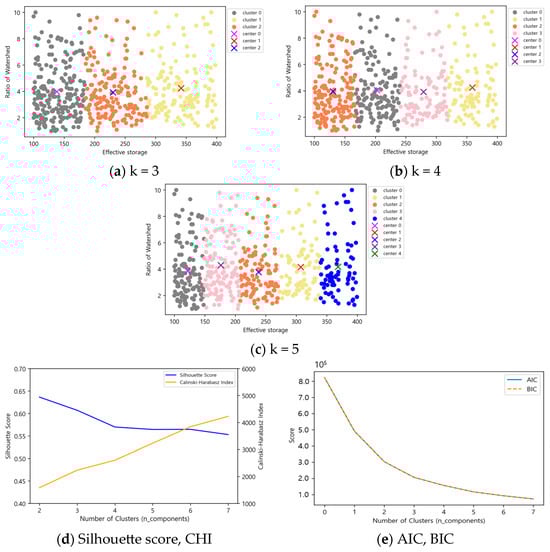
Figure 6.
K-means results according to the number of clusters in effective storage capacity (1000 m3) 100 ≤ x < 400.
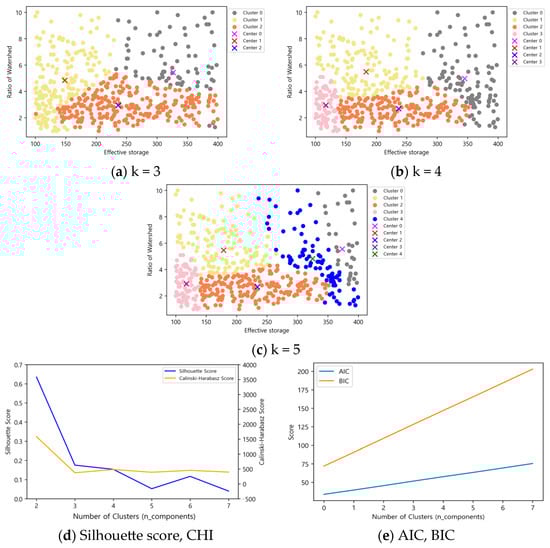
Figure 7.
Gaussian Mixture Model results according to the number of clusters in effective storage (1000 m3) 100 ≤ x < 400.
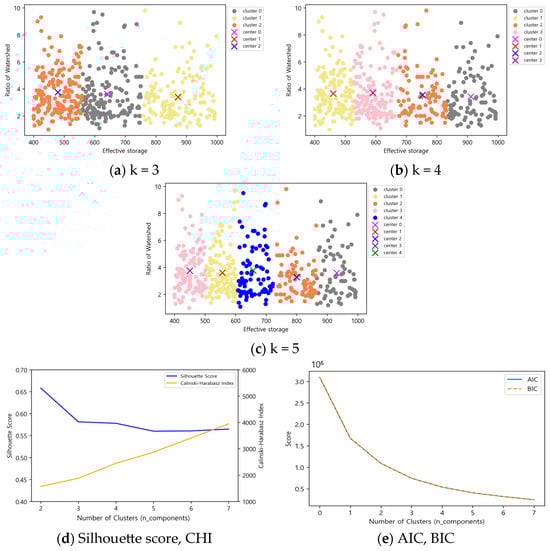
Figure 8.
K-means results according to the number of clusters in effective storage capacity (1000 m3) 400 ≤ x < 1000.
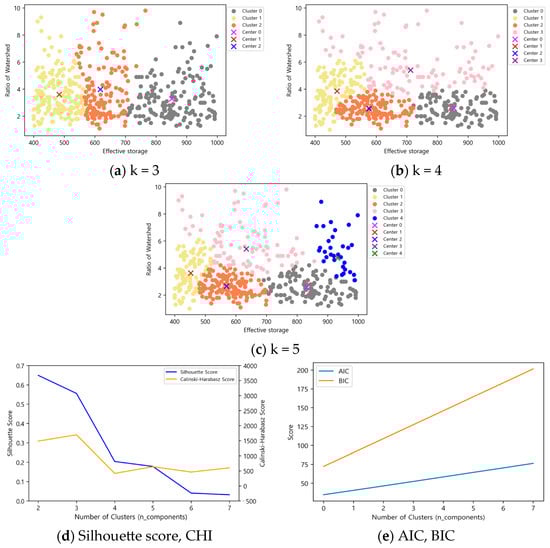
Figure 9.
Gaussian Mixture Model results according to the number of clusters in effective storage capacity (1000 m3) 400 ≤ x < 1000.
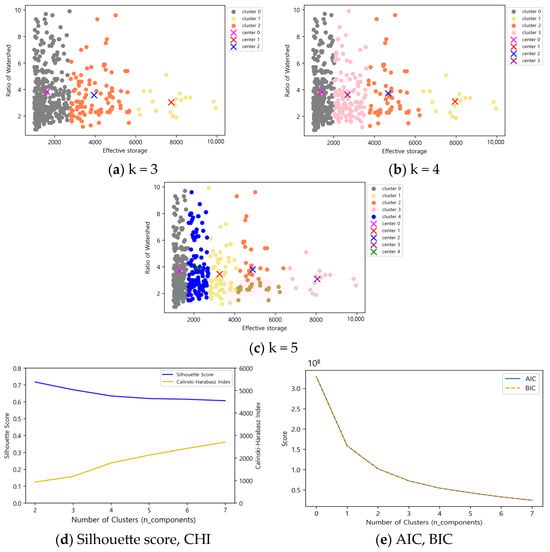
Figure 10.
K-means results according to the number of clusters in effective storage capacity (1000 m3) 1000 ≤ x < 10,000.
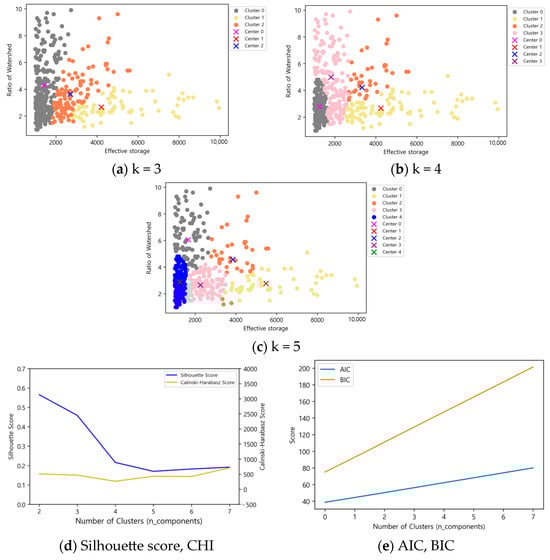
Figure 11.
Gaussian Mixture Model results according to the number of clusters in effective storage capacity (1000 m3) 1000 ≤ x < 10,000.
Table 4.
Performance evaluation of k-means, gaussian mixture model clustering.
In contrast, the Gaussian Mixture Model clustering successfully separated clusters according to the relative sizes of effective reservoir capacity and basin ratio in all cases. The Silhouette score and CHI exhibited consistent trends based on the number of clusters, while AIC and BIC showed significant differences of two or more, making this method suitable for clustering selection.
The optimal number of clusters was determined by considering both the relationship between effective reservoir capacity and basin ratio and the simplicity of design criteria, particularly for cases where the number of clusters was set to three, four, or five. For the Gaussian Mixture Model applied to reservoirs with an effective capacity between 100 and 400 (1000 m3), the highest Silhouette score of 0.18 was observed at three clusters, while the highest CHI value of 483 was at four clusters. Since the difference in CHI between three and four clusters was greater than that in the Silhouette score, and four clusters best explained the relationship between effective reservoir capacity and basin ratio, four clusters were determined to be optimal.
For reservoirs with an effective capacity between 400 and 1000 (1000 m3), the highest Silhouette score of 0.56 was observed at three clusters, with a CHI value of 1694. However, since the clustering pattern at three clusters was similar to that of K-means and did not account for the basin ratio, five clusters were selected as optimal. Although the Silhouette score at five clusters was lower at 0.18 compared to four clusters, the CHI value was higher at 637, making it a more suitable choice.
For reservoirs with an effective capacity between 1000 and 10,000 (1000 m3), the Silhouette score was 0.46 and the CHI was 469, but the clustering pattern resembled that of K-means. Therefore, five clusters were judged to be optimal, as this configuration had a slightly lower Silhouette score of 0.17 compared to four clusters but a higher CHI of 433, along with a well-defined relationship between effective reservoir capacity and basin ratio.
3.3. Results of Standard Reservoirs Selection for Design Criteria
Table 5 presents the cluster centroids, including effective reservoir capacity and basin ratio, based on the optimal clustering method and number of clusters for different effective reservoir capacity ranges. Using the centroid results from the 26 clusters, standard reservoirs applicable to agricultural production infrastructure design criteria were selected for the climate-homogeneous regions.
Table 5.
Cluster centroid data by effective storage capacity of the target reservoir.
Table 6 shows the distribution of reservoirs based on climate-homogeneous regions and centroid results. A total of 284 reservoirs were identified as applicable to agricultural production infrastructure design criteria, with 80 reservoirs in the range of 100 to 400 (1000 m3), 101 in the range of 400 to 1000 (1000 m3), and 103 in the range of 1000 to 10,000 (1000 m3). Due to a limited number of data points, some regions had fewer applicable reservoirs. These include region 2 with 8 reservoirs, region 9 with 3, region 15 with 7, region 17 with 7, region 23 with none, and region 26 with 1. It is expected that these limitations can be addressed by comparing and analyzing target sites in climate-homogeneous regions with the most similar characteristics. Figure 12 visually represents the locations of the reservoirs according to climate-homogeneous regions and centroid results.
Table 6.
Reservoir by centroid result and homoclimatic region.
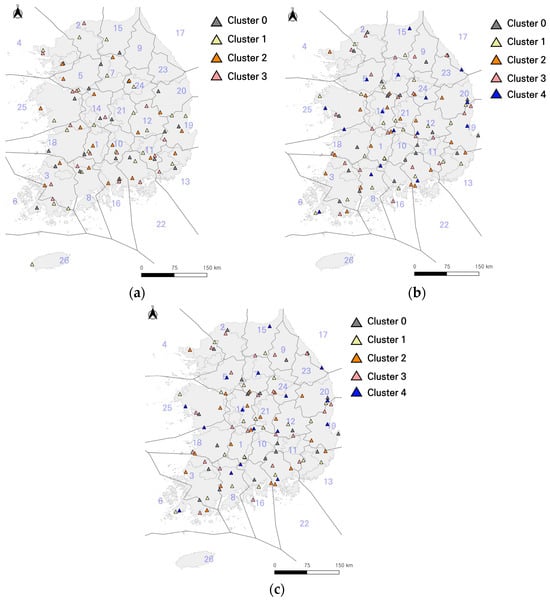
Figure 12.
Reservoir location by centroid result and homoclimatic region. (a) Effective storage capacity 100 ≤ x < 400, (1000 m3); (b) Effective storage capacity, 400 ≤ x < 1000 (1000 m3); (c) Effective storage capacity, 1000 ≤ x < 10,000 (1000 m3).
4. Conclusions
In this study, agricultural production infrastructure (reservoirs) was classified into climate-homogeneous regions, and clustering algorithms were applied to determine optimal groupings based on effective reservoir capacity and basin ratio. The analysis evaluated the performance of K-means and Gaussian Mixture Model (GMM) clustering using validity indices such as the Silhouette score, Calinski-Harabasz Index (CHI), AIC, and BIC. The results indicated that GMM provided superior clustering stability and distinctiveness compared to K-means. Based on these performance metrics, the optimal number of clusters () was identified as 4 for reservoirs with capacities between 100,000 and 400,000 tons and 5 for those ranging from 400,000 to 10 million tons.
Applying the optimal clustering method and cluster numbers derived from the analysis, this study successfully selected a total of 284 standard reservoirs applicable to agricultural production infrastructure design criteria. These selections were categorized to reflect the specific characteristics of each capacity range: 80 reservoirs were identified in the 100,000 to 400,000-ton range, 101 in the 400,000 to 1 million-ton range, and 103 in the 1 million to 10 million-ton range. This categorization provides a structured baseline for design standards, ensuring that the selected standard reservoirs statistically represent the hydrological characteristics of their respective climate-homogeneous regions.
However, this study is subject to certain limitations. First, reservoirs with an effective capacity exceeding 10 million tons were excluded from the standard selection due to the small sample size and the need for specialized, site-specific design considerations. Second, certain climate-homogeneous regions—specifically regions 2, 9, 15, 17, 23, and 26—contained a limited number of applicable reservoirs. For these regions, the derived standard reservoirs may have lower statistical representativeness, and it is recommended that comparisons be conducted with target sites in regions sharing similar hydrological and climatic characteristics.
The methodology and selection process for standard reservoirs in agricultural production infrastructure can serve as fundamental data for establishing and revising design criteria that reflect climate change impacts. Moreover, clustering based on the effective reservoir capacity-to-basin ratio can be utilized to identify drought-prone areas that consider both climate change and facility characteristics. Future research should expand upon these selected standard reservoirs by applying multiple GCMs under various SSP climate scenarios to quantify future water balance changes and provide scientific evidence to reevaluate the current design criteria. This aims to improve standard reservoir design guidelines and propose region-specific water management policies that enhance the reliability of agricultural water supply under climate change.
Author Contributions
Conceptualization, D.-H.J., S.-H.Y. and S.-H.L.; methodology, D.-H.J., S.-H.Y. and S.-H.L.; software, D.-H.J. validation, D.-H.J., S.-H.Y. and S.-H.L.; formal analysis, D.-H.J. and R.N.; investigation, D.-H.J. and H.K.; resources, D.-H.J., S.-H.Y. and S.-H.L.; data curation, D.-H.J.; writing—original draft preparation, D.-H.J.; writing—review and editing, D.-H.J., S.-H.Y., S.-H.L. and R.N.; visualization, D.-H.J.; supervision, D.-H.J., S.-H.Y. and S.-H.L.; project administration, D.-H.J., S.-H.Y. and S.-H.L.; funding acquisition, S.-H.Y. and S.-H.L. All authors have read and agreed to the published version of the manuscript.
Funding
This research was supported by “A Research on application of design standards reflecting future climate change scenarios”, funded by Korea Rural Community Corporation Rural Research Institute, Republic of Korea (20230812A01-00), and Chungbuk National University NUDP program (2024).
Data Availability Statement
The data are available from the authors upon reasonable request due to privacy.
Acknowledgments
This study was supported by Korea Rural Community Corporation Rural Research Institute: A Research on application of design standards reflecting future climate change scenarios, and Chungbuk National University NUDP program (2024).
Conflicts of Interest
The authors declare that there is no conflict of interest regarding the publication.
References
- World Economic Forum. Global Risks Perceptions Survey; World Economic Forum: Geneva, Switzerland, 2024. [Google Scholar]
- Madsen, H.; Lawrence, D.; Lang, M.; Martinkova, M.; Kjeldsen, T.R. Review of trend analysis and climate change projections of extreme precipitation and floods in Europe. J. Hydrol. 2014, 519, 3634–3650. [Google Scholar] [CrossRef]
- Korea Rural Community Corporation (KRC). A Study on The Development of Climate Change Impact Investigation Methodology and Guidelines for Agricultural Infrastructure Improvement Project; Korea Rural Community Corporation (KRC): Naju-si, Republic of Korea, 2023. (In Korean) [Google Scholar]
- Reynolds, D.A. Gaussian mixture models. Encycl. Biom. 2009, 741, 827–832. [Google Scholar]
- Kim, S.J.; Bae, S.J.; Kim, S.; Yoo, S.H.; Choi, J.Y.; Jang, M.W. Assessing the Potential Impact of Climate Change on Irrigation by Reservoir. J. Korean Soc. Agric. Eng. 2021, 63, 141–150. (In Korean) [Google Scholar]
- Kim, S.J.; Bae, S.J.; Kim, S.; Yoo, S.H.; Jang, M.W. Assessing sensitivity of paddy rice to climate change in South Korea. Water 2016, 8, 554. [Google Scholar] [CrossRef]
- Korea Rural Community Corporation (KRC). A Research on Application of Design Standards Reflecting Future Climate Change Scenarios; Korea Rural Community Corporation (KRC): Naju-si, Republic of Korea, 2023. (In Korean) [Google Scholar]
- Teng, T.; Chen, Y.; Wang, S.; Jia, W.; Wang, Y.; Liu, Z.; Liu, K. Water injection softening modeling of hard roof and application in Buertai coal mine. Environ. Earth Sci. 2025, 84, 54. [Google Scholar] [CrossRef]
- Sun, C.; Shi, C.; Zhu, Z.; Lin, H.; Li, Z.; Du, F.; Cao, Z.; Lu, P.; Liu, L. Overburden failure characteristics and fracture evolution rule under repeated mining with multiple key strata control. Sci. Rep. 2025, 15, 28029. [Google Scholar] [CrossRef]
- Nam, W.H.; Kim, T.G.; Hong, E.M.; Hayes, M.J.; Svoboda, M.D. Water supply risk assessment of agricultural reservoirs using irrigation vulnerability model and cluster analysis. J. Korean Soc. Agric. Eng. 2015, 57, 59–67. (In Korean) [Google Scholar] [CrossRef]
- Jang, M.W. County-based vulnerability evaluation to agricultural drought using principal component analysis -The case of Gyeonggi-do-. J. Korean Soc. Rural Plan. 2006, 12, 37–48. (In Korean) [Google Scholar]
- Kim, J.U.; Kim, C.G.; Lee, J.W.; Kim, S.J. Development of Naïve-Bayes classification and multiple linear regression model to predict agricultural reservoir storage rate based on weather forecast data. J. Korea Water Resour. Assoc. 2018, 51, 839–852. (In Korean) [Google Scholar]
- Song, S.H.; Lee, J.H.; Park, D.J.; Lee, M.W. A Study on climate change vulnerability assessment for agricultural water and Korea Rural Community Corporation (KRC) climate adaptation measures. J. Clim. Change Res. 2023, 14, 1005–1011. (In Korean) [Google Scholar] [CrossRef]
- Yoon, S.K.; Lee, T.; Seong, K.; Ahn, Y. Calculation of future rainfall scenarios to consider the impact of climate change in Seoul City’s hydraulic facility design standards. J. Korea Water Resour. Assoc. 2021, 54, 419–431. (In Korean) [Google Scholar]
- Hwang, J.; Ahn, J.; Jeong, C.; Heo, J. A study on the variation of design flood due to climate change in the ungauged urban catchment. J. Korea Water Resour. Assoc. 2018, 51, 395–404. (In Korean) [Google Scholar]
- Wright, D.B.; Bosma, C.D.; Lopez-Cantu, T. U.S. Hydrologic Design Standards Insufficient Due to Large Increases in Frequency of Rainfall Extremes. Geophys. Res. Lett. 2019, 46, 8144–8153. [Google Scholar] [CrossRef]
- Department for Environment Food and Rural Affairs (Defra). Government Response to the Climate Change Committee; Department for Environment Food and Rural Affairs (Defra): London, UK, 2023. [Google Scholar]
- Ministry of Agriculture, Forestry and Fisheries (MAFF). Design Standards for Land Improvement Project Plan ‘Farm Roads’; Ministry of Agriculture, Forestry and Fisheries (MAFF): Tokyo, Japan, 2023.
- Environmental Protection Agency (EPA). Anacortes, Washington Rebuilds Water Treatment Plant for Climate Change; Environmental Protection Agency (EPA): Washington, DC, USA, 2023.
- Ministry of Environment (ME). A Study on the Amendment of River Design Standards Considering Climate Change; Ministry of Environment (ME): Tokyo, Japan, 2019.
- Ministry of the Interior and Safety (MOIS). Establishment of Disaster Prevention Performance Targets by Region Considering Future Climate Change Set and Operating Standards; Ministry of the Interior and Safety (MOIS): Sejong-si, Republic of Korea, 2017.
- Jain, A.K. Data Clustering: 50 years beyond K-means. Pattern Recognit. Lett. 2010, 8, 651–666. [Google Scholar] [CrossRef]
- Lloyd, S. Least Squares Quantization in PCM. IEEE Trans. Inf. Theory 1982, 28, 129–137. [Google Scholar] [CrossRef]
- MacQueen, J. Some Methods for Classification and Analysis of Multivariate Observations. In Proceedings of the Fifth Berkeley Symposium on Mathematical Statistics and Probability, Berkeley, CA, USA, 21 June–18 July 1965; Volume 1, pp. 281–297. [Google Scholar]
- Li, L.; Hansman, R.J.; Palacios, R.; Welsch, R. Anomaly detection via a Gaussian Mixture Model for flight operation and safety monitoring. Transp. Res. Part C Emerg. Technol. 2016, 64, 45–57. [Google Scholar]
- Shahapure, K.R.; Nicholas, C. Cluster Quality Analysis Using Silhouette Score. In Proceedings of the 2020 IEEE 7th International Conference on Data Science and Advanced Analytics (DSAA), Sydney, Australia, 6–9 October 2020; pp. 747–748. [Google Scholar]
- Shutaywi, M.; Kachouie, N.N. Silhouette Analysis for Performance Evaluation in Machine Learning with Applications to Clustering. Entropy 2021, 23, 759. [Google Scholar] [CrossRef] [PubMed]
- Caliński, T.; Harabasz, J. A dendrite method for cluster analysis. Commun. Stat. 1974, 3, 1–27. [Google Scholar]
- Milligan, G.W.; Cooper, M.C. An examination of procedures for determining the number of clusters in a data set. Psychometrika 1985, 50, 159–179. [Google Scholar] [CrossRef]
- Akaike, H. Information theory and an extension of the maximum likelihood principle. In Selected Papers of Hirotugu Akaike; Springer: New York, NY, USA, 1973; pp. 277–291. [Google Scholar]
- Burnham, K.P.; Anderson, D.R. Advanced Issues and Deeper Insights. In Model Selection and Multimodel Inference: A Practical Information-Theoretic Approach; Springer: New York, NY, USA, 2002; pp. 267–351. [Google Scholar]
- Schwarz, G. Estimating the dimension of a model. Ann. Stat. 1978, 6, 461–464. [Google Scholar] [CrossRef]
Disclaimer/Publisher’s Note: The statements, opinions and data contained in all publications are solely those of the individual author(s) and contributor(s) and not of MDPI and/or the editor(s). MDPI and/or the editor(s) disclaim responsibility for any injury to people or property resulting from any ideas, methods, instructions or products referred to in the content. |
© 2025 by the authors. Licensee MDPI, Basel, Switzerland. This article is an open access article distributed under the terms and conditions of the Creative Commons Attribution (CC BY) license (https://creativecommons.org/licenses/by/4.0/).