Abstract
Water scarcity is predicted to intensify due to climate change, population growth, and industrial expansion. This poses serious problems for long-term food safety and agricultural sustainability. This field experiment involved varying the sowing times three times (advance, normal and delayed seed sowing) and the irrigation water levels three times, with three replications. The result shows the maximum height of the plant, length of the tip, number of grains per tip, and grain production (5063 kg ha−1) were achieved via regular planting with sufficient irrigation (T1). Although the output was somewhat reduced (2–3%), the treatment of water irrigation with the deficit (T2, T3) improved the plant level water use efficiency by 10–23%and reduced the trace of blue water by 12–28%. T3 had the lowest blue water track (736 m3 t−1). Conversely, advance and delayed seed sowing combined with deficit irrigation significantly reduced yield up to 14% and increased blue water footprint under full irrigation. Economic analysis revealed that T1 provided the highest net income (Rs: 376,284 ha−1), while T2 and T3 retained 97–98% as compared to the advance seed sowing with well water, while improving water productivity. Therefore, it is concluded that the normal sowing with a 15–30% irrigation deficit enhances water productivity without substantial yield losses, providing a climate-adaptive approach for wheat production in water-scarce regions.
1. Introduction
Water scarcity has become a critical concern across South Asia, where many regions are experiencing severe water shortages. Due to population pressure, industrial expansion, and climate change, the situation will only worsen in the years to come [1,2]. Since agriculture uses around 70% of blue water, this might have major effects on the region’s long-term food security and agricultural sustainability [3]. Similarly, as agriculture continues to be the greatest freshwater consumer in the world, its usage is becoming crucial to food security. One cannot stress the significance of water in population increase and economic development. The availability of clean irrigation water is a worldwide concern. In many arid and semi-arid parts of the world, irrigation water resources are running low. In semi-arid and dry areas, groundwater has emerged as a significant irrigation supply due to the scarcity of surface water. Groundwater levels are steadily dropping, and the overuse of these finite water supplies has made it necessary to create water-saving techniques (such as deficit irrigation) to increase agricultural output and irrigation water efficiency. Poor irrigation management techniques have also led to extremely low agricultural water usage efficiency, which persists today and exacerbates the water issue. Therefore, increasing the irrigation water productivity of various crops cultivated in semi-arid locations, such wheat or grain crops, is necessary to enhance the management and consumption of soil water.
Over the past twenty years, the idea of water footprint (WF) has been widely applied to the management of freshwater resources. WF is a measure of the quantity of water used to grow particular crops and other goods. Blue water is freshwater from rivers, lakes, and aquifers used for irrigation, whereas green water is rainwater that is held in soil and used by crops. The cultivation of wheat and rice, for example, is responsible for around 45% of the blue WF, making them major users of water worldwide [4]. According to research, the effects of climate change on water demand and wheat grain output has caused the blue WF to rise by 4% [5]; therefore, sowing times and irrigation water level strategies still need further investigation, such as in the Sindh, Pakistan.
In Pakistan, a lot of wheat varieties that are high yielding and moderately early maturing are planted. According to Bokhari et al. [6], the irrigated wheat crop in Pakistan is typically harvested in April after being planted between November and December, depending on how long the previous crop was in rotation. When crops such as rice, cotton, sugarcane, pigeon pea, or potato are grown before wheat, the sowing of wheat is usually delayed. This late planting often requires a greater number of irrigations, as the crop experiences low temperatures during the establishment stage and high temperatures during the reproductive phase [7]. Due to its exposure to unfavorable meteorological conditions, particularly maximum and minimum temperatures, which are critical in determining the crop’s productivity and output, late-planted wheat clearly suffers from a yield penalty [8]. Grain yield can be significantly reduced by even a single day of exposure to unusually high temperatures during the grain filling process. Both the rate and duration of grain filling are adversely affected when temperatures exceed 30 °C during the reproductive stage, and such terminal heat stress ultimately leads to a substantial reduction in wheat yield [9]. On the other hand, early-planted wheat yields more since it is not at risk of terminal heat stress [10]. Later phases of late-planted wheat may experience higher temperatures, which might increase evapotranspiration losses and lengthen the need for irrigation and water footprints. Under the changing climate, adjusting the planting times might be a suitable and economical adaptation approach, particularly to prevent the detrimental effects of terminal heat stress on yield and blue water usage [11]. Numerous short-term and on-station experiments on changes in the wheat planting season have been conducted in a variety of agro-ecologies [12]; nevertheless, there is a dearth of data regarding actual on-farm circumstances. The effects of changing the planting timing on yield and water footprints across yearly weather changes are also unknown. Experiments on such features are costly and time-consuming, but necessary in order to observe the impact of such changes in sowing dates under long-term climatic circumstances. Furthermore, there is a lack of information on the performance of the most important wheat crop in practical on-farm settings with variable planting times and inadequate irrigation water. However, complex interactions between sowing dates, environmental factors, and crop physiology are crucial for developing adaptive management strategies that can sustain wheat productivity amidst changing climatic conditions. As climate change continues to pose unprecedented challenges, research efforts must prioritize cost-effective, scalable solutions that empower farmers to make informed decisions and enhance the resilience of wheat production systems globally. In light of the above facts and figures, this study was conducted to assess the effect sowing time variations and irrigation water levels on the growth and yield of wheat crops, and its blue water footprints.
2. Materials and Methods
This field study was conducted during the 2023–24 cropping season at the experimental station of department of Irrigation and Drainage, Faculty of Agricultural Engineering and Technology, Sindh Agriculture University, Tandojam (Figure 1). Figure 2 shows the average monthly minimum and maximum air temperatures, wind speed, relative humidity, and rainfall recorded during the study period.
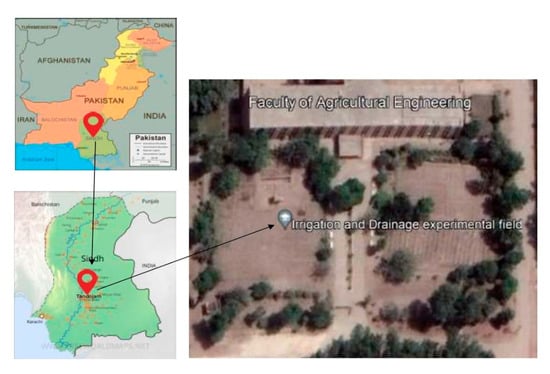
Figure 1.
Bird eye view of experimental site.
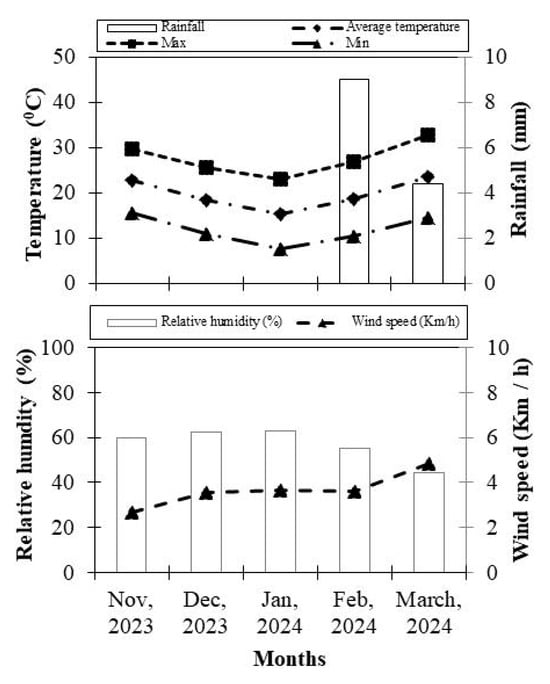
Figure 2.
Weather conditions in Tandojam during November 2023 to March 2024.
2.1. Treatment and Arrangement
The experimental study was conducted using a Randomized Complete Block Design (RCBD) with three sowing periods and three irrigation water levels, each replicated three times. A total of nine combined treatments were set up, and the experimental design is shown in Table 1. A total of 27 subplots were prepared for the experiment, each with an average field size of 4 m in width and 4 m in length. The basin irrigation method was used for growing the wheat crop, and an additional wheat crop was sown in the surrounding buffer zone to maintain uniform environmental conditions at the experimental site.
- Factor-A: Sowing time variations = 03
- SD1 = 15 days in advance
- SD2 = Normal sowing time (actual sowing time of 1st November in the local field)
- SD3 = 15 days in delay
- Factor-B: Irrigation water levels = 03
- CW = Control water (existing irrigation practice 75 mm)
- DW1 = Deficit water (15% deficit existing irrigation practice at each irrigation (63.75 mm))
- DW2 = Deficit water (30% deficit existing irrigation practice at each irrigation (52.5 mm))

Table 1.
Treatment arrangements (sowing times and irrigation water treatments).
Table 1.
Treatment arrangements (sowing times and irrigation water treatments).
| Sowing Time | Irrigation Water Levels | Treatments |
|---|---|---|
| Factor-A | Factor-B | |
| SD1 | CW | T1 |
| DW1 | T2 | |
| DW2 | T3 | |
| SD2 | CW | T4 |
| DW1 | T5 | |
| DW2 | T6 | |
| SD3 | CW | T7 |
| DW1 | T8 | |
| DW2 | T9 |
2.2. Land Preparation, Cultural Practices, and Soil Water Properties
A moldboard plow was used to completely plow the whole study area. A disk harrow was used to crush the resultant clods, and a laser leveler was used to level them. Before experiment, the plot was divided into 24 subplots; the entire plot was level. After applying a 100 mm soaking doze to the entire field, the board costing sowing method was used on various sowing dates based on the treatments. In this study, a popular TD-1 wheat crop variety was chosen. Nonetheless, fertilizer applications were applied in accordance with guidelines. During the experiment period, groundwater was utilized for irrigation at the experimental location in order to assess the water quality. Every time, water samples were gathered and brought to the lab to measure the irrigation’s pH and EC. The average water quality is shown in Table 2. Before the experiment, composite soil samples were taken from each plot at soil depths of 0–20, 20–40, 40–60, 60–80, and 80–100 cm, and the average values are presented in Table 3.
Table 2.
Average electrical conductivity and pH of irrigation water.
Table 3.
Initial basic properties of soil profile 0–100 cm depth.
2.3. Irrigation Plan and Measurement
The irrigation scheduling was based on the soil moisture, and each irrigation application was carried out as shown in Figure 3, along with the treatments (irrigation scheduling prepared via DRIP, Tandojam). The flow meter was used to supply the required depth of irrigation water. The amount of irrigation water used and the soil moisture deficit from the first to the last growth stage are shown for the experimental period in Table 4.
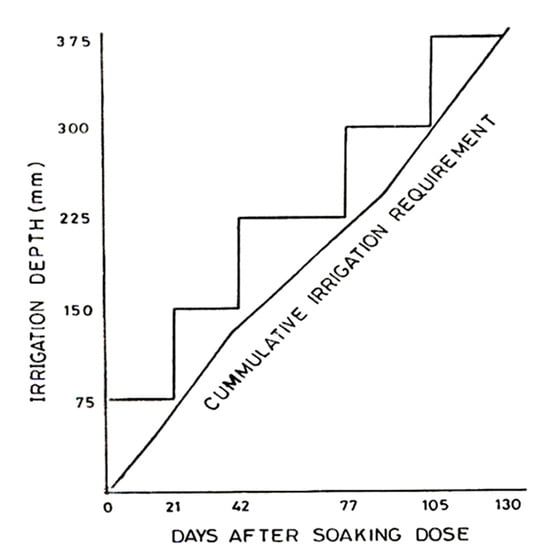
Figure 3.
Irrigation scheduling for wheat.
Table 4.
Total volume of irrigation water used, the soil water deficit, and total water consumed in the different treatments during base period of wheat crop.
2.4. Measurement and Analysis
Measurements of various crop growth parameters were taken every 15 days during this planned study period. Plants were chosen and tagged under each of the planned treatments [13,14]. As soon as the crop was harvested, roots from a 20 cm × 30 cm region in a soil profile 0–30 cm deep were sampled in order to determine how the water stress affected the plants’ root growth. To determine dry root biomass, the roots were separated by the soil, washed, and then dried in an oven set at 75 °C for 60 h. Root density was calculated as the ratio of root dry weight to the sampled area. The aboveground dry biomass divided by the total water consumption was used to calculate the plant level water use efficiency (WUEP) [15]. Plant level water use efficiency was calculated as the aboveground dry biomass per total water consumption. To estimate profitability, the gross return was divided by the cultivation cost to calculate the net return. The blue water footprint was subsequently derived using the following formula:
The field-collected data were statistically analyzed using ANOVA (analysis of variance) techniques following RCBD with three replicated plot arrangements under field trials, using an Excel spreadsheet and an SPSS package (SPSS version 22.0, SPSS Inc, Chicago, IL, USA).
3. Results
The water scarcity situation is expected to worsen in the coming years due to climate change, population growth, and industrial development. These challenges could have significant consequences for agricultural sustainability and long-term food availability. In this context, there is an urgent need to adopt new practices, such as adjusting sowing dates for wheat crops and improving soil water management in regions with limited water resources.
3.1. Plant Height and Spike Length
The plant height of the wheat crop was significantly affected by the different sowing dates and deficit water levels (Figure 4). The highest plant height was measured in T4 at 107.2 cm, while the lowest measured was in T3 at 81.4 cm. However, the average plant height decreased by 22.5%, 26.2%, 31.7%, 7.5%, 5.3%, 0.4%, 3.5%, and 4.5% under T1, T2, T3, T5, T6, T7, T8, and T9, respectively, compared to the normal sowing time and control water treatment (T4). Across the sowing dates, the plant height was highest after the control water treatment (existing irrigation practice) and lowest after the deficit water treatment (30% deficit in the existing irrigation practice). Similarly, when the actual sowing time was compared with sowing 15 days in advance or sowing delayed by 15 days, the actual sowing time treatment produced substantially increased plant height, with increases of 17.8% or 1.4%, respectively. Moreover, statistical analysis showed that both sowing dates and irrigation water levels significantly influenced the plant height of wheat. The spike length of the wheat crop was significantly affected by different sowing dates and deficit water levels (Figure 4). The highest spike length was recorded in T4 at 14.2 cm, while the lowest was in T3 at 12.4 cm. However, the average spike length decreased by 2%, 8%, 14%, 13%, 9%, 1%, 10%, and 11% under T1, T2, T3, T5, T6, T7, T8, and T9, respectively, compared to T4. Across the sowing dates of the wheat crop, the spike length was highest under the control water treatment (existing irrigation practice) and lowest under deficit water treatment (30% deficit in the existing irrigation practice). Similarly, when the actual sowing time was compared with sowing 15 days in advance or sowing delayed by 15 days, the actual sowing time treatment produced substantially increased spike lengths, with increases of 0.6% or 0.9%, respectively. Moreover, statistical analysis showed that sowing dates had a non-significant effect, while irrigation water levels significantly influenced the spike length of wheat.
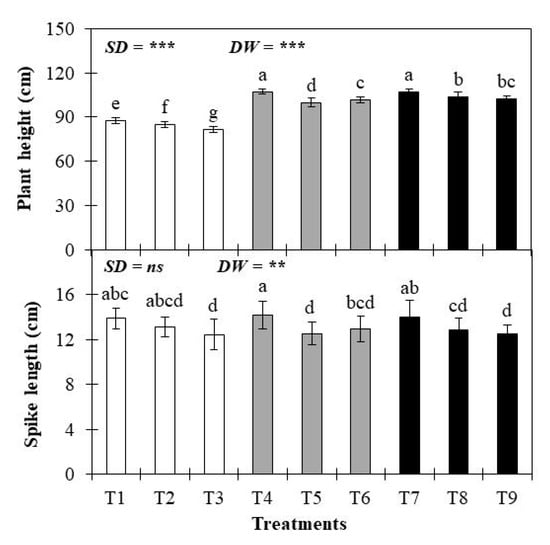
Figure 4.
Plant height and spike length of wheat crop as affected by treatments. The error bars correspond to standard errors, and treatment means followed by different letters are significantly different at the 0.05 significance level, as determined by Duncan’s multiple range test; *** and ** indicate significance at the p < 0.001 and p < 0.01 levels, respectively, while ns denotes a non-significant difference. The values are means ± SE (n = 3).
3.2. Test Weight, Dry Biomass, and Grain Yield
Table 5 presents the test weight, dry biomass, and seed yield of the wheat crop, determined from the harvested samples collected from the experimental plots. Moreover, statistical analysis showed that sowing dates and irrigation water levels significantly influenced the test weight of wheat. The test weight of the wheat seeds was significantly affected by different sowing dates and by deficit water levels. The maximum test weight was found in T5, while the minimum was in T9. However, the average test weight increased by 5.7% in the T5 treatment, and decreased by 10%, 6.5%, 17.9%, 3.1%, 18%, 20%, and 26.9% under T1, T2, T3, T6, T7, T8, and T9, respectively, compared to T4. Similarly, when the actual sowing time was compared with sowing 15 days in advance or sowing delayed by 15 days, the actual sowing time treatment resulted in substantially increased test weights, with increases of 11% or 18.5%, respectively. On the other hand, the dry biomass of the wheat crop was significantly affected by different sowing dates and deficit water levels (Table 5). The highest dry biomass was measured in T5 at 6932 kg ha−1, while the lowest was measured in T9 at 6376 kg ha−1. However, the average dry biomass increased by 1% in the T5 treatment, and decreased by 1%, 2%, 5%, 1%, 2%, 6%, and 8% under T1, T2, T3, T6, T7, T8, and T9, respectively, compared to the normal sowing time and control water treatment (T4). Across the sowing dates of the wheat crop, the dry biomass was highest under the control water treatment (existing irrigation practice) and lowest under the deficit water treatment (30% deficit in the existing irrigation practice) with expected normal sowing dates and different irrigation water levels. Similarly, when the actual sowing time was compared with sowing 15 days in advance or sowing delayed by 15 days, the actual sowing time treatment produced substantially increased dry biomass, with increases of 2.5% or 4.9%, respectively. Moreover, statistical analysis showed that sowing dates and irrigation water levels significantly influenced dry biomass.
Table 5.
Test weight, biomass, and seed yield of wheat crop as affected by different treatments throughout the growing season. The values are means ± SE (n = 3). Treatment means followed by different letters are significantly different at the 0.05 significance level, as determined by Duncan’s multiple range test.
The harvested grain yield of the wheat crop was significantly affected by different sowing dates and by deficit water levels (Table 5). The highest grain yield was recorded in T4 at 5063 kg ha−1, while the lowest was in T9 at 4453 kg ha−1. However, the average grain yield decreased by 9%, 10%, 11%, 2%, 3%, 11%, 10%, and 14% under T1, T2, T3, T5, T6, T7, T8, and T9, respectively, compared to T4. Across the sowing dates of the wheat crop, the grain yield was highest under the control water treatment (existing irrigation practice) and lowest under deficit water treatment (30% deficit in the existing irrigation practice). Similarly, when the actual sowing time was compared with sowing 15 days in advance or sowing delayed by 15 days, the actual sowing time treatment produced substantially increased grain yield, with increases of 7.5% or 8.9%, respectively. Moreover, statistical analysis showed that sowing dates had a non-significant effect, while irrigation water levels significantly influenced the grain yield of wheat.
3.3. Root Development
The root development of the wheat crop was significantly affected by different sowing dates and by deficit water levels (Figure 5). The largest root development was recorded in T5, while the smallest was recorded in T7. However, the average root development increased by 1%, 3%, 5%, and 3% under T1, T3, T5, and T6, and decreased by 6%, 54%, 41%, and 26% under T2, T7, T8, and T9, respectively, compared to the normal sowing time and control water treatment (T4). Across the sowing dates, root development was greatest under the deficit water treatment (30% deficit in the existing irrigation practice) compared to the control water treatment (existing irrigation practice). Similarly, when the actual sowing time was compared with sowing 15 days in advance or sowing delayed by 15 days, the actual sowing time treatment resulted in substantially increased root development, with increases of 3% or 30.1%, respectively.
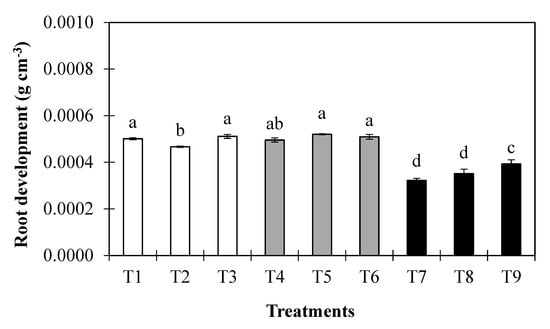
Figure 5.
Root development of wheat crop, as affected by different treatments throughout the growing season.
3.4. Plant Level WUE and Water Footprints
Figure 6 shows that plant level water use efficiency (WUEp) increased with greater water stress under all sowing treatments. Moreover, statistical analysis indicated that sowing dates and irrigation water levels significantly influenced the plant level water use efficiency in wheat crops. The highest plant level water use efficiency was found in T6 at 1.87 kg m−3, while the lowest was in T7 at 1.42 kg m−3. The average plant level water use efficiency increased by 10%, 20%, 13%, 23%, 7%, and 18% in the T2, T3, T4, T6, T8, and T9 treatments, respectively, while it decreased by 1% and 2% under T1 and T8, respectively, compared to T4. Similarly, when the actual sowing time was compared with sowing 15 days in advance or sowing delayed by 15 days, the actual sowing time treatment resulted in substantially increased plant level water use efficiency, with increases of 2.5% or 5%, respectively. Moreover, the blue water footprint of the wheat crop was significantly affected by different sowing dates and by deficit water levels (Figure 7), and it decreased with increased water stress. The increased blue water footprint was calculated in T7 at 1.04 m3 Kg−1, while the lowest was calculated in T6 at 0.74 m3 Kg−1. The average blue water footprint increased by 8% and 10% in the T1 and T7 treatments, respectively, and decreased by 4%, 18%, 12%, 28%, 4%, and 15% under T2, T3, T5, T6, T8, and T9, respectively, compared to the normal sowing time and control water treatment (T4). Across the sowing dates of the wheat crop, the blue water footprint increased under the control water treatment (existing irrigation practice) and was lowest under the deficit water treatment (30% deficit in the existing irrigation practice) with expected normal sowing dates and different irrigation water levels. Similarly, when the actual sowing time was compared with sowing 15 days in advance or sowing delayed by 15 days, the actual sowing time treatment resulted in substantially increased blue water footprints, with increases of 8.1% or 9.8%, respectively. Moreover, statistical analysis showed that sowing dates and irrigation water levels significantly influenced blue water footprints.
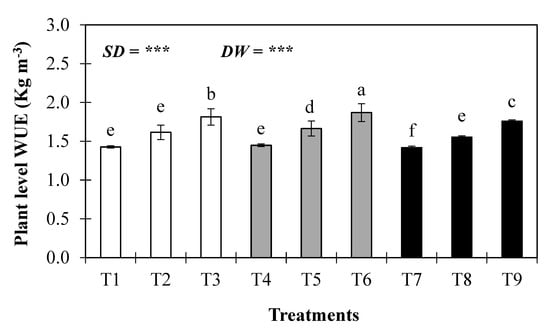
Figure 6.
Plant level water use efficiency of wheat crop, as affected by treatments. *** indicate significance at the p < 0.001 level. The values are means ± SE (n = 3).
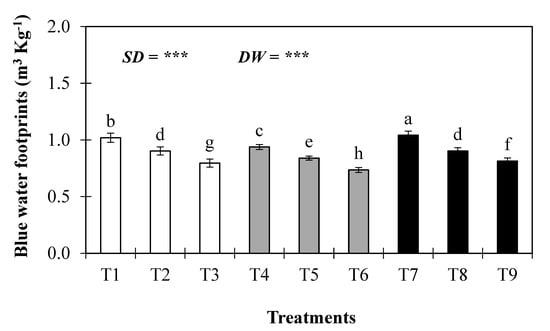
Figure 7.
Blue water footprints of wheat crop, as affected by different sowing dates and deficit water levels. *** indicate significance at the p < 0.001 level. The values are means ± SE (n = 3).
3.5. Economic Cost
The different sowing dates of wheat, irrigation doses, and labor costs under different treatments are presented in Table 6. The highest output value, in rupees, was estimated in T4 at Rs. 506,304, while the lowest was estimated in T9 at Rs. 445,280. The average net income decreased by 12%, 14%, 16%, 3%, 4%, 16%, 14%, and 19% under T1, T2, T3, T5, T6, T7, T8, and T9, respectively, compared to the normal sowing time and control water treatment (T4).
Table 6.
Economic benefits (rupees ha−1) of wheat production under different treatments (sowing dates and deficit irrigation water).
4. Discussion
The late planting of wheat subjects the crop to lower temperatures during its initial establishment and higher thermal stress at the reproductive phase, consequently necessitating additional irrigations [7]. The plant height of the wheat crop was significantly influenced by sowing dates and irrigation levels (Figure 4). The highest plant height was recorded in those with a normal sowing time and with control irrigation, while the lowest was observed in those with advanced sowing and deficit irrigation, representing a 22% reduction in plant height under both these treatments. These results align with prior research, emphasizing the critical role of normal sowing times and adequate irrigation in wheat growth. Soulé et al. [16] reported that wheat sown on November 15th achieved a plant height of 98 cm, and this declined with delayed sowing dates. Similarly, Fazily and Habibi [17] observed that sowing wheat around mid-November resulted in significantly taller plants compared to earlier or later sowing dates. These studies reinforce the importance of sowing time alignment with favorable climatic conditions for maximizing growth. In contrast, greater depletion levels led to reduced growth, demonstrating the adverse effects of water stress on wheat development. This study demonstrates that wheat spike length is significantly influenced by irrigation water levels, while sowing dates have a non-significant effect (Figure 4). Across the treatments, the average spike length decreased by 1–14% compared to T4, highlighting the significant role of water availability in promoting normal wheat development. Our findings coincided with Baloch et al. [18], who found that early sowing, on 16 October, produced spikes averaging 11.04 cm, while later sowing, on 30 October, resulted in slightly smaller spikes (10.91 cm). Furthermore, sowing in December or later resulted in even shorter spikes (9.4 cm), suggesting that both delayed sowing and water stress can have cumulative negative effects on wheat growth. This observation aligns with our results, which showed that optimal irrigation under T4 contributed to the greatest spike length, demonstrating the importance of consistent water availability in enhancing wheat growth. While deficit irrigation strategies are crucial for water conservation, our results underscore the potential trade-offs in yield and crop performance, particularly in water-scarce regions. Finally, Zhang et al. [19] emphasized that water stress, particularly during the flowering and grain-filling stages, significantly reduces wheat yields. The 14% reduction in spike length observed in our study under deficit irrigation supports their findings, reinforcing the importance of ensuring adequate water availability during critical reproductive stages to maintain optimal wheat growth.
Under different treatments, the seed index, dry biomass, and seed yield of the wheat crop were affected significantly (Table 5). The variation in test weight aligns with findings by Iqbal et al. [20], who observed that normal sowing and irrigation conditions result in heavier seeds due to enhanced grain filling. Deficit irrigation during the reproductive stage likely caused insufficient translocation of photosynthates to the grains, reducing test weight, as highlighted by Zhang et al. [19] (2017). Late sowing, as in T9, shortened the grain-filling period due to higher temperatures during later growth stages, leading to poor seed development, as noted by Foulkes et al. [21]. These results underscore the detrimental effects of water stress and improper sowing times on seed quality. Dry biomass was also significantly affected, with the highest value recorded at 6932 kg ha−1 in T5 and the lowest at 6376 kg ha−1 in T9, showing an 8% reduction. Statistical analysis indicated that irrigation levels played a more prominent role than sowing dates. The reduction in dry biomass under deficit irrigation can be attributed to limited water availability, which reduces photosynthetic rates and nutrient uptake, as discussed by Chai et al. [22]. Early sowing (T1 and T2) or late sowing (T9) likely caused suboptimal growth conditions, either from low temperatures during early development or high temperatures during later growth phases, resulting in lower biomass production, as supported by Mahboob et al. [23]. Dry biomass was highest under the control irrigation, demonstrating the importance of water availability during vegetative growth stages, as observed by Lobell et al. [24], who reported that water stress reduces leaf area, chlorophyll content, and overall biomass accumulation. However, grain yield was highest under the control irrigation and the normal sowing time, while early and late sowing reduced yield by 7.5% and 8.9%, respectively. Water stress, as observed in T3 and T9, causes kernel abortion and reduced grain size, which are primary contributors to yield loss, as reported by Zhang et al. [19]. Additionally, late sowing exposes the crop to higher terminal heat stress during critical grain-filling stages, further exacerbating yield reduction, as noted by Fischer et al. [25]. Furthermore, delayed sowing (T9) resulted in shortened growth periods, reducing the time available for vegetative and reproductive development. This aligns with the work of Roudier et al. [26], who found that delayed sowing, compounded by water stress, leads to reduced yields in wheat, due to limited biomass production and poor grain filling.
The plant level water use efficiency (WUEp) of wheat was significantly influenced by sowing dates and irrigation water levels (Figure 6). The increased WUEp observed in T6 suggests that moderate water stress can optimize water use efficiency by promoting more conservative water use and maximizing transpiration for biomass production. These findings are consistent with the work of Farooq et al. [27], who observed that mild water stress improves water use efficiency by enhancing root development and water absorption. On the other hand, excessive water stress in T7 (late sowing with deficit irrigation) led to reduced WUEp due to limited transpiration, inefficient water utilization, and decreased grain yield. This finding highlights the need for balanced water use to avoid wasting resources while maintaining crop productivity. Moreover, certain irrigation treatments enhanced soil water consumption and antioxidant activities in wheat, suggesting that moderate water stress can be beneficial for improving water use efficiency.
The blue water footprint of wheat, representing freshwater consumption during crop production, was significantly influenced by sowing dates and irrigation water levels (Figure 7). The highest blue water footprint was associated with the control irrigation treatment, while deficit irrigation (30% deficit) led to a lower water footprint. This finding is consistent with Chukalla et al. [28], who noted that deficit irrigation reduces water use without drastically affecting crop yield. The timing of sowing also influenced the blue water footprint, with both early (T1) and late (T7) sowing increasing water consumption compared to normal sowing. When comparing the actual sowing time to sowing 15 days earlier or later, the actual sowing time resulted in a significantly increased blue water footprint, with increases of 8.1% and 9.8%, respectively. This supports findings by Zhang et al. [29], who observed that adjusting planting dates can significantly impact blue water use, with each delay increasing water use by up to 2.0 mm. These results emphasize the importance of optimizing both sowing dates and irrigation practices to reduce water footprints while maintaining crop productivity. With increasing concerns about water scarcity, strategic irrigation scheduling and sowing time management are crucial for sustainable wheat production.
5. Conclusions
The results of current field trail confirmed that sowing times and irrigation water levels significantly affected wheat growth, yield, plant level water use efficiency, blue water footprint, and net return. The largest plant height was measured in T4 at 107.2 cm, while the lowest measured was in T3 at 81.4 cm. A similar trend was observed in grains per spike. Normal sowing with full irrigation produced the maximum grain yield (5063 kg ha−1), while deficit irrigation improved WUEp by up to 23%, with only a minor yield reduction (2–3%). Similarly, when the actual sowing time was compared with sowing 15 days in advance or sowing delayed by 15 days, the actual sowing time treatment resulted in substantially increased plant level water use efficiency, with increases of 2.5% or 5%, respectively. The average blue water footprint increased by 8% and 10% in the T1 and T7 treatments, respectively. Economic analysis indicated that moderate deficit irrigation retained 97–98% of the maximum net income (Rs: 376,284 ha−1), making it a viable strategy for improving water productivity without substantial economic losses. The results show that the normal sowing times with a 15–30% irrigation deficit optimizes wheat productivity while significantly reducing water consumption.
Author Contributions
Conceptualization, X.Y., R.K.S. and L.S.; methodology, R.K.S. and I.A.S.; software, M.A.T.; validation, L.B. and F.A.C.; investigation, L.S.; writing—original draft preparation, R.K.S. and L.S.; writing—review and editing, M.A.T. and F.A.C.; funding acquisition, X.Y. All authors have read and agreed to the published version of the manuscript.
Funding
This research was funded by the Excellent Youth Teacher Project of the Qinglan Engineering in Jiangsu Province, Jiangsu Province Industry–University Research Project BY20221125.
Data Availability Statement
The original contributions presented in this study are included in the article. Further inquiries can be directed to the corresponding authors.
Conflicts of Interest
The authors declare no conflicts of interest.
References
- Vinke, K.; Martin, M.A.; Adams, S.; Baarsch, F.; Bondeau, A.; Coumou, D.; Svirejeva-Hopkins, A. Climatic Risks and Impacts in South Asia: Extremes of Water Scarcity and Excess. Reg. Environ. Change 2017, 17, 1569–1583. [Google Scholar] [CrossRef]
- Sharma, K.L.; Sharma, S.C.; Bawa, S.S.; Singh, S.; Chandrika, D.S.; Sharma, V.; Khokhar, A.; Grace, J.K.; Rao, C.S.; Sankar, G.R.M.; et al. Combined Effect of Tillage and Organic Fertilization on Soil Quality Key Indicators and Indices in Alluvial Soils of Indo-Gangetic Plains under Rainfed Maize–Wheat System. Arch. Agrono. Soil Sci. 2015, 61, 313–327. [Google Scholar] [CrossRef]
- Grindle, A.K.; Siddiqi, A.; Anadon, L.D. Food Security Amidst Water Scarcity: Insights on Sustainable Food Production from Saudi Arabia. Sustain. Prod. Cons. 2015, 2, 67–78. [Google Scholar]
- Mekonnen, M.M.; Hoekstra, A.Y. The Green, Blue and Grey Water Footprint of Crops and Derived Crop Products. Hydrol. Earth Syst. Sci. 2011, 15, 1577–1600. [Google Scholar] [CrossRef]
- Govere, S.; Nyamangara, J.; Nyakatawa, E.Z. Climate Change Signals in The Historical Water Footprint of Wheat Production in Zimbabwe. Sci. Total Environ. 2020, 742, 140473. [Google Scholar] [CrossRef] [PubMed]
- Bokhari, S.A.A.; Rasul, G.; Ruane, A.C.; Hoogenboom, G.; Ahmad, A. The Past and Future Changes in Climate of The Rice-Wheat Cropping Zone in Punjab, Pakistan. Pak. J. Meteorol. 2017, 13, 9–23. [Google Scholar]
- Bana, R.S.; Sepat, S.; Rana, K.S.; Pooniya, V.; Choudhary, A.K. Moisture-Stress Management Under Limited and Assured Irrigation Regimes in Wheat (Triticum aestivum): Effects on Crop Productivity, Water Use Efficiency, Grain Quality, Nutrient Acquisition and Soil Fertility. Indian J. Agric. Sci. 2018, 88, 1606–1612. [Google Scholar] [CrossRef]
- Mishra, A.; Singh, R.; Raghuwanshi, N.S.; Chatterjee, C.; Froebrich, J. Spatial Variability of Climate Change Impacts on Yield af Rice and Wheat in the Indian Ganga Basin. Sci. Total Environ. 2013, 468, S132–S138. [Google Scholar] [CrossRef]
- Lal, M.K.; Tiwari, R.K.; Gahlaut, V.; Mangal, V.; Kumar, A.; Singh, M.P.; Paul, V.; Kumar, S.; Singh, B.; Zinta, G. Physiological and Molecular Insights on Wheat Responses to Heat Stress. Plant Cell Rep. 2021, 41, 501–518. [Google Scholar] [CrossRef] [PubMed]
- Pathania, R.; Prasad, R.; Rana, R.S.; Mishra, S.; Sharma, S. Growth and Yield of Wheat as Influenced by Dates of Sowing and Varieties in Northwestern Himalayas. J. Pharmacogn. Phytochem. 2018, 7, 517–520. [Google Scholar]
- Suryavanshi, P.; Buttar, G.S. Mitigating Terminal Heat Stress in Wheat. Int. J. Bio-Resour. Stress Manag. 2016, 7, 142–150. [Google Scholar] [CrossRef]
- Dubey, R.; Pathak, H.; Singh, S.; Chakravarti, B.; Thakur, A.K.; Fagodia, R.K. Impact of Sowing Dates on Terminal Heat Tolerance of Different Wheat (Triticum aestivum L.) Cultivars. Natl. Acad. Sci. Lett. 2019, 42, 445–449. [Google Scholar] [CrossRef]
- Soothar, R.K.; Wang, C.; Li, L.; Cui, N.; Zhang, W.; Wang, Y. Soil Salt Accumulation and Crop Physiological Responses of Winter Wheat to Supplementary Alternate Irrigation with Saline and Fresh Water at Different Crop Growth Stages in the NCP. J. Soil Sci. Plant Nutr. 2021, 21, 2072–2082. [Google Scholar] [CrossRef]
- Soothar, R.K.; Zhang, W.; Liu, B.; Tankari, M.; Wang, C.; Li, L.; Xing, H.; Gong, D.; Wang, Y. Sustaining Yield of Winter Wheat under Alternate Irrigation using Saline Water at Different Growth Stages: A Case Study in the North China Plain. Sustainability 2019, 11, 4564. [Google Scholar] [CrossRef]
- Katohar, I.; Soothar, R.K.; Chandio, F.A.; Talpur, M.A.; Soomro, S.A.; Singha, A.; Bin, L.; Mirjat, M.U. Drought Priming and Subsequent Irrigation Water Regimes Enhanced Grain Yield and Water Productivity of Wheat Crop. Water 2023, 15, 3704. [Google Scholar] [CrossRef]
- Soulé, A.M.; Mansur, A.B.; Mainassara, Z.A.; Salami, I.; Souley, S. Effect of Sowing Date and Irrigation Frequency on Wheat (Triticum aestivium L.) Production in Southern Niger Republic. J. Agric. Ecol. Res. Int. 2024, 25, 12–20. [Google Scholar] [CrossRef]
- Fazily, T.; Habibi, A. Performance of Wheat Varieties under Different Dates of Sowing under Irrigated Condition of Baghlan Province, Afghanistan. Int. J. Emerg. Technol. Innov. Res. 2019, 6, 50–53. [Google Scholar]
- Baloch, S.U.; Li-Jun, L.I.U.; Kandhroo, M.N.; Fahad, S.; Sabiel, S.A.; Baloch, S.K.; Badini, S.A. Effect of Different Irrigation Schedules on The Growth and Yield Performance of Wheat (Triticum aestivum L.) Varieties Assessment in District Awaran (Balochistan). J. Biol. Agric. Healthc. 2014, 4, 5–17. [Google Scholar]
- Zhang, X.; Qin, W.; Chen, S.; Shao, L.; Sun, H. Responses of Yield and WUE of Winter Wheat to Water Stress During the Past Three Decades—A Case Study in the North China Plain. Agric. Water Manag. 2017, 179, 47–54. [Google Scholar] [CrossRef]
- Iqbal, R.; Andersen, M.N.; Raza, M.A.S.; Rashid, M.A.; Salman, A. Physiological Manipulation and Yield Response of Wheat Grown with Split Root System under Deficit Irrigation. Pak. J. Agric. Res. 2019, 32, 514. [Google Scholar] [CrossRef]
- Foulkes, M.J.; Slafer, G.A.; Davies, W.J.; Berry, P.M.; Sylvester-Bradley, R.; Martre, P.; Calderini, D.F.; Griffiths, S.; Reynolds, M.P. Raising Yield Potential of Wheat. III. Optimizing Partitioning to Grain While Maintaining Lodging Resistance. J. Experi. Bot. 2011, 62, 469–486. [Google Scholar] [CrossRef] [PubMed]
- Chai, Q.; Gan, Y.; Zhao, C.; Xu, H.L.; Waskom, R.M.; Niu, Y.; Siddique, K.H. Regulated Deficit Irrigation for Crop Production under Drought Stress. A Review. Agron. Sustain. Develop. 2016, 36, 3. [Google Scholar] [CrossRef]
- Mahboob, W.; Khan, M.A.; Shirazi, M.U.; Faisal, S. Seed Priming Induced High Temperature Tolerance in Wheat by Regulating Germination Metabolism and Physio-Biochemical Properties. Int. J. Agric. Biol. 2018, 20, 2140–2148. [Google Scholar]
- Lobell, D.B.; Schlenker, W.; Costa-Roberts, J. Climate Trends and Global Crop Production since 1980. Science 2011, 333, 616–620. [Google Scholar] [CrossRef] [PubMed]
- Fischer, R.A.; Byerlee, D.; Edmeades, G. Crop Yields and Global Food Security; ACIAR: Canberra, ACT, Australia, 2014; pp. 8–11.
- Roudier, P.; Sultan, B.; Quirion, P.; Berg, A. The Impact of Future Climate Change on West African Crop Yields: What Does the Recent Literature Say? Glob. Environ. Change 2011, 21, 1073–1083. [Google Scholar] [CrossRef]
- Farooq, S.; Hussain, M.; Jabran, K.; Hassan, W.; Rizwan, M.S.; Yasir, T.A. Osmopriming with CaCl2 Improves Wheat (Triticum aestivum L.) Production Under Water-Limited Environments. Environ. Sci. Pollut. Res. 2017, 24, 13638–13649. [Google Scholar] [CrossRef] [PubMed]
- Chukalla, A.D.; Krol, M.S.; Hoekstra, A.Y. Green and Blue Water Footprint Reduction in Irrigated Agriculture: Effect of Irrigation Techniques, Irrigation Strategies and Mulching. Hydrol. Earth Syst. Sci. 2015, 19, 4877–4891. [Google Scholar] [CrossRef]
- Zhang, X.; Zhang, J.; Xue, J.; Wang, G. Improving Wheat Yield and Water-Use Efficiency by Optimizing Irrigations in Northern China. Sustainability 2023, 15, 10503. [Google Scholar] [CrossRef]
Disclaimer/Publisher’s Note: The statements, opinions and data contained in all publications are solely those of the individual author(s) and contributor(s) and not of MDPI and/or the editor(s). MDPI and/or the editor(s) disclaim responsibility for any injury to people or property resulting from any ideas, methods, instructions or products referred to in the content. |
© 2025 by the authors. Licensee MDPI, Basel, Switzerland. This article is an open access article distributed under the terms and conditions of the Creative Commons Attribution (CC BY) license (https://creativecommons.org/licenses/by/4.0/).