Abstract
Wastewater generated by academic institutions poses an environmental burden due to its composition, including household, food-related waste, and potential microcontaminants such as pharmaceutical and laboratory chemicals. This study evaluated wastewater from eleven academic institutions. Horizontal subsurface flow constructed wetlands (HSFCWs) filled with locally sourced volcanic gravel were tested for treatment performance at a selected site, the University of Rwanda, College of Science and Technology (UR-CST). Six HSFCWs operated continuously for four months: two planted with Cyperus latifolius, two with Juncus effusus, and two unplanted. Academic wastewater showed average concentrations of 715 mg/L COD, 54 mg/L NH4+-N, 9 mg/L NO3−-N, and 32 mg/L PO43−-P. A 4-day hydraulic retention time was effective for the treatment process. The HSFCWs achieved removal efficiencies of 69–82% (COD), 66–87% (NH4+-N), 69–90% (NO3−-N), and over 90% for TSS and PO43−-P, emphasizing the strong physical and chemical purification capacity of volcanic gravel as confirmed by XRF analysis. Juncus effusus outperformed Cyperus latifolius in biomass (6667 vs. 4389 g/m2) and nutrient assimilation per unit area, removing 3.75× more TP and 1.46× more TN. The desorption capacity of the substrate enabled potential phosphorus recovery of up to 50%. Volcanic gravel-based CWs offer an effective, low-cost, and sustainable approach to wastewater treatment with potential for nutrient recovery.
1. Introduction
Wastewater management is a global challenge, driven by rapid urbanization, population growth, and various human activities [1]. While large-scale, centralized wastewater treatment plants and other conventional treatment technologies are effective, they demand substantial financial investment, high operating costs, and specialized technical expertise, making them impractical for many regions [2]. This issue is particularly pronounced in many developing countries, especially in Africa, where academic institutions generate large volumes of wastewater due to the high number of students living in boarding school campuses. Universities and colleges contribute substantial amounts of wastewater, which is often unique in composition. In addition to dormitories and cafeterias, institutional infrastructure such as laboratories and research facilities may produce wastewater with varying chemical characteristics [3,4]. For instance, Covenant University in Nigeria, which accommodates approximately 8000 students, generates about 870 m3 of wastewater per day [4]. This type of wastewater contains a complex mixture of organic matter and nutrients such as nitrogen and phosphorus. Additionally, research has indicated that campus wastewater may contain heavy metals like lead, copper, nickel, and iron, as well as pharmaceuticals such as ibuprofen, nicotine, caffeine, diclofenac, and naproxen [5,6].
The presence of these persistent and potentially toxic contaminants distinguishes academic wastewater from typical domestic effluents, necessitating specific and efficient removal mechanisms. Constructed wetlands (CWs) offer a comprehensive and sustainable solution for such complex wastewater, as they integrate multiple physical, chemical, and biological processes, including photodegradation and phytodegradation for removing heavy metals and pharmaceuticals to achieve effective treatment [7].
Direct discharge of untreated or inadequately treated wastewater into nearby water bodies leads to the deterioration of freshwater resources, eutrophication of aquatic ecosystems, and the spread of waterborne diseases, posing potential environmental and public health risks [1]. Given the scale and complexity of wastewater generated in academic institutions, its management requires targeted approaches that account for both domestic and laboratory sources. While some countries have established frameworks to monitor and treat such wastewater, many developing regions still lack the infrastructure and regulatory enforcement necessary to address it effectively. This gap is especially critical in countries like Rwanda, where rapid urbanization and growing student populations in higher education are intensifying the demand for sustainable wastewater management solutions.
Rwanda has started implementing wastewater management systems. However, semi-centralized treatment plants are currently limited to a few big institutions, hotels, and residential estates. The impact remains minimal due to limited enforcement and non-compliance with discharge standards. The country faces significant challenges in wastewater management due to a lack of a centralized sewerage system, financial and infrastructural limitations, resulting in largely unmonitored wastewater discharge. Wastewater management is instead implemented through decentralized systems, including cesspits, septic tanks, and soakaways [8]. These are usually emptied upon reaching capacity, with the collected waste subsequently transported to retention ponds. The retention ponds pose serious environmental pollution and human diseases as a result of wastewater overflow, sink of contaminants in the groundwater, or discharge to the surface water [8].
In fact, diarrheal diseases remain among the major public health concerns in Rwanda, largely driven by the discharge of untreated wastewater and inadequate water, sanitation, and hygiene (WASH) services. In 2015, diarrheal diseases accounted for 18.3% of deaths among children under five, and in 2016, 1232 deaths were directly attributed to diarrhea, with 2306 deaths linked to insufficient WASH conditions [9,10]. Recently, UNICEF-Rwanda reported a WASH-related mortality rate of 25 per 100,000 people, highlighting that 44% of households lack access to basic water supply, 28% lack basic sanitation, and 75% lack basic hygiene services [11]. These alarming statistics highlight the urgent need for developing and implementing appropriate on-site wastewater treatment technologies that can mitigate disease transmission and improve public health in resource-limited settings.
Given the absence of centralized sewage infrastructure and the reliance on on-site treatment systems, Rwanda should prioritize the adoption of affordable decentralized wastewater treatment technologies, especially in densely populated areas. In the context of academic institutions with boarding school settings, decentralized systems offer a practical and sustainable solution for managing the substantial volumes of wastewater generated. In addition, this approach aligns well with the country’s agglomeration policy, which promotes the development of planned, clustered settlements to enhance service delivery and infrastructure efficiency, especially in rural and peri-urban areas [12].
Previous studies have reported that constructed wetlands (CWs) can effectively treat a wide range of pollutants, including organic matter, nutrients, heavy metals, pharmaceuticals, and pathogens. CWs provide a cost-effective and sustainable approach to wastewater treatment by harnessing natural processes involving plants, microorganisms, and substrates to remove contaminants. They are characterized by low installation and maintenance costs and can be easily adapted to diverse environmental conditions, making them a viable solution for wastewater management in low-income settings [13].
However, despite their potential, CW applications in Rwanda remain largely unexplored. At present, the University of Lay Adventists of Kigali (UNILAK) is the only known academic institution operating a CW for wastewater treatment. This large-scale horizontal subsurface flow CW, planted with Cyperus papyrus, has demonstrated effective wastewater treatment, achieving removal rates of 84.9% for COD and 92% for BOD [14]. Moreover, there is a lack of research on using locally available materials, such as substrates and wetland plants, for CW systems in Rwanda [15].
Since the quality of effluent from any on-site wastewater treatment system depends on the characteristics of the influent, understanding the nature of wastewater produced by academic institutions is crucial. However, to our knowledge, no study in Rwanda has characterized wastewater from academic institutions, despite its potential to provide valuable insights into the specific contaminants present. Wastewater samples were collected from different universities and high schools across the country to analyze key parameters. The University of Rwanda, College of Science and Technology (UR-CST), was selected as a case study to evaluate the treatment process. The study’s main objectives were to: (1) characterize wastewater from academic institutions in Rwanda, (2) evaluate the role of substrates (gravel and sand) in enhancing pollutant removal, (3) assess the performance of box-type HFCWs in treating university campus wastewater, (4) compare the pollutant removal efficiencies of Cyperus latifolius and Juncus effusus within the wetland system.
2. Materials and Methods
2.1. Description of Sampling Sites
Eleven institutions were selected to represent diverse geographical regions of Rwanda, with a focus on boarding schools. These schools, where students live on campus, generate a high volume of wastewater from dormitories, kitchens, bathrooms, and laboratories, with relatively consistent daily flows, making them ideal for evaluating typical academic wastewater and developing treatment processes. The sampling was conducted from January to December 2023, with each institution sampled six times throughout the year, once every two months, to capture fluctuations in wastewater characteristics potentially influenced by seasonal and climatic changes. Figure S1 presents a map of Rwanda’s districts with the sampling sites indicated.
Rwanda has a mild, temperate climate with average daytime temperatures around 21 °C and consistent rainfall throughout the year. Seasonal variations, including rainy and dry periods, can influence wastewater flow, pollutant dilution, and microbial activity in constructed wetlands [16]. The districts sampled included Musanze, Rusizi, Ruhango, Nyanza, Huye, Rwamagana, Nyagatare, Muhanga, Nyarugenge, Karongi, and Rubavu, referred to as sites 1 to 10, respectively. Table S1 quantified the total number of students attending or residing in the entire campus for each school, and the number of students at sampled dormitories. The boarding high schools and universities have multiple dormitories with different discharge points.
2.2. Experimental Setup
The experiment was conducted at the University of Rwanda, College of Science and Technology (UR-CST), located in Kigali, Rwanda (coordinates: Lat/Lon: −1.961477/30.064167). UR-CST was chosen as a case study site because it offers a representative mixture of household and laboratory wastewater typical of academic institutions, making it an ideal setting for evaluating constructed wetlands (CWs) as decentralized treatment solutions. Kigali has a tropical climate with stable temperatures averaging between 18 °C and 25 °C year-round. During the experiment, the daily mean temperature was 23 °C, and the average relative humidity was 64.7%.
The experiment was performed on a balcony adjacent to the laboratory. This location allowed the experimental CW units to be exposed to natural sunlight and ambient temperature while shielding them from rainfall, which could have affected water balance and pollutant loads. To ensure systematic evaluation, the experiment was divided into separate phases and was conducted over a period of nine months, from April to December 2024. In April 2024, the main focus was on selecting the most suitable substrates to use in the CWs. From May to July 2024, a plant acclimatization phase was performed to allow vegetation to adapt to the system conditions. In August 2024, a batch experiment was carried out to determine the optimal hydraulic retention time (HRT). From September to December 2024, the CWs operated under a continuous feeding system to evaluate their long-term performance and operational stability.
2.2.1. Plant Selection
In this experiment, four plant species were selected for their distinct ecological traits, local availability, potential to enhance pollutant removal in constructed wetlands (CWs), and economic values, such as their use in fodder, handicrafts, or medicinal applications. They included Cyperus latifolius, Juncus effusus, Pennisetum purpureum, and Phragmites mauritianus. However, Pennisetum purpureum and Phragmites mauritianus failed to establish in the crushed volcanic gravel substrate, likely due to its poor capacity to anchor roots and rhizomes. Both species are adapted to moist, fine-textured soils, conditions absent in the coarse gravel medium used in the constructed wetlands [17]. Consequently, Juncus effusus and Cyperus latifolius were retained for further evaluation.
Cyperus latifolius is a sedge species, belonging to the Cyperaceae family, known for its extensive root system, which can stabilize soil, filter pollutants, and absorb nutrients such as nitrogen and phosphorus. These plants thrive in waterlogged conditions and promote microbial activity in the rhizosphere, which can facilitate processes like nitrification and denitrification. Juncus effusus, commonly known as soft rush, is known to be a highly resilient and tolerant species for low pH and heavy metals, making it ideal for growing in nutrient-rich and polluted environments. Its dense root system can effectively filter solids, absorb nutrients, and support microbial degradation of organic matter. In addition, these plants have economic value for the production of woven products. Juncus effusus was shown to have medicinal properties due to its bioactive compounds, such as dihydrodibenzoxepins, dehydroeffusol, and a number of other phenanthrenes [18,19].
2.2.2. Substrate Selection
A preliminary experiment was conducted in April 2024 to compare the efficiency of nutrient and organic matter removal of three substrates: river sand, crushed stone gravel, and crushed volcanic gravel. The experiment was performed in duplicates, with two plastic boxes for each substrate, each containing 3 kg of substrate and receiving 2 L of wastewater. After 4 days, 100 mL of water was collected from each box for analysis of chemical oxygen demand (COD), ammonium (NH4+-N), nitrate (NO3−-N), and phosphorus (PO43−-P). The remaining water was discarded and replaced with fresh wastewater to continue the experiment. The results of this experiment demonstrated the superior nutrient adsorption capacity of volcanic gravel. Consequently, volcanic gravel was chosen as the substrate for the subsequent experiment, which focused on the use of CWs to treat wastewater.
2.2.3. Plant Acclimatization
The period from May to July 2024 was dedicated to plant acclimatization. Six box-type horizontal subsurface flow constructed wetlands (CWs) were built using plastic containers measuring 46 cm in length, 32 cm in width, and 27 cm in height. Each container was filled to a depth of 24 cm with 43 kg of high-porosity (56%) crushed volcanic gravel, ranging in size from 0.5 to 4 cm, with an average diameter of 2.1 cm (Figure 1a). CWA1 and CWA2 were planted with five Cyperus latifolius plants each, CWB1 and CWB2 were planted with five Juncus effusus plants (Figure 1b). CWC1 and CWC2 were left unplanted to serve as controls. Young plants (4–6 weeks old) were collected from Mukungwa natural wetland in Musanze District, Rwanda. After thorough washing with tap water, they were transplanted into the plastic containers filled with substrate (volcanic gravel) on 2 May 2024. During this phase, each unit was fed weekly with 20 L of freshwater.
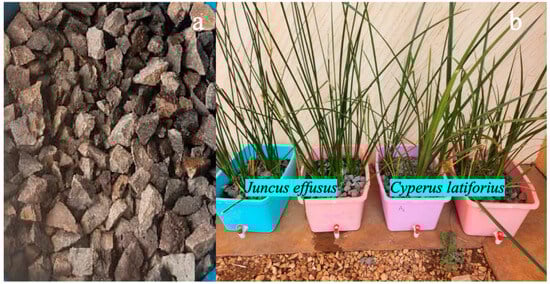
Figure 1.
Plants and substrate in constructed wetland units. (a) Volcanic gravel used in this experiment. (b) Wetland plants, Juncus effusus (ubusuna) and Cyperus latifolius (urukangaga), during the acclimatization period.
2.2.4. Hydraulic Retention Time
In August 2024, a batch experiment was set up to explore the minimum retention time potentially required for effective removal of key pollutants under conditions similar to those anticipated in the continuous flow system. Although batch and continuous systems differ hydraulically, the batch setup was intended to provide an initial estimate of the time needed for organic matter and nutrient removal under comparable environmental and substrate conditions. In this one-month batch experiment, each wetland unit was fed weekly with 20 L of wastewater. The characteristics of the wastewater used in this experiment are presented in Table 1. To monitor pollutant concentration trends, samples were collected from day one to day seven and analyzed for COD, NH4+-N, NO3−-N, and PO43−-P. Based on the observed treatment performance, a 4-day hydraulic retention time (HRT) was selected and later applied in the continuous feeding system implemented from the sixth to the ninth month (116 days) to evaluate the wetland treatment process.

Table 1.
Characteristics of influent wastewater used in this experiment.
2.2.5. Box-Type Constructed Wetlands
Figure 2 illustrates the experimental setup of this study. From September to December 2024, the CW units were connected to a 1 m3 wastewater storage tank. The influent wastewater used in the experiment was a mixture of wastewater from the student dormitories and the campus laboratory building, where biology and chemistry students conduct their practical sessions. The laboratory building is equipped with a septic tank featuring sequential chambers, which helps produce an effluent with relatively low concentrations of key parameters such as COD and nutrients. In contrast, the dormitory wastewater originates from a cesspit and is highly concentrated, particularly in organic matter.

Figure 2.
Schematic diagram of the box-type constructed wetlands experimental setup. (a) Experimental Design: Wastewater from the laboratory building was combined with wastewater from the students’ dormitory in a tank, which was then fed to constructed wetlands (CWs) made in plastic boxes. (b) CWs were connected to a 1 m3 tank through flexible pipes fitted with taps. To ensure even wastewater distribution across the filter bed, the section of the pipe running along the width of the wetland was perforated. A1&A2: CWs planted with Cyperus latifolius; B1&B2: CWs planted with Juncus effusus; C1&C2: Unplanted CW units taken as control.
In light of the college’s need for a unified sewer system to manage all campus wastewater, it was necessary to combine the two wastewater sources for this treatment experiment. Laboratory wastewater was used to dilute dormitory wastewater at a 1:2 ratio, targeting a COD concentration of approximately 600 mg/L. This concentration was chosen based on our survey of wastewater characteristics from academic institutions in Rwanda, where five out of eleven sites exhibited COD levels around 600 mg/L, representing relatively low-strength conditions, while the remaining six sites showed higher pollution levels. CWs are commonly designed to treat low-strength wastewater due to their reliance on natural physical, chemical, and biological processes, which are most effective at moderate organic loads. For efficient operation, CWs are typically used as secondary or tertiary treatment technologies following preliminary treatment, which enhances overall system efficiency by removing parameters such as TSS, organic matter, and nutrients to reduce the potential risk of system clogging [20]. In this regard, the experiment was initiated using low-strength wastewater, particularly in terms of organic matter (<600 mg/L for COD), to simulate conditions of less contaminated academic wastewater, and subsequently investigate the impact of high organic loading on system performance, thereby extending the applicability of the results to higher-strength wastewater. The characteristics of the inlet wastewater used in this experiment are summarized in Table 1.
To estimate the void volume of the CW units, they were first filled with water up to the substrate height, then drained to measure the volume of water retained, which was determined to be 20 L. With a total volume of 35.3 L, the porosity of the volcanic gravel used was found to be 56.6%. Maintaining a hydraulic retention time (HRT) of 4 days initially resulted in a flow rate of 5 L/day. However, to account for water losses due to evapotranspiration, which were estimated by emptying each effluent storage container every morning, measuring the volume of treated wastewater, and calculating the water lost, the flow rate was adjusted to 6.5 L/day. This adjusted flow rate was subsequently used to establish the hydraulic and mass loading rates for the experiment.
where Q = Flow rate (L/day); V = Void volume of the system (L); and HRT = Hydraulic Retention Time (days).
The hydraulic loading rate (HLR) was 44 mm/day.
where HLR = Hydraulic Loading Rate (m3/m2/day or mm/day); Q = Flow rate (m3/day); and A = Surface area of the wetland unit (m2).
The corresponding mass loading rates (MLRs) were 25.3 g/m2/day for COD, 28.6 g/m2/day for TSS, 1.1 g/m2/day for NH4+-N, 0.7 g/m2/day for NO3−-N, and 1.9 g/m2/day for PO43−-P.
The wastewater was fed into the CWs by gravity through flexible pipes connected to the tank via taps, as shown in Figure 2b. To ensure even distribution of wastewater across the filter bed, the section of the pipe lining the width of the wetland was perforated. This design allowed for uniform feeding of wastewater throughout the wetland. At the opposite end of each wetland, a tap was installed to allow the treated water to exit the system and to facilitate sample collection. A 1% slope ensured a consistent and regular flow of wastewater through the system. Table 2 shows design specifications of the box-type horizontal subsurface flow constructed wetlands used in this experiment.
Table 2.
Design specifications of the box-type horizontal subsurface flow constructed wetlands.
2.2.6. Sampling and Analysis
Wastewater from Academic Institutions and Constructed Wetlands
At each of the selected eleven institutions for wastewater characterization in Rwanda, samples were collected from the outflow of wastewater discharge points. Sampling was conducted in the morning hours (around 9 am) to capture peak wastewater flow associated with student morning routines, which typically include bathing and toilet use. Table S1 presents the student population corresponding to each sampling site. Three replicate samples were taken per site using pre-cleaned 1 L high-density polyethylene (HDPE) bottles. The bottles were rinsed three times with the wastewater before final collection. Samples were immediately stored in cooler boxes with ice packs and transported within six hours to the laboratory at the University of Rwanda, College of Science and Technology (UR-CST). Upon arrival, the samples were preserved following the standard preservation methods outlined in APHA [21], for subsequent chemical analysis. For the constructed wetland experiment, wastewater samples were collected every 4 days, corresponding to the HRT, from the common influent sampling point and the effluent sampling points of each constructed wetland unit. Samples were collected in 500 mL plastic bottles and measured in triplicate.
For physicochemical parameter analysis, parameters such as pH, total dissolved solids (TDS), electrical conductivity (EC), and temperature were measured immediately after sampling using the multi-parameter meter HQ440D, Hach, Loveland, Colorado, USA. COD, NH4+-N, NO3−-N, and PO43−-P were analyzed in the laboratory following the standard methods recommended by APHA [21].
Chemical Characteristics of Volcanic Gravel
X-ray fluorescence (XRF) spectroscopy, S2-PUMA-Brochure-DOC-B80-EXS015-V6, Bruker, Billerica, MA, USA) was employed to characterize the chemical composition of the volcanic gravel used in the constructed wetlands, both prior to and following the wastewater treatment experiment. Representative samples were air-dried, homogenized, and finely ground before analysis. Approximately 5 g of each sample was analyzed in duplicate to ensure reproducibility. The pellets were mounted in the sample holder, and measurements were performed sequentially in air mode. Data acquisition and processing were carried out using the SPECTRA.ELEMENTS software, version 3 installed on an external computer.
Nutrient Desorption and Regeneration of Volcanic Gravel
Nutrient desorption tests were carried out to determine whether the used gravel from the constructed wetland could release nitrogen and phosphorus, with the dual aim of assessing its potential for reuse and evaluating the possibility of nutrient recovery. Representative gravel samples, collected both before the experiment and after operation of the CWA, CWB, and CWC units, were dried and finely ground prior to extraction. For NH4+-N and NO3−-N, approximately 0.5 g of gravel was shaken with 10 mL of 0.5 M potassium chloride (KCl) solution for 1 h. PO43−-P was extracted following the same procedure using 0.5 M hydrochloric acid (HCl) [22]. Distilled water served as a control for each extractant. The extraction was repeated for three consecutive cycles to ensure complete desorption. After each shaking cycle, suspensions were filtered through filter paper, and the filtrates were analyzed for NH4+-N, NO3−-N, and PO43−-P. All extractions were performed in duplicate to ensure analytical precision.
Plant Biomass and Nutrient Uptake
Plant growth was evaluated by measuring plant height four times on a monthly basis, following a three-month acclimatization period. After six months of growth, two healthy plants in good vegetative and phytosanitary condition were collected from each CW unit. The aboveground and belowground parts were separated, cut, and placed in aluminum foil. Their wet weight was measured before they were transferred to an oven at 70 °C for 24 h to determine the dry weight. The biomass per unit area was calculated as follows:
where dry weight = mass of the harvested plant biomass after drying (g), harvested area = area from which the plant was collected (m2). Representative dry samples of above and belowground plant components from the two plant species in each wetland unit were analyzed for an average nitrogen and phosphorus content. Prior to analysis, samples were ground to a fine powder. 0.5 g of the powder was digested using the Kjeldahl method for total nitrogen (TN) determination and acid digestion for total phosphorus (TP) determination. The concentrations of TN and TP were quantified using a UV-Vis spectrophotometer. The estimate of TN and TP per unit area was determined as follows [23]:
2.2.7. Mass Balance for Nitrogen and Phosphorus Removal
A mass balance approach was applied to quantify the various pathways of nitrogen and phosphorus removal in the constructed wetlands. Calculations considered the influent and effluent nutrient loads, plant uptake for the treatment period, nutrient accumulation in sediments, and the mass of nutrients desorbed from the used gravel. The percentage contribution of each component to overall nutrient removal was determined using the formula:
2.3. Statistical Analysis
Data analysis and visualization were conducted in the RStudio environment using R software (version 4.4.3) to compare the performance of constructed wetland systems across different experimental setups used in this study. The percentage removal of the tested parameters by the constructed wetland units was calculated using the following formula:
where Cin is the influent concentration and Cout is the effluent concentration.
3. Results and Discussion
3.1. Characteristics of Wastewater Generated by Academic Institutions in Rwanda
Figure 3 illustrates the pollution levels of wastewater generated by academic institutions in Rwanda, with a focus on organic matter and nutrient content. Widespread contamination was revealed, particularly in terms of COD, NH4+-N, and PO43−-P.
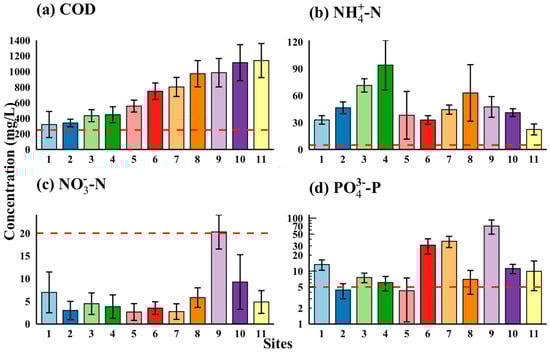
Figure 3.
Levels of COD (a), NH4+-N (b), NO3−-N (c), and PO43−-P (d) in wastewater discharged by academic institutions. The horizontal red line indicates the EAC-Rwanda wastewater discharge limit. Error bars represent the standard deviation from the mean. Wastewater samples were collected over a one-year period at two-month intervals from eleven academic institutions across eleven districts in Rwanda. For confidentiality reasons, the names of the sampled institutions are not disclosed. Sampling locations: 1. Musanze, 2. Rusizi 3. Ruhango, 4. Nyanza, 5. Huye, 6. Rwamagana, 7. Nyagatare, 8. Muhanga, 9. Nyarugenge, 10. Karongi, 11. Rubavu.
In terms of COD, all sites exceeded both the East African Community (EAC)-Rwanda discharge limit of 250 mg/L and the European Union (EU) standard of 125 mg/L, with average concentrations from 320.2 ± 167.4 mg/L at Site 1 to 1140.1 ± 218.3 mg/L at Site 11. Five institutions (Sites 1–5) recorded COD values below 600 mg/L, while the remaining six (Sites 6–11) had significantly higher concentrations. These high organic pollution points to inadequate wastewater treatment capacity, where untreated or poorly treated discharges likely enter the environment, intensifying eutrophication and increasing health and ecological risks. This shows an urgent need to implement effective wastewater treatment systems, ensure that discharge rules are followed, and promote better wastewater management practices in academic institutions in Rwanda.
Notably, organic matter levels did not always align with nutrient pollution. For instance, although Site 11 exhibited the highest levels of COD, 1140 ± 218 mg/L, its NH4+-N, NO3−-N, and PO43−-P concentrations were relatively low (22 ± 6, 4.8 ± 3, and 10 ± 5.6 mg/L, respectively). Conversely, Site 4, despite having a comparatively low COD concentration (446 ± 102 mg/L), showed the highest NH4+-N concentration (94 ± 28 mg/L). This lack of alignment between organic matter and nutrient levels reflects differences in waste sources and management practices in the investigated academic institutions. Laboratory facilities may release nutrient-rich chemicals such as phosphorus or nitrates, while domestic or canteen waste contributes more biodegradable organic matter. This emphasizes the need for site-specific wastewater management strategies.
Nutrient concentrations also varied considerably. NH4+-N ranged from 22.34 ± 6 mg/L (Site 11) to 94 ± 27.7 mg/L (Site 4), while NO3−-N ranged from 2.7 ± 1.2 mg/L (Site 5) to 20.3 ± 3.8 mg/L (Site 9). Most sites exceeded the EU total nitrogen equivalent limit of 6 mg/L, with Site 9 also surpassing the EAC-Rwanda NO3−-N limit of 20 mg/L. PO43−-P levels were highly variable, ranging from a minimum of 4.3 ± 3.2 mg/L at Site 5 to a maximum of 70.1 ± 21.2 mg/L at Site 9. The EAC-Rwanda recommends a discharge limit of 5 mg/L, while the EU threshold is 0.5 mg/L.
Figure 4 shows the levels of pH, temperature (T°), electrical conductivity (EC), and total dissolved solids (TDS). pH values (7.0–8.4) and T° (23.8–25.2 °C) fell within the EAC-Rwanda and EU acceptable range of 6.5–8.5 and 20–35 °C, respectively. TDS values (301.2–1049.8 mg/L) remained below the EAC-Rwanda limit of 1500 mg/L, while EC varied widely, peaking at 1812.8 ± 238.3 µS/cm at Site 9.
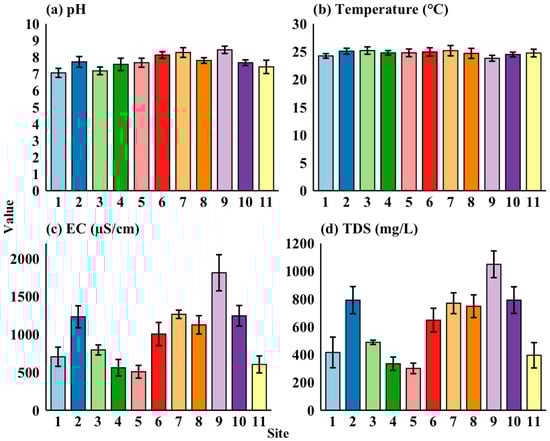
Figure 4.
Levels of pH (a), temperature (b), electrical conductivity (c) and total dissolved solids (d) in wastewater discharged by academic institutions. Error bars represent the standard deviation from the mean. Wastewater samples were collected over a one-year period at two-month intervals from eleven academic institutions across eleven districts in Rwanda. For confidentiality reasons, the names of the sampled institutions are not disclosed. Sampling locations:1. Musanze, 2. Rusizi 3. Ruhango, 4. Nyanza, 5. Huye, 6. Rwamagana, 7. Nyagatare, 8. Muhanga, 9. Nyarugenge, 10. Karongi, 11. Rubavu.
3.2. Practice of Handling Wastewater at Academic Institutions
For wastewater management, 36% of visited institutions use septic tanks, while others rely on soakaways and cesspits. For some institutions, like Sites 10 and 11, the cesspits are emptied periodically, and the solid contents are used as fertilizer. The use of stones to filter wastewater before its discharge into the environment was also observed at Sites 4 and 8. The challenges met by different academic institutions include the lack of adequate sanitation infrastructure, incomplete plumbing networks, leakage, dormitories serving non-resident users, and students using outdoor washing areas.
It is worth noting that our findings align with previous studies on wastewater characterization in academic institutions. For instance, at the University Gaston Berger (UGB) in Senegal, NH4+-N, NO3−-N, and PO43−-P concentrations were reported at 1240 mg/L, 130.9 mg/L, and 90.7 mg/L, respectively [24]. A study at Ruaha Secondary School in Tanzania has found NH4+-N at 77.3 mg/L and NO3−-N at 35.3 mg/L [25], while at the University of Bologna in Italy, COD levels of 886 mg/L and 7.6 mg/L of NH4+-N were reported [26]. As a way forward, constructed wetlands (CWs) were implemented as a treatment solution.
Selection of Treatment Technology
In this present study, CWs were selected as a preferred solution due to their efficiency, cost-effectiveness, operational simplicity, and suitability for decentralized application, particularly in resource-limited institutional settings. Given the weak correlation between organic and nutrient pollution loads among the investigated institutions, the CW design prioritized organic matter removal. A COD threshold of around 600 mg/L, representing the upper range for less-contaminated institutions, was adopted for the optimization of the treatment process. Accordingly, wastewater with COD concentrations between 504 and 612 mg/L was used in the CW treatment experiment.
3.3. Optimization of Substrate and Hydraulic Retention Time
3.3.1. Substrate
A preliminary study evaluated river sand, stone gravel, and volcanic gravel as potential substrates for constructed wetlands treating wastewater. The goal was to identify the material most effective for removing organic matter and nutrients. Among the tested media, volcanic gravel consistently delivered the highest removal efficiencies, achieving 54.2% for COD, 68.1% for NH4+-N, 67.4% for NO3−-N, and 91.6% for PO43−-P, substantially outperforming river sand and stone gravel (Figure 5). Based on the performance, the volcanic gravel was selected as a medium in the constructed wetland in the present study.
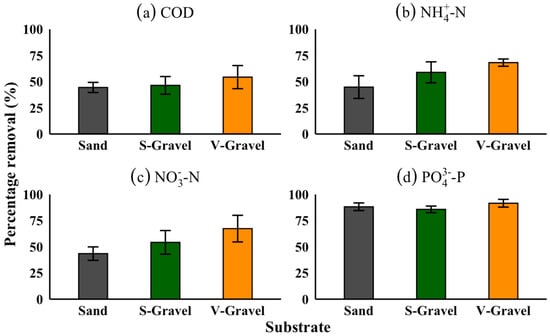
Figure 5.
Comparison of substrate performance for pollutant removal. River sand, crushed stone gravel (S-Gravel), and crushed volcanic gravel (V-Gravel) were evaluated over a one-month period for their effectiveness in removing organic matter and nutrients from wastewater using a batch system with a 4-day retention time. The experiment was conducted in duplicates. Volcanic gravel exhibited the highest average removal efficiency across all measured parameters, making it the most effective substrate. Error bars represent the standard deviations from the mean. Subplots: (a) COD, (b) NH4+-N, (c) NO3−-N, (d) PO43−-P.
Characteristics of Volcanic Gravel
As shown in Table 3, XRF analysis showed that volcanic gravel is composed primarily of SiO2 (54%), along with Al2O3 (18.7%), Fe2O3 (9.5%), CaO (7.1%), and K2O (6.4%). Minor constituents include TiO2 (~2%) and P2O5 (~0.9%). Other detected oxides, such as SrO, BaO, MnO, SO3, ZrO2, and Rb2O, together with their respective elements, occur at concentrations below 0.5%. This composition indicates that the gravel is a silicate-rich material with significant levels of aluminum, iron, and calcium oxides, which are important for nutrient adsorption and precipitation processes [27]. In addition, the gravel’s high porosity was shown to promote microbial biofilm growth, which in turn supports nitrification and denitrification processes, explaining the observed reductions in NH4+-N and NO3−-N [28]
Table 3.
Chemical composition of volcanic gravel before and after wetland treatment.
3.3.2. Hydraulic Retention Time
The performance of three constructed wetland (CW) units: CWA (planted with Cyperus latifolius), CWB (planted with Juncus effusus), and CWC (unplanted control), was assessed in a batch experiment to determine the initial estimate of hydraulic retention time (HRT), under continuous feeding with similar environmental and substrate conditions (Figure S2). Data from days 1 and 2 were excluded due to low pollutant removal during the initial adjustment phase. A 4-day retention time was found to be optimal, as removal efficiencies remained consistently high, with no significant improvement observed on days 5 and 6. Day 7 was also excluded, as no further changes were detected beyond day 6. All the wetland units showed significant COD reductions by day 4, achieving 73.7%, 74.6% and 56.3% for CWA, CWB, and CWC, respectively. The decline in COD removal efficiency observed on day 6 suggests that the degradation of organic matter had reached its optimal level by day 4. Beyond this point, the system likely experienced microbial saturation or oxygen limitation, leading to reduced degradation rates and the possible release of soluble organics. This indicates that extending the HRT beyond 4 days offers no additional treatment benefit and may even reduce performance efficiency. Therefore, the 4-day HRT can be considered optimal for sustaining effective organic matter removal under the prevailing operating conditions. This pattern is consistent with findings that organic matter degradation often follows a sigmoidal trend rather than a simple first-order kinetic model, characterized by an initial rapid degradation phase followed by a plateau as microbial activity stabilizes [29].
The removal of nutrients further supported the 4-day retention period as the most effective. For NH4+-N, CWA removed 70.78%, CWB removed 77.5%, and the control removed 48.4%. NO3−-N was removed at rates of 89%, 87.7%, and 63% for CWA, CWB, and CWC, respectively. These results suggest that a 4-day retention time was sufficient to support biofilm development on the substrate, enabling effective microbial nitrification and denitrification. PO43−-P removal exhibited the highest efficiency, with over 91% removal for CWA and CWB, and over 86% for CWC. This implies that adsorption and precipitation are the primary mechanisms for PO43−-P removal in constructed wetlands. Similar trends were reported by Vohla [27], who found that phosphorus removal in CWs occurs rapidly in the first few days due to active adsorption onto substrate surfaces, after which the removal rate may decline.
Comparable findings have been reported in other studies applying similar retention times. For instance, a 4-day HRT in a wetland system treating university wastewater at a flow rate of 16 m3/day achieved a COD removal efficiency of 84.9% [14]. A pilot horizontal flow constructed wetland operated at a university campus showed that an HRT of 3–5 days resulted in higher removal efficiencies, reaching 85–87% for COD, 91–97% for total nitrogen, and 97–99% for TP [30].
HRT is a critical operational parameter influencing the performance of constructed wetlands, yet both excessively short and extended HRTs present limitations. While the recommended range for subsurface flow systems is typically 2–5 days [31], very short retention periods may not allow sufficient time for efficient nutrient removal. For example, at a two-day HRT, high removal efficiencies of BOD (89.5%) and COD (84.2%) were reported, but TN and PO43−-P removals remained comparatively low at 32.5% and 43.8%, respectively [32]. Conversely, longer HRTs do not necessarily enhance overall treatment performance. A lab-scale vertical-flow constructed wetland operated at a 17-day HRT achieved 98% NH4+-N removal, but COD and TP reductions were only 43.2% and 61.3% [33]. Similarly, a hybrid system with a 21-day HRT demonstrated limited removal of COD (67%) and TN (53%), despite high PO43−-P reduction (94%) [34]. These findings indicate that extended HRTs may enhance nutrient removal but reduce organic matter degradation, whereas a moderate HRT offers a more balanced performance. The findings of the present study confirm this, as a 4-day HRT optimized both treatment efficiency and stability.
3.4. Efficiency of Box-Type Constructed Wetlands
3.4.1. Removal of Organic Matter
Figure 6 illustrates the performance trends of the constructed wetland units (CWA, CWB, and CWC), in terms of removal of organic matter expressed as chemical oxygen demand (COD). Both CWA and CWB exhibited very similar overall removal efficiencies, but they differed in the range between their minimum and maximum removal values. CWB stood out slightly, showing steadier performance with smaller fluctuations in effluent COD compared to CWA and the control. Starting from an average influent of 573.7 mg/L, equivalent to a mass loading rate of 25.3 g/m2/day, CWA achieved a removal efficiency ranging from 45.3% to 90.8%, with an average effluent COD of 126.8 mg/L (5.6 g/m2/day), leading to an overall efficiency of 78.2%. Similarly, CWB achieved removal efficiencies between 61.4% and 90%, with an average effluent concentration of 106.8 mg/L (4.7 g/m2/day), resulting in an overall efficiency of 81.1%. In contrast, the control (CWC) showed a wider range of variability, with COD removal between 34.2% and 82.3%, corresponding to an average effluent concentration of 183.65 mg/L (8.1 g/m2/day) and an overall removal efficiency of 68.8%.
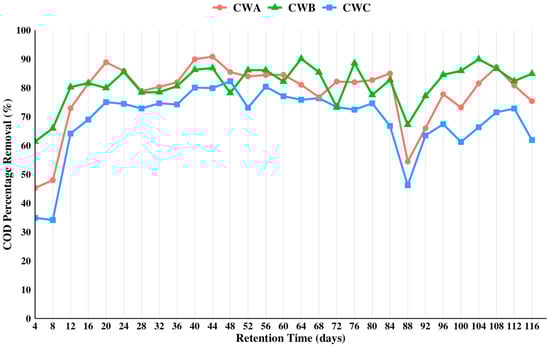
Figure 6.
Trends in organic matter removal over the four-month treatment period. The system underwent a three-month period for plant acclimatization, followed by one month for HRT optimization, after which it was operated with continuous feeding at a 4-day HRT for four months. Overall, all wetlands exhibited a high capacity for COD removal from wastewater, with CWB demonstrating more stable performance and fewer fluctuations compared to the others. CWA: constructed wetland planted with Cyperus latifolius, CWB: constructed wetland planted with Juncus effusus, CWC: unplanted constructed wetland taken as control.
Organic matter removal in CWs is primarily governed by physical filtration and microbial activity. In this study, the high removal efficiency observed can be attributed to the high porosity of the volcanic gravel, which not only promotes the entrapment of organic solids but also prolongs hydraulic retention, thereby favoring both aerobic and anaerobic biodegradation. Microbial activity is strongly temperature-dependent. With a daily average air temperature of approximately 23 °C, conditions were favorable for sustaining microbial growth and activity.
A transient decline in COD removal was recorded on day 88 (Figure 6), coinciding with an increased pollutant load. However, the system rapidly recovered, likely due to microbial adaptation. Vegetation also played a significant role, as plants enhance oxygen transfer, sustain diverse microbial consortia, and thus contribute to the uptake and degradation of organic matter [35]. Furthermore, the warm climatic conditions favored additional processes such as photodegradation and volatilization. Although considered secondary mechanisms, these pathways were shown to contribute to overall treatment efficiency under temperatures above 15 °C and with abundant solar radiation [36].
The results of the present study align with those reported in a study treating municipal wastewater in an arid climate. In this experiment, the bed planted with Cyperus papyrus achieved a removal efficiency of 86.6%, while the bed planted with Juncus effusus reached a maximum removal percentage of 89% [37]. They also align with findings from box-type CWs treating domestic wastewater using gravel as the filtering medium and planted with Napier grass, where COD removal reached 91% [38].
3.4.2. Removal of Ammonium
Figure 7 presents the ammonium-nitrogen (NH4+-N) removal performance of the three constructed wetland units (CWA, CWB, and CWC). With influent concentrations ranging from 9.3 to 42.3 mg/L and an average mass loading rate of 1.08 g/m2/day, the CWB unit consistently achieved the highest removal performance, with an average effluent load of 0.14 g/m2/day and an overall removal efficiency of 86.8%. The CWA unit exhibited more variability, recording an effluent load of 0.25 g/m2/day and a removal efficiency of 76.6%. In contrast, the control unit (CWC) had an average effluent load of 0.37 g/m2/day, corresponding to a removal efficiency of 65.5%. These results suggest that Juncus effusus preferentially utilizes NH4+-N compared to Cyperus latifolius, which aligns with previous studies indicating that Juncus effusus favors NH4+-N as its primary nitrogen source. For example, a study on laboratory-scale CWs treating synthetic sewage reported that growing Juncus effusus plants contributed to the removal of 44.5% of the total NH4+-N load through uptake. The same study reported a linear correlation between NH4+-N uptake and transpiration, indicating that its removal efficiency is closely linked to the plant’s physiological activity [39]. However, a study on responses of wetland plants to ammonium demonstrated that ammonium concentrations exceeding 200 mg/L negatively impact the relative growth rate of Juncus effusus, leading to reduced biomass production [40].
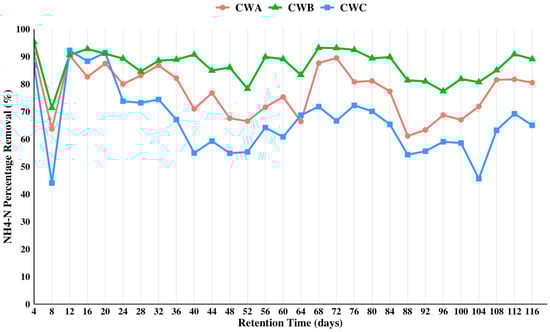
Figure 7.
Trends in NH4-N removal over the four-month treatment period. The system underwent a three-month period for plant acclimatization, followed by one month for HRT optimization, after which it was operated with continuous feeding at a 4-day HRT for four months. Juncus effusus demonstrated more stable performance in NH4+-N removal; CWA: constructed wetland planted with Cyperus latifolius; CWB: constructed wetland planted with Juncus effusus, CWC: unplanted constructed wetland taken as control.
Variations in NH4+-N removal efficiency in the CWs may be influenced by factors such as plant species, substrate type, microbial activity, and environmental conditions, including pH, temperature, and oxygen availability, as well as the quality of the incoming wastewater [41]. These factors could explain the fluctuations observed in NH4+-N removal performance. The control unit’s notable NH4+-N removal efficiency (65.5%) highlights the critical role of volcanic gravel, likely due to its distinctive chemical properties (Table 3). This performance is due to the zeolitic nature of the substrate, known to effectively remove ammonium and other cations from wastewater through ion exchange and adsorption mechanisms [42]. In addition, the pH ranged from 7.4 to 8.8 in all the CW units. Nitrification, a process carried out by nitrifying bacteria, is pH-sensitive. It occurs most efficiently within a slightly alkaline range, typically between 7.2 and 9.0 [41]. Moreover, nitrifying bacteria have an optimal temperature range of approximately 20–30 °C, which aligns with the temperatures of around 23 °C observed in the present study [43].
The constructed wetland unit planted with Juncus effusus demonstrated high NH4-N removal efficiency, exceeding 85%, compared to previous studies using the same species in constructed wetlands, which reported removal rates of 60% [44], 77% [45] and 82% [46].
3.4.3. Removal of Nitrate
Figure 8 illustrates nitrate-nitrogen (NO3−-N) removal trends over time in the three constructed wetland units (CWA, CWB, and CWC). Compared to the influent, which ranged from 8.5 to 24.4 mg/L, with an average loading rate of 0.72 g/m2/day, the CWB unit exhibited the most stable and efficient nitrate removal, achieving an overall removal efficiency of 90.2% with an effluent loading rate of 0.06 g/m2/day. In contrast, the CWA unit showed some variability in removal efficiency, with an average overall percentage of 83.5 (0.1 g/m2/day), while the control unit achieved 68.7% with (0.2 g/m2/day). In constructed wetlands, NO3−-N removal occurs primarily through denitrification and plant uptake. The pronounced NO3−-N reduction observed in the control wetland indicates that the volcanic gravel, with its high porosity (56.6%), likely played a crucial role in nitrogen removal. The high porosity provides an extensive surface area and void spaces that promote microbial attachment, colonization, and the development of stable biofilms on the substrate. These biofilms harbor nitrifying and denitrifying bacteria that sequentially convert NH4+-N to NO3−-N and subsequently to nitrogen gas (N2), thereby facilitating efficient nitrogen removal from the wastewater [47]. This interpretation aligns with the total nitrogen (TN) mass balance, which revealed a large “leftover” fraction (≈80% in the control unit) after accounting for TN desorbed from the gravel, plant uptake, and sediment accumulation. This substantial unaccounted fraction strongly suggests that denitrification, resulting in N2 gas loss, was the dominant nitrogen removal pathway, although not directly quantified.
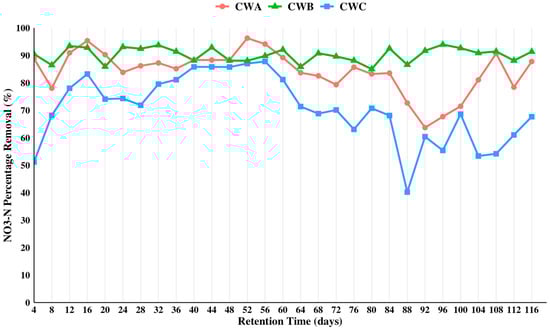
Figure 8.
Trends in NO3−-N removal over the four-month treatment period. The system underwent a three-month period for plant acclimatization, followed by one month for HRT optimization, after which it was operated with continuous feeding at a 4-day HRT for four months. Juncus effusus demonstrated more stable performance in removal efficiency. CWA: constructed wetland planted with Cyperus latifolius; CWB: constructed wetland planted with Juncus effusus; CWC: unplanted constructed wetland taken as control.
The removal efficiency observed in the present study (90.2%) is comparable to previous research using gravel as the substrate and Juncus effusus as the macrophyte, which reported 88% NO3−-N removal in lab-scale wetland mesocosms [48]. Similarly, another study conducted under comparable experimental conditions achieved an average NO3−-N removal of 97.6% from an initial concentration of 135.7 mg/L using synthetic wastewater [46].
3.4.4. Removal of Phosphorus
Figure 9 illustrates the phosphorus-phosphate (PO43−-P) removal trends in the three CW units. With inlet concentrations ranging from 20.7 to 63.9 mg/L and an average mass loading rate of 1.95 g/m2/day, all units demonstrated high PO43−-P removal efficiency, achieving an overall average removal of at least 90%. The effluent mass loading rates were 0.1, 0.06, and 0.2 g/m2/day for CWA, CWB, and CWC, respectively. Although the CWC unit exhibited occasional minor fluctuations, they did not significantly affect its overall performance.
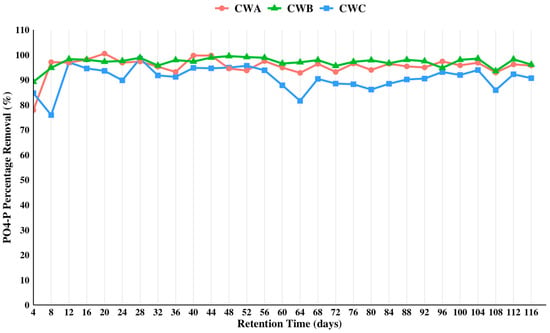
Figure 9.
Trends in PO43−-P percentage removal over the four-month treatment period. The system underwent a three-month period for plant acclimatization, followed by one month for HRT optimization, after which it was operated with continuous feeding at a 4-day HRT for four months. All systems demonstrated more stable performances in removal efficiency, achieving an average percentage removal of at least 90%. CWA: constructed wetland planted with Cyperus latifolius; CWB: constructed wetland planted with Juncus effusus; CWC: unplanted constructed wetland taken as control.
The high PO43−-P removal efficiency observed in the constructed wetlands in this study can be largely attributed to the physicochemical properties of the volcanic gravel substrate (Table 3). X-ray fluorescence (XRF) analysis revealed that the gravel is primarily composed of SiO2 (54%), Al2O3 (18.7%), Fe2O3 (9.5%), CaO (7.1%), and K2O (6.4%), with minor constituents including TiO2 (~2%) and P2O5 (~0.9%). Additionally, volcanic rocks from northern Rwanda exhibit high porosity (66.7%) and a near-neutral pH (7.2 ± 0.1) [49].
The presence of Fe and Al promotes phosphorus binding through surface complexation, while Ca facilitates the formation of insoluble calcium phosphate compounds, particularly under neutral to slightly alkaline conditions [50]. The high porosity of the gravel provides an extensive surface area for both chemical interactions and microbial colonization [51]. Furthermore, the pH in the CW units ranged from 7.9 to 8.13, establishing mildly alkaline conditions conducive to phosphate precipitation, which was corroborated by a 4.2% decrease in CaO content in the post-treatment XRF results (Table 3).
PO43−-P removal efficiency achieved in this study notably exceeds that reported in previous studies employing volcanic pumice and scoria, which demonstrated removal rates of 63% and 66% for scoria and pumice, respectively, under a three-day hydraulic retention time [52]. Compared with a study on the purification performance of Juncus effusus in an arid climate, where PO43−-P removal in the control wetland ranged from 37.9% to 73.2% and in the planted wetland from 59.7% to 89.7% [37], the present results demonstrate superior performance with a maximum removal of 97%. Similarly, our findings surpass those of a study on PO43−-P retention in constructed wetlands vegetated with Juncus effusus, where maximum PO43−-P removal reached 72% in the reference bed and 83% in the planted units [53].
3.4.5. Total Dissolved Solids and Total Suspended Solids
Total dissolved solids (TDS) concentration decreased from 1084 mg/L in the inlet to 763.3, 780.3, and 871.4 mg/L for CWA, CWB, and CWC, respectively, with corresponding removal efficiencies of 29.6%, 28.0%, and 19.6% (Figure 10a). These reductions can be attributed to a combination of plant uptake, adsorption by the substrate, and microbial activity [41]. Similar results were observed in a study investigating horizontal subsurface flow constructed wetlands treating aquaculture effluent, where TDS decreased from 332 mg/L to 237 mg/L [54]. In contrast, higher removal rates of TDS were reported in a study evaluating the performance of subsurface-flow constructed wetlands, with TDS concentrations decreasing from 757 to 881 mg/L to 146–174 mg/L across different wetland chambers.

Figure 10.
(a) Removal of total dissolved solids (TDS) and (b) total suspended solids (TSS) over the four-month treatment period. The error bars represent the standard deviation from the mean. CWA: constructed wetland planted with Cyperus latifolius; CWB: constructed wetland planted with Juncus effusus; CWC: unplanted constructed wetland, the control.
As shown in Figure 10b, a significant reduction in total suspended solids (TSS) was observed across all constructed wetland (CW) units. With an average influent concentration of 648 mg/L, the effluent concentrations were reduced to 22.2, 26.7, and 19.3 mg/L for CWA, CWB, and the control, respectively, corresponding to average removal rates of 96.6%, 95.9%, and 97.0%. These results highlight the effectiveness of volcanic gravel in retaining TSS. These results align with previous findings showing that in horizontal subsurface flow wetlands, TSS removal primarily occurs through physical processes such as filtration, aggregation, surface adhesion, and sedimentation, with reported removal efficiencies ranging from 72.0% to 95.0% [55,56,57]. A similar trend and percentage removal were observed in a study on the performance of an integrated household CW treating domestic wastewater [56].
3.5. Plant Growth, Biomass Production, and Nutrient Accumulation
The wetland systems were planted in May 2024. After a three-month acclimatization period, monthly shoot counts were conducted to assess plant growth. Juncus effusus exhibited denser and more widespread growth compared to Cyperus latifolius, suggesting that J. effusus may have a stronger ability to establish and maintain vegetation under the given conditions. This difference is likely due to variations in growth characteristics between the species. As shown in Table 4, after six months of growth, five plants of Cyperus latifolius increased to an average of 13 plants, with heights ranging between 90 and 110 cm, each bearing at least seven leaves. The dry matter production was 3250 g/m2 for aboveground biomass and 1139 g/m2 for belowground biomass (Table 5). To our knowledge, no specific studies have reported wet and dry matter production or accumulation of nitrogen and phosphorus for this wetland plant species.
Table 4.
Plant shoot and leaf development over a six-month period.
Table 5.
Plant biomass production and nutrient accumulation.
After six months of growth, Juncus effusus produced 120 shoots (Table 4), reaching a maximum height of 210 cm. This corresponds to a shoot density of 1846 shoots/m2, which is significantly lower than the 4534 shoots/m2 reported by [58] during the treatment of dairy farm wastewater with Juncus effusus. In the present study, the dry matter production for six-month-old Juncus effusus plants was 5212 g/m2 for aboveground biomass and 1455 g/m2 for belowground biomass (Table 5).
The TN and TP accumulation in Juncus effusus was 19.1 g/m2 and 137.1 g/m2, respectively. The TP values are notably higher than those reported by [58], who observed an average aboveground dry matter production of approximately 800 g/m2 and phosphorus accumulation of about 6 g/m2 under an influent TP concentration of 14.6 mg/L. However, nitrogen accumulation of 24 g/m2 was reported in that study, corresponding to an influent TN concentration of 98.5 mg/L.
A study on nutrient dynamics in floating wetlands demonstrated that nutrient accumulation strongly depends on the initial concentrations in the influent wastewater, with nitrogen accumulation in particular showing a clear correlation with plant growth and final biomass. In that study, Juncus effusus grown under high-nutrient conditions with a mean influent concentration of 14.6 ± 5.2 mg/L accumulated significantly more nitrogen and phosphorus than under low-nutrient conditions, which had a mean influent concentration of 4.9 ± 1.8 mg/L. Nitrogen accumulation was 4.9 g/m2 under high-nutrient conditions and 2.9 g/m2 under low-nutrient conditions. Phosphorus accumulation was 0.5 g/m2 in the high-nutrient treatment and 0.3 g/m2 in the low-nutrient treatment, from 2.3 and 0.8 mg/L influent concentration [59]. In another study investigating nitrogen removal in laboratory-scale subsurface constructed wetlands designed to enhance anaerobic ammonia oxidation, synthetic wastewater with influent ammonium concentrations ranging from 150 to 200 mg/L was used. A maximum nitrogen accumulation rate of 0.6 g/m2 per day was reported, equivalent to approximately 100 g/m2 over a six-month period [60]. Although this value is considerably higher than the nitrogen accumulation observed in the present study, it reinforces the relationship between influent nutrient concentration and plant uptake capacity, while also highlighting the potential of Juncus effusus for biomass production and nutrient removal in constructed wetland systems.
3.6. Nutrient Removal Mechanism by Mass Balance Assessment
The mass balance results show clear differences in TN removal among the three CW units (Figure 11a). All units received the same influent load, 30.7 of TN, considering the mass load of NH4+-N and NO3−-N. The CWB unit, planted with Juncus effusus, achieved the highest overall removal, 88%; the CWA unit with Cyperus latifolius removed 79%, while the control unit (CWC) was at 67%. Plant uptake contributed to total removal, with 5.5% in Cyperus latifolius and 7.2% in Juncus effusus, highlighting the added benefit of vegetation compared to the control unit. Sediment retention accounted for roughly 3–8% of TN, suggesting that differences in overall performance were not primarily driven by sedimentation.
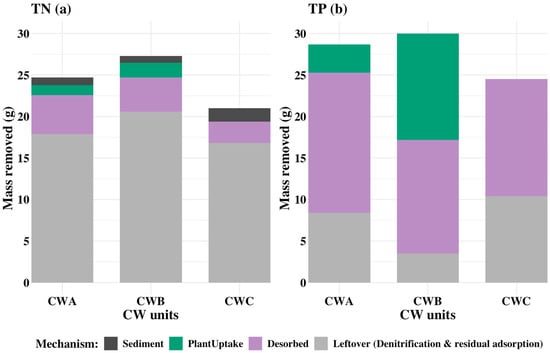
Figure 11.
Mass balance of TN (a) and TP (b) removal in constructed wetland units. Bars represent the distribution of removed mass among different mechanisms: Sediment (retention within the wetland), Plant Uptake (direct assimilation by vegetation), Desorbed (nutrients released from gravel, quantified through a desorption experiment), and Leftover (Denitrification and nutrients retained in gravel). Treatments are denoted as CWA (Cyperus latifolius), CWB (Juncus effusus), and CWC (unplanted control). All values are expressed in grams of nutrient removed.
A substantial portion of TN might have remained as residual mass adsorbed onto the gravel substrate. A preliminary desorption experiment demonstrated that 2.5–4.7 g of TN could be released after three successive KCl extraction cycles. The remaining fraction was likely transformed through nitrification-denitrification to N2 gas, microbial immobilization, or incorporation into particulate and root biomass not accounted for in the shoot harvests. Further study is needed to optimize adsorption and desorption methods to better understand the capacity of gravel to retain and release NH4+-N and NO3−-N.
A study on the water-purification performance of modified volcanic-rock ecological concrete reported that its treatment mechanism is driven mainly by physical adsorption and microbial degradation [61]. Another investigation on NH4+-N removal from aqueous solutions found that zeolite-rich materials serve as highly effective adsorbents for eliminating NH4+-N impurities from water and wastewater [42]. Overall, the findings of the present study show the positive role of vegetation in enhancing TN removal through combined plant uptake and microbial activity, while highlighting the important role of volcanic gravel as a nutrient-adsorbing substrate in constructed wetlands.
The mass balance for PO43−-P shows strong overall removal in all CW units, with clear effects of volcanic gravel and vegetation type (Figure 11b). Each unit received the same influent load of 33.3 g. The CWB achieved the highest total removal at 97%, followed by CWA with 95% and CWC with 90%.
Plant uptake was the most striking difference among treatments. Juncus effusus accounted for 12.8 g of phosphorus uptake, about 40% of the influent, while Cyperus latifolius removed only 3.4 g (≈10%). Sediment retention contributed a smaller but consistent share, ranging from about 2.2 g to 5.6 g (≈6–17% of the influent). The remainder of the removed phosphorus was largely adsorbed onto the gravel. The post-treatment desorption test confirmed substantial sorption capacity of the gravel (13–17 g desorbed after three HCl extraction cycles), indicating the capacity of volcanic gravel not only for wastewater treatment, but also for phosphorus recovery. Studies have shown that PO43−-P in CWs is mainly removed through the combined action of substrates, plants, and microorganisms [62]. In the present study, adsorption onto volcanic gravel, plant uptake, and sediment retention were identified as the principal sinks for PO43−-P, with Juncus effusus providing a particularly strong biological pathway. The academic wastewater exhibited high concentrations of PO43−-P, reaching up to 71 mg/L, indicating its potential as a source for phosphorus recovery. Moreover, the volcanic gravel demonstrated an adsorption capacity of up to 90%, making it an effective medium for phosphorus capture and potential extraction. Further studies are needed to develop efficient methods for recovering phosphorus from this substrate. In particular, it is essential to evaluate whether the desorbed phosphorus is chemically stable and suitable for reuse as fertilizer, ensuring its practical applicability in resource recovery systems.
The XRF analysis revealed that the volcanic gravel contains about 54% silicon dioxide, giving it a microporous framework that physically traps phosphorus. The gravel also contains aluminum and iron oxides (≈19% and ≈9.5%, respectively), which promote chemical adsorption by forming surface complexes with phosphate (Table 3). XRF analysis confirmed the presence of Ca in the volcanic gravel and showed a reduction in Ca content after treatment, indicating its consumption in reactions with phosphate to form insoluble calcium-phosphate precipitates. This precipitation, together with the gravel’s adsorption properties, explains its high PO43−-P removal capacity. Consistent with this, a study on PO43−-P removal using volcanic rocks reported that the process is primarily governed by chemisorption with strong covalent bonding between phosphorus and the mineral surface. Yet the mean free energy derived from the Dubinin-Radushkevich isotherm also pointed to a contribution from physisorption, driven by weaker Van der Waals forces [63].
4. Conclusions
This study evaluated wastewater from eleven academic institutions in Rwanda and assessed the treatment performance of box-type horizontal subsurface flow constructed wetlands (HFCWs) at the University of Rwanda, College of Science and Technology (UR-CST) case site. Three substrates: river sand, standard gravel, and volcanic gravel were tested for their effectiveness in enhancing pollutant removal. Two wetland plant species, Cyperus latifolius and Juncus effusus, were compared in terms of their pollutant removal efficiencies within the CW system.
The study demonstrated that wastewater discharged from academic institutions in Rwanda is highly polluted, particularly with organic matter and nutrients. Volcanic gravel was identified as the most efficient substrate for use in CWs, and a 4-day HRT was found to be optimal for achieving high removal efficiencies of organic matter and nutrients. The HSFCWs achieved removal efficiencies of 68.8–82.3% for COD, 65.5–86.8% for NH4+-N, 68.7–90.2% for NO3−-N, and over 90% for PO43−-P and TSS.
Volcanic gravel served as the primary medium for NH4+-N removal through adsorption, for NO3−-N removal via the denitrification process, and for PO43−-P removal through both adsorption and the precipitation of calcium phosphate, achieving removal efficiencies of 68.7%, 65.5%, and 90%, respectively, in the control. This was supported by its high Al, Fe, and Ca content as confirmed by XRF spectroscopy. TSS removal (>90%) further highlights the excellent physical filtration capacity of volcanic gravel. Desorption tests revealed that volcanic gravel can function not only as an effective treatment medium but also as a source for phosphorus recovery. This potential for phosphorus recovery provides an opportunity for substrate reuse, supporting sustainable wastewater treatment and resource management.
Among the two plant species tested, Juncus effusus outperformed Cyperus latifolius in both biomass production (6667 g/m2 vs. 4389 g/m2 of dry matter) and nutrient uptake, removing 3.8 times more TP and 1.5 times more TN. The recorded aboveground dry biomass of Juncus effusus (5212 g/m2) was substantially higher than values reported in similar studies (≈800 g/m2), demonstrating its remarkable adaptability and high nutrient assimilation potential under local environmental conditions. Overall, Juncus effusus demonstrated superior phytoremediation potential, confirming it as the most efficient plant species for this type of constructed wetlands.
The high pollutant loads observed in this study highlight the need for stricter discharge regulations for academic wastewater in Rwanda to ensure compliance with environmental quality standards. CWs, as a nature-based solution, offer a decentralized and sustainable approach to wastewater treatment, particularly suited to semi-urban and academic institutional settings. In addition, this approach aligns with Rwanda’s agglomeration policy, which promotes planned and clustered settlements to improve service delivery and infrastructure efficiency in rural and peri-urban areas.
The design of CWs should prioritize nutrient removal, especially phosphorus, by selecting volcanic gravel as the substrate and locally available wetland plants such as Juncus effusus to support cost-effective wastewater treatment processes. Given the complex composition of academic wastewater, future research should assess the long-term accumulation of heavy metals and pharmaceuticals in both substrate and plant biomass. It should also focus on monitoring treatment efficiency, substrate saturation, and the effects of varying mass loading rates to ensure the operational safety and sustainability of these systems in Rwanda and similar contexts.
Supplementary Materials
The following supporting information can be downloaded at: https://www.mdpi.com/article/10.3390/w17223200/s1. Figure S1. The map of Rwanda highlighting the sampling sites (produced with Q-GIS). Figure S2. Optimization of hydraulic retention time (HRT). Table S1. Sampling sites with corresponding student number.
Author Contributions
Conceptualization, J.C.U., V.H., A.N. and G.K.R.; methodology, J.C.U. and V.H., E.H., A.N. and G.K.R.; software, J.C.U. and E.H.; validation, J.C.U., V.H. and E.H.; formal analysis, J.C.U.; investigation, J.C.U.; resources, A.N. and G.K.R.; data curation, J.C.U. and V.H.; writing—original draft preparation, J.C.U.; writing—review and editing, J.C.U., V.H., E.H., A.N. and G.K.R.; visualization, J.C.U. and V.H.; supervision, A.N. and G.K.R.; project administration, A.N. and G.K.R.; funding acquisition, A.N. and G.K.R. All authors have read and agreed to the published version of the manuscript.
Funding
This research was funded by the Swedish International Development Cooperation Agency (Sida), under the cooperation between Sweden/Sida and Rwanda/University of Rwanda, grant number FP1924_11, grant recipient: Sweden KTH/UR.
Data Availability Statement
The raw data supporting the conclusions of this article will be made available by the authors on request.
Acknowledgments
We sincerely acknowledge the generous financial support from the Swedish International Development Cooperation Agency (Sida), which played a vital role in enabling this research. We also appreciate the University of Rwanda for granting access to laboratory facilities and providing valuable technical assistance during the course of the study.
Conflicts of Interest
The authors declare no conflicts of interest.
Abbreviation
The following abbreviations are used in this manuscript:
| COD | Chemical oxygen demand |
| CW | Constructed wetland |
| HRT | Hydraulic retention time |
| MLR | Mass loading rate |
| NH4+-N | Ammonium nitrogen |
| NO3−-N | Nitrate-nitrogen |
| PO43−-P | Phosphorus–phosphate |
| TDS | Total dissolved solids |
| TN | Total nitrogen |
| TP | Total phosphorus |
| TSS | Total suspended solids |
| XRF | X-ray fluorescence |
References
- United Nations Environment Programme. Wastewater: Turning Problem to Solution—A UNEP Rapid Response Assessment; United Nations Environment Programme; United Nations: New York, NY, USA, 2023. [Google Scholar]
- Abreham Awono, Y.; Adam, D.B. Evaluation of operational challenges and technological performance of wastewater treatment plants in Addis Ababa. Sci. Rep. 2025, 15, 33099. [Google Scholar] [CrossRef]
- Bayeh, A.; Tibebe, D.; Misganaw, S.; Kassa, Y.; G-hiwot, M.; Awoke, T.; Daba, S.; Tadie, A.; Kassie, M.; Markos, A. Evaluation and characterization of wastewater generated from University of Gondar, Ethiopia. S. Afr. J. Chem. Eng. 2024, 48, 285–291. [Google Scholar] [CrossRef]
- Omole, D.O.; Alade, O.O.; Emenike, P.C.; Tenebe, I.T.; Ogbiye, A.S.; Ngene, B.U. Quality assessment of a university campus wastewater resource. In Proceedings of the Water and Society 2017, Seville, Spain, 5 June 2017; pp. 193–201. [Google Scholar]
- Ilyas, H.; Van Hullebusch, E. Role of Design and Operational Factors in the Removal of Pharmaceuticals by Constructed Wetlands. Water 2019, 11, 2356. [Google Scholar] [CrossRef]
- Huong, M.; Hoi, B.V.; Hue, N.T.; Thanh, D.T.M. Removal efficiency of Fe, Zn and Ni from wastewater of academic campus using hybrid constructed wetlands. Vietnam J. Chem. 2020, 58, 548–553. [Google Scholar] [CrossRef]
- Porras-Socias, P.; Tomasino, M.P.; Fernandes, J.P.; De Menezes, A.B.; Fernández, B.; Collins, G.; Alves, M.J.; Castro, R.; Gomes, C.R.; Almeida, C.M.R.; et al. Removal of metals and emergent contaminants from liquid digestates in constructed wetlands for agricultural reuse. Front. Microbiol. 2024, 15, 1388895. [Google Scholar] [CrossRef]
- Akumuntu, J.B.; Wehn, U.; Mulenga, M.; Brdjanovic, D. Enabling the sustainable Faecal Sludge Management service delivery chain—A case study of dense settlements in Kigali, Rwanda. Int. J. Hyg. Environ. Health 2017, 220, 960–973. [Google Scholar] [CrossRef] [PubMed]
- UNICEF Rwanda. Children’s Rights and Sustainable Development in Rwanda: A Situation Analysis; UNICEF Rwanda: Kigali, Rwanda, 2017; pp. 1–128. [Google Scholar]
- UNEP/GRID. Pollution-Rwanda, Interactive Country Fiches. Available online: https://dicf.unepgrid.ch/rwanda/pollution (accessed on 30 October 2025).
- UNICEF Rwanda. UNICEF Rwanda Water, Sanitation and Hygiene (WASH) in Rwanda A Situation Analysis; UNICEF Rwanda: Kigali, Rwanda, 2024. [Google Scholar]
- Ministry of Infrastructure National Urbanization Policy–Government of Rwanda 2025. Available online: https://www.mininfra.gov.rw/index.php?eID=dumpFile&t=f&f=118319&token=f2767b737f4a912d39b49c48093a0346e1837f88 (accessed on 4 November 2025).
- Wang, L.; Ma, L.; Wang, J.; Zhao, X.; Jing, Y.; Liu, C.; Xiao, Y.; Li, C.; Jiao, C.; Xu, M. Research Progress on the Removal of Contaminants from Wastewater by Constructed Wetland Substrate: A Review. Water 2024, 16, 1848. [Google Scholar] [CrossRef]
- Kanyeshuri, J. Assessment of a Constructed Wetland Design toTreat the Sewageof University of Lay Adventists of Kigali(UNILAK)–Rwanda. Int. J. Adv. Eng. Manag. (IJAEM) 2021, 3, 892–904. [Google Scholar]
- Nsanzabaganwa, J.; Chen, X.; Liu, T.; Mupenzi, C.; Hakorimana, E.; Mind’je, R.; Mujawayezu, M.L.; Gasirabo, A.; Umugwaneza, A.; Malayika, F.; et al. Impact analysis of constructed wetland for wastewater management in Rwanda. Front. Environ. Sci. 2025, 13, 1559624. [Google Scholar] [CrossRef]
- Nature Trails East Africa Rwanda, Uganda, Kenya Tours and Safaris. Available online: https://www.eastafricantrails.com/ (accessed on 7 October 2025).
- Moulisová, L.; Čížková, H.; Dušek, J.; Kazda, M. Root and rhizome traits of the common reed (Phragmites australis) in a constructed wetland for wastewater treatment. Ecol. Eng. 2023, 186, 106832. [Google Scholar] [CrossRef]
- Chassagne, F.; Morgan, M. Book Review: Underexplored Medicinal Plants from Sub-Saharan Africa: Plants with Therapeutic Potential for Human Health. Front. Pharmacol. 2020, 11, 965. [Google Scholar] [CrossRef]
- Arslan, M.; Devisetty, U.K.; Porsch, M.; Große, I.; Müller, J.A.; Michalski, S.G. RNA-Seq analysis of soft rush (Juncus effusus): Transcriptome sequencing, de novo assembly, annotation, and polymorphism identification. BMC Genom. 2019, 20, 489. [Google Scholar] [CrossRef]
- Waly, M.M.; Ahmed, T.; Abunada, Z.; Mickovski, S.B.; Thomson, C. Constructed Wetland for Sustainable and Low-Cost Wastewater Treatment: Review Article. Land 2022, 11, 1388. [Google Scholar] [CrossRef]
- American Public Health Association. APHA Standard Methods for the Examination of Water and Wastewater, 24th ed.; American Public Health Association: Washington, DC, USA, 2022. [Google Scholar]
- Bulacio Fischer, P.T.; Di Trapani, D.; Laudicina, V.A.; Muscarella, S.M.; Mannina, G. Nutrient Recovery from Zeolite and Biochar Columns: The Case Study of Marineo (Italy) Wastewater Treatment Plant. Water 2025, 17, 848. [Google Scholar] [CrossRef]
- Gupta, P.K. Soil, Plant, Water and Fertilizer Analysis, 2nd ed.; Agro Botanica: Vyas Nagar, India, 2017; ISBN 978-81-7754-306-3. [Google Scholar]
- Torrens, A.; De La Varga, D.; Ndiaye, A.K.; Folch, M.; Coly, A. Innovative Multistage Constructed Wetland for Municipal Wastewater Treatment and Reuse for Agriculture in Senegal. Water 2020, 12, 3139. [Google Scholar] [CrossRef]
- Njau, K.N.; Mwegoha, W.J.S.; Kimwaga, R.J.; Katima, J.H.Y. Use of engineered wetlands for onsite treatment of wastewater by the local communities: Experiences from Tanzania. Water Pract. Technol. 2011, 6, wpt2011047. [Google Scholar] [CrossRef]
- Lavrnić, S.; Zapater Pereyra, M.; Cristino, S.; Cupido, D.; Lucchese, G.; Pascale, M.R.; Toscano, A.; Mancini, M. The Potential Role of Hybrid Constructed Wetlands Treating University Wastewater—Experience from Northern Italy. Sustainability 2020, 12, 10604. [Google Scholar] [CrossRef]
- Vohla, C.; Kõiv, M.; Bavor, H.J.; Chazarenc, F.; Mander, Ü. Filter materials for phosphorus removal from wastewater in treatment wetlands—A review. Ecol. Eng. 2011, 37, 70–89. [Google Scholar] [CrossRef]
- Chi, R.; Wei, Z.; Gong, L.; Zhang, G.; Wen, D.; Li, W. The Study of Nitrogen and Phosphorus Removal Efficiency in Urbanized River Systems Using Artificial Wetland Systems with Different Substrates. Water 2024, 16, 3309. [Google Scholar] [CrossRef]
- Soares, B.S.; Borges, A.C.; De Matos, A.T.; Barbosa, R.B.G.; Silva, F.F.E. Exploring the Removal of Organic Matter in Constructed Wetlands Using First Order Kinetic Models. Water 2022, 14, 472. [Google Scholar] [CrossRef]
- Winanti, E.T.; Rahmadyanti, E.; Fajarwati, I.N. Ecological Approach of Campus Wastewater Treatment using Constructed Wetland. IOP Conf. Ser. Mater. Sci. Eng. 2018, 288, 012062. [Google Scholar] [CrossRef]
- Rahman, M.E.; Bin Halmi, M.I.E.; Bin Abd Samad, M.Y.; Uddin, M.K.; Mahmud, K.; Abd Shukor, M.Y.; Sheikh Abdullah, S.R.; Shamsuzzaman, S.M. Design, Operation and Optimization of Constructed Wetland for Removal of Pollutant. IJERPH 2020, 17, 8339. [Google Scholar] [CrossRef]
- Merino-Solís, M.; Villegas, E.; De Anda, J.; López-López, A. The Effect of the Hydraulic Retention Time on the Performance of an Ecological Wastewater Treatment System: An Anaerobic Filter with a Constructed Wetland. Water 2015, 7, 1149–1163. [Google Scholar] [CrossRef]
- Silveira, E.O.; Lutterbeck, C.A.; Machado, Ê.L.; Rodrigues, L.R.; Rieger, A.; Beckenkamp, F.; Lobo, E.A. Biomonitoring of urban wastewaters treated by an integrated system combining microalgae and constructed wetlands. Sci. Total Environ. 2020, 705, 135864. [Google Scholar] [CrossRef]
- Pereira Da Silva, F.; Lutterbeck, C.A.; Colares, G.S.; Oliveira, G.A.; Rodrigues, L.R.; Dell’Osbel, N.; Rodriguez, A.L.; Rodriguez López, D.A.; Gehlen, G.; Machado, Ê.L. Treatment of university campus wastewaters by anaerobic reactor and multi-stage constructed wetlands. J. Water Process Eng. 2021, 42, 102119. [Google Scholar] [CrossRef]
- Abou-Elela, S.I.; Golinielli, G.; Abou-Taleb, E.M.; Hellal, M.S. Municipal wastewater treatment in horizontal and vertical flows constructed wetlands. Ecol. Eng. 2013, 61, 460–468. [Google Scholar] [CrossRef]
- Akratos, C.S.; Tsihrintzis, V.A. Effect of temperature, HRT, vegetation and porous media on removal efficiency of pilot-scale horizontal subsurface flow constructed wetlands. Ecol. Eng. 2007, 29, 173–191. [Google Scholar] [CrossRef]
- Bebba, A.A.; Labed, I.; Zeghdi, S.; Messaitfa, A. Purification Performance of Typha Latifolia, Juncus Effusus and Papyrus Cyperus in Arid Climate: Influence of Seasonal Variation. J. Water Chem. Technol. 2019, 41, 396–401. [Google Scholar] [CrossRef]
- Mr, S.; Ml, M.; Joseph, S. Analysis of potential of Napier grass, Vetiver and Equisetum plants for the treatment of domestic greywater using box-type constructed wetlands. Water Sci. Technol. 2021, 84, 2913–2922. [Google Scholar] [CrossRef]
- Wiessner, A.; Kappelmeyer, U.; Kaestner, M.; Schultze-Nobre, L.; Kuschk, P. Response of ammonium removal to growth and transpiration of Juncus effusus during the treatment of artificial sewage in laboratory-scale wetlands. Water Res. 2013, 47, 4265–4273. [Google Scholar] [CrossRef]
- Clarke, E.; Baldwin, A.H. Responses of wetland plants to ammonia and water level. Ecol. Eng. 2002, 18, 257–264. [Google Scholar] [CrossRef]
- Kadlec, R.H.; Wallace, S.D. Treatment Wetlands, 2nd ed.; CRC Press: Boca Raton, FL, USA, 2009; ISBN 978-1-56670-526-4. [Google Scholar]
- Vaičiukynienė, D.; Mikelionienė, A.; Baltušnikas, A.; Kantautas, A.; Radzevičius, A. Removal of ammonium ion from aqueous solutions by using unmodified and H2O2-modified zeolitic waste. Sci. Rep. 2020, 10, 352. [Google Scholar] [CrossRef]
- Varma, M.; Gupta, A.K.; Ghosal, P.S.; Majumder, A. A review on performance of constructed wetlands in tropical and cold climate: Insights of mechanism, role of influencing factors, and system modification in low temperature. Sci. Total Environ. 2021, 755, 142540. [Google Scholar] [CrossRef]
- Coleman, J.; Hench, K.; Garbutt, K.; Sexstone, A.; Bissonnette, G.; Skousen, J. Treatment of Domestic Wastewater by Three Plant Species in Constructed Wetlands. Water Air Soil. Pollut. 2001, 128, 283–295. [Google Scholar] [CrossRef]
- Salvato, M.; Borin, M.; Doni, S.; Macci, C.; Ceccanti, B.; Marinari, S.; Masciandaro, G. Wetland plants, micro-organisms and enzymatic activities interrelations in treating N polluted water. Ecol. Eng. 2012, 47, 36–43. [Google Scholar] [CrossRef]
- Wießner, A.; Kappelmeyer, U.; Kuschk, P.; Kästner, M. Influence of the redox condition dynamics on the removal efficiency of a laboratory-scale constructed wetland. Water Res. 2005, 39, 248–256. [Google Scholar] [CrossRef]
- Song, J.; Yu, N.; Zhao, C.; Lv, Y.; Yang, J. Efficiency, Microbial Communities, and Nitrogen Metabolism in Denitrification Biological Filter: Insights into Varied Pore Ceramsite Media. Microorganisms 2025, 13, 1187. [Google Scholar] [CrossRef]
- Shved, O.; Petrina, R.; Chervetsova, V.; Novikov, V. Enhancing efficiency of nitrogen removal from wastewater in constructed wetlands. EEJET 2015, 3, 63. [Google Scholar] [CrossRef]
- Sekomo, C.B.; Rousseau, D.P.L.; Lens, P.N.L. Use of Gisenyi Volcanic Rock for Adsorptive Removal of Cd(II), Cu(II), Pb(II), and Zn(II) from Wastewater. Water Air Soil. Pollut. 2012, 223, 533–547. [Google Scholar] [CrossRef]
- Shin, J.; Kwak, J.; Kim, S.; Son, C.; Lee, Y.-G.; Kim, J.; Bae, S.; Park, Y.; Lee, S.-H.; Chon, K. Highly selective recovery of phosphate ions using a novel carbonaceous adsorbent synthesized via co-pyrolysis of spent coffee grounds and steel slags: A potential phosphatic fertilizer. Chem. Eng. J. 2023, 451, 138978. [Google Scholar] [CrossRef]
- Amasa, W.; Leta, S.; Gnaro, M.A. The application of Scoria-based horizontal subsurface flow constructed wetland for efficient textile wastewater treatment. Results Eng. 2025, 26, 105495. [Google Scholar] [CrossRef]
- Aregu, M.B.; Asfaw, S.L.; Khan, M.M. Identification of two low-cost and locally available filter media (pumice and scoria) for removal of hazardous pollutants from tannery wastewater. Environ. Syst. Res. 2018, 7, 10. [Google Scholar] [CrossRef]
- Menon, R.; Holland, M.M. Phosphorus Retention in Constructed Wetlands Vegetated with Juncus effusus, Carex lurida, and Dichanthelium acuminatum var. acuminatum. Water Air Soil. Pollut. 2013, 224, 1602. [Google Scholar] [CrossRef]
- Amponsah, S.K.; Frimpong, F.; Danquah, E.O.; Amankwa-Yeboah, P.; Amengor, N.E.; Dzomeku, J.B.; Agyemang, S.M.; Adu, J.K.; Frimpong, T.; Azumah, D.D. Performance of a Horizontal Subsurface Flow Constructed Wetland in Treating Aquaculture Wastewater. J. Ecol. Eng. 2024, 25, 53–61. [Google Scholar] [CrossRef]
- Shukla, R.; Gupta, D.; Singh, G.; Mishra, V.K. Performance of horizontal flow constructed wetland for secondary treatment of domestic wastewater in a remote tribal area of Central India. Sustain. Environ. Res. 2021, 31, 13. [Google Scholar] [CrossRef]
- Wu, S.; Austin, D.; Liu, L.; Dong, R. Performance of integrated household constructed wetland for domestic wastewater treatment in rural areas. Ecol. Eng. 2011, 37, 948–954. [Google Scholar] [CrossRef]
- Shuib, N.; Baskaran, K.; Jegatheesan, V. Evaluating the Performance of Horizontal Subsurface Flow Constructed Wetlands Using Natural Zeolite (escott). IJESD 2011, 2, 311–315. [Google Scholar] [CrossRef]
- Tanner, C.C. Plants for constructed wetland treatment systems—A comparison of the growth and nutrient uptake of eight emergent species. Ecol. Eng. 1996, 7, 59–83. [Google Scholar] [CrossRef]
- Garcia Chance, L.M.; Van Brunt, S.C.; Majsztrik, J.C.; White, S.A. Short- and long-term dynamics of nutrient removal in floating treatment wetlands. Water Res. 2019, 159, 153–163. [Google Scholar] [CrossRef]
- Paredes, D.; Kuschk, P.; Stange, F.; Müller, R.A.; Köser, H. Model experiments on improving nitrogen removal in laboratory scale subsurface constructed wetlands by enhancing the anaerobic ammonia oxidation. Water Sci. Technol. 2007, 56, 145–150. [Google Scholar] [CrossRef] [PubMed]
- Liu, F.P.; Xu, J.; Zhao, J.X.; Liu, L.F.; Zhang, M.Y.; Tan, S.C. An experimental study on water purification performance of modified volcanic rock ecological concrete. Sci. Rep. 2025, 15, 1092. [Google Scholar] [CrossRef] [PubMed]
- Li, J.; Zheng, B.; Chen, X.; Li, Z.; Xia, Q.; Wang, H.; Yang, Y.; Zhou, Y.; Yang, H. The Use of Constructed Wetland for Mitigating Nitrogen and Phosphorus from Agricultural Runoff: A Review. Water 2021, 13, 476. [Google Scholar] [CrossRef]
- Mekonnen, D.T.; Alemayehu, E.; Lennartz, B. Adsorptive Removal of Phosphate from Aqueous Solutions Using Low-Cost Volcanic Rocks: Kinetics and Equilibrium Approaches. Materials 2021, 14, 1312. [Google Scholar] [CrossRef]
Disclaimer/Publisher’s Note: The statements, opinions and data contained in all publications are solely those of the individual author(s) and contributor(s) and not of MDPI and/or the editor(s). MDPI and/or the editor(s) disclaim responsibility for any injury to people or property resulting from any ideas, methods, instructions or products referred to in the content. |
© 2025 by the authors. Licensee MDPI, Basel, Switzerland. This article is an open access article distributed under the terms and conditions of the Creative Commons Attribution (CC BY) license (https://creativecommons.org/licenses/by/4.0/).