Abstract
Dams play a vital role in hydropower generation and water management, yet growing environmental and societal demands increasingly require reoperation to balance multiple purposes. Despite this shift, few studies have quantitatively evaluated how converting an existing hydropower dam to multipurpose operation affects downstream hydrology and water quality. This study examines the Hwacheon Dam in South Korea, which was converted to multipurpose use, to assess the effects of this operational change. The analysis focused on changes in the number and frequency of non-release days, downstream flow regime variation, and water quality responses evaluated using the national water quality standards and the real-time water quality index (RTWQI). After the transition, non-release days decreased sharply and the dam maintained continuous releases of 22.2 cubic meters per second (CMS), ensuring stable water supply and consistent downstream flow. Results show that flood, high, and normal flows decreased by 51.4% (from 1037.0 CMS to 503.5 CMS), 21.7% (from 54.4 CMS to 42.6 CMS), and 13.0% (from 23.9 CMS to 20.8 CMS), respectively. In contrast, the low flow increased by 7.4 times (from 2.4 CMS to 20.2 CMS) after the transition to multipurpose operation, while the drought flow increased from 0 CMS to 17.8 CMS. Water quality also improved across all downstream stations, with both national water quality standards and RTWQI scores indicating excellent and stable conditions. The multipurpose operation of the Hwacheon Dam stabilized hydrologic and water quality conditions, demonstrating the potential of dam reoperation for sustainable water and ecosystem management.
1. Introduction
Dams have been constructed worldwide to serve diverse purposes—including domestic water use, industrial supply, agricultural irrigation, hydropower generation, and flood control—reflecting the need to secure and distribute water resources for both human and environmental demands. Many of these structures were designed as multipurpose reservoirs, intended to balance competing objectives across sectors and seasons [,]. However, with increasing pressures from climate change, land-use alteration, environmental degradation, and shifting societal and economic water demands, some reservoirs have become less effective at fulfilling their original design purposes [,,,].
In such cases, operational goals are sometimes redefined to accommodate new priorities, yet transitions from single-purpose to multipurpose management remain relatively rare due to technical, institutional, and ecological complexities [,,]. Against this global backdrop, an increasing number of hydropower reservoirs are being reoperated as multipurpose systems to jointly enhance water-supply reliability, flood-risk mitigation, and downstream ecological health [,]. Such operational transitions fundamentally alter reservoir release patterns, which can propagate downstream as changes in the flow regime and water quality conditions that influence habitat suitability, biogeochemical cycling, and human use [,]. Despite their importance, the downstream consequences of a switch from hydropower to multipurpose operation remain under-documented for many individual dams, particularly where new operating rules are implemented within already regulated river networks.
Such reoperations can substantially modify the natural hydrologic regime, as reservoir regulation fundamentally alters the magnitude, timing, frequency, and duration of downstream flows, reshaping both hydrologic and ecological processes [,]. Studies have shown that adaptive and reoperation strategies can restore key components of the natural flow regime, enhancing ecosystem responses such as fish recruitment without fully reverting to pre-dam conditions []. Optimized multi-objective frameworks that integrate ecological modeling, habitat simulation, and neuro-fuzzy systems demonstrate that reservoir releases can be managed to sustain aquatic habitats across upstream, downstream, and in-reservoir environments []. Comparative analyses reveal that reservoir operations often exert stronger control on flow alteration than climate change itself, suppressing high flow pulses and modifying seasonal extremes [].
Recent efforts have introduced novel indicators and optimization frameworks to better integrate ecological considerations into reservoir management [,,]. New indices such as the outflow variation across time scales and ecological fitness metrics highlight that balancing short- and long-term flow variability can improve ecological outcomes without compromising water supply or hydropower objectives []. Incorporating hydrologic alteration parameters into optimization models enables operators to reconcile economic and ecological objectives, producing flow regimes that preserve variability essential to river ecosystems []. At broader scales, analyses of dammed rivers across the United States reveal that dams alter not only flow magnitude but also dominant temporal periodicities, leaving a lasting human signature on hydrologic rhythms []. Quantifying flow disturbance effects on aquatic community stability shows that greater alteration decreases resilience and recovery capacity, whereas optimized outflow rules can enhance both ecological resistance and socioeconomic benefits []. Research converges on the idea that reoperation and adaptive management—rather than structural modification—provide practical pathways to restore functional flow dynamics and mitigate ecological degradation while sustaining reservoir services []. These hydrologic alterations, in turn, influence downstream water quality conditions, linking flow regulation directly to the chemical and thermal environment of receiving rivers.
Building on this connection, reservoir operation profoundly affects downstream water quality, as release depth, storage level, and internal mixing dynamics determine the thermal, chemical, and nutrient characteristics of discharged water [,,]. Variations in operating rules can modify nutrient cycling and sediment–water exchanges, with higher storage levels promoting ammonium release yet enhancing nitrogen removal through denitrification []. Water diversion and inter-reservoir transfers modify spatial and seasonal pollutant distributions, often intensifying downstream concentrations and necessitating continuous monitoring []. Integrating hydrodynamic–eutrophication–sediment models into operational decision-making has revealed trade-offs between environmental flow releases and nutrient dilution capacity, underscoring the need to balance ecological and water-quality objectives []. Adaptive operation under climate change can mitigate salinity accumulation and maintain acceptable total dissolved solids through optimized discharge strategies []. Multi-objective optimization frameworks now enable simultaneous management of water-supply reliability and thermal or salinity targets, achieving quality–quantity trade-offs efficiently []. The transboundary reservoir modeling demonstrates that hydropower operations and stratification patterns control downstream temperature and oxygen regimes, but coordinated selective withdrawal can mitigate these impacts []. Maintaining higher water levels in the reservoir operation can simultaneously reduce methane emissions and improve water quality []. Recent reviews emphasize growing advances in integrating water quantity and quality objectives, offering promising pathways for sustainable, multi-purpose reservoir management []. These studies suggest that reservoir operation decisions—ranging from flood discharge to environmental flows—fundamentally shape water quality outcomes, yet reoperation cases explicitly assessing such effects remain limited.
Other frameworks emphasize the integration of ecological and operational goals. Optimization models combining downstream flow needs and water quality objectives improve release scheduling for both ecosystem health and water-supply reliability []. Stochastic and conflict-resolution approaches incorporating water quality simulations reduce reservoir salinity and enhance downstream conditions while balancing stakeholder interests []. At the watershed scale, coupling best management practices with operational strategies effectively improves nutrient retention and outflow quality []. Hydrologic–water quality modeling shows that selective withdrawal from specific reservoir layers can enhance discharge quality by altering internal biochemical conditions [], while evolutionary algorithms yield flexible Pareto-optimal operation policies balancing irrigation, hydropower, and water quality objectives [].
While numerous studies have investigated the economic and direct benefits of converting hydropower dams to multipurpose use, research remains limited on how such operational transitions alter downstream hydrologic and water quality regimes. Existing studies on reservoir reoperation have primarily focused on optimizing water allocation or assessing hydropower trade-offs, with fewer efforts to empirically link changes in release strategies to downstream ecological responses. The Hwacheon Dam in South Korea provides a valuable case to address these gaps, as its policy-driven transition from hydropower to multipurpose operation involved substantial changes in release strategies, offering a unique opportunity to evaluate coupled hydrologic and water quality responses. This study advances previous research by quantitatively evaluating the downstream impacts of altered reservoir release strategies on both flow regime and water quality. Such an integrated assessment highlights the broader hydrologic and environmental implications of dam reoperation and offers a transferable framework for evaluating future management transitions in regulated river systems.
Building on these research gaps, this study aims to examine the effects of the operational change at the Hwacheon Dam by comparing conditions before and after the transition to multipurpose operation. The specific objectives are to analyze the number and frequency of non-release days, evaluate downstream hydrologic responses through variations in the flow regime, and assess downstream water quality conditions using two complementary evaluation frameworks—the national water quality standards and the RTWQI. The main novelty of this study is to quantitatively evaluate how the shift from hydropower to multipurpose operation has affected both flow regime and downstream water quality, providing empirical evidence of its contribution to stable river regime and ecosystem improvement.
2. Materials and Methods
2.1. Study Area
South Korea, located in East Asia, has a temperate monsoon climate with four distinct seasons. Average annual precipitation is approximately 1294 mm, of which nearly two-thirds falls between June and September during the summer monsoon. Winters are generally cold and dry, while summers are hot and humid. The country’s mountainous terrain, which covers about 70% of its land area, contributes to steep river gradients and rapid runoff, making floods and droughts frequent hydrological challenges. Recent climate trends indicate more intense summer rainfall and prolonged dry spells, increasing the importance of water storage and management infrastructure.
South Korea has five major rivers: the Han, Nakdong, Geum, Seomjin, and Yeongsan. Among them, the Han River Basin is the largest, with a drainage area of about 34,000 km2. The basin flows through the Seoul metropolitan region, home to nearly half of the nation’s population and a hub of political, economic, and industrial activity. The Han River is highly regulated by large dams, which provide municipal water supply, flood control, irrigation, and hydropower. Key reservoirs include the Soyang, Chungju, and Hwacheon dams, which play a central role in water resources management for the basin and the country.
Hwacheon Dam, the focus of this study, is one of the earliest and most significant dams in South Korea (Figure 1). Completed in 1944, it is a concrete gravity dam with a height of 81.5 m and a crest length of 435 m. The dam has a total storage capacity of 1018 million cubic meters (MCM), of which 747 MCM is effective storage. Its reservoir drains a catchment of approximately 3901 km2. Originally designed for hydropower production, the Hwacheon Dam was reoperated in April 2020 to serve multiple objectives. The installed hydropower capacity is about 108 MW, making it an important facility in South Korea’s renewable energy system. However, the need to balance power generation with downstream water demands and flood management has created operational trade-offs that are central to this study.
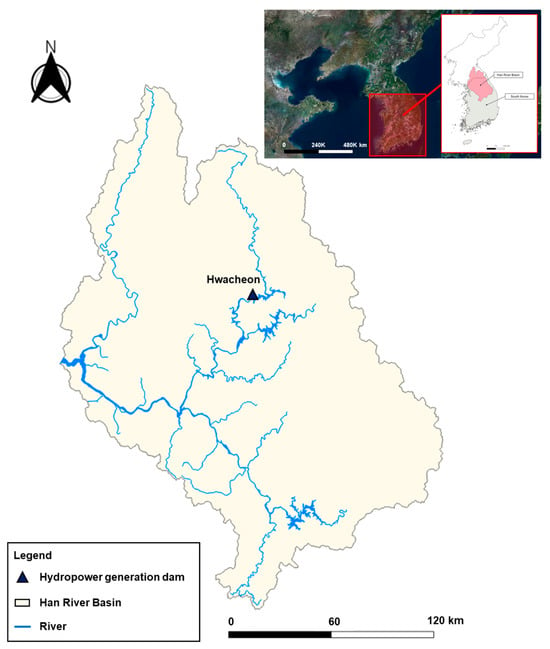
Figure 1.
Location of the Hwacheon Dam in the Han River Basin, South Korea. The Han River Basin is the largest river basin in the South Korea. Source: National Geographic Information Institute (NGII, https://www.ngii.go.kr/; accessed on 30 June 2025).
2.2. Workflow and Analytical Framework
Figure 2 shows the workflow of this study. In Step 1, we collected hydrologic (e.g., dam release, downstream discharge) and water quality dataset. In Step 2, we preprocessed the collected datasets. For periods when downstream discharge data were unavailable, we generated the missing records using a relationship between dam release volumes and observed downstream flow. In Step 3A, we analyzed the number of non-release days at Hwacheon Dam to assess changes in continuous downstream water release. In Step 3B, we quantified flow regime changes by calculating flow metrics and evaluating shifts in the flow duration curve (FDC). In Step 3C, we analyzed downstream water quality by analyzing national water quality standards and the RTWQI to evaluate temporal changes. In Step 4, we compared the results from the pre-multipurpose operation period (before water year 2020) and the post-multipurpose operation period (after water year 2021).
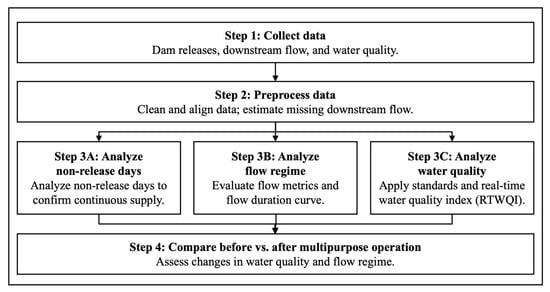
Figure 2.
Study workflow for evaluating downstream impacts of Hwacheon Dam before and after multipurpose operation.
2.3. Data Collection and Preprocessing
For this analysis, we used data from 2004 to 2024, although the Hwacheon Dam was originally constructed in 1944. The operational regime of the Hwacheon Hydropower Dam underwent substantial changes after North Korea completed the Imnam Dam in 2004. Following the Imnam Dam’s diversion of upstream flows eastward to the East Sea for power generation, inflows to the Hwacheon Dam decreased significantly [].
2.3.1. Downstream Discharge Data
Since no gauging station exists downstream of the Hwacheon Dam for flow regime analysis, we measured discharge at the Guman Bridge site (38°06′11″ N, 127°45′39″ E), located about 700 m downstream of the dam (Figure 3). From June 2022 to September 2023, we measured discharge 16 times at the Guman Bridge. When we compared dam release data with observed discharge at the Guman Bridge, we found a very high correlation coefficient of 0.9909. The Hwacheon Dam and Guman Bridge sites are only about 700 m apart, with no tributary inflows between them. Because the river channel is narrow, the effects of evaporation and infiltration losses are negligible. Therefore, the discharge at the two sites shows a very strong correlation (r = 0.9909), confirming that it is reasonable to use the Guman Bridge discharge as a substitute for the dam release data. We used the dam release records as the downstream discharge data for the flow regime analysis. We obtained downstream discharge data from the Korea Hydro & Nuclear Power Co. (https://www.khnp.co.kr/main/index.do; accessed on 30 June 2025).
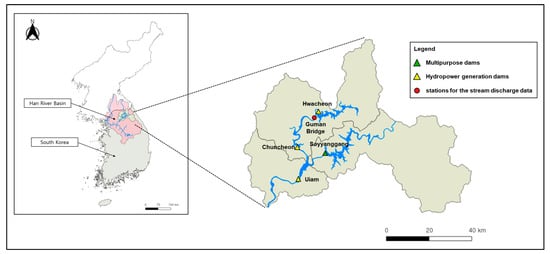
Figure 3.
Guman Bridge located immediately downstream of Hwacheon Dam was used for flow regime analysis. Source: National Geographic Information Institute (NGII, https://www.ngii.go.kr/; accessed on 30 June 2025).
2.3.2. Downstream Water Quality Data
We collected data from ten water quality monitoring stations located between the Hwacheon Dam and the Uiam Dam. One station (Hwacheon, 38°05′35″ N, 127°45′26″ E) lies downstream of the Hwacheon Dam. Three stations in Lake Chuncheon (Chuncheon Dam 1: 37°58′44″ N, 127°39′00″ E; Chuncheon Dam 2: 37°58′08″ N, 127°40′06″ E; Chuncheon Dam 3: 38°01′49″ N, 127°38′48″ E) represent conditions within the reservoir. Three stations downstream of the Chuncheon Dam (Chuncheon 1: 37°53′58″ N, 127°44′36″ E; Chuncheon 2: 37°56′47″ N, 127°42′23″ E; Chuncheon 3: 37°55′19″ N, 127°43′02″ E) were used to monitor riverine water quality. Finally, three stations in Lake Uiam (Uiam Dam 1: 37°50′15″ N, 127°40′33″ E; Uiam Dam 2: 37°53′37″ N, 127°41′41″ E; Uiam Dam 3: 37°52′38″ N, 127°41′48″ E) were included to capture spatial variability within the reservoir (Figure 4 and Figure 5). The downstream water quality data were obtained from the Water Environment Information System (https://water.nier.go.kr/web; accessed on 30 June 2025), which provides open public access.
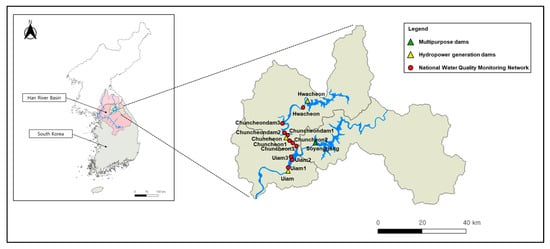
Figure 4.
Distribution of the National Water Quality Monitoring Network stations in the study area. A total of ten monitoring stations is located between Hwacheon Dam and Uiam Dam. Source: National Geographic Information Institute (NGII, https://www.ngii.go.kr/; accessed on 30 June 2025).
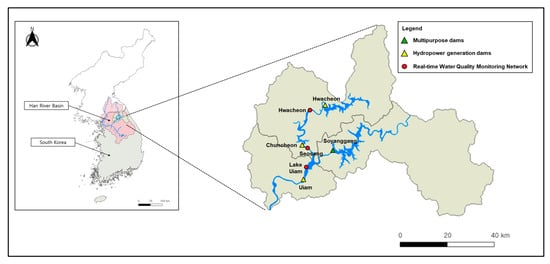
Figure 5.
Distribution of the real-time water quality monitoring network stations in the study area. A total of three monitoring stations are located between Hwacheon Dam and Uiam Dam. Source: National Geographic Information Institute (NGII, https://www.ngii.go.kr/; accessed on 30 June 2025).
Among the ten monitoring stations, only the Chuncheon 2 station provides monthly and annual data, while the other sites provide daily data in addition to monthly and annual data. To ensure consistency in the analysis, we analyzed water quality monthly according to the lake and river water quality standards, using data available for each station. When multiple national water quality standard stations existed within a section, we used the average values to determine the grade. Because the grading criteria differ between lakes and rivers, we determined the water quality grade for each station based on the applicable standard. We determined the water quality grades for the Hwacheon station located downstream of the Hwacheon Dam and for the Chuncheon 1, Chuncheon 2, and Chuncheon 3 stations located downstream of the Chuncheon Dam using the river water quality standards. We determined the water quality grades for the Chuncheon Dam 1, Chuncheon Dam 2, and Chuncheon Dam 3 stations located at the Chuncheon Dam, and for the Uiam Dam 1, Uiam Dam 2, and Uiam Dam 3 stations located at the Uiam Dam, using the lake water quality standards.
Among the ten monitoring stations, Chuncheon Dam 1, 2, and 3 and Uiam Dam 1, 2, and 3 follow the lake water-quality standards. We collected data for 10 parameters defined in these standards: power of Hydrogen (pH), Chemical Oxygen Demand (COD), Total Organic Carbon (TOC), Suspended Solids (SS), Dissolved Oxygen (DO), Total Phosphorus (T-P), Total Nitrogen (T-N), Chlorophyll-a (Chl-a), total coliforms, and fecal coliforms. The Hwacheon station and Chuncheon 1, 2, and 3 follow the river water quality standards. We collected data for nine parameters defined in these standards: pH, Biochemical Oxygen Demand (BOD), COD, TOC, SS, DO, T-P, total coliforms, and fecal coliforms.
The real-time water quality monitoring network stations also operate between the Hwacheon Dam and the Uiam Dam. Three stations exist: Hwacheon (38°05′57″ N, 127°42′33″ E) downstream of the Hwacheon Dam, Seosang (37°57′20″ N, 127°41′09″ E) downstream of the Chuncheon Dam, and Lake Uiam (37°52′40″ N, 127°40′43″ E) upstream of the Uiam Dam. The real-time water quality monitoring network stations measure water temperature, pH, DO, Electrical Conductivity (EC), TOC, T-N, T-P, and turbidity. We collected data for these parameters from all three stations.
2.4. Flow Regime Analysis
A FDC shows the relationship between streamflow magnitude and the percentage of time that flow is equaled or exceeded. It provides a straightforward way to describe flow variability from low flows to high flows. We analyzed Q10, Q25, Q50, Q75, and Q90 to examine river flow regimes. Here, Q10, Q25, Q50, Q75, and Q90 correspond to exceedance probabilities of 10%, 25%, 50%, 75%, and 90%, representing flood, high, normal, low, and drought flows, respectively. The flow regime index represents flow conditions relative to the normal flow []. We defined the flood flow, high flow, low flow, and drought flow indices as the ratios of each flow (flood, high, low, and drought) to the normal flow. Smaller index values (flood flow and high flow) indicate less variability at higher flows, while larger index values (low flow and drought flow) indicate less variability at lower flows. Index values closer to 1 indicate a more stable flow regime.
2.5. Water Quality Analysis
For water quality analysis, we analyzed downstream water quality by analyzing national water quality standards (see Section 2.5.1) and the RTWQI (see Section 2.5.2) to evaluate temporal changes.
2.5.1. National Water Quality Standards
The national water quality standards for lakes and reservoirs in Korea are classified into seven grades: very good, good, slightly good, fair, slightly poor, poor, and very poor [] (Table 1).

Table 1.
Water quality standards for lakes and reservoirs, where Total Algal Count (TAC) and Cyanobacterial Count (CC) are used as indicators.
The very good grade represents a clean ecosystem with abundant DO and no pollutants, where the water can be used for domestic purposes after simple treatment processes such as filtration and disinfection. The good grade indicates a condition close to a clean state, with relatively high DO and minimal pollutants, where the water can be used for domestic or recreational purposes after treatment processes such as filtration, sedimentation, and disinfection. The slightly good grade represents a moderately healthy ecosystem with high DO levels and slight pollution, where the water can be used for domestic or recreational purposes after standard treatment processes such as filtration, sedimentation, and disinfection.
The fair grade represents a typical ecosystem where moderate levels of pollutants lead to DO depletion. Water in this condition can be used for domestic purposes after advanced treatment processes such as filtration, sedimentation, activated carbon application, and disinfection, or for industrial use after standard treatment.
The slightly poor grade indicates a condition where considerable amounts of pollutants cause DO depletion, and the water can be used for agricultural purposes or for industrial use after advanced treatment processes. The poor grade represents a condition in which large amounts of pollutants lead to significant DO depletion, and the water can be used for industrial purposes only after specialized treatment processes such as activated carbon application or reverse osmosis. The very poor grade refers to highly polluted water with almost no DO, representing a condition unsuitable for most aquatic life.
The water quality standards for lakes and reservoirs in Korea include ten parameters: pH, COD, TOC, SS, DO, T-P, T-N, Chl-a, total coliform count, and fecal coliform count. If any one of these parameters fails to meet the threshold specified for a given grade, the water body is classified into the next lower grade.
The river water quality standards are classified into seven grades, identical to those used for lakes and reservoirs, and each grade carries the same meaning (Table 2). Compared to the lake and reservoir standards, the river water quality standards include nine parameters, excluding only Chl-a. Similarly, when assessing water quality grades under the river standards, all parameter-specific criteria for a given grade must be met for the water body to be classified into that grade.

Table 2.
Water quality standards for rivers, where Total Algal Count (TAC) and Cyanobacterial Count (CC) are used as indicators.
2.5.2. Real Time Water Quality Index
The RTWQI is an index provided by the Water Environment Information System (https://water.nier.go.kr/web; accessed on 30 June 2025) that converts the comprehensive water quality status of rivers and lakes into a simple numerical score and grade. We calculated the RTWQI for the period from July 2012 to June 2024. Unlike the dataset used for the national water quality standards, where measurements are typically conducted once a week at most sites, the RTWQI is calculated using data from the automatic monitoring network, which measures water quality on an hourly basis and provides daily records. The eight parameters measured by the automatic monitoring network include water temperature, pH, DO, EC, TOC, T-N, T-P, and turbidity (Table 3).

Table 3.
Criteria for flow regime indices used in hydrologic assessment.
The RTWQI is calculated using three factors—F1, F2, and F3. F1 represents the number of water quality parameters among the eight that exceed their standard values at least once during the monitoring period. It is calculated by dividing the number of parameters exceeding the standard by the total number of parameters (Equation (1)). F2 represents the frequency of exceedance for each water quality parameter. It is calculated by dividing the total number of exceedances during the monitoring period by the total number of measurements (Equation (2)). F3 represents the magnitude of exceedance and is calculated as the sum of the fractional exceedances of the standard values for each water quality parameter (Equation (3)).
where NPE is the number of parameters exceeding the standard, TNP is the total number of parameters, TNE the total number of exceedances during the monitoring period, TNM is the total number of measurements, NSE (normalized sum of excursions), which represents the average degree to which measured water quality values exceed the standard, quantitatively expressing how much the overall measurements exceed the specified criteria.
The RTWQI is calculated using the factors F1, F2, and F3 in Equation (4), and the resulting value ranges from 0 to 100.
The RTWQI is classified into five grades based on its score range: 80–100 is classified as excellent, 60–79 as good, 40–59 as fair, 20–39 as poor, and 0–19 as very poor. The excellent grade represents clean water with almost no pollutants, suitable for recreational activities at all times. The good grade indicates relatively good water quality that remains appropriate for recreational use. The fair grade generally reflects good water quality but may occasionally be affected by pollutant inflow, potentially influencing recreational activities. The poor grade indicates frequent inflows of pollutants, requiring caution during recreational use. The very poor grade represents highly polluted water that is unsuitable for recreational activities.
3. Results and Discussion
3.1. Non-Release Days Before and After Multipurpose Operation
The number of non-release days was examined to verify whether continuous water supply had been implemented following the dam’s multipurpose operation agreement. Before its multipurpose operation, the Hwacheon Dam was operated solely for power generation, following a peak-power generation pattern in which more electricity was produced on weekdays than on weekends or public holidays. Before the multipurpose operation (water year 2005–2020), out of a total of 1705 non-release days, 1079 days (63.3%) occurred on weekends and public holidays, while 626 days (36.7%) occurred on weekdays. However, after the multipurpose operation began (after water year 2021), a constant discharge of 22.2 CMS has been maintained to ensure a stable water supply. As a result, the number of non-release days at the Hwacheon Dam decreased significantly after the start of its multipurpose operation. Before the multipurpose operation, the dam had an average of 107 non-release days per water year, meaning that for about 30% of the year, no water was released, and all inflows were stored. After the start of multipurpose operation, the Hwacheon Dam released water continuously without any non-release periods, except for nine days in water year 2021 when discharge was halted due to dam maintenance work (Figure 6). With the Hwacheon Dam now releasing water continuously, the period of sustained downstream flow has increased substantially compared to the pre-multipurpose operation period. This change suggests that the dam can contribute more stably to water supply and help maintain a healthy downstream river ecosystem.
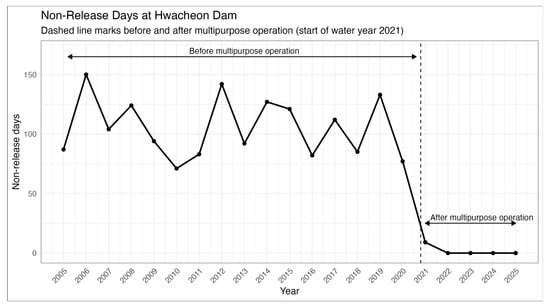
Figure 6.
Non-release days at Hwacheon Dam before and after implementation of multipurpose operation (water year 2021).
3.2. Flow Regime Before and After Multipurpose Operation
We calculated the annual flood flow, high flow, normal flow, low flow, and drought flow at the Guman Bridge based on the water year from 2005 to 2024 (Figure 7). From 2005–2020 (before multipurpose operation), the Guman Bridge showed high flood, high, and normal flows (averages: 1037.0 CMS, 54.5 CMS, and 23.9 CMS) with very limited low flow (2.4 CMS) and no drought flow. After the operational shift (2021–2024), flood, high, and normal flows declined to 503.5 CMS, 42.6 CMS, and 20.8 CMS on average, while low and drought flows rose sharply to 20.3 CMS and 17.8 CMS on average. These patterns indicate reduced high flow magnitudes and strongly augmented low flow continuity consistent with constant releases under multipurpose operation.
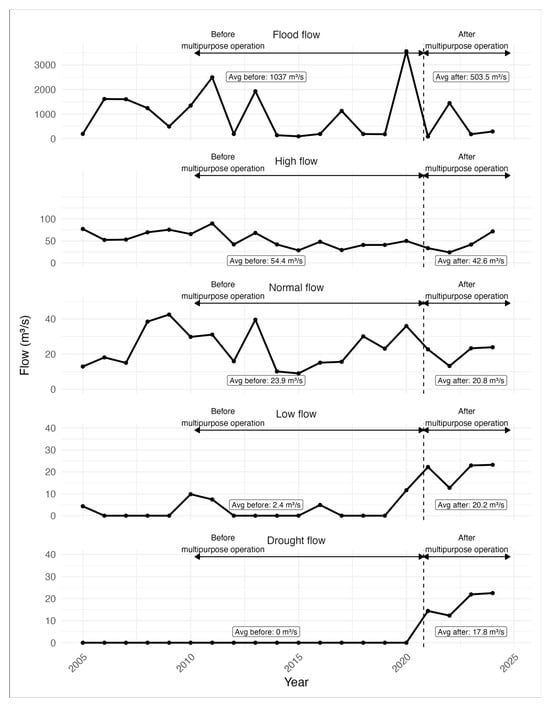
Figure 7.
Annual variations in five flow components downstream of the Hwacheon Dam (Guman Bridge) before and after multipurpose operation. The dashed line marks October 2020, and the boxes indicate period averages.
We calculated the flood-flow index, high-flow index, low-flow index, and drought-flow index, which represent the ratio of each flow to the normal flow. These flow indices indicate the degree of variation in flow conditions relative to the average river flow, and values closer to 1 signify a more stable flow regime (Figure 8). From 2005–2020, the Guman Bridge showed a flood-flow index averaging 41.49 and a high-flow index of 2.64, while the low-flow and drought-flow indices stayed near 0.10 and 0.00. From 2021–2024, the flood-flow index decreased to an average of 31.21 and the high-flow index dropped to 1.76, indicating weaker peak conditions overall (with a single flood year in 2022 pushing the flood-flow index to 109.71). Over the same period, the low-flow index rose from 0.10 to 0.98 and the drought-flow index increased from 0.00 to 0.86, both approaching 1 and indicating that low and drought flows became much more stable and continuous.
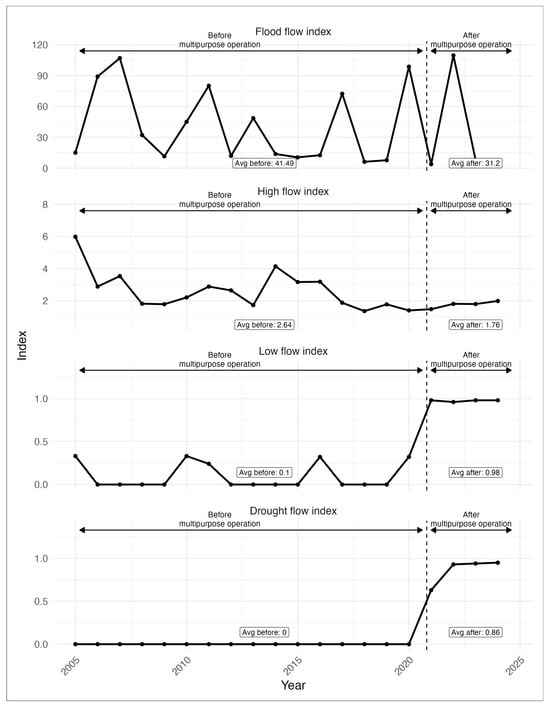
Figure 8.
Annual variations in five flow indices downstream of the Hwacheon Dam (Guman Bridge) before and after multipurpose operation. The dashed line marks October 2020, and the boxes indicate period averages.
An increase in low flow indicates that the river now maintains or enhances aquatic habitats essential for sustaining diverse species within the riverine ecosystem. The enhanced flow also helps dilute pollutants, improving water quality and making it more suitable for water use. In addition, maintaining a consistent discharge from upstream to downstream supports stable water resource management and reliable hydropower operation.
When annual flow duration curves at the Guman Bridge were plotted for water years 2005–2024, adjusting the flow range to 0–100 CMS to emphasize the low flow section made the interannual differences in the flow duration curves more distinct (Figure 9). During 2005–2020, the pre-operation period (gray band) showed median discharges that decreased gradually with duration, representing a typical unimodal hydrologic regime dominated by seasonal inflows. The post-2020 flow regime reflected enhanced regulation and attenuation, characterized by more pronounced extremes (lower lows) and reduced interannual variability in low flows. The duration of low flows (355 days) and drought flows (275 days) increased after the transition to multipurpose operation, suggesting that downstream baseflow conditions have become more stable under the new operational regime.
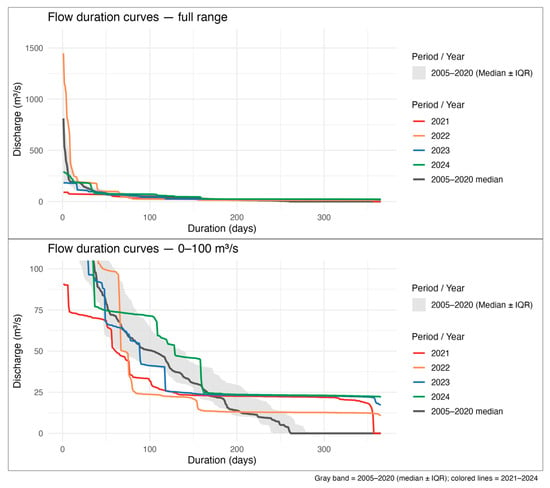
Figure 9.
Flow duration curves at the Guman Bridge for the hydrological years 2005–2024. The upper panel illustrates the full discharge range, whereas the lower panel focuses on the 0–100 CMS range.
3.3. Water Quality Before and After Multipurpose Operation
3.3.1. Evaluation Based on National Water Quality Standards
Monthly water quality records were examined for the downstream Hwacheon station covering January 2008 to September 2024, spanning 201 months of observations. From 2008 to 2020, the Hwacheon station showed predominantly good grades, with intermittent very good months that peaked at five in 2014 and three in 2015 (Figure 10). Fair months appeared in several years, including 2008, 2010, 2013, 2016, 2017, 2019, and 2020, while slightly poor conditions occurred in 2009, 2016, and 2020. No poor or very poor grades were recorded during this period, indicating generally high but occasionally variable water quality. After the operational change, water quality further improved and stabilized. The transition year 2021 still included one fair and one slightly poor month, but from 2022 onward, lower grades disappeared entirely. Between 2022 and 2024, only very good, good, and a few slightly good months were observed, with the number of very good months increasing to three in 2022, one in 2023, and four in 2024. The water quality after 2020 remained consistently high and showed clear improvement compared to the pre-change period, reflecting enhanced stability following the shift to multipurpose operation.
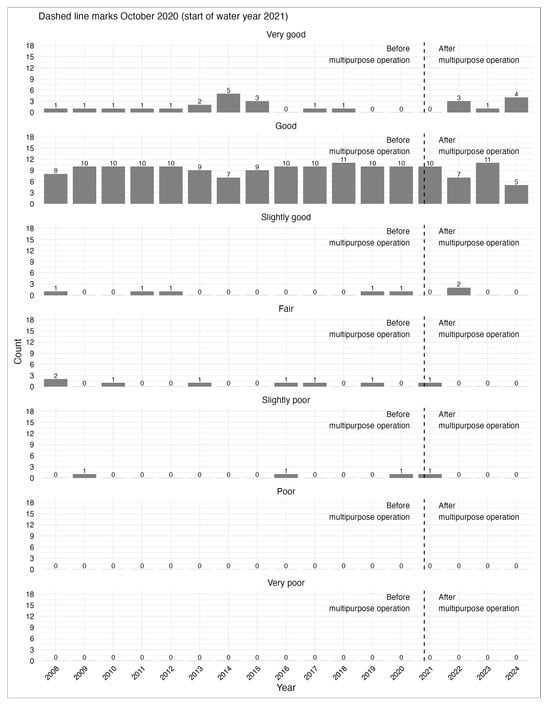
Figure 10.
Yearly distribution of water quality grades at the Hwacheon station.
For the Chuncheon Dam station, available monthly water quality data from July 2010 to September 2024 (149 months) were used in the analysis. At the Chuncheon Dam, analysis of three monitoring sites (Chuncheon Dam 1–3) revealed consistently low water quality during 2010–2020, with slightly poor months recurring and very poor conditions emerging in 2010 and 2014. Slightly poor grades peaked at six months in 2016, five in 2019, and four in 2020, whereas good months seldom exceeded six and very good grades were absent (Figure 11). After the operational change, conditions improved overall: 2021 remained mixed (four slightly poor, three fair, three good), but 2022–2023 shifted strongly to high grades (2022: three very good, seven good; 2023: one very good, ten good) with only one fair each year and no poor or very poor. In 2024, performance softened (two good, four slightly good, two slightly poor) but still avoided poor or very poor. The post-2020 period shows a clear rise in high grades and a marked reduction in fair and worse outcomes compared with 2016–2020, despite some variability in 2024.
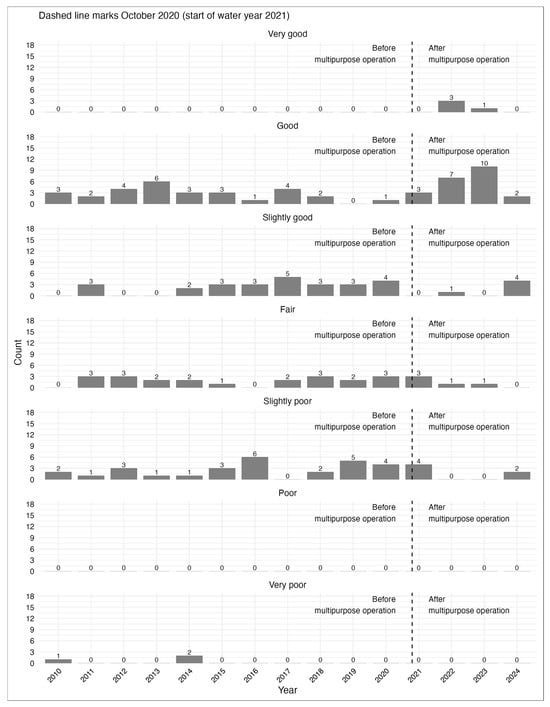
Figure 11.
Temporal variation in annual water quality grades at the Chuncheon Dam station.
We assessed the downstream Chuncheon station water quality trends over the 201-month period from January 2008 to September 2024. Because the data periods differ among the three downstream stations (Chuncheon 1, Chuncheon 2, and Chuncheon 3), we determined the water quality grades using the average values of the stations with available data for each analysis period. From 2008–2020, the Chuncheon station mostly recorded good grades, but quality fluctuated: very poor months appeared in 2014, 2016, and 2019; fair months became frequent in 2018–2020 (peaking at six in 2020); and very good was virtually absent (only one month in 2010) (Figure 12). After the operational change, grades shifted upward and stabilized. No slightly poor or very poor months occurred, fair was limited to at most one month per year (none in 2024), and very good emerged prominently (four in 2023 and two in 2024), with the remaining months predominantly good (11 in 2022; seven in 2024).
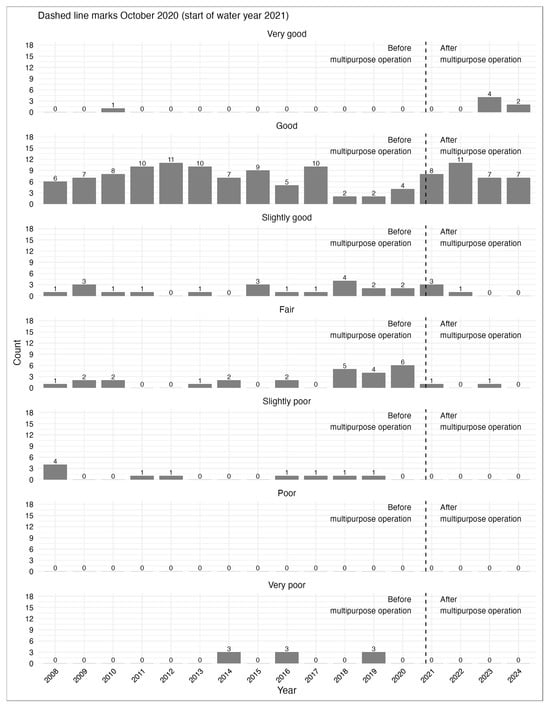
Figure 12.
Changes in annual frequency of water quality grades at the Chuncheon station.
Monthly datasets from the Uiam Dam station, available from August 2009 through June 2024 (180 months), were analyzed to evaluate temporal patterns in water quality. As the monitoring periods varied among the three stations located at the Uiam Dam (Uiam Dam 1, Uiam Dam 2, and Uiam Dam 3), the water quality grades were determined using the average values of the stations with available data for each analysis period. From 2009–2020, the Uiam Dam station frequently recorded low grades: slightly poor appeared in every year and peaked at eight months in 2020; very poor occurred in 2010, 2012, 2014, and 2016; and fair months were common, while good months remained modest and very good never appeared (Figure 13). After the operational change, conditions improved and stabilized: 2021 still showed five slightly poor months, but from 2022 onward slightly poor and very poor disappeared, and the distribution shifted toward higher grades—2022 had seven good months (with only one slightly poor), 2023 had eight good and four fair, and 2024 featured mostly good and slightly good with just one fair. The post-2020 period shows a clear reduction in fair-or-worse outcomes and a sustained rise in good or slightly good conditions.
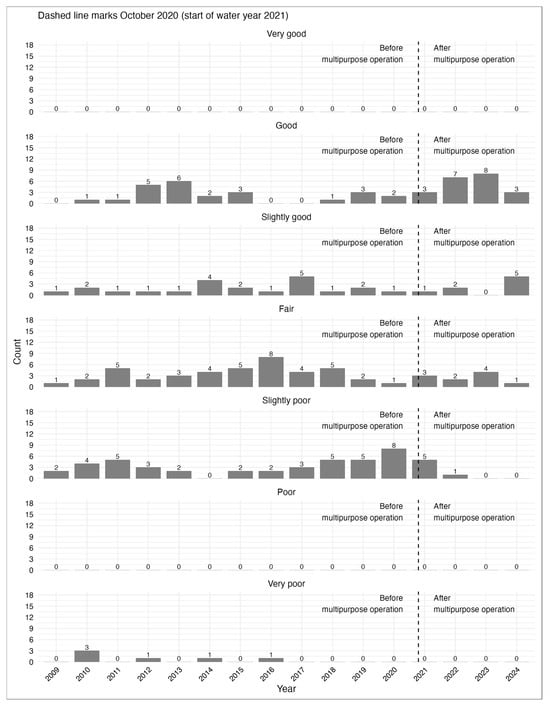
Figure 13.
Annual pattern of water quality grades at the Uiam Dam station.
3.3.2. Evaluation Based on RTWQI
2012 to 2024, RTWQI values at all three stations—Hwacheon, Seosang, and Lake Uiam—remained consistently high, ranging between 98 and 100, indicating excellent water quality throughout the study period (Figure 14). The Hwacheon station maintained stable conditions, with values mostly above 99.4 except for a slight dip in 2015 (98.90). Seosang and Lake Uiam showed similar patterns, both reaching perfect scores (100) in 2018 and 2024. After the start of multipurpose operation in 2020, all stations sustained or slightly improved their RTWQI levels, suggesting that continuous releases from the Hwacheon Dam contributed to maintaining high and stable downstream water quality. Overall, no significant deterioration occurred during the transition, and all sites consistently represented the excellent RTWQI category.
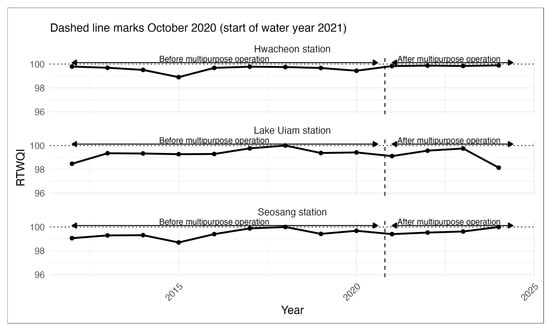
Figure 14.
Annual variation in RTWQI at Hwacheon, Seosang, and Lake Uiam stations before and after multipurpose operation.
4. Conclusions
This study aimed to examine the effects of the operational change at the Hwacheon Dam by comparing conditions before and after the transition to multipurpose operation. The specific objectives were to analyze the number and frequency of non-release days, evaluate downstream hydrologic responses through variations in the flow regime, and assess downstream water quality conditions using two complementary evaluation frameworks—the national water quality standards RTWQI.
After the transition to multipurpose operation, the Hwacheon Dam showed reduction in non-release days, demonstrating a shift from intermittent hydropower-driven releases to continuous flow management. Before the operational change, the dam averaged 107 non-release days per year, accounting for roughly 30% of the year with no downstream discharge. Since 2021, the dam has maintained a steady release of 22.2 CMS, with only brief interruptions for maintenance. This continuous release pattern indicates improved water supply stability and supports healthier downstream river ecosystems.
The analysis of flow regimes at the Guman Bridge revealed a clear hydrologic shift following the transition to multipurpose operation. Flood, high, and normal flows decreased notably, while low and drought flows increased significantly, reflecting more stable and continuous discharge conditions. Following the transition to multipurpose operation, flood, high, and normal flows decreased by 51.4%, 21.7%, and 13.0%, respectively, while low and drought flows increased substantially—by 7.4 times and from zero to 17.8 m3/s—indicating enhanced flow continuity and improved drought-period releases downstream. The corresponding flow indices showed reduced peak variability and near-uniform low and drought flow values approaching 1, indicating a transition toward a steadier river regime. These changes suggest that the multipurpose operation improved flow stability, enhanced habitat conditions for aquatic species, and supported more reliable downstream water management.
Water quality across all downstream stations improved noticeably following the transition to multipurpose operation. At the Hwacheon, Chuncheon, and Uiam Dam stations, post-2020 data showed fewer fair or poor grades and a marked rise in good and very good conditions, indicating enhanced and more stable water quality. The RTWQI further confirmed this trend, with consistently excellent scores (98–100) at all stations and slight increases after 2020. These results suggest that continuous releases under multipurpose operation not only stabilized hydrologic conditions but also contributed to maintaining and improving downstream water quality.
Limitations include the relatively short post-operation period, which makes it difficult to capture long-term trends. Another limitation is the lack of continuous observed flow data at the Guman Bridge, which required using dam release records as an alternative source. Establishing direct flow and water level monitoring downstream would allow for more accurate assessment of downstream hydrologic responses. This study focused primarily on hydrologic and water quality parameters without incorporating ecological indicators.
Future studies should separate the effects of climate variability from operational impacts as more annual data become available to enable more reliable evaluations. Future research should also integrate biological and habitat-based assessments to better understand how hydrologic and water quality improvements influence downstream ecosystem health.
The multipurpose operation of the Hwacheon Dam secured a stable water supply and delivered stabilized downstream flows and improved water quality. These outcomes demonstrate the practical effectiveness of converting a single-purpose hydropower operation into a multipurpose operation. By ensuring continuous water releases, the dam has enhanced both hydrologic reliability and ecological conditions in the downstream river system. This study provides one of the few quantitative, systematic case studies analyzing the actual impacts of dam reoperation on hydrology and water quality, offering a valuable reference for future water management and operational planning.
Author Contributions
Conceptualization, J.Y. (Jeongin Yoon), E.L. and J.Y. (Jaeeung Yi); methodology, J.Y. (Jeongin Yoon), E.L. and J.Y. (Jaeeung Yi); software, J.Y. (Jeongin Yoon); validation, J.Y. (Jeongin Yoon); formal analysis, J.Y. (Jeongin Yoon); investigation, J.Y. (Jeongin Yoon); resources, J.Y. (Jeongin Yoon), E.L., J.J., S.Y., S.L. and J.Y. (Jaeeung Yi); data curation, J.Y. (Jeongin Yoon); writing—original draft preparation, J.Y. (Jeongin Yoon), E.L., S.Y. and J.Y. (Jaeeung Yi); writing—review and editing, all authors; visualization, J.Y. (Jeongin Yoon) and S.Y.; supervision, J.Y. (Jeongin Yoon) and J.Y. (Jaeeung Yi); project administration, J.Y. (Jeongin Yoon) and J.Y. (Jaeeung Yi). All authors have read and agreed to the published version of the manuscript.
Funding
This work was supported by Korea Environment Industry & Technology Institute (KEITI) through the Water Management Project for Drought, funded by Korea Ministry of Environment (MOE) (2022003610004).
Data Availability Statement
The raw data supporting the conclusions of this article will be made available by the authors on request.
Conflicts of Interest
Author Jungwon Ji was employed by the company Water Resources Technology Center, IoT Solution Co., Ltd. The remaining authors declare that the research was conducted in the absence of any commercial or financial relationships that could be construed as a potential conflict of interest.
References
- Lee, S.; Choi, Y.; Ji, J.; Lee, E.; Yi, S.; Yi, J. Flood Vulnerability Assessment of an Urban Area: A Case Study in Seoul, South Korea. Water 2023, 15, 1979. [Google Scholar] [CrossRef]
- Kumar, D.N.; Reddy, M.J. Multipurpose Reservoir Operation Using Particle Swarm Optimization. J. Water Resour. Plan. Manag. 2007, 133, 192–201. [Google Scholar] [CrossRef]
- Zhou, Y.; Guo, S. Incorporating ecological requirement into multipurpose reservoir operating rule curves for adaptation to climate change. J. Hydrol. 2013, 498, 153–164. [Google Scholar] [CrossRef]
- McMahon, G.F.; Farmer, M.C. Reallocation of Federal Multipurpose Reservoirs: Principles, Policy, and Practice. J. Water Resour. Plan. Manag. 2004, 130, 187–197. [Google Scholar] [CrossRef]
- He, Y.; Chen, X.; Sheng, Z.; Lin, K.; Gui, F. Water allocation under the constraint of total water-use quota: A case from Dongjiang River Basin, South China. Hydrol. Sci. J. 2018, 63, 154–167. [Google Scholar] [CrossRef]
- Yi, S.; Yi, J. Reservoir-based flood forecasting and warning: Deep learning versus machine learning. Appl. Water Sci. 2024, 14, 237. [Google Scholar] [CrossRef]
- Bayazıt, Y.; Bakış, R.; Koç, C. A study on transformation of multi-purpose dams into pumped storage hydroelectric power plants by using GIS model. Int. J. Green Energy 2021, 18, 308–318. [Google Scholar] [CrossRef]
- Bakis, R. Electricity production opportunities from multipurpose dams (case study). Renew. Energy 2007, 32, 1723–1738. [Google Scholar] [CrossRef]
- Branche, E. The multipurpose water uses of hydropower reservoir: The SHARE concept. Comptes Rendus. Phys. 2017, 18, 469–478. [Google Scholar] [CrossRef]
- Ahmadi, M.; Haddad, O.B.; Loáiciga, H.A. Adaptive Reservoir Operation Rules Under Climatic Change. Water Resour. Manag. 2015, 29, 1247–1266. [Google Scholar] [CrossRef]
- Fearnside, P.M. Environmental and Social Impacts of Hydroelectric Dams in Brazilian Amazonia: Implications for the Aluminum Industry. World Dev. 2016, 77, 48–65. [Google Scholar] [CrossRef]
- Nilsson, C.; Renöfält, B.M. Linking flow regime and water quality in rivers: A challenge to adaptive catchment management. Ecol. Soc. 2008, 13, 18. [Google Scholar] [CrossRef]
- Aghasian, K.; Moridi, A.; Mirbagheri, A.; Abbaspour, M. Selective withdrawal optimization in a multipurpose water use reservoir. Int. J. Environ. Sci. Technol. 2019, 16, 5559–5568. [Google Scholar] [CrossRef]
- Heydari, M.; Othman, F.; Qaderi, K. Developing Optimal Reservoir Operation for Multiple and Multipurpose Reservoirs Using Mathematical Programming. Math. Probl. Eng. 2015, 2015, 435752. [Google Scholar] [CrossRef]
- Xu, X.; Bin, L.; Pan, C.; Ding, A.; Chen, D. Optimal Reoperation of Multi-Reservoirs for Integrated Watershed Management with Multiple Benefits. Water 2014, 6, 796–812. [Google Scholar] [CrossRef]
- Dalcin, A.P.; Marques, G.F.; de Oliveira, A.G.; Tilmant, A. Identifying Functional Flow Regimes and Fish Response for Multiple Reservoir Operating Solutions. J. Water Resour. Plan. Manag. 2022, 148, 04022026. [Google Scholar] [CrossRef]
- Sedighkia, M.; Abdoli, A. Optimizing environmental flow regime by integrating river and reservoir ecosystems. Water Resour. Manag. 2022, 36, 2079–2094. [Google Scholar] [CrossRef]
- Maskey, M.L.; Dourado, G.F.; Rallings, A.M.; Rheinheimer, D.E.; Medellín-Azuara, J.; Viers, J.H. Assessing Hydrological Alteration Caused by Climate Change and Reservoir Operations in the San Joaquin River Basin, California. Front. Environ. Sci. 2022, 10, 765426. [Google Scholar] [CrossRef]
- Yahyaee, A.R.; Moridi, A.; Sarang, A. A new optimized model to control eutrophication in multi-purpose reservoirs. Int. J. Environ. Sci. Technol. 2021, 18, 3357–3370. [Google Scholar] [CrossRef]
- Chou, F.N.-F.; Linh, N.T.T.; Wu, C.-W. Optimizing the Management Strategies of a Multi-Purpose Multi-Reservoir System in Vietnam. Water 2020, 12, 938. [Google Scholar] [CrossRef]
- Amirkhani, M.; Bozorg-Haddad, O.; Fallah-Mehdipour, E.; Loáiciga, H.A. Multiobjective Reservoir Operation for Water Quality Optimization. J. Irrig. Drain. Eng. 2016, 142, 04016065. [Google Scholar] [CrossRef]
- Wang, Y.; Liu, P.; Dou, M.; Li, H.; Ming, B.; Gong, Y.; Yang, Z. Reservoir ecological operation considering outflow variations across different time scales. Ecol. Indic. 2021, 125, 107582. [Google Scholar] [CrossRef]
- Yan, M.; Fang, G.-H.; Dai, L.-H.; Tan, Q.-F.; Huang, X.-F. Optimizing reservoir operation considering downstream ecological demands of water quantity and fluctuation based on IHA parameters. J. Hydrol. 2021, 600, 126647. [Google Scholar] [CrossRef]
- Chalise, D.R.; Sankarasubramanian, A.; Olden, J.D.; Ruhi, A. Spectral Signatures of Flow Regime Alteration by Dams Across the United States. Earth’s Future 2023, 11, e2022EF003078. [Google Scholar] [CrossRef]
- Wang, Y.; Liu, P.; Wu, C.; Li, X.; An, R.; Xie, K. Reservoir ecological operation by quantifying outflow disturbance to aquatic community dynamics. Environ. Res. Lett. 2021, 16, 074005. [Google Scholar] [CrossRef]
- Kondolf, M.; Yi, J. Dam Renovation to Prolong Reservoir Life and Mitigate Dam Impacts. Water 2022, 14, 1464. [Google Scholar] [CrossRef]
- Jurdi, M.; Korfali, S.I.; Karahagopian, Y.; Davies, B.E. Evaluation of Water Quality of the Qaraaoun Reservoir, Lebanon: Suitability for Multipurpose Usage. Environ. Monit. Assess. 2002, 77, 11–30. [Google Scholar] [CrossRef]
- Bekoe, E.M.O.; Amuah, E.E.Y.; Abuntori, Z.N.; Sintim, E.; Kichana, E.; Quarcoo, G. Water Quality Impact from the Multipurpose Use of the Golinga Reservoir in Northern Ghana. Water Air Soil Pollut. 2021, 232, 390. [Google Scholar] [CrossRef]
- Castelletti, A.; Yajima, H.; Giuliani, M.; Soncini-Sessa, R.; Weber, E. Planning the Optimal Operation of a Multioutlet Water Reservoir with Water Quality and Quantity Targets. J. Water Resour. Plan. Manag. 2014, 140, 496–510. [Google Scholar] [CrossRef]
- Xu, C.; Xu, Z.; Cai, Y.; Zhu, Z.; Tan, Q. Impact of reservoir operation policies on nitrogen cycling processes and water quality dynamics in a large water supply reservoir. J. Clean. Prod. 2023, 416, 137975. [Google Scholar] [CrossRef]
- Oseke, F.I.; Anornu, G.K.; Adjei, K.A.; Eduvie, M.O. Assessment of water quality using GIS techniques and water quality index in reservoirs affected by water diversion. Water-Energy Nexus 2021, 4, 25–34. [Google Scholar] [CrossRef]
- Yu, C.; Xu, Z.; Li, Y.; Yang, Y.; Cai, Y.; Yang, Z. Rethinking environmental flow management strategies in reservoir operations from an integrated water quality perspective. J. Hydrol. 2023, 626, 130196. [Google Scholar] [CrossRef]
- Azadi, F.; Ashofteh, P.-S.; Shokri, A.; Loáiciga, H.A. Simulation-Optimization of Reservoir Water Quality under Climate Change. J. Water Resour. Plan. Manag. 2021, 147, 04021054. [Google Scholar] [CrossRef]
- Khorsandi, M.; Ashofteh, P.-S.; Singh, V.P. Development of a multi-objective reservoir operation model for water quality-quantity management. J. Contam. Hydrol. 2024, 265, 104385. [Google Scholar] [CrossRef]
- Calamita, E.; Vanzo, D.; Wehrli, B.; Schmid, M. Lake Modeling Reveals Management Opportunities for Improving Water Quality Downstream of Transboundary Tropical Dams. Water Resour. Res. 2021, 57, e2020WR027465. [Google Scholar] [CrossRef]
- Xu, Z.; Chen, K.; Xu, C.; Xie, Y.; Cai, Y.; Yang, Z. Reservoir operation optimization approach accounting for methane emission mitigation and water quality improvement targets. J. Hydrol. 2025, 659, 133129. [Google Scholar] [CrossRef]
- Nazari, M.; Kerachian, R. Optimal Operation of Reservoirs Considering Water Quantity and Quality Aspects: A Systematic State-of-the-Art Review. Water Resour. Manag. 2024, 38, 5911–5944. [Google Scholar] [CrossRef]
- Suen, J.-P.; Wang, R.-H. Optimal Reservoir Operation Considering Downstream Water Quality and Environmental Flow Needs. In Proceedings of the World Environmental and Water Resources Congress 2010, Reston, VA, USA, 16–20 May 2010; American Society of Civil Engineers: Reston, VA, USA, 2010; pp. 2592–2601. [Google Scholar] [CrossRef]
- Kerachian, R.; Karamouz, M. Optimal reservoir operation considering the water quality issues: A stochastic conflict resolution approach. Water Resour. Res. 2006, 42, W12401. [Google Scholar] [CrossRef]
- Aalami, M.T.; Abbasi, H.; Nourani, V. Sustainable Management of Reservoir Water Quality and Quantity Through Reservoir Operational Strategy and Watershed Control Strategies. Int. J. Environ. Res. 2018, 12, 773–788. [Google Scholar] [CrossRef]
- Wu, R.-S.; Sue, W.-R.; Chen, C.-H.; Liaw, S.-L. Simulation model for investigating effect of reservoir operation on water quality. Environ. Softw. 1996, 11, 143–150. [Google Scholar] [CrossRef]
- Reddy, M.J.; Kumar, D.N. Optimal Reservoir Operation Using Multi-Objective Evolutionary Algorithm. Water Resour. Manag. 2006, 20, 861–878. [Google Scholar] [CrossRef]
- Lee, E.; Ji, J.; Lee, S.; Yoon, J.; Yi, S.; Yi, J. Development of an Optimal Water Allocation Model for Reservoir System Operation. Water 2023, 15, 3555. [Google Scholar] [CrossRef]
- Park, S.-D. Dimensionless flow Duration Curve in Natural River. J. Korea Water Resour. Assoc. 2003, 36, 33–44. [Google Scholar] [CrossRef]
- Government of the Republic of Korea. Enforcement Decree of the Framework Act on Environmental Policy, Annex 1 ‘Environmental Standards’ (as Amended Dec 6, 2022). 2022. Available online: https://elaw.klri.re.kr/eng_service/lawView.do?hseq=30486&lang=ENG (accessed on 30 June 2025).
Disclaimer/Publisher’s Note: The statements, opinions and data contained in all publications are solely those of the individual author(s) and contributor(s) and not of MDPI and/or the editor(s). MDPI and/or the editor(s) disclaim responsibility for any injury to people or property resulting from any ideas, methods, instructions or products referred to in the content. |
© 2025 by the authors. Licensee MDPI, Basel, Switzerland. This article is an open access article distributed under the terms and conditions of the Creative Commons Attribution (CC BY) license (https://creativecommons.org/licenses/by/4.0/).