Review

International Inland Waterways in Poland: Current State and Their Importance in EU Transport Policy

by
Katarzyna Kubiak-Wójcicka
1,* and
Valentina-Mariana Manoiu
2,*
1
Department of Hydrology, Cryology and Water Management, Faculty of Earth Sciences and Spatial Management, Nicolaus Copernicus University, Lwowska 1, 87-100 Toruń, Poland
2
Department of Meteorology and Hydrology, Faculty of Geography, University of Bucharest, Bulevardul Nicolae Bălcescu 1, 010041 Bucharest, Romania
*
Authors to whom correspondence should be addressed.
Water 2025, 17(22), 3190; https://doi.org/10.3390/w17223190
Submission received: 20 September 2025 / Revised: 27 October 2025 / Accepted: 4 November 2025 / Published: 7 November 2025
(This article belongs to the Section Water Resources Management, Policy and Governance)

Abstract

In recent years, the share of cargo transport in Poland’s water has been marginal. Through comprehensively reviewing 61 relevant studies in the field, supplemented by the investigation of several important databases, this paper estimates the historical and current state of inland navigation in Poland, and at the same time, identifies the main threats to the future development of inland navigation. A detailed evaluation in regard to the degree of technical infrastructure use is presented for the Lower Vistula section in the years 1986–2020. In that period, there was a decrease in the number of cargo vessels passing through the only lock on the Lower Vistula, at Włocławek. This was due to a number of factors, including natural conditions resulting from climate change, which led to more frequent occurrences of low water levels. In recent years (2016–2020), there has been an increase in the number of tourist vessels passing through the lock in Włocławek and locks on Vistula branches. This boost is marked mainly in the summer (from June to August) at locks near city centers. Revitalizing inland navigation in Poland is possible through joint planning, implementation and financing of strategic infrastructure investments at the national, regional and local levels.

1. Introduction

The importance of waterways and inland waterway transport has changed around the world over the centuries as regions have undergone socio-economic development [1,2,3,4,5]. Rapid industrialization and the development of other types of transport, including road, rail and air, have made inland waterway transport less important.
Nowadays, the transport function of inland waterways can be ensured if they are properly developed and maintained [6], which is associated with appropriate financing [7]. The adaptation of natural rivers for navigation purposes requires changes in the rivers’ hydromorphological features, such as depth and width, leading to a significant interference in the rivers’ ecosystems and often to their degradation [2]. On the other hand, water transport is the cheapest means of cargo inland transport [8]. It is also the most energy-efficient mode of transport [9] and the transportation with the lowest CO2 emissions per freight [10].
Here, we take the example of Poland, which has favorable hydrographic conditions. Bearing in mind the country’s location in the heart of Europe and its potential to connect other parts of Europe in east–west and north–south directions, these conditions have been under-exploited for inland navigation purposes [11,12]. The most important rivers in Poland are the Vistula and the Oder. The study covered the Vistula River, the longest river in Poland. The Vistula is one of the few rivers in Europe that have retained a quasi-natural character. It has very little regulation and few dams. Only seven dams have been built along the entire length of the Vistula, six of which are located in its upper section, upstream of Kraków, and one on its lower section. The middle section of the Vistula, from the San River’s mouth into the Vistula to the Narew River’s mouth, has a braided character, with numerous sandbanks and islands. In the lower section, below the mouth of the Narew River into the Vistula, a dam has been built at Włocławek. Despite regulatory works having been carried out at the beginning of the 19th century on the section from Toruń to the mouth of the Baltic Sea, the hydrological regime of the Vistula is still largely governed by climatic conditions. It is therefore more sensitive to changes in regime patterns than many of the world’s tightly regulated allochthonous rivers [13]. Consequently, both floods and droughts prevent the full operation of inland transportation on the Lower Vistula, and some issues emerge: the extent of restrictions imposed by these natural hazards and the time length of navigation unfeasibility in a year, which are the main causes of navigation impracticality. Different climate change models and scenarios indicate a future temperature increase in Poland [14,15,16] correlated with precipitation variations [16], having a potential impact on extreme hydrological events and, consequently, influencing upcoming transport on the Lower Vistula.
This review aims to provide an original assessment of the actual use of the Lower Vistula waterway from a regional perspective as well as the circumstances and prospects for conducting inland navigation depending on the river’s prevailing hydrological conditions. At the same time, the paper intends to improve understanding of the main threats preventing or limiting the transport of goods and passengers on inland waterways, which will help reform the national and regional policies relating to inland waterway transport.
Research has been undertaken in the Polish literature on the determinants of the inland navigation’s current state, including infrastructural deficiencies, socio-economic issues and management- and policy-related factors [6]. However, limited surveys have taken into account the new threats and challenges related to climate change, including floods and droughts, which require measures to mitigate these potential risks [17]. The ongoing freight and tourist transport on inland waterways focuses on national and regional quantitative analyses of the transport of goods and passengers. Based on the examination of 61 significant scientific studies and the investigation of several valuable databases provided via the Institute of Meteorology and Water Management National Research Institute, Central Statistical Office, Sustainable Transport Development Strategy, Ministry of Infrastructure, Inland Waterway Transport in Poland and Europe, Eurostat data, and the Regional Water Management Board in Warsaw and Gdańsk, the present review fills a gap in our knowledge which concerns the impact of hydrological changes to inland waterway freight and tourist transport. The paper covers the most important section of the inland waterway, namely the Lower Vistula, which is part of an international waterway providing shipping connections to Eastern Europe. The extent of waterways’ usage is presented for the 1986–2020 period.

2. Inland Water Transport in Poland Compared to the European Union

2.1. EU Inland Water Transport in 2010–2021

The European Union plays a decisive role in shaping inland waterway transport policy. The 41,000 km-long inland waterway network covers 25 Member States but carries only 6% of the EU’s cargo [18]. The European Union’s main waterways of international importance are the Rhine and Danube river systems. The Rhine and its tributaries constitute the most developed, best maintained and most frequently used waterway for freight transport. About 80% of the EU’s total inland waterway transport of goods takes place on this river [19]. The Danube enables river navigation between the North Sea and the Black Sea. Its location is important for the economic development of the countries through which it flows. The Danube flows through Germany, Austria, Slovakia, Hungary, Croatia, Serbia, Romania, Bulgaria, Moldova and Ukraine, of which the longest section belongs to Romania (1075 km) [20,21]. According to Eurostat data (2023) [22], the total amount of goods transported on the inland waterway in European Union (EU-27) countries averaged 532.7 million tons per year in 2010–2021. The countries with the highest average annual volume of inland waterway transport in 2020–2021 were the Netherlands (357 million tons), Germany (215 million tons) and Belgium (176 million tons), which account for a large share of total inland waterway activity. Substantial shares of inland waterway freight transport were also held by France (64 million tons) and Romania (30 million tons) and a slightly smaller share by Bulgaria (17 million tons). The countries whose cargo transport by inland waterways is below 10 million tons include Austria, Hungary, Croatia, Luxemburg and Slovakia. The lowest averages in the analyzed period of 2010–2021 were recorded in Poland (3 million tons) and the Czech Republic (0.7 million tons). During the same period, there was a clear downward trend in the transport of goods by inland waterways in the European Union (EU-27), which is particularly marked in the years 2018–2021. In 2010–2021, of the countries analyzed (EU-27), upward trends in transport were found in Bulgaria, the Netherlands, Romania and Croatia, while the remaining countries experienced downward trends. The greatest volume of goods was transported in 2017 (553.5 million tons) and the least in 2020 (503.8 million tons). The low volume in 2020 was partly due to restrictions related to the COVID-19 pandemic. In 2021, the total volume of goods transported on European inland waterways was 524 million tons, with an increase of 3.9% over the previous year. The main categories of products transported on inland waterways were metal ores and other mining and quarrying products, followed by coke and refined petroleum products [22]. Poland’s share of freight transport by inland waterways is small compared to the European Union. In 2021, Poland transported only 2.1 million tons of goods via inland waterways [22].

2.2. Inland Waterways in Poland and Their Importance in EU Inland Transport

In Poland, the network of inland waterways was shaped by the natural system of rivers and new canal connections built at the turn of the 19th century. The length of the inland waterway network in Poland in 2020 was 3768 km, of which only 5.5% (206 km) met the requirements for routes of international importance (classes IV and V). The remaining waterway network consists of roads of regional importance (classes I, II and III) [23].
Three international waterways pass through the territory of Poland, according to the AGN (European Agreement on Main Inland Waterways of International Importance), ratified by Poland in 2017 [24] (Figure 1):
-
Waterway E30, connecting the Baltic Sea to the Danube in Bratislava;
-
Waterway E40, connecting the Baltic Sea in Gdańsk to the Dnieper and the Black Sea;
-
Waterway E70, connecting the Netherlands to Russia and Lithuania.
The waterways in Poland are only marginally involved in the freight transport that consequently declined. This fact is mainly due to the lack of appropriate technical infrastructure and its high fees, regulation uncertainty and heterogeneousness, fiscal growth, environmental advocacy groups, anti-shipping lobby and the waterways’ capacity to ensure navigable depths (caused by difficult climatic conditions) [25,26,27]. Moreover, this waterway network does not comprise a uniform communication system, but a set of separate and qualitatively different routes [28].
Poland plans to adapt rivers to the class IV navigation criteria in accordance with the Sustainable Transport Development Strategy until 2030 [29] and aligns with EU strategies like the TEN-T (Trans-European Transport Network) network, by integrating its infrastructure [30], and the AGN, through the country-wide strategy of developing modern ports, improving inland waterway transport and digitalization of the activities [24]. In the last few years, the greatest emphasis has been placed on modernizing the Oder Waterway. The importance of this project derives from the Oder River having a direct connection to the European waterways system and its possible integration into the TEN-T core network corridors in the coming years, but also to the River Information Service (RIS), a European Commission transport management system, planned to be implemented by 2030 and to bring a more efficient use of the fleet and waterway infrastructure, an improvement of environmental protection and a better communication between waterway users [25,31,32]. The Szczecin–Świnoujście seaport, which is the second largest in Poland after Gdańsk, is located in the estuary section of the Oder River. The plans include the construction of a deep-water container terminal [33] and the construction of a new Silesian Canal as a complement to the planned Oder–Elbe–Danube Canal [34]. Other projects intend to modernize the Vistula–Dnieper waterway (E-40), which covers the section of the Lower Vistula from Gdańsk to Warsaw and a Warsaw–Brest connection. Apart from the Polish section of the planned E-40 International Waterway, i.e., the Gdańsk–Brest, the remaining route from Brest to the Black Sea has already been built and is ready for water transport [35]. This route is especially important for increasing the efficiency of the connection with the seaport facilities in Gdańsk and Gdynia. The Gdańsk Port is the second largest port on the Baltic Sea in terms of transhipment volume. The construction of a new container terminal, allowing entry for the largest ships entering the Baltic Sea, has brought a breakthrough for the Gdańsk Port. It is the first terminal in the Baltic Sea basin capable of handling post-Panamax class ships [36].
The completed projects include the construction of a trench through the Vistula Spit, which contains a 1.3 km-long canal. The canal was put into operation in 2022 and was designed to shorten the route from the Baltic Sea to the Vistula Lagoon. Navigation on this section was possible only through the Piława Strait as a result of an agreement with the Russian Federation. The decision to build the trench despite its environmental impact was political. The project was intended as the means of transport between land and sea independent of agreements with the Russian side, which would ultimately lead to a change in the communication structure and an important increase in the Elbląg port [37]. The expansion of these ports and construction of the trench are an important contribution to the region’s development, but increasing the share of inland navigation in cargo transport (especially on the Lower Vistula) will require further investment projects. The waterway on the Lower Vistula section from Włocławek to the mouth of the Gulf of Gdańsk does not meet the operational parameters specified in regulations in terms of waterway depth in some places. This is due to long-term neglect and under-investment. In the past, there were plans to increase the role of water transport in the country’s transport system. The first concept dates to the interwar period and included a cascade of dams being built along the entire Vistula; later variants of a cascade on the Lower Vistula were drawn up in the mid-20th century [38]. The main goal was to use the Lower Vistula for energy purposes, as it has the greatest energy potential, and to ensure appropriate depths for inland navigation. The first and, to date, last dam on the Lower Vistula is the dam at Włocławek built in 1962–1968 [39]. Plans to develop the Lower Vistula with dams were returned to at the beginning of the 21st century. According to Wrzosek et al. (2021) [40] and Kubrak et al. (2021) [41], the only possibility to improve navigability along the entire Lower Vistula is the planned construction of reservoirs at five dams at Siarzewo, Solec Kujawski, Chełmno, Grudziądz and Gniew. First construction work began on the new Siarzewo dam below the dam at Włocławek. The construction of the dam at Siarzewo was intended not only to solve navigation problems, but also to increase the safety of the existing dam at Włocławek. The Włocławek dam was designed as one of the several dams in a Lower Vistula cascade [42]. According to the current information provided by the Ministry of Infrastructure, on October 10, 2023, the Council of Ministers adopted a resolution on the long-term program called “Development of the Lower Vistula”. The plan involves financing the construction of a dam on the Vistula River near the town of Siarzewo, and the investment is to be completed by 2032 [43].

3. Materials and Methods

3.1. Study Area

The hydrological features of the Vistula change along its course. The catchment’s location in a transitional zone between oceanic and continental climates means that there is a very high year-to-year variability in flows. The level of seasonality of the Vistula’s flow varies over time. However, it also fluctuates depending on the size of the basin, decreasing along the river’s course as the catchment area increases and the nature of the basin changes, and as its outflow regime overlaps with the regimes of its major tributaries [44]. In the upper stretches of the Vistula, the two most common flood types are snowmelt-fed surges (March and April) and those fed by rainfall (July). In the lower stretches of the Vistula, one snowmelt surge is typical (March and April). In sporadic cases, rainfall floods are recorded, such as the flood of May and June 2010. The lowest flows of the year usually occur in September. They are caused by rainfall deficiencies and the low retention capacity of the catchment area. Summer–fall low flows affect the entire Vistula basin [45].
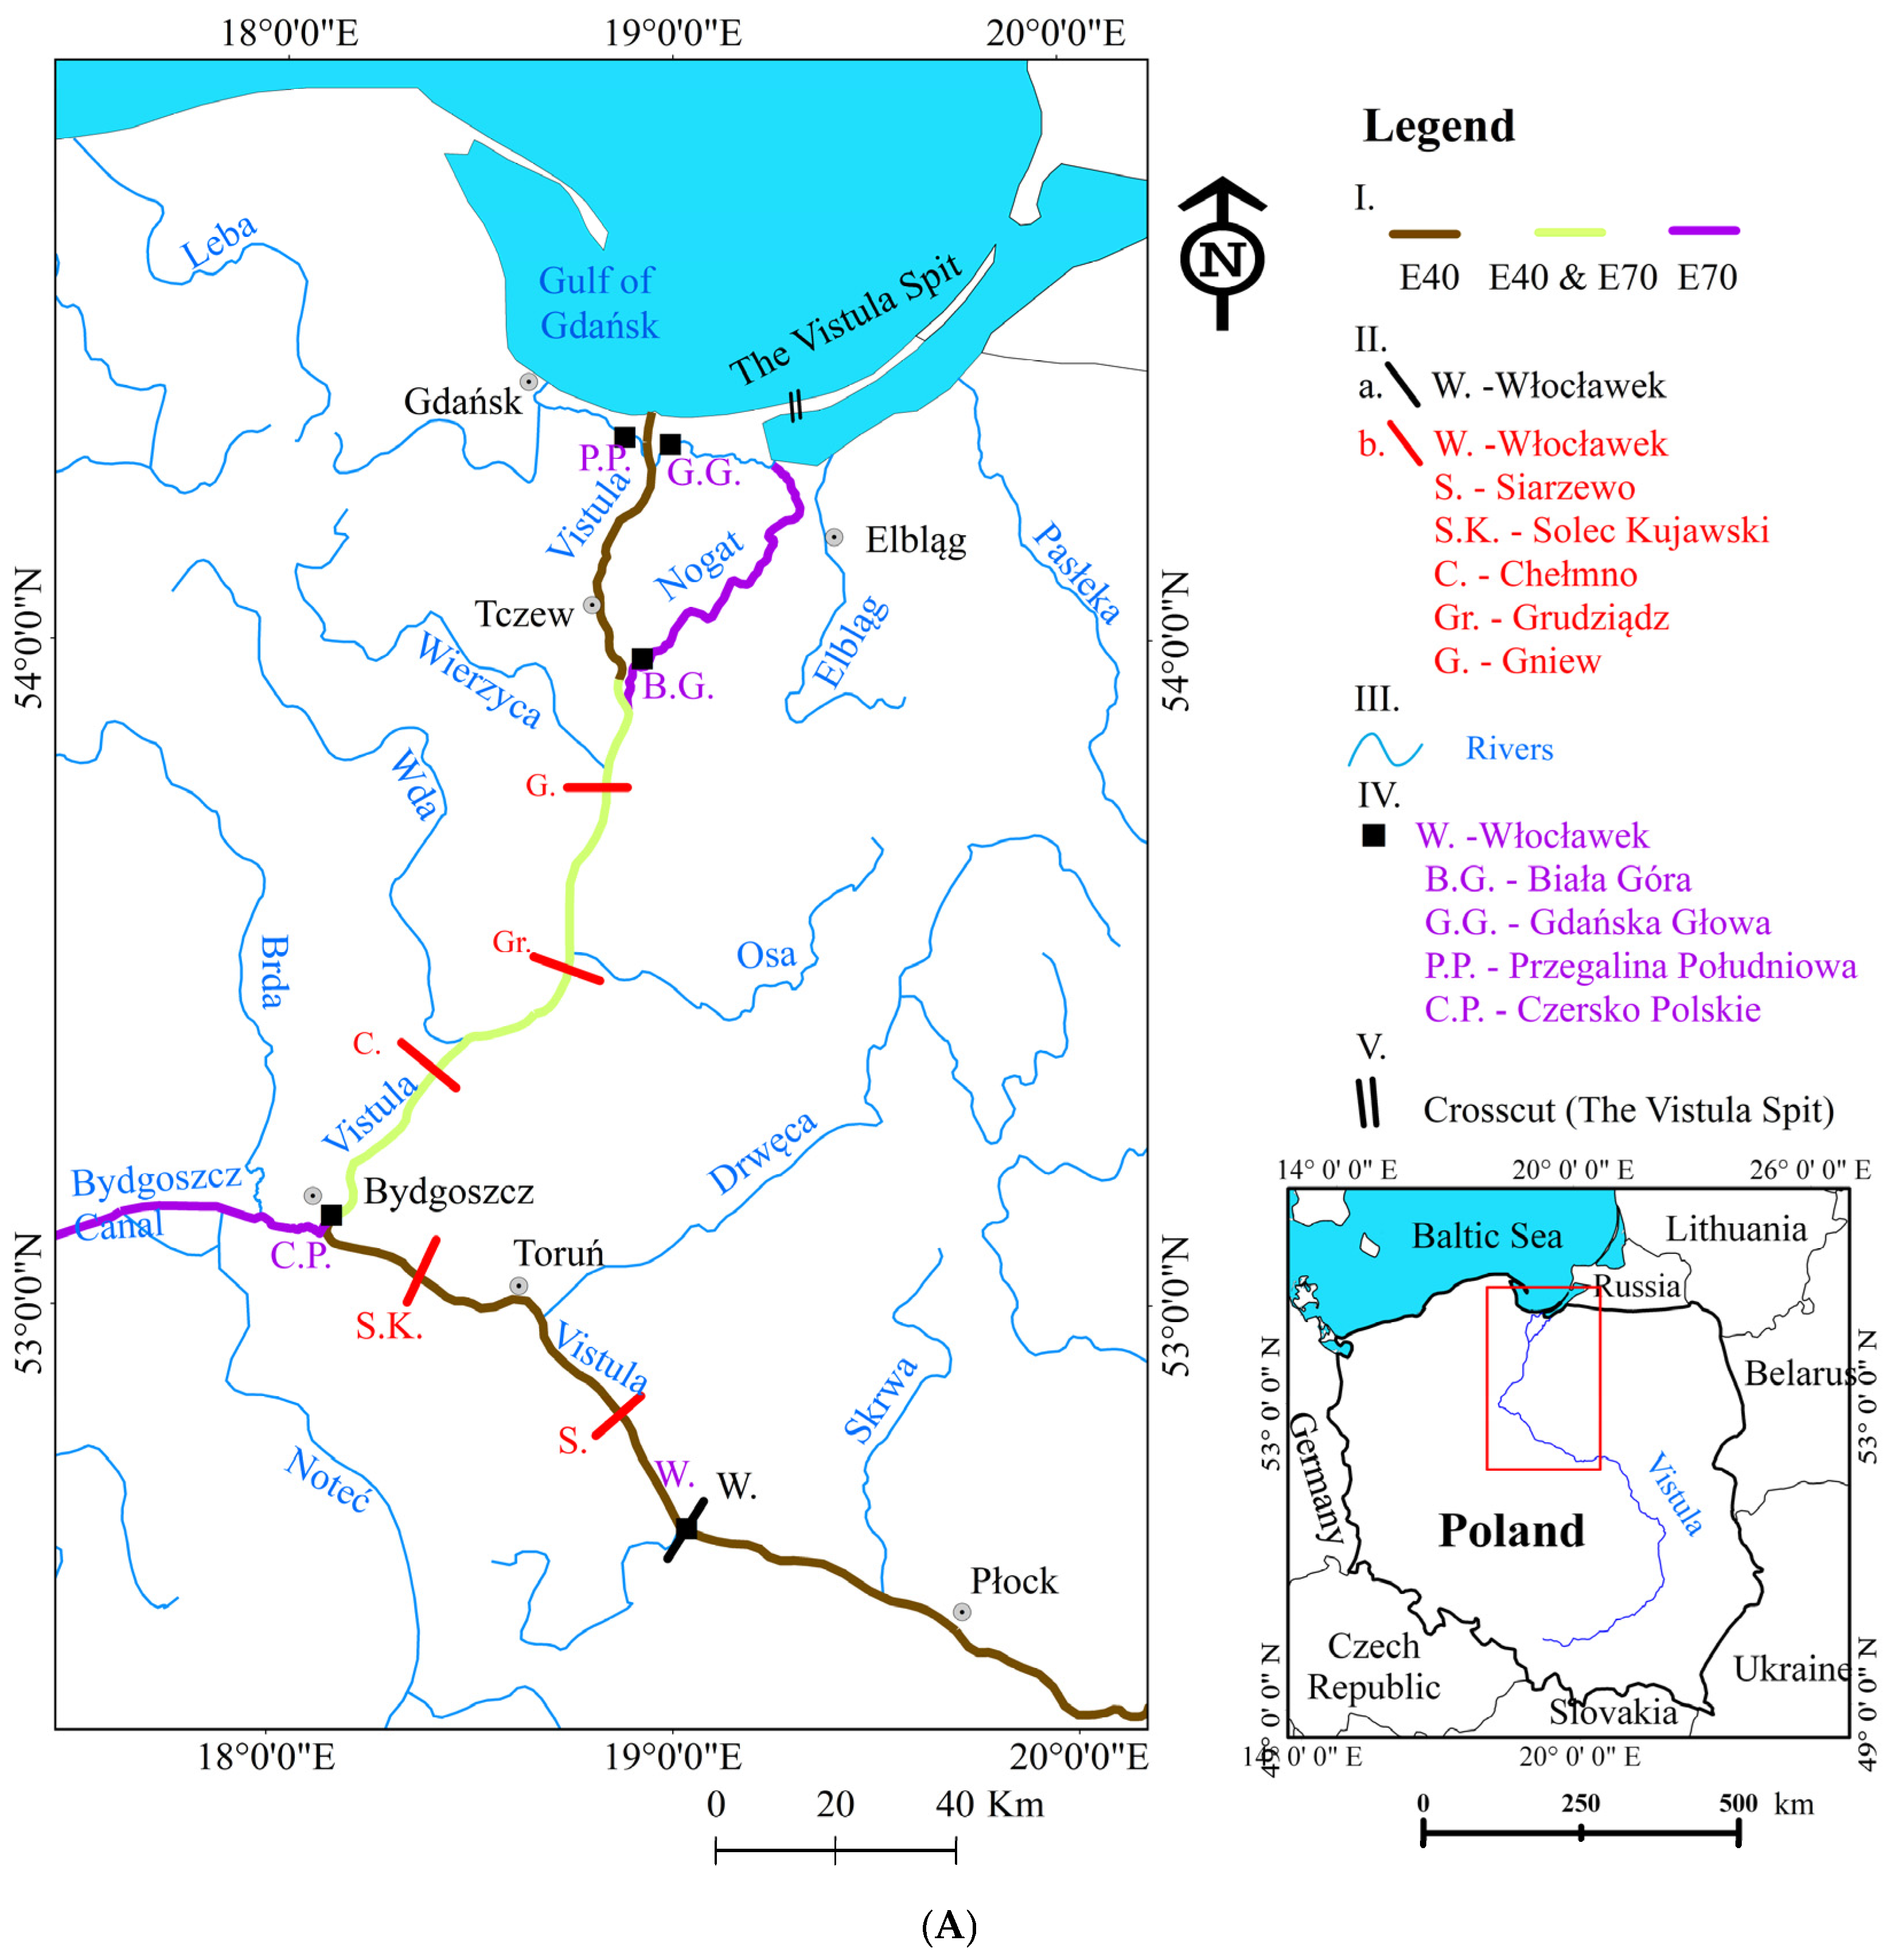
The Lower Vistula covers the section from the Narew River’s mouth into the Vistula River to the mouth of the Gulf of Gdańsk (Figure 2), and it is 387 km long. In this section, the only dam is at Włocławek, at km 674.85 of the Vistula River. This review focuses on the section from the Włocławek dam to the mouth of the Gulf of Gdańsk [46], which is 266.5 km.
In the section from Warsaw to Tczew, the Vistula’s largest tributary is the Narew, which together with the Bug creates the largest catchment feeding the Vistula. In the section below the Narew, the Vistula receives small tributaries, the largest of which are the Brda and the Drwęca. In the estuary section, the Nogat River flows from the Vistula River at a flow range of 30 to 60 m3/s. The average long-term flow of the Vistula at the station in Tczew, in the years 1986–2020 was 985 m3/s (Table 1). In the years 1986–2020, flow conditions were variable, ranging from exceptionally wet years (e.g., 2010) of flows exceeding the long-term average to exceptionally dry years (e.g., 1992 and 2015) with the flows below the long-term average. The Lower Vistula’s hydrological regime is determined mainly by the flows prevailing on its middle section and supply from the Narew, and partly by the operation of the Włocławek hydroelectric power plant [47]. The power plant in Włocławek was commissioned into use in 1970 and was initially operated on a peak-demand basis, but since 2012 the power plant has been operating in run-of-river mode. The reservoir behind the Włocławek dam has only a limited capacity to contain flood water.
The Lower Vistula is part of the E40 and E70 waterways. For the most stretches, the Lower Vistula is a class I and II waterway, except for the section from Włocławek to Płock (Włocławek reservoir), which is a class IV waterway. There is a bottleneck on the waterway from Warsaw to Gdańsk at the dam in Włocławek. The lock at the dam is a single-chamber dock-type lock of 12 m wide and 115 m long. The operational parameters of the waterways are presented in Table 2.

3.2. Data and Methods

Apart from the review of 61 scientific articles, Eurostat data [22] were utilized to characterize the use of European inland waterways. The data included annual values of transported goods in million tons for selected European Union countries, in 2010–2021. Cargo transport, number of passengers and the type of vessels and rolling stock used in inland water transport for Poland are presented according to the data of the Central Statistical Office [50], for the years 2001–2021. The issue of shipping traffic was presented based on data regarding the number and types of vessels passing the dam at Włocławek. The data for Włocławek were obtained courtesy of the Regional Water Management Board in Warsaw [51], while the data for Czersko Polskie, Przegalina Południowa, Gdańska Głowa and Biała Góra locks were acquired from the Regional Water Management Board in Gdańsk [46]. The lock records include the vessels by type, i.e., barges, pushers and tugs, passenger ships and other ships. Freight traffic includes the number of barges, push boats and tugboats served by the lock. In turn, tourist traffic included passenger boats and other boats, e.g., motorboats, kayaks, yachts, as well as waterway administration vessels and vessels operated by the Volunteer Water Emergency Service and the police.
The review examined the annual and monthly structure of traffic intensity divided into freight and tourist traffic, in the years 1986–2020. The volume of shipping traffic in Włocławek was compared against the prevailing hydrological conditions on the Vistula in that period. The hydrological analysis employed data on water levels and flows at the Warszawa Nadwilanówka, Włocławek, Toruń and Tczew stations through the 1986–2020 calendar years. The water gauge at Włocławek is located downstream of the dam, at km 679.4. However, due to the increased erosion of the river bottom [34], the water gauge was re-zeroed in 2004, so data from the Toruń and Tczew water gauges were used. Daily water levels and flows of the Vistula were obtained from the Institute of Meteorology and Water Management–National Research Institute [48]. Daily water levels at the Toruń hydrological station in the years 1986–2020 were used to analyze the hydrological conditions of the Vistula River. The 1986–2020 study period was characterized by diverse hydrological conditions. During this period, wet years, in which water levels and flows were above the long-term average, were identified; so too were dry years, with below-average values and average (normal) years. The characteristic water levels of the Vistula in the years 1986–2020 were determined based on the Threshold Level Method (TLM), i.e., by cutting off the hydrographs below the characteristic levels, i.e., mean low water (MLW), high low water (HLW), mean average water (MAW) and mean high water (MHW) determined for the multiannual period 1986–2020 in Toruń and Tczew. The TLM was first used by Yevjevich (1967) [52] and is widely used in hydrology. The results corroborated the relevant scientific articles and allowed us to determine the time of the year when navigation on the Vistula has been unfeasible or difficult because of unfavorable hydrological conditions.

4. Results

4.1. Hydrological Conditions of the Vistula River

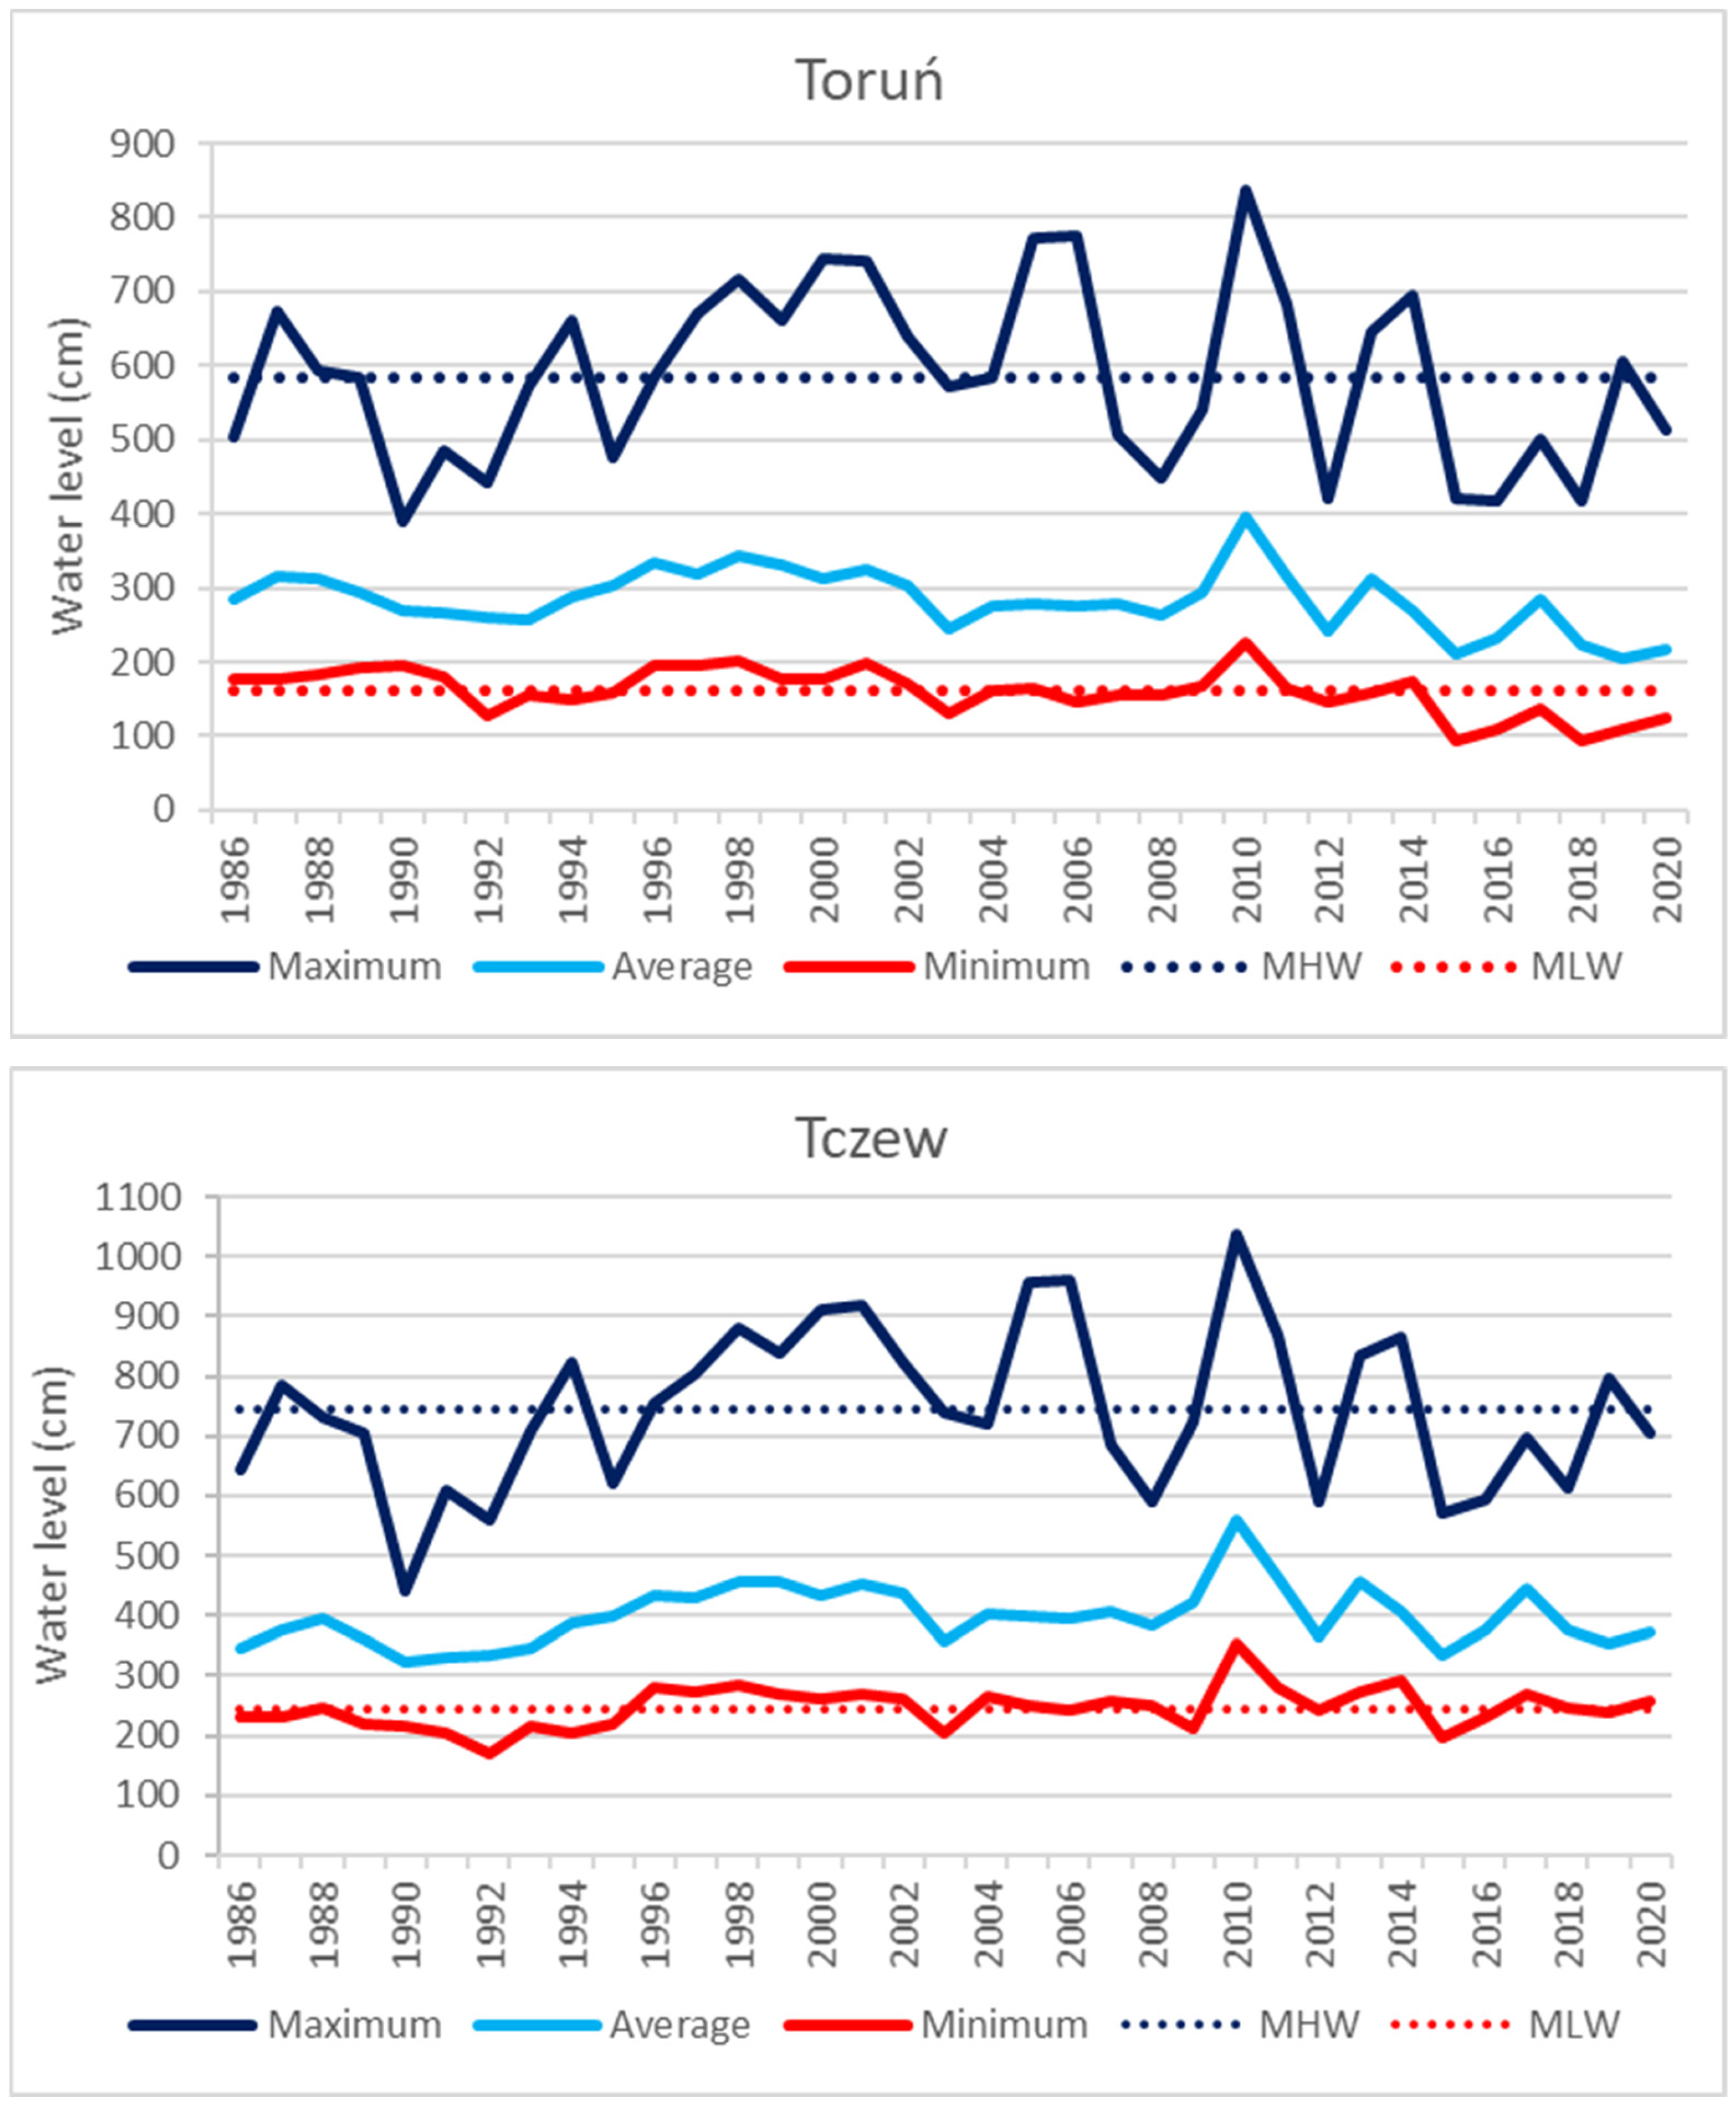
In terms of water transport, an important parameter is the water level on the river, especially the minimum level at which a boat is able to move [53]. Table 3 and Figure 3 present the characteristic water levels of the Vistula at the hydrological stations in Toruń and Tczew in the years 1986–2020. The highest amplitude of the Vistula water levels was recorded at the Tczew gauge and amounted to 866 cm, while in Toruń it was 743 cm. The highest water levels at all gauges were recorded in 2010 and were associated with high rainfall throughout Europe [54].
Certain water levels are important to hydrology and river transport [55,56]. At each of the two water gauge stations, the number of days with water levels between particular thresholds were classified and analyzed in the following six groups for specific time periods:
  • W0: number of days with water levels below the MLW;
  • W1: number of days with water levels between MLW and HLW;
  • W2: number of days with water levels between HLW and MAW;
  • W3: number of days with water levels between MAW and LHW;
  • W4: number of days with water levels between LHW and MHW;
  • W5: number of days with water levels above MHW.
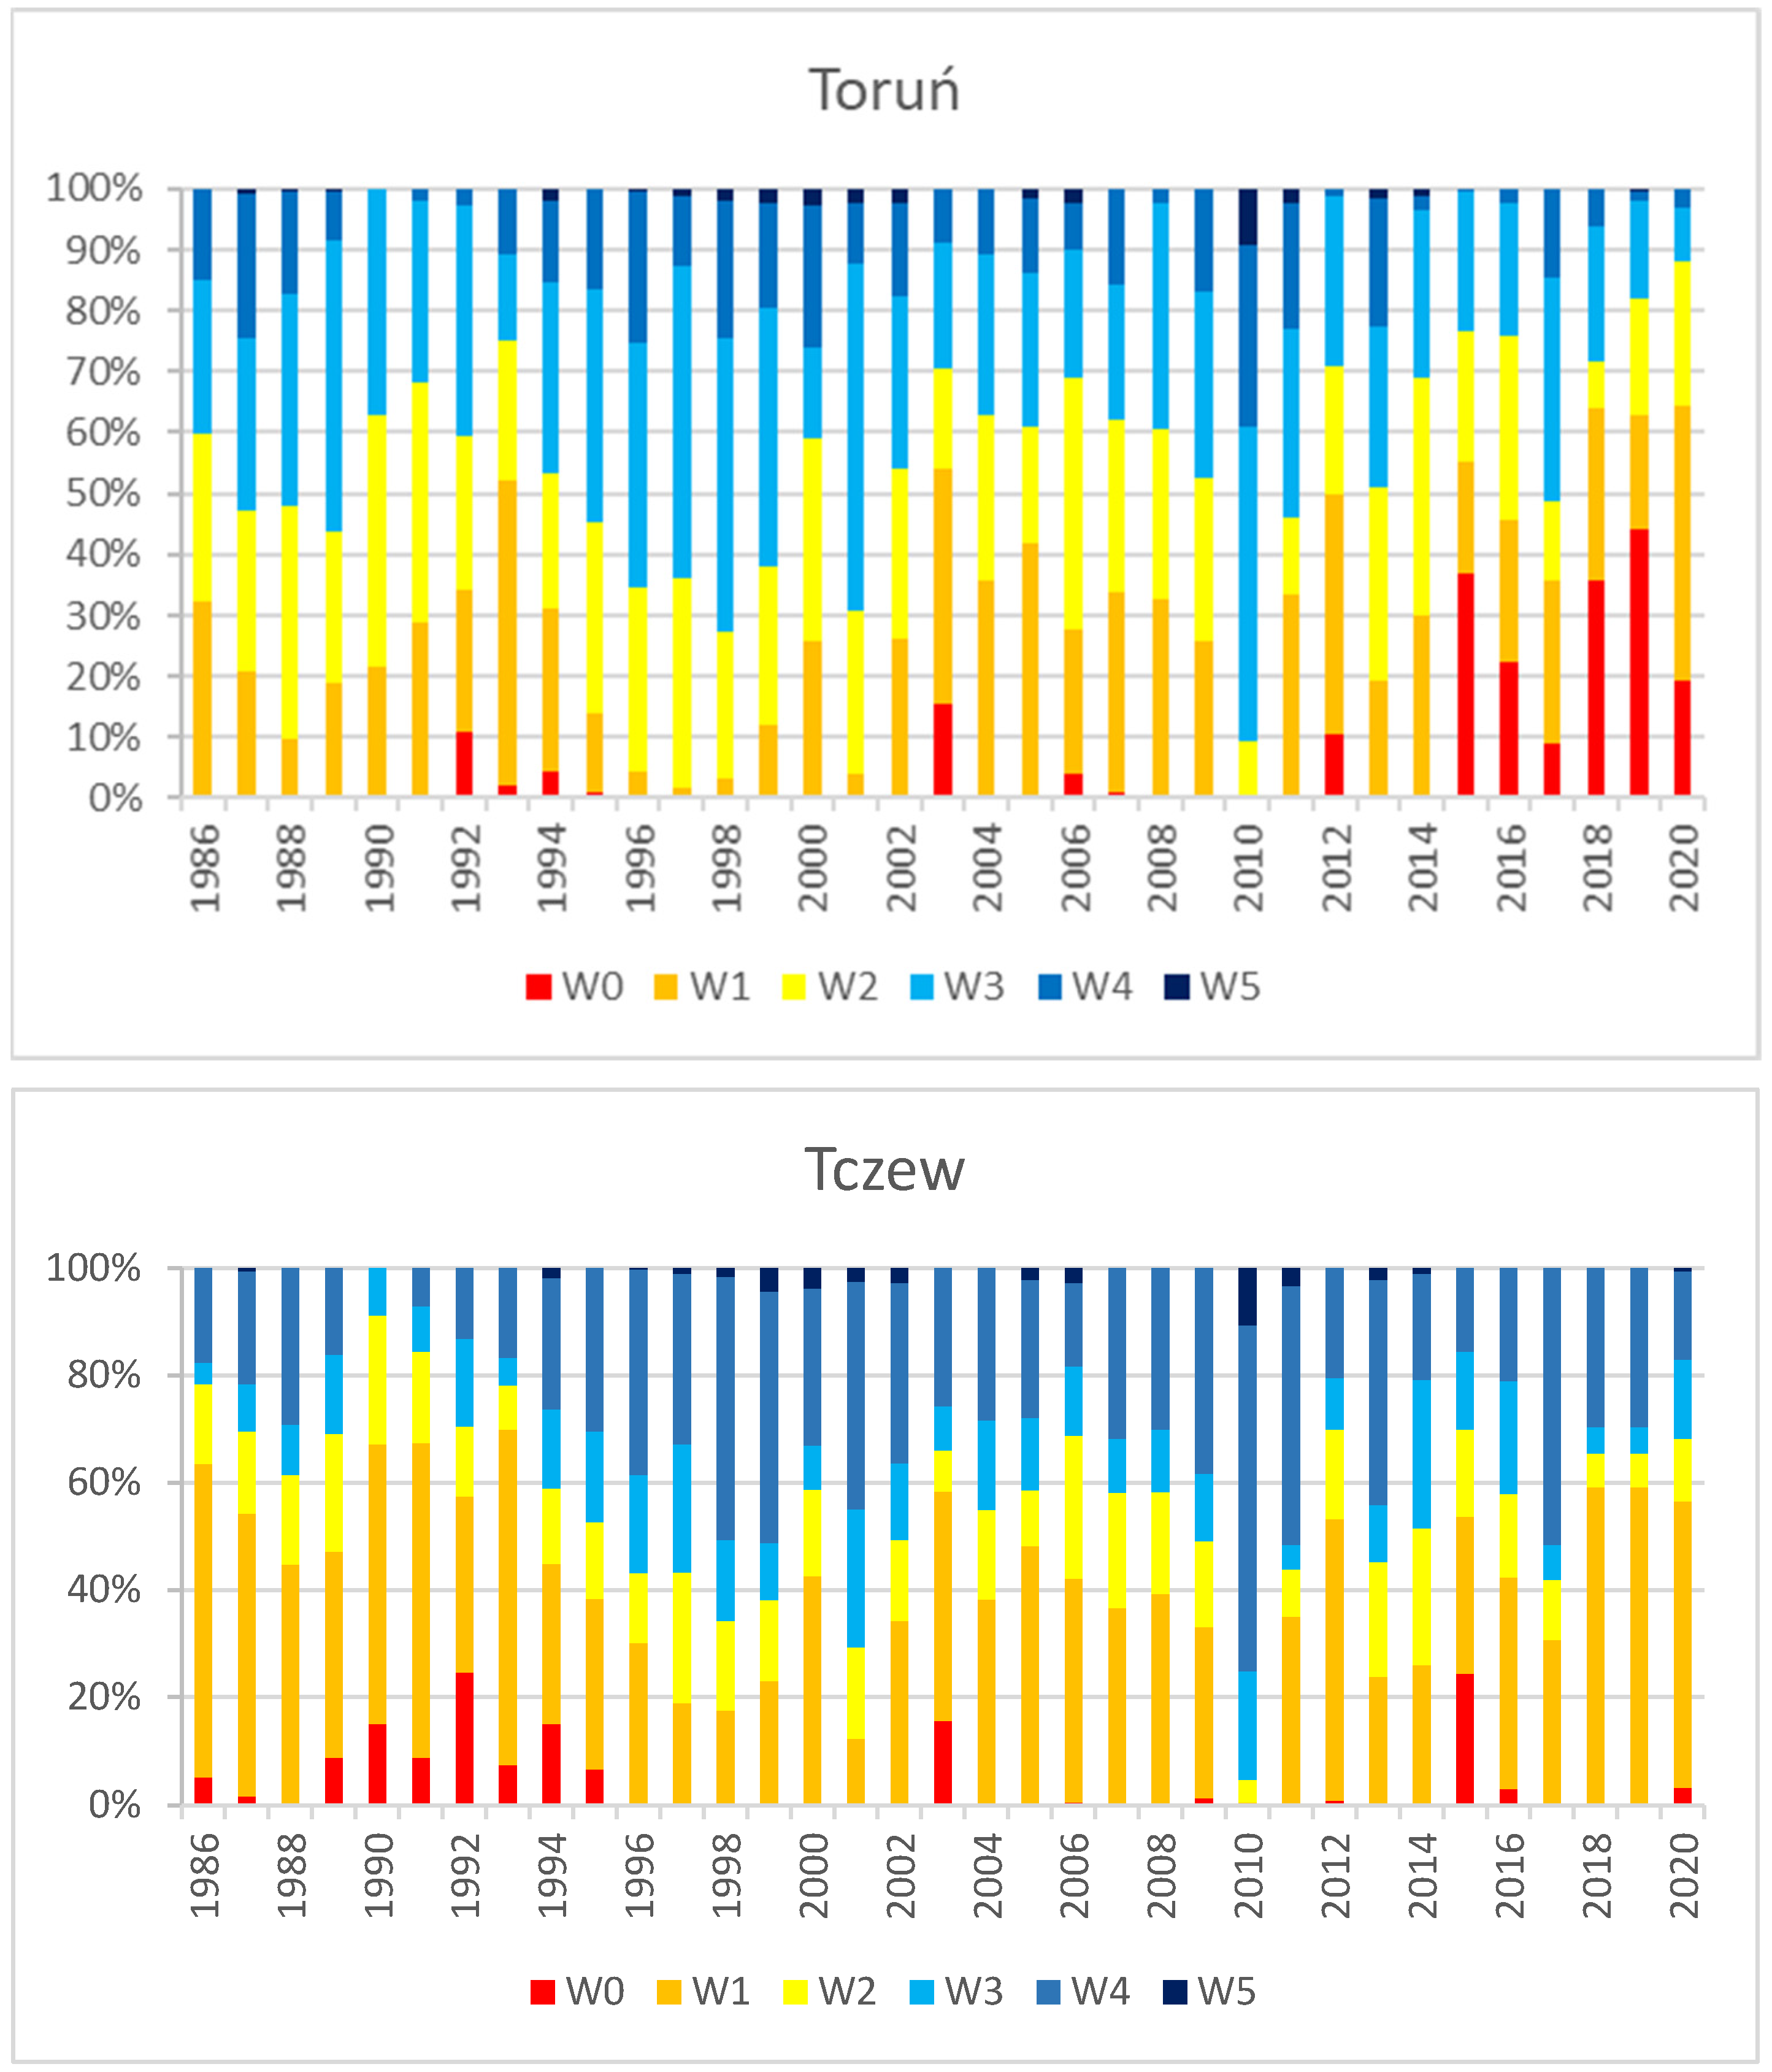
The analysis of the Vistula’s distribution of characteristic levels indicates that the number of days with levels below the mean low water level (W0) as a percentage of the year averaged 6.4% in Toruń and 4.1% in Tczew, over the period 1986–2020. This means that, on average, navigation will not be possible due to insufficient depth for 15 days a year at the station in Tczew and as many as 23 days a year at the station in Toruń. Below the average low water level, cargo navigation is practically impossible due to the draft of ships and barges exceeding 0.5 m. Navigation difficulties will also occur when the Vistula water level is between low and average water levels (W1 and W2). Water levels in categories W1 and W2 are far more common than W0 water levels. In turn, the number of days with water levels above the average high water (W5) accounted for 16.7% of days during the year in Toruń and 4.3% in Tczew (Figure 4). High water levels are assumed not to be so unfavorable for navigation restrictions, mainly considering the alarm levels set at individual water gauges. The number of days with water levels exceeding the alarm levels at the Toruń and Tczew gauges averaged only 2 days per year in the analyzed period.
There is a general upward trend in the number of days with lower water levels and a downward trend in the number of days with higher water levels. This is especially clear at the Toruń gauge. At the Tczew station, the number of days with low water levels (W0, W1, and W2) has decreased, while the number of days with high water levels (W4 and W5) increased over the analyzed multi-year period. As a result, inland navigation on the waterway section near Toruń is expected to experience more disruption due to low water levels.
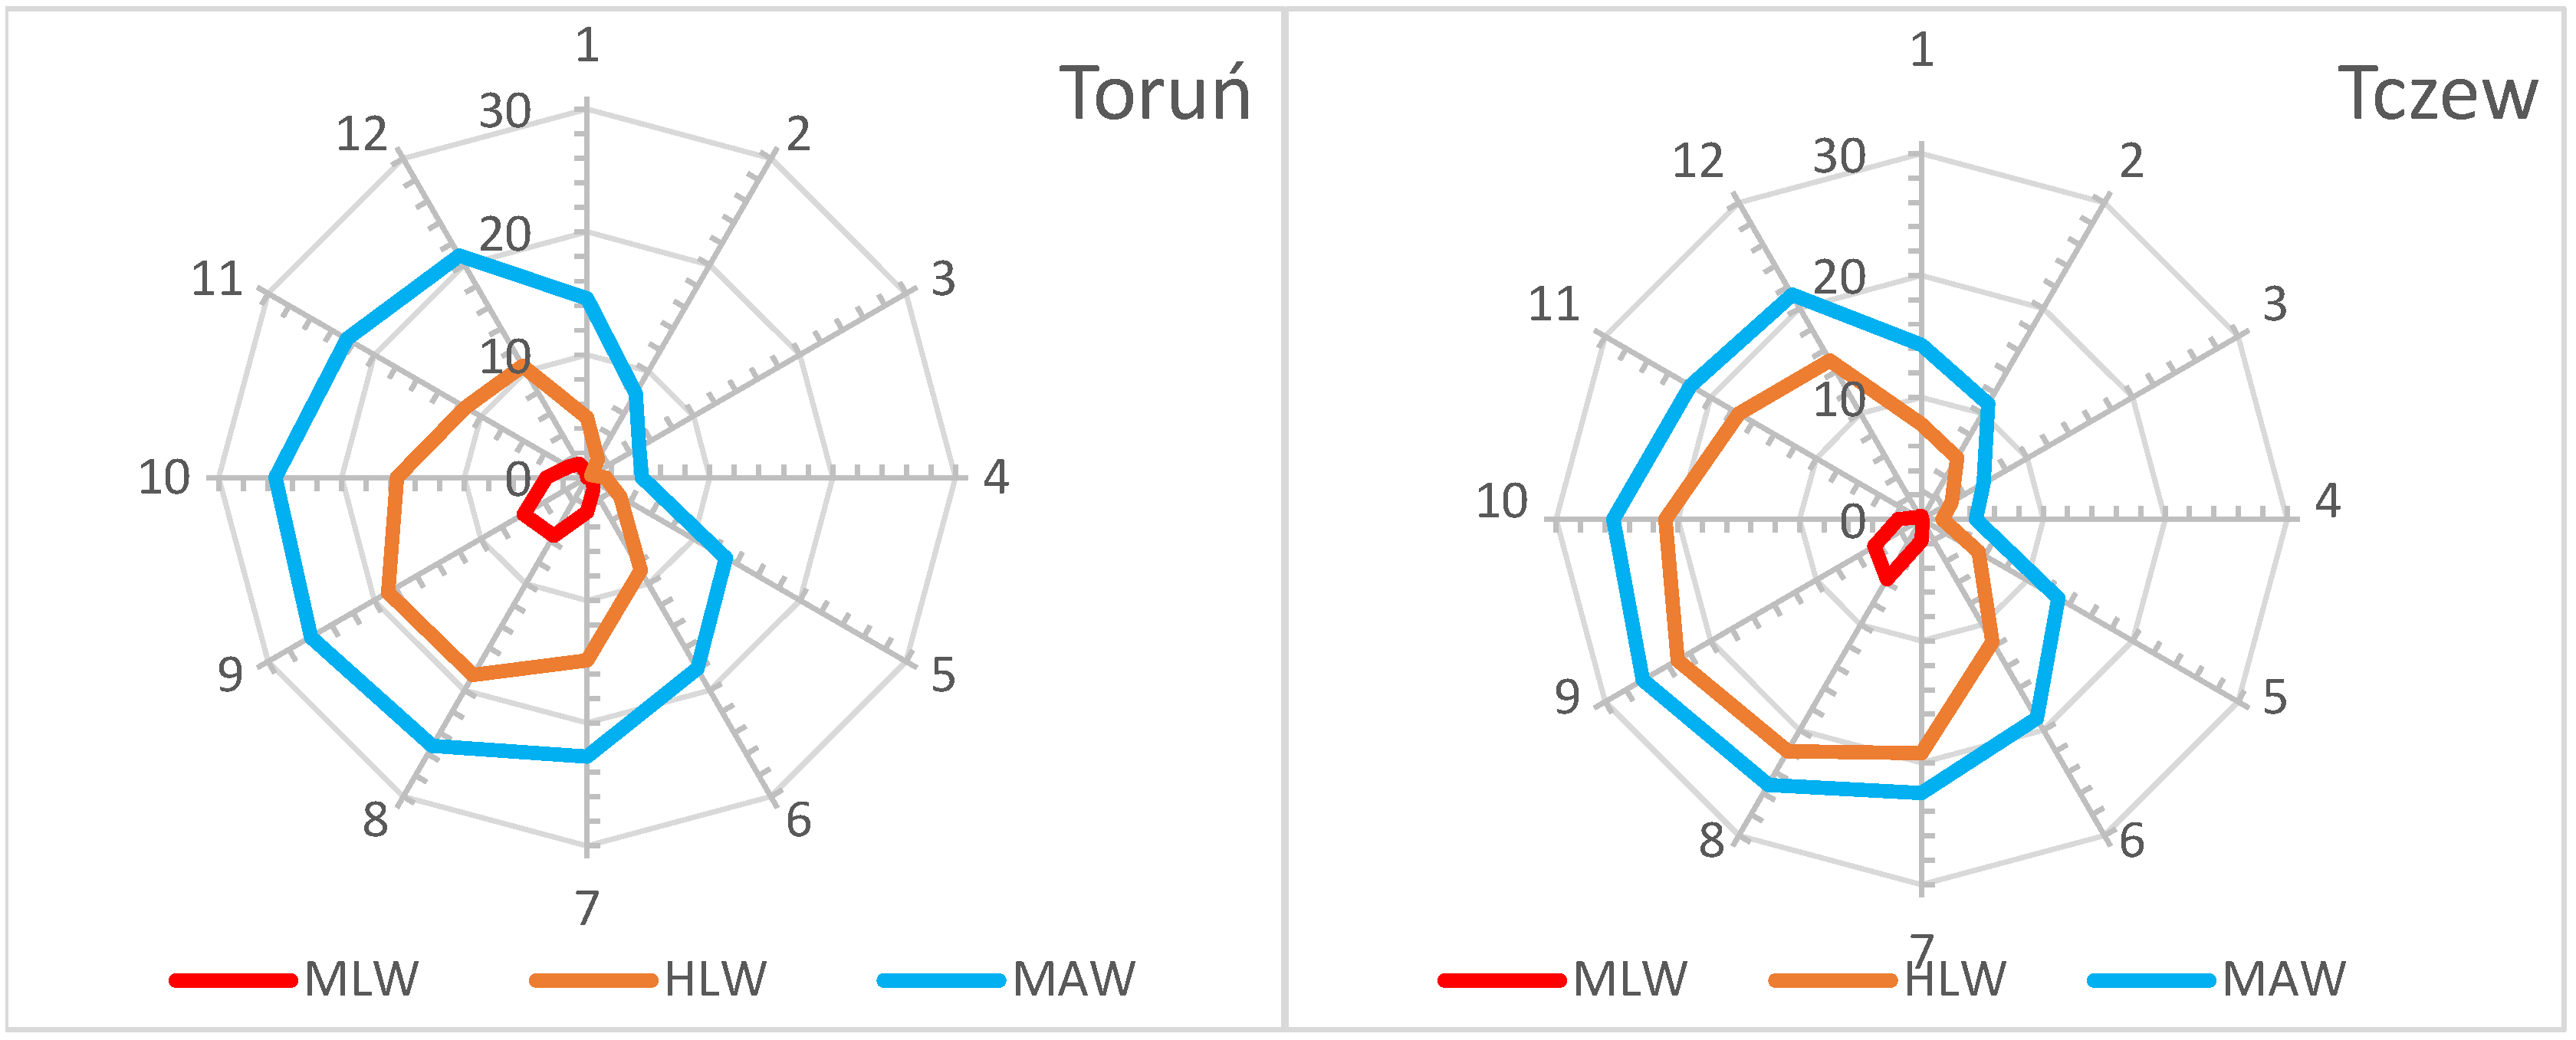
Water levels vary by month throughout the year. The water levels are highest in April and March and lowest in September. The shipping season lasts from April to November, winter being excluded, considering the occurrence of ice phenomena on the river. In the period from May to September, when the interest in tourist navigation is greatest, low water levels prevail, which may make navigation over longer distances impossible, especially for passenger ships with a draft of more than 1 m. Tourist boats, motorboats and kayaks usually have a smaller draft, so water levels restrict traffic to only a small extent. Figure 5 shows the distribution of the average number of days per month of water levels below a specific level. As shown, the highest average number of days in a month with low water levels (below the MLW) was in September in Toruń and in August in Tczew. In turn, most days with below-average water levels (which may cause difficulties in navigation) occur in August, September and October. In dry years, when the river’s supply was limited, water levels were low—making inland navigation practically impossible—for 135 days (i.e., from July to October) at Toruń, and for 89 days at Tczew.

4.2. Volume of Inland Transport in Poland in 2001–2020

Inland navigation includes freight and tourist traffic. Tourist vessels, which on the Vistula mostly sail on the lower section, do not require the great depths that the displacement of cargo vessels demand. A depth of 1 m will be sufficient for small vessels (yachts and motorboats) but will not be enough for cargo vessels. In terms of water tourism, there have been changes in recent years. They result mainly from the liberalization of water tourism regulations, as introduced by the Regulation of the Minister of Sport and Tourism of 9 April 2013 on practicing water tourism [57]. The new regulation abolishes strict governance regarding water tourism. Among other things, it contains a simplified patent system, and it exempts those wanting to engage in water tourism from the previous necessary qualification to sail yachts with a hull length of less than 7.5 m or motorboats with an engine power of less than 10 kW. A second factor increasing interest in water tourism is the development of tourist infrastructure including the construction of river wharfs, marinas and rental services for water equipment. On average, during the analyzed period, there were 106 registered passenger ships and 9575 passenger seats per year, based on the Central Statistical Office [50] (Figure 6). Since 2015, there has been a clear steady increase in the number of passenger ships and the number of seats, which may indicate a greater interest in smaller passenger vessels with smaller draft that can therefore sail in less-favorable hydrological conditions. In terms of the number of passengers transported by inland waterways, an average of 1,111,000 passengers were transported per year, of which the fewest during the analyzed period (i.e., 681.9 k) were transported in 2020.
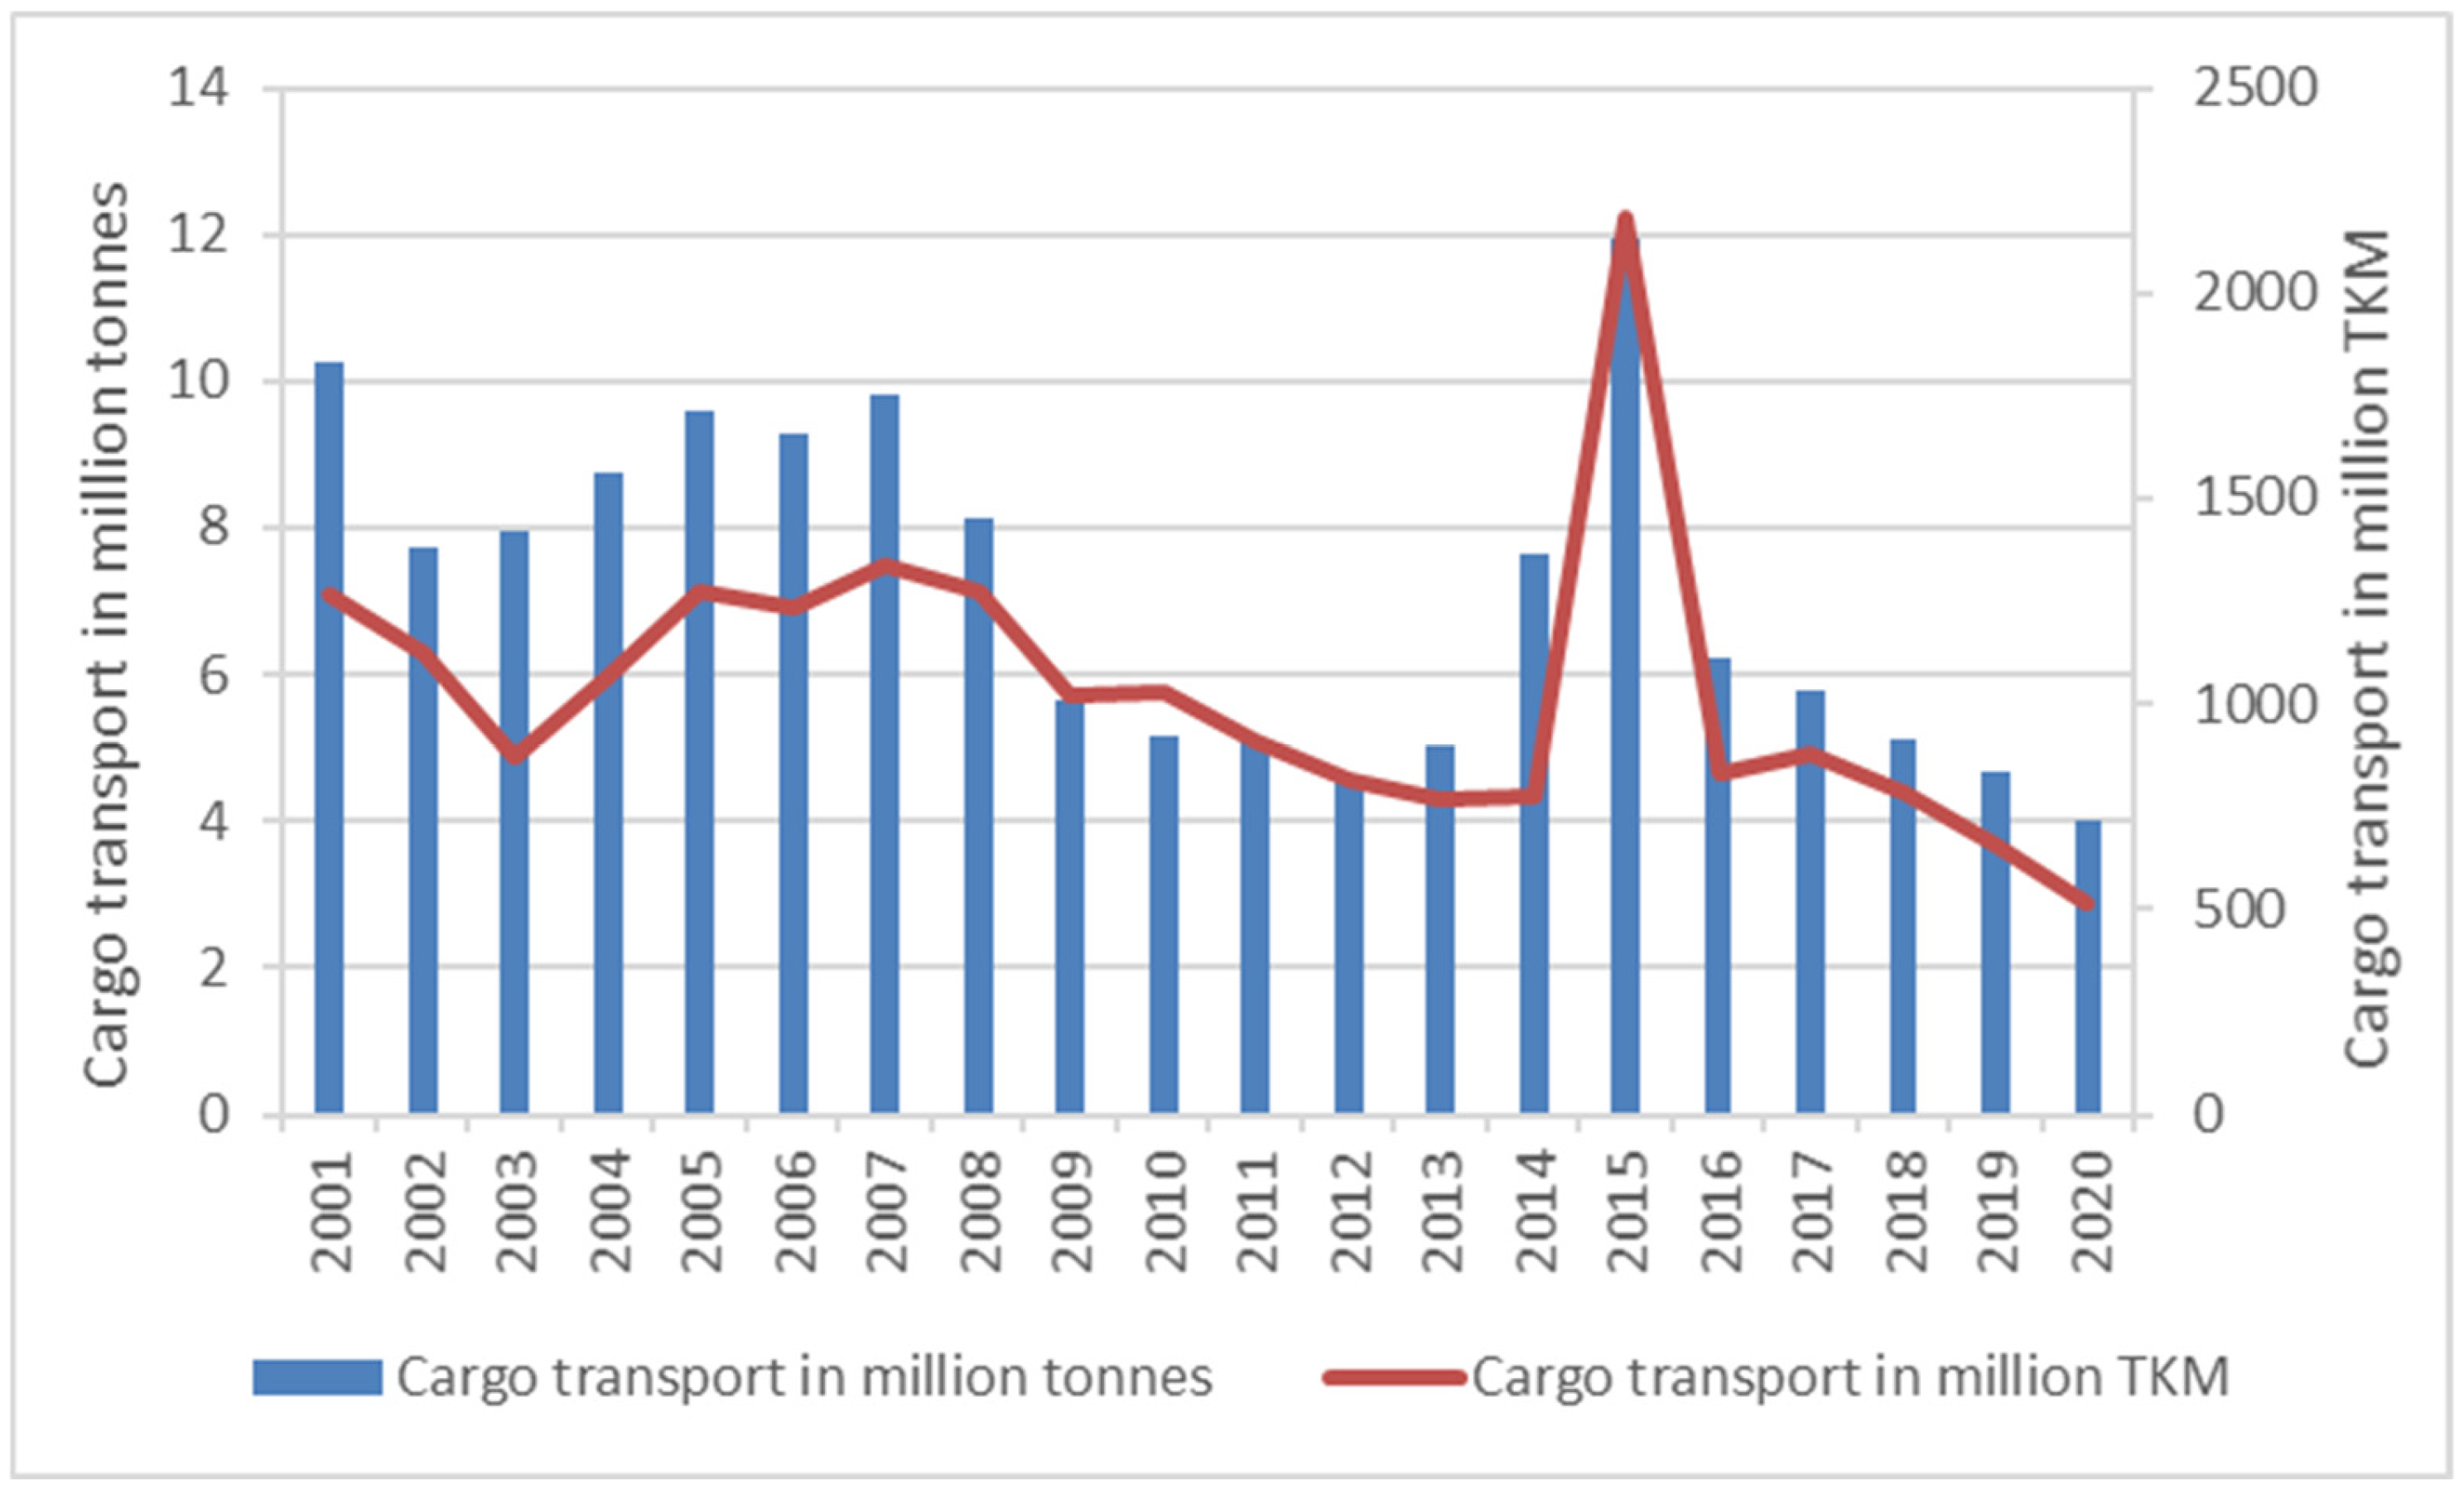
The steady increase in passenger boats and passenger seat numbers with a simultaneous decrease in the number of passengers transported indicates that new vessels are not being used for transportation, but only for tourist purposes of their owners [56]. The review of cargo transport by inland waterways in the years 1986–2020 indicated that an average of about 7.12 million tons were transported per year and transport work reached 1031.2 million TKM (ton-kilometer), as reported by the Central Statistical Office [50]. Figure 7 shows a substantial decline in cargo transport and transport work, which has been especially visible in recent years. In 2020, transport accounted for only 56% of cargo transport and 50% of transport work compared to the 1986–2020 average, which resulted from the announcement of the COVID-19 pandemic. A small amount of transported cargo by inland waterways was recorded in 2019 (approx. 66% compared to the 2001–2020 average). The transported cargo was dominated by bulk goods—mainly metal ore and other mining and quarrying products.

4.3. Lower Vistula Shipping Traffic Intensity

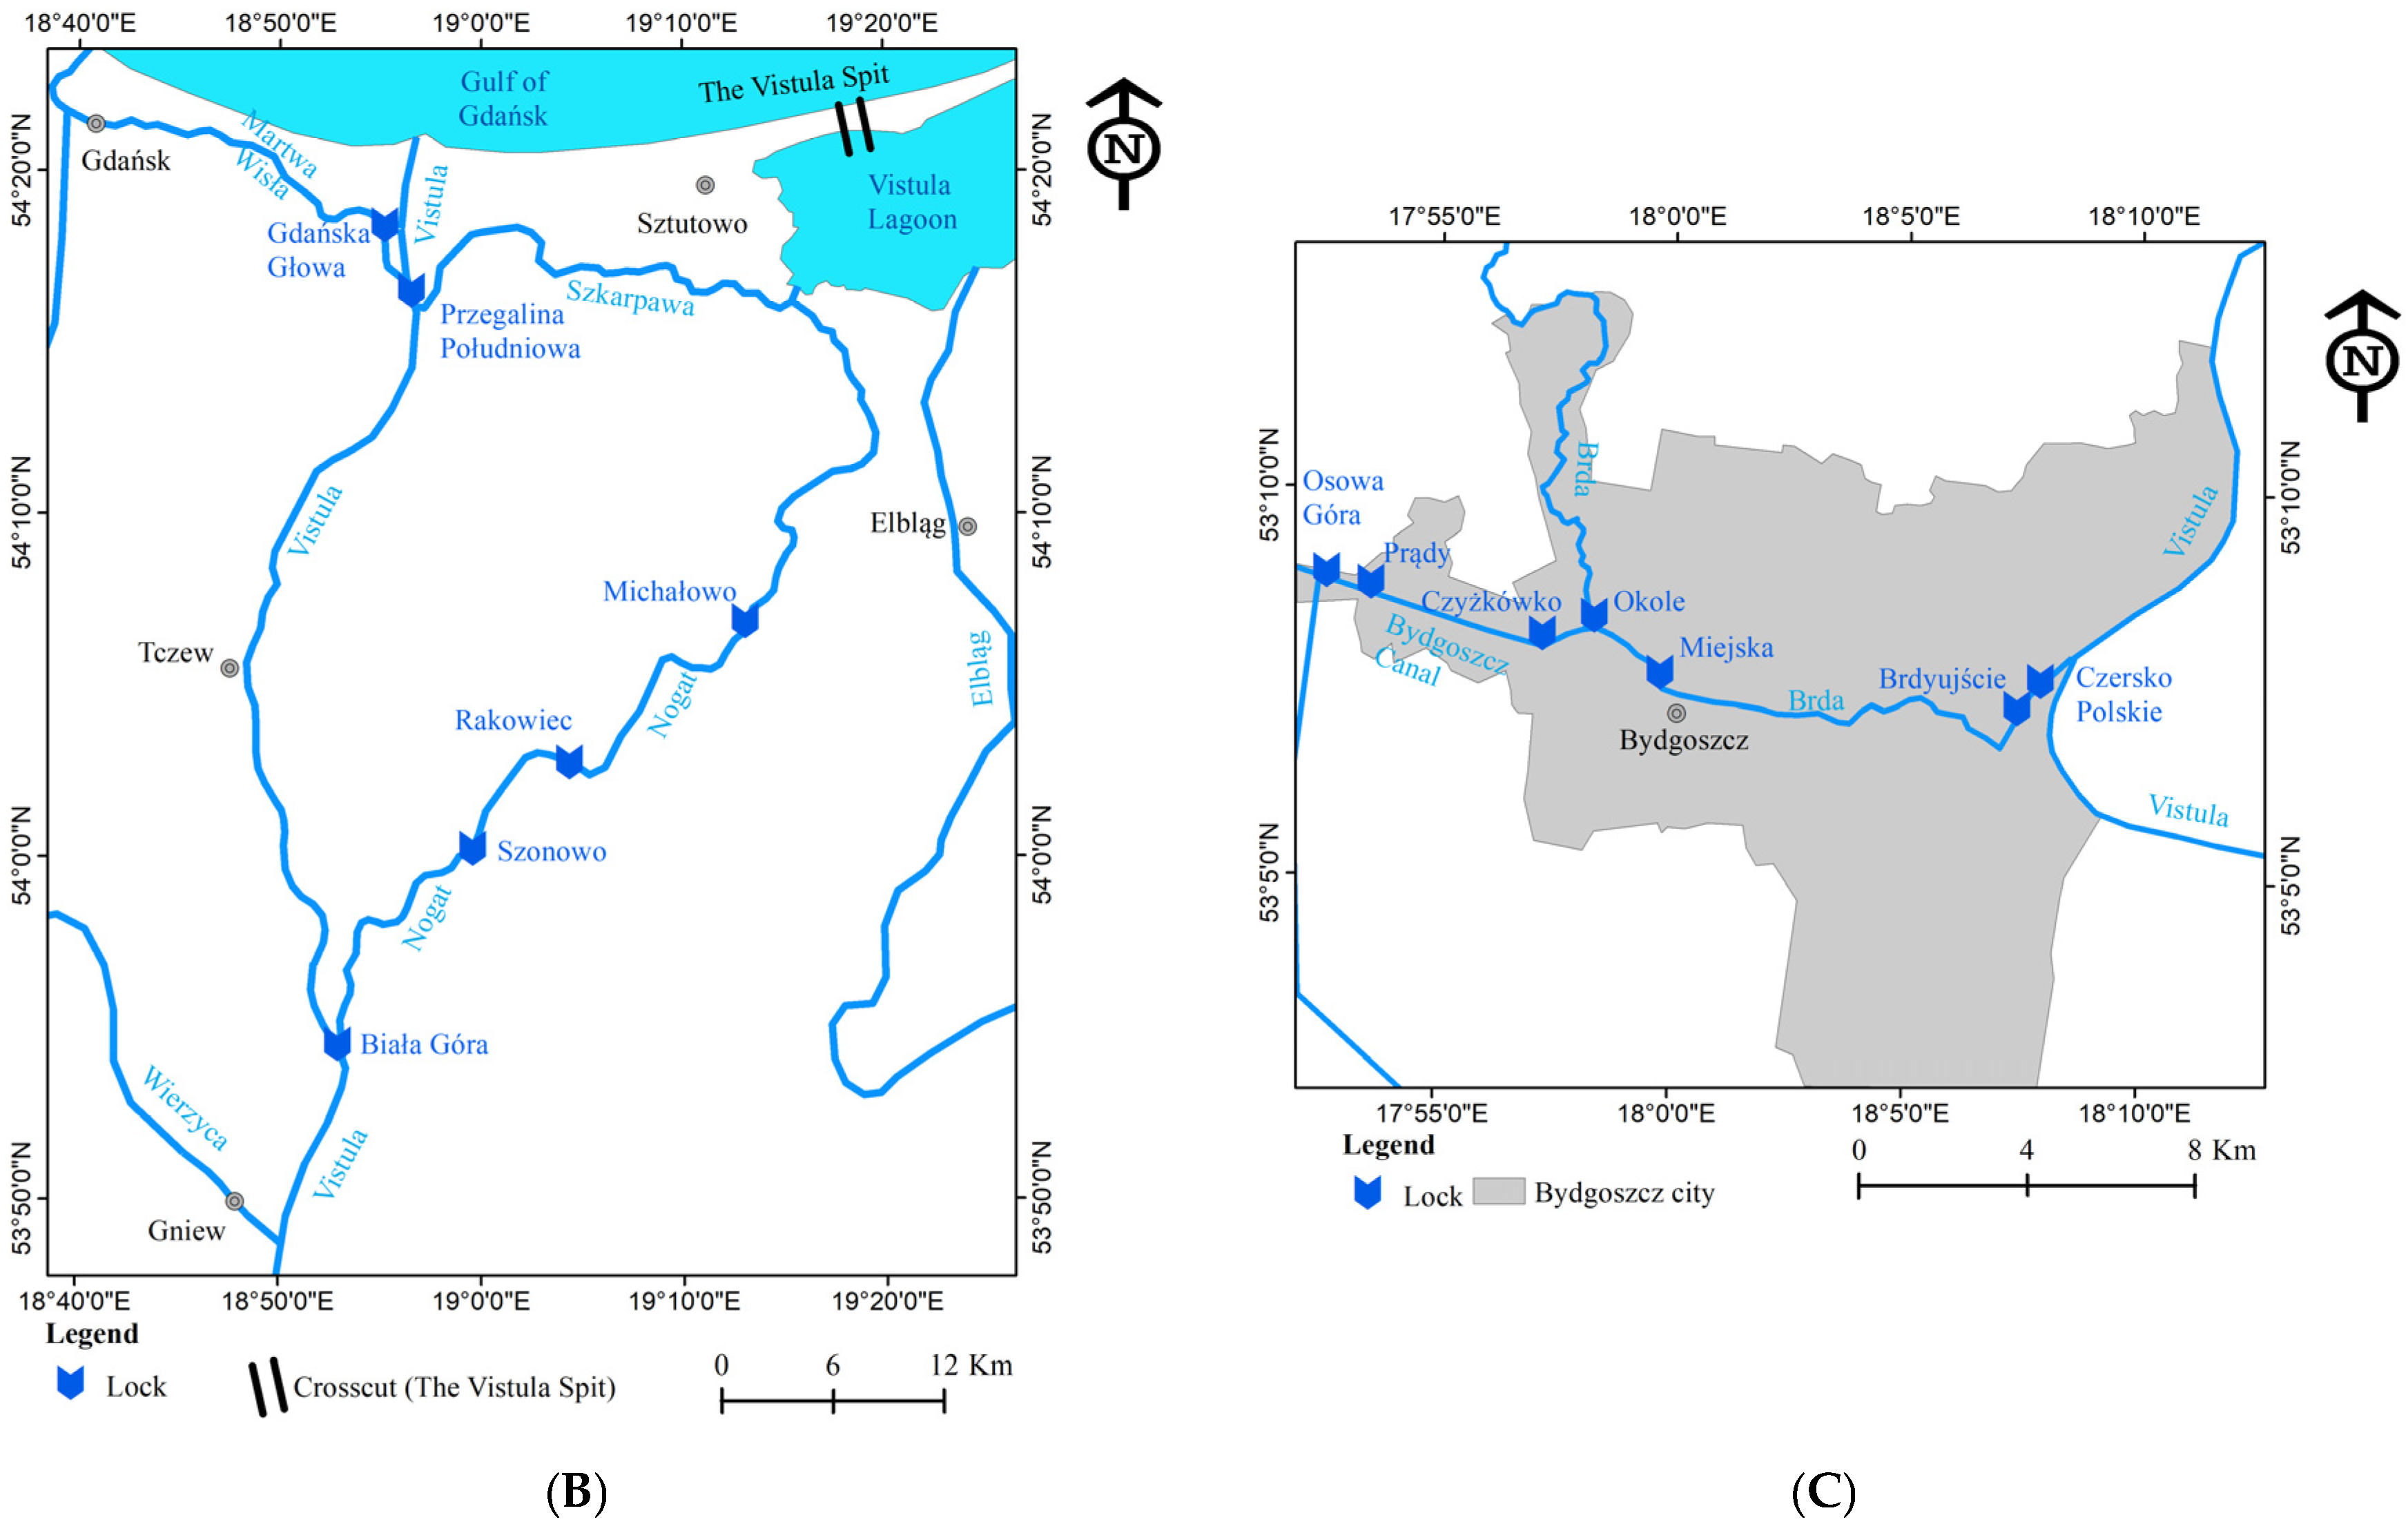
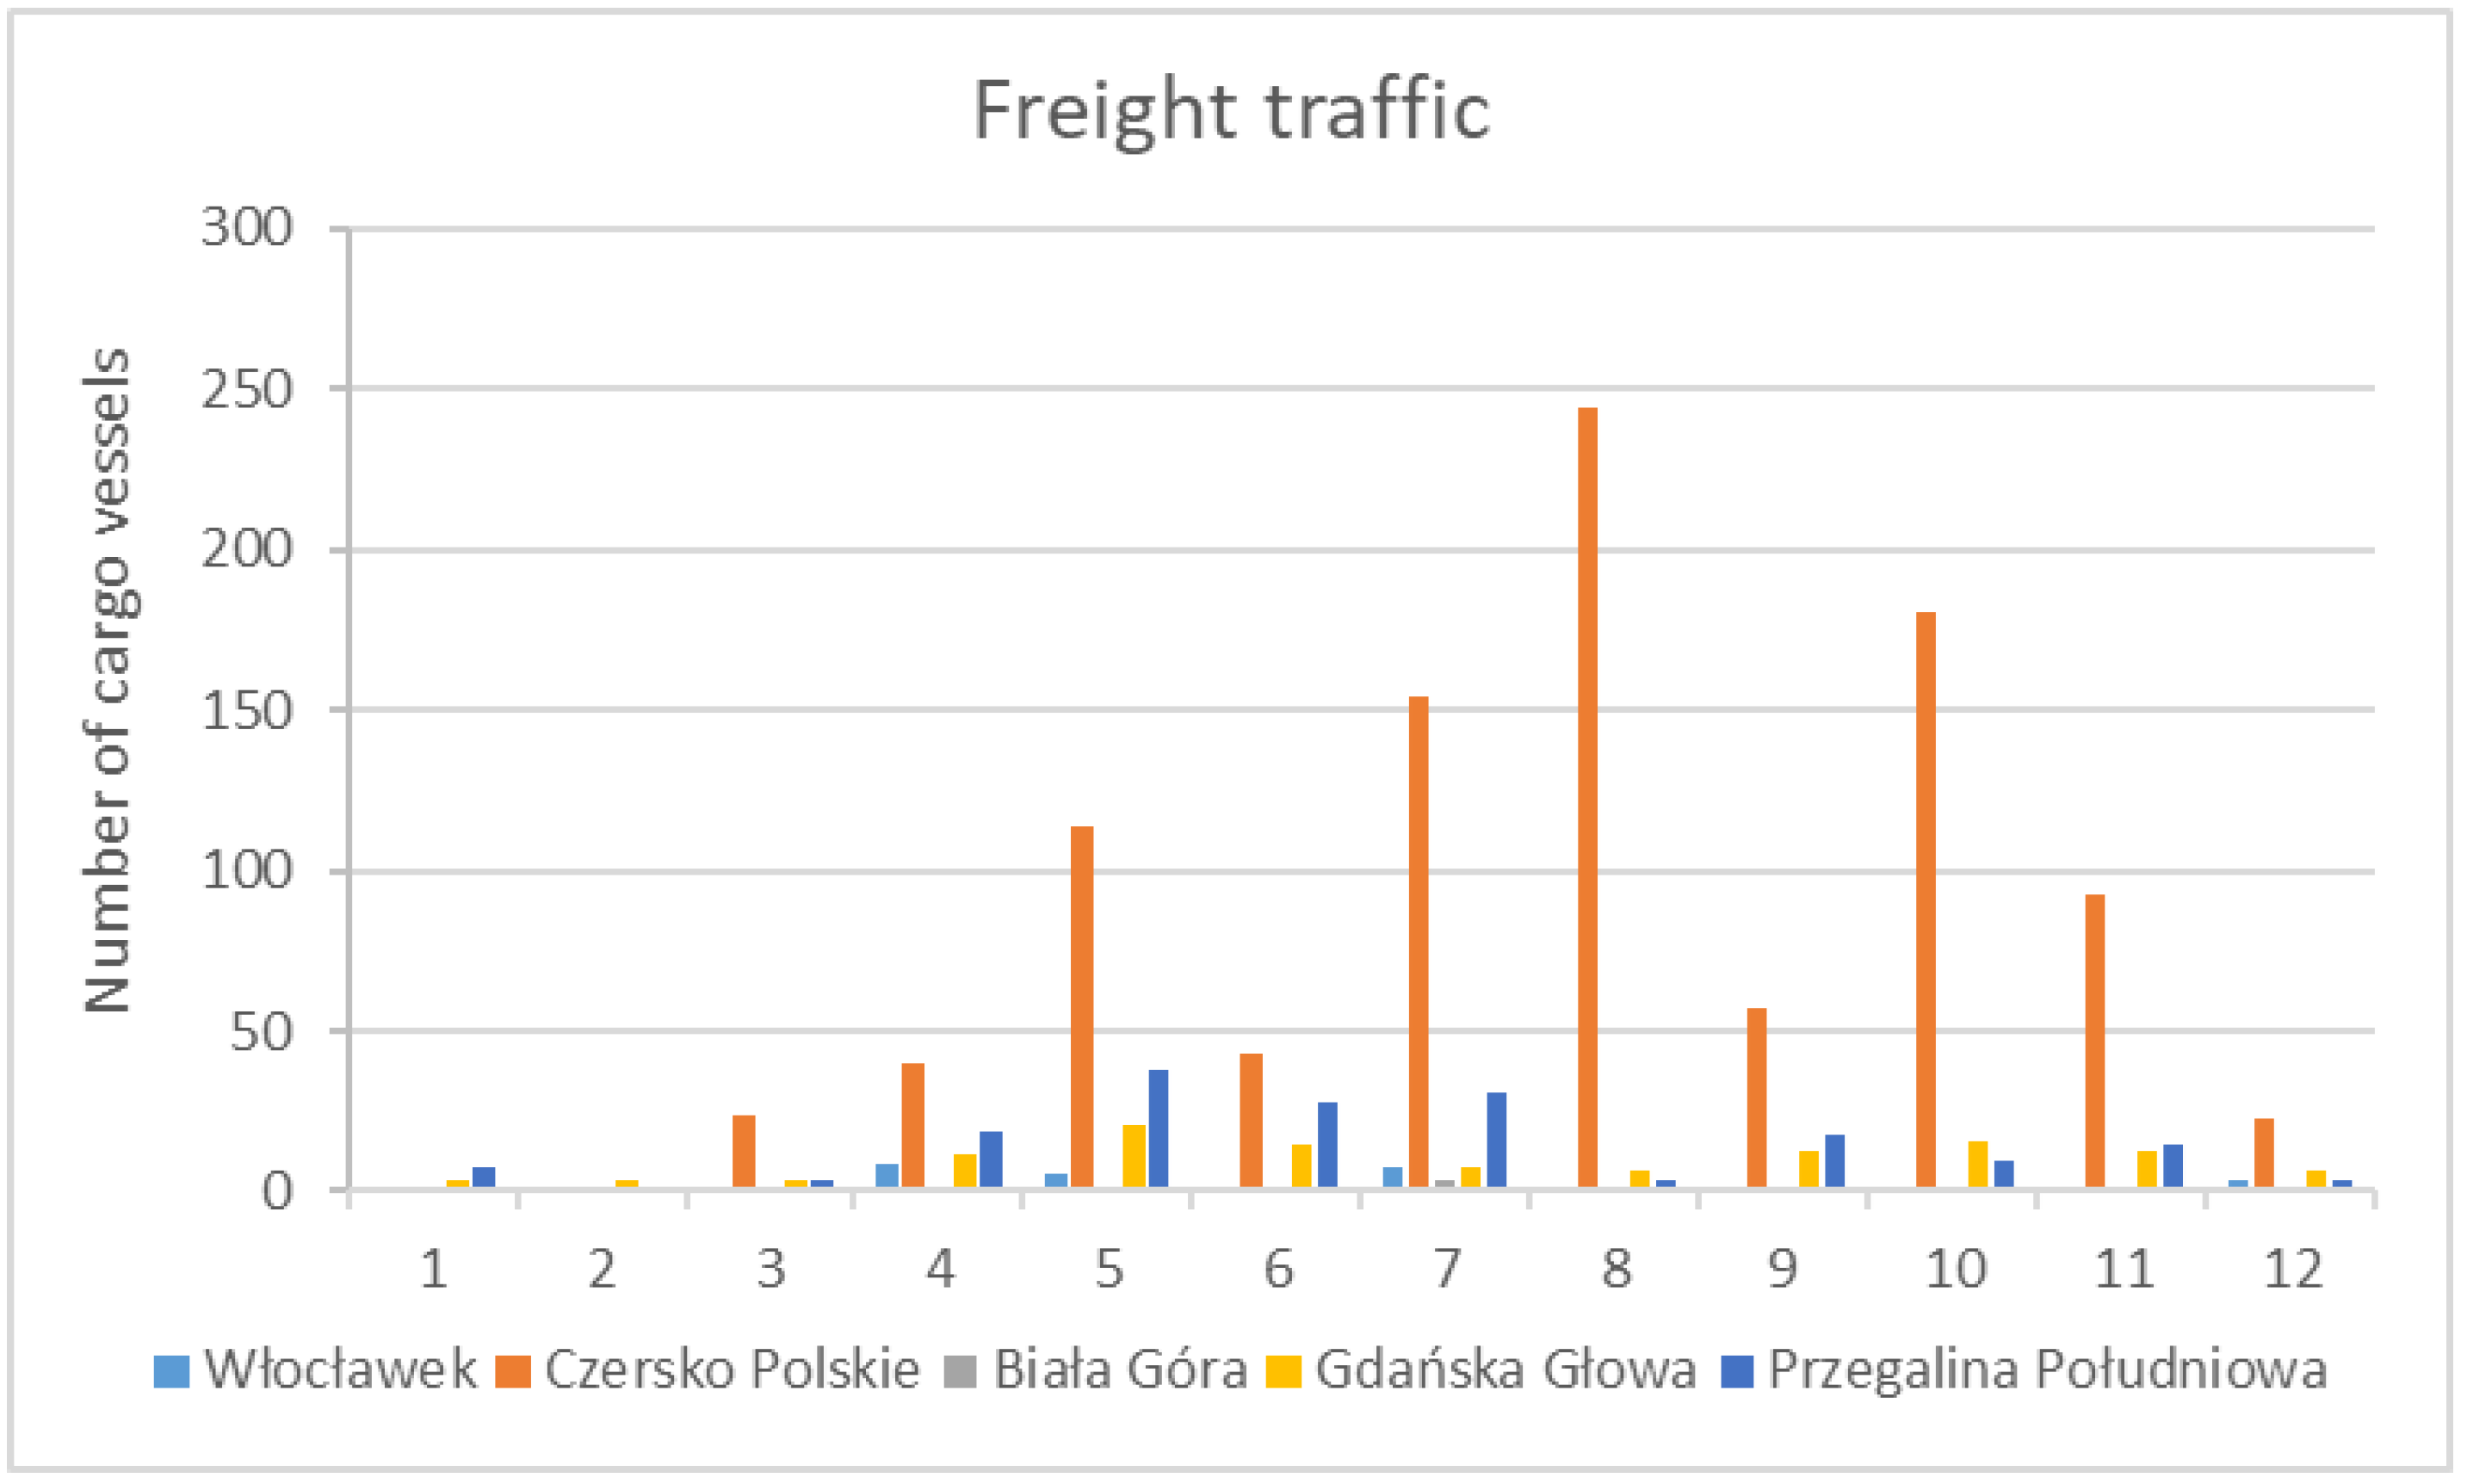
On the section of the Lower Vistula from Warsaw to the mouth to the Baltic Sea, there is only one proper lock on the river, at Włocławek, and there are four locks on the tributaries and outflows and in the immediate vicinity of the Vistula. The Czersko Polskie lock is the first lock on the Brda River and enables westward inland navigation (E-70). The Biała Góra lock on the Nogat River and the Gdańska Głowa lock on the Szkarpawa River enable navigation towards the Vistula Lagoon. The Przegalina Południe lock on the Martwa Wisła facilitates navigation towards the Baltic Sea in the vicinity of the Gdańsk Port. To compare the degree of use of the above-mentioned locks in cargo and tourist traffic, a data review is presented on the number of vessels that passed through the locks in 2018, courtesy of the Regional Water Management Board [46,51]. The cargo vessel traffic was numerically the greatest at the Czersko Polskie lock (971 vessels), in connection with local construction activities related mainly to the transport of sand extracted from the Vistula. There was little freight traffic recorded at the remaining locks. Only six freight vessels passed through the lock Biała Góra in 2018, 30 at Włocławek, 124 at Gdańska Głowa, and 181 at Przegalina. Even at the Przegalina lock, which could handle some of the goods from the seaport in Gdańsk (Figure 8), the degree of the waterway use is low.
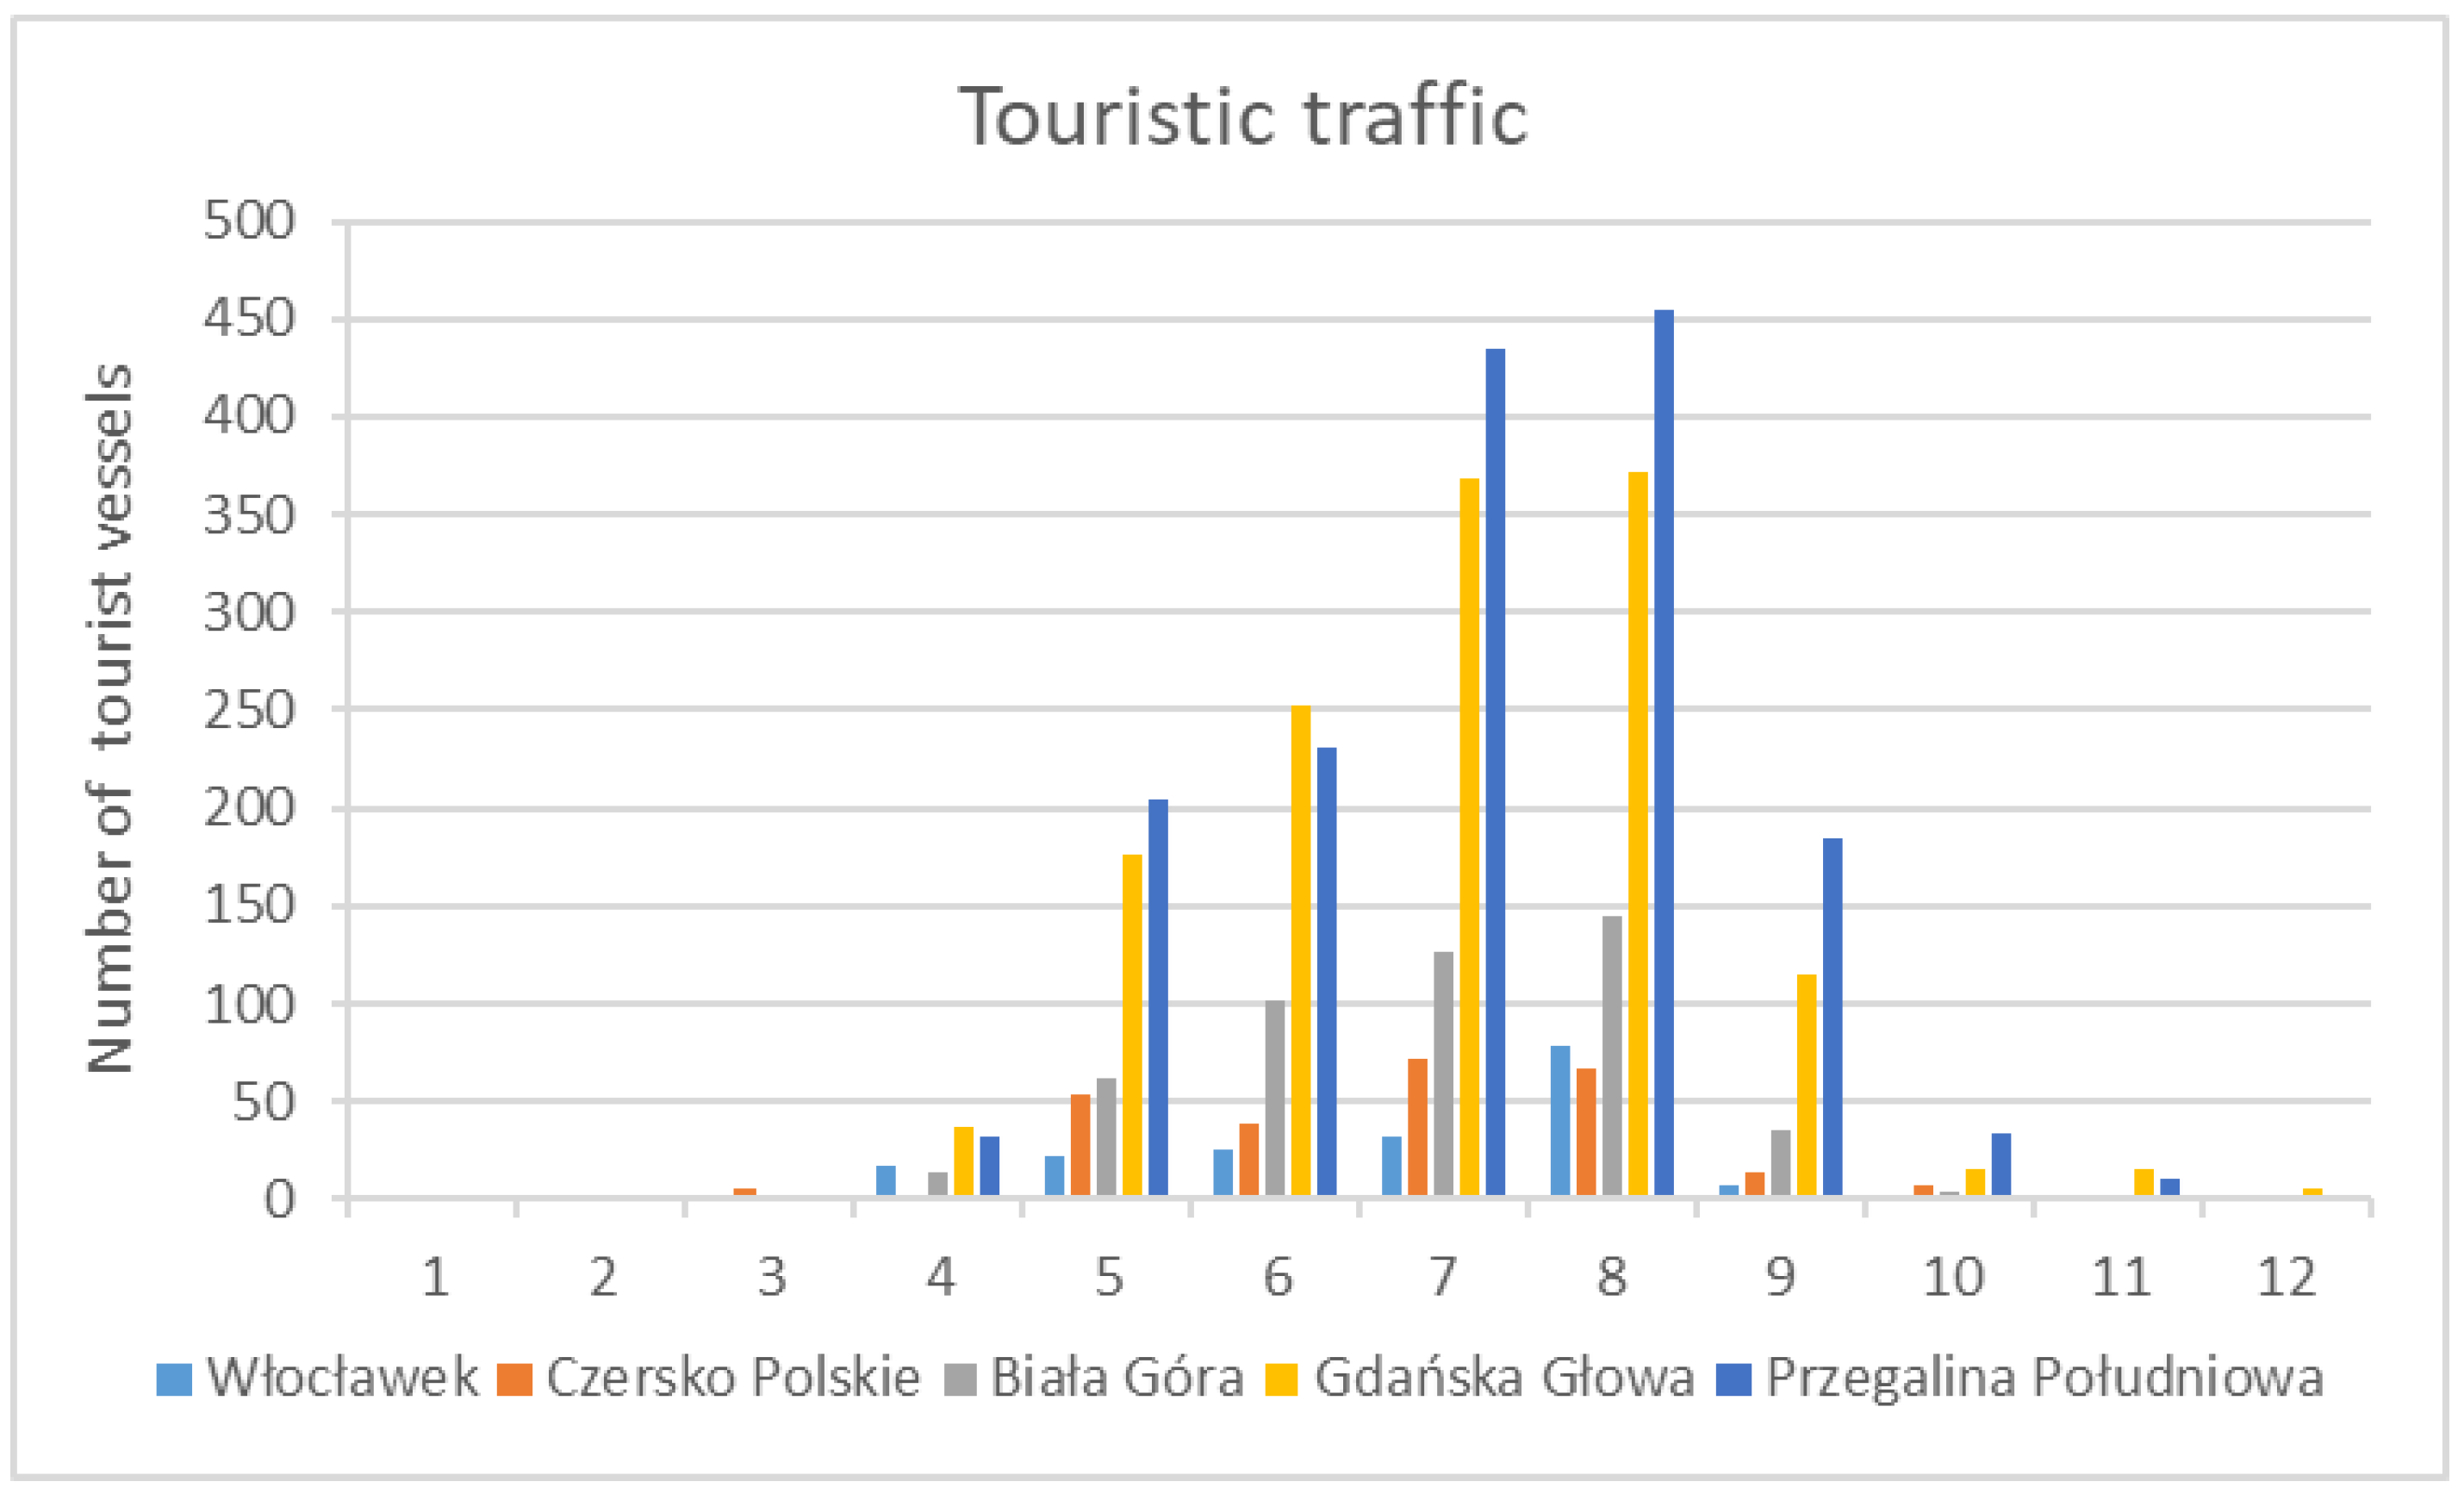
The highest tourist traffic in 2018 was observed at the Przegalina Południe (1589 vessels) and Gdańska Głowa (1358 vessels), which is due to their proximity to Gdańsk and the Baltic Sea, favoring weekend and short trips (Figure 9). The remaining locks, such as Czersko Polskie and Włocławek, are little used for tourist purposes. As the Regional Water Management Board confirmed, the low tourist use of the Czersko Polskie lock results from the total of 22 locks on the E-70 route, six of which being in Bydgoszcz. These are Czersko Polskie and the Miejska locks on the Brda River, and the Okole, Czyżkówko, Prądy and Osowa Góra locks on the Bydgoszcz Canal. On the Bydgoszcz section of the E-70 waterway, the Miejska lock, located in the city center, is the most frequently used [58].
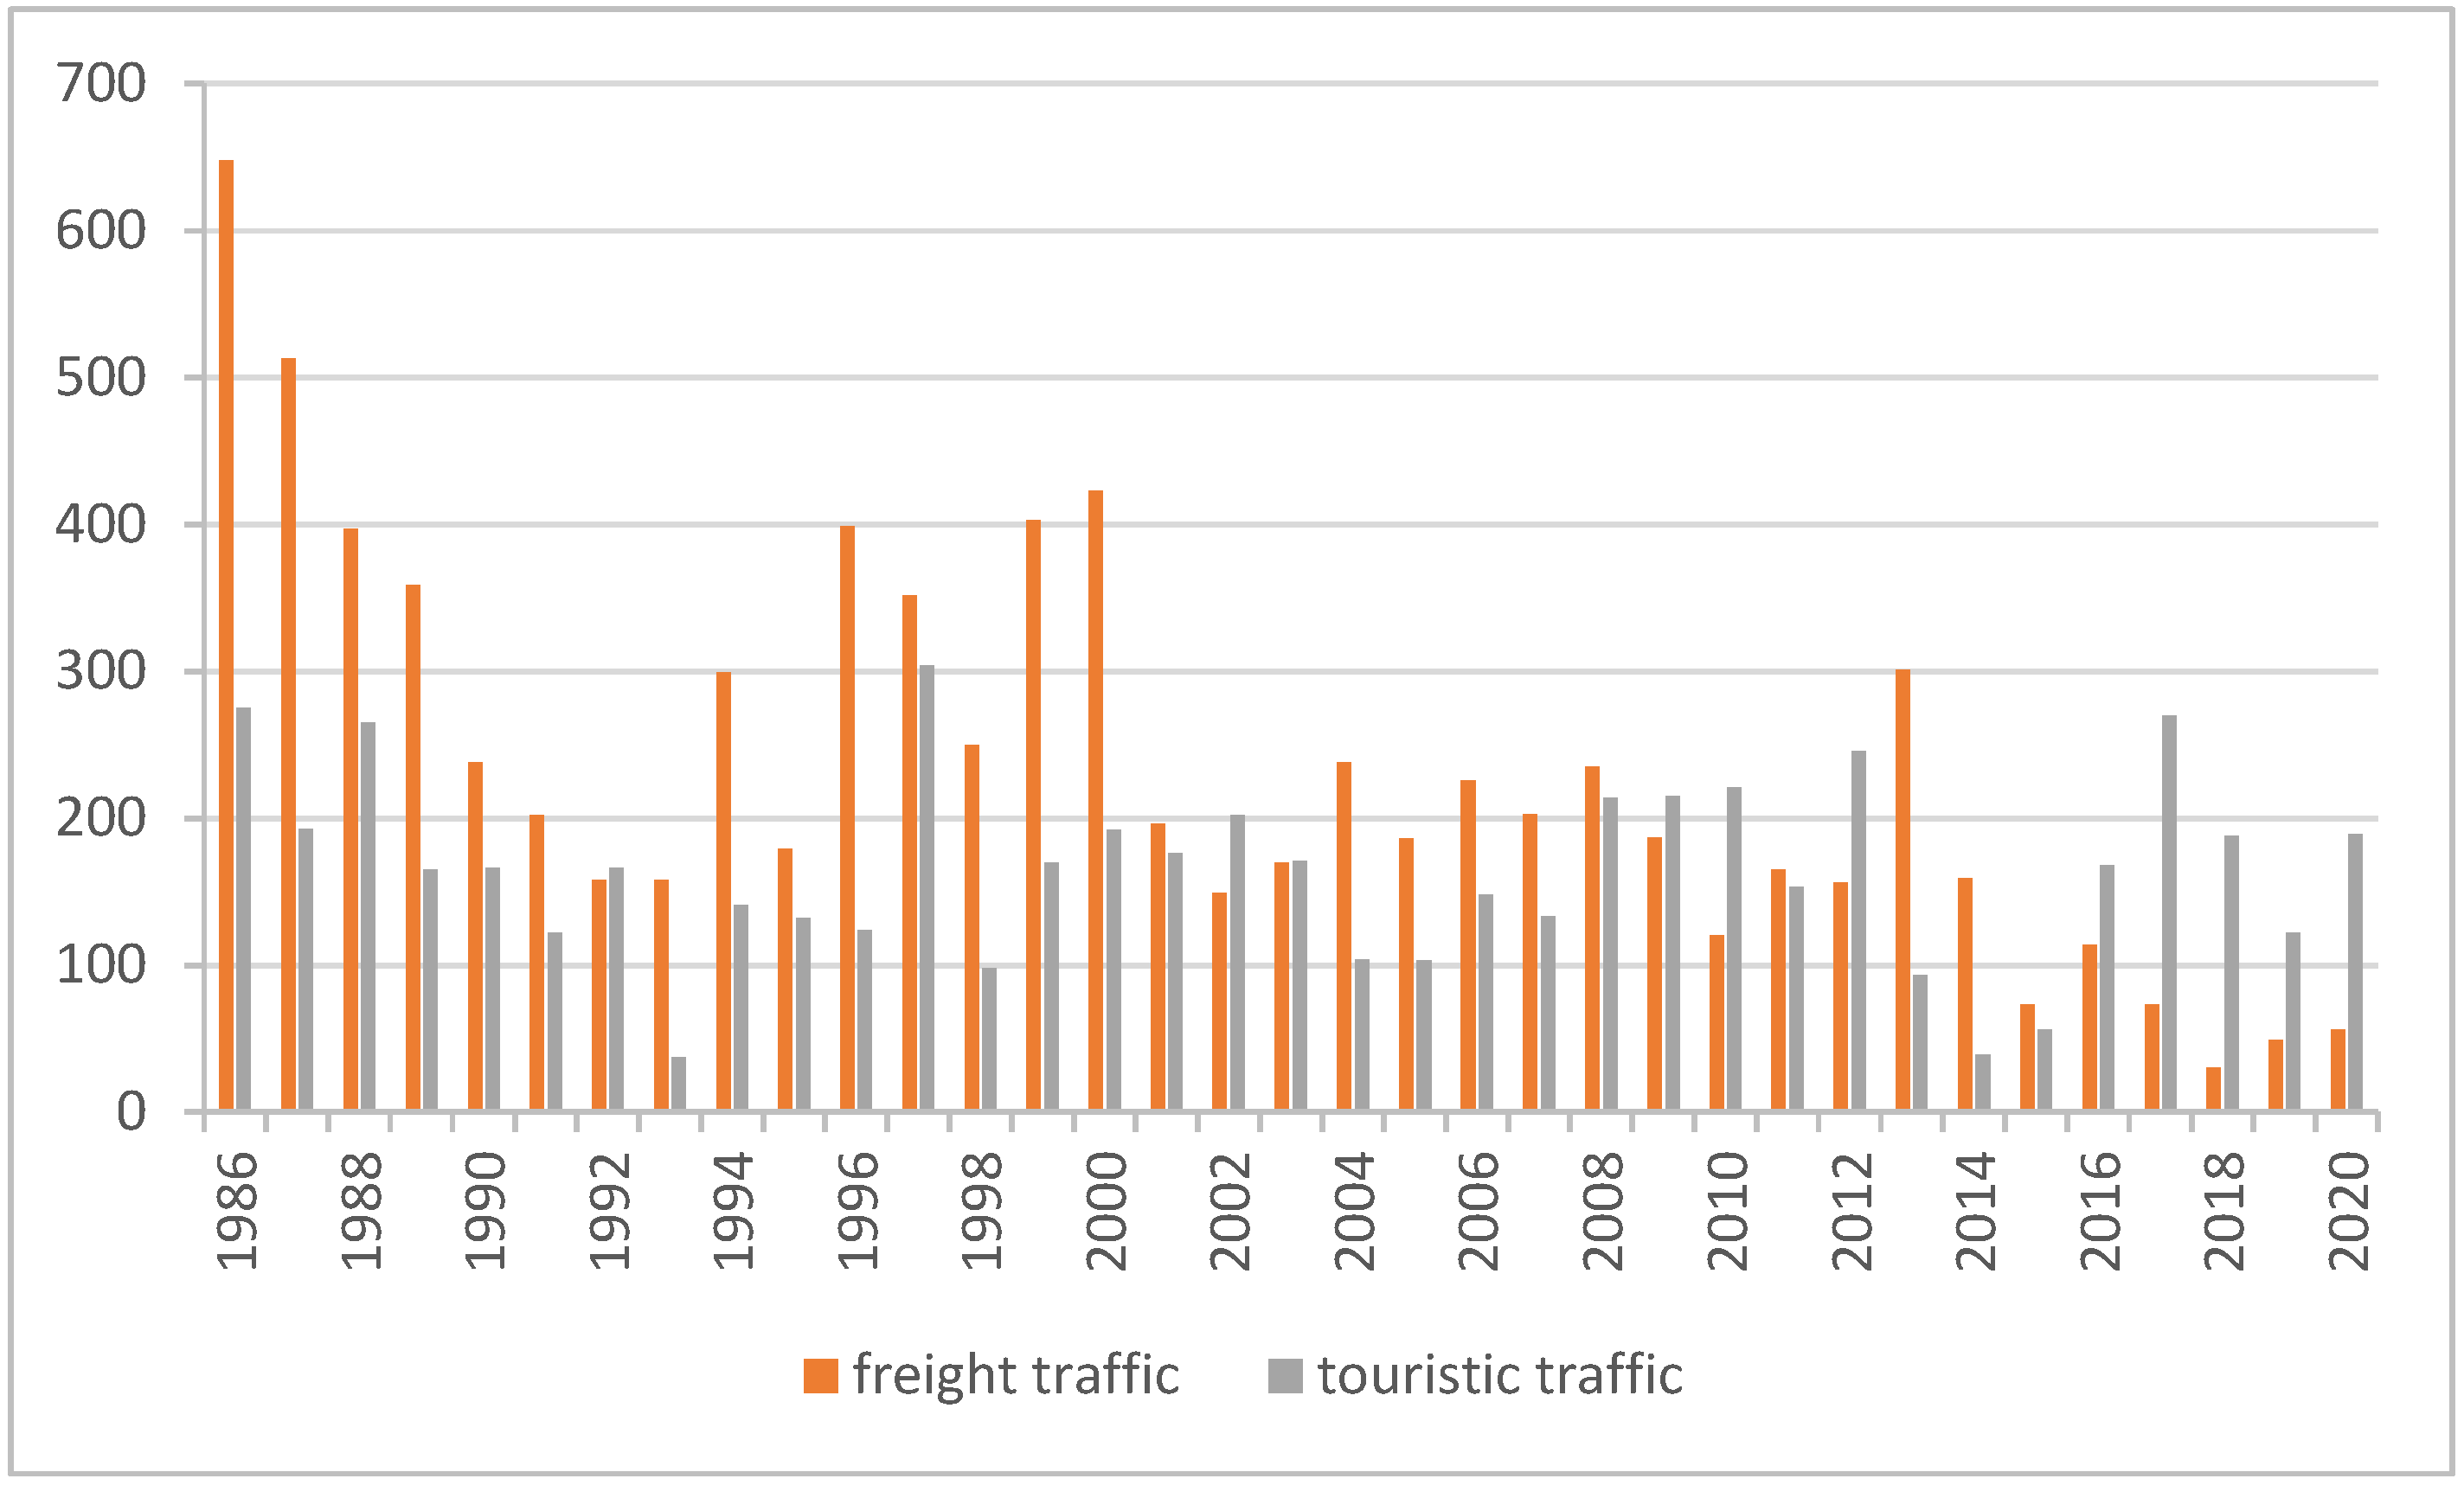
The long-term functioning of inland navigation was analyzed in terms of the freight and tourist traffic at the lock at Włocławek, in the years 1986–2020 (Figure 10). On average, 395 vessels per year passed through the lock at Włocławek, of which 230 were cargo vessels and 165 were tourist vessels [17]. According to the Regional Water Management Board in Warsaw [51], in recent years, i.e., from 2014 to 2020, there has been a steady decline in the total number of vessels passing through the lock at Włocławek. In 2018, only 30 freight vessels and 188 tourist vessels passed through the lock, whereas 2015 saw 73 freight boats and 56 tourist vessels. The share of cargo vessels among all boats by the lock is particularly unfavorable—totaling only 14% in 2018, as the same administrative board states.
Traffic intensity is seasonal. While inland freight navigation can be carried out all year round, provided that no ice phenomena occur, tourist navigation is carried out mainly in the summer months.
In the Polish climate, the summer months (June–August) are optimal for water tourism due to meteorological conditions being favorable (the warmest months of the year) and the occurrence of the summer vacation period (holiday and vacation season). During this time, various special events or regattas are held, attracting tourist boat users and owners. Freight traffic mainly occurs from March to November.
Appropriate depths, which result from actual water levels, are important. Ensuring depth is slightly less important to tourist navigation, especially for small vessels with shallow drafts, but for passenger ships with a draft of greater than 1 m, it may be problematic on a longer section of the waterway.
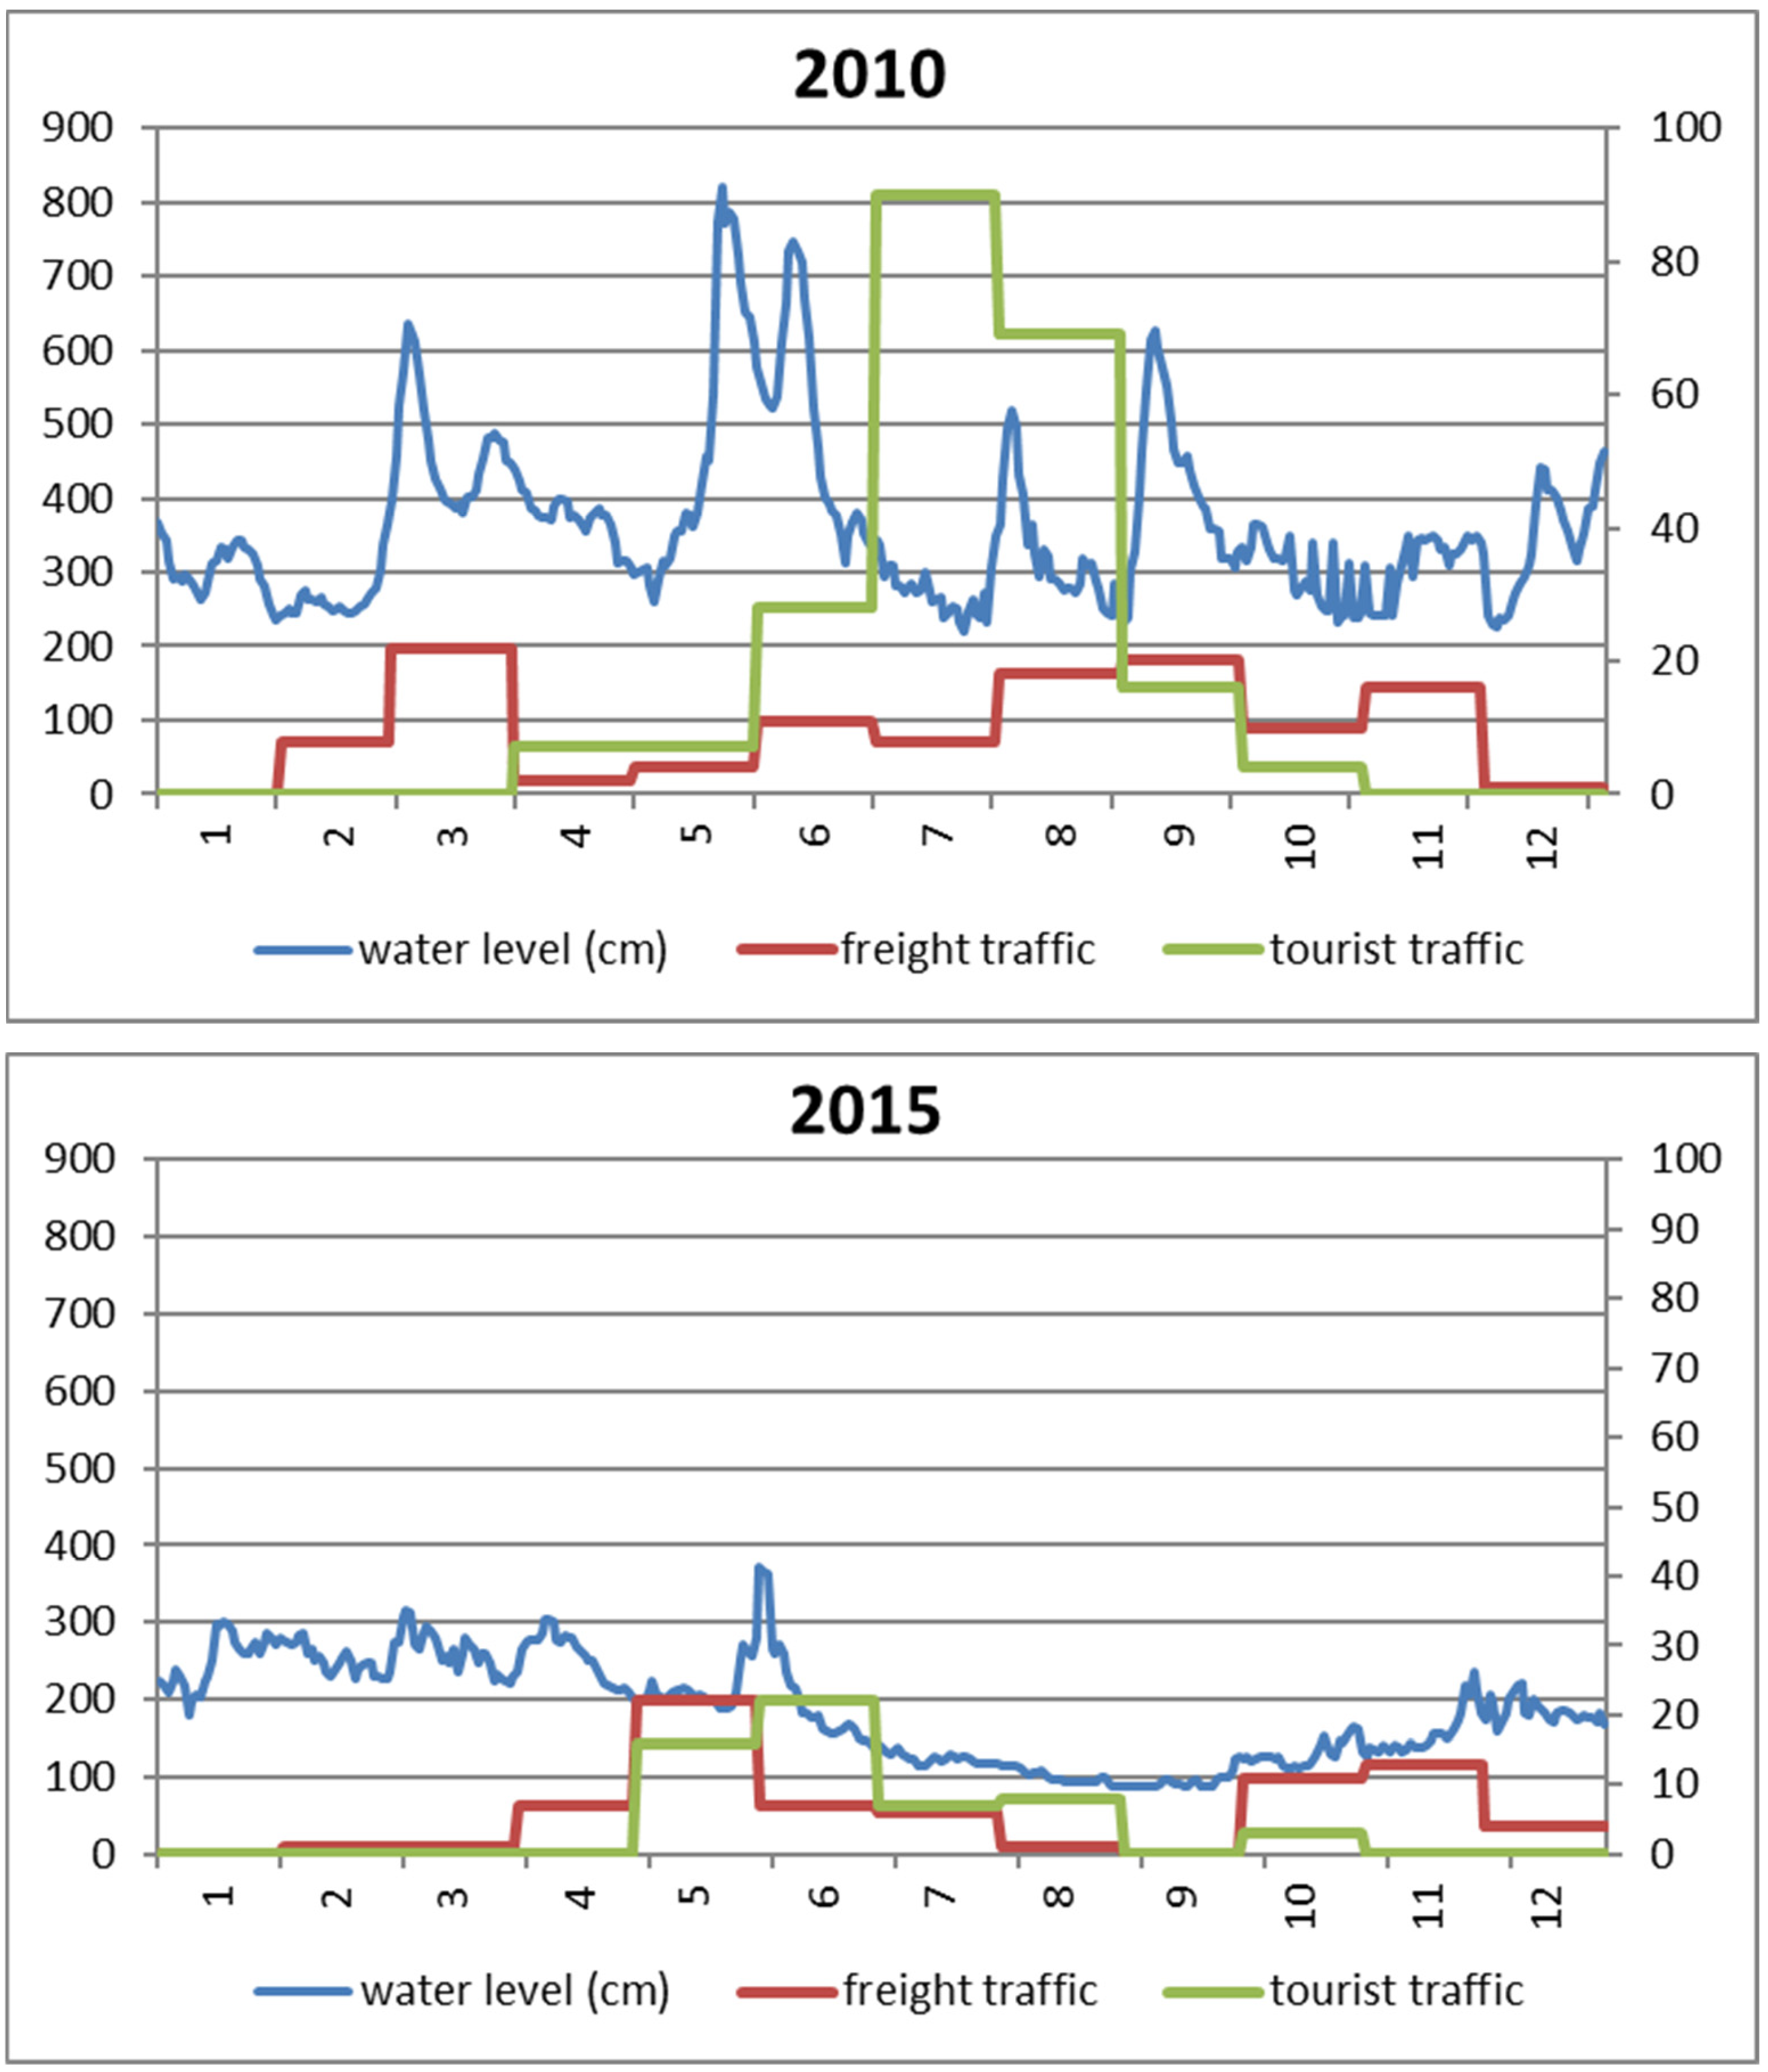
Figure 11 shows the water levels of the Vistula River with the number of cargo and tourist vessels served at the Włocławek lock in a wet year (2010) and in a dry one (2015).
As indicated in this review, there is a clear relationship between the water level and vessel numbers and types passing through the locks on and around the Lower Vistula waterway. In addition to the shallow depths, other important factors restricting the development of inland navigation on the Lower Vistula section are low clearances under bridges and poor navigation facilities on waterways.

5. Discussion

5.1. Assessment of the Inland Navigation Conditions on the Lower Vistula Against the Background of Hydrological Conditions

This review aims to provide an assessment of the actual use of the Lower Vistula waterway from a regional perspective and the possibilities for conducting inland navigation depending on the hydrological conditions prevailing on the river.
The limitations of this review logically derive from the limited information provided by the 61 reviewed articles. In order to diminish these restraints and to complete the knowledge, we used several important databases, as mentioned in Section 3 (Materials and Methods). At the same time, we did not want to go beyond the scope of a review and present new personal results, but rather offered a rationalization of this important topic, based on the analysis, synthesis and comparison of existing studies on Lower Vistula inland transport.
Inland navigation on the Lower Vistula is most impacted by water levels in the river channel, which determine whether depths are sufficient for navigation [56]. There is a general upward trend in the number of days with lower water levels and a downward trend in the number of days with higher water levels. This is especially clear at the Toruń gauge. At the Tczew gauge, the number of days with lower water levels is decreasing (W0, W1 and W2). The importance of the Vistula as an inland waterway for freight transport is marginal. As research carried out on the Lower Vistula River has shown, high water levels (floods) have a less severe impact on inland transport than droughts, due to their shorter duration. These results are also confirmed by studies conducted on other rivers [10,53]. Restrictions during high water levels are mainly the result of navigation obstacles represented by bridges and power lines, which are very diverse in their technical parameters, especially vertical clearance. Bridges have a vertical clearance from 5.28 to 12.5 m, while that of high-power lines is 14 m [55]. Low water levels last much longer than floods; in extremely dry years with little rainfall, they may last several months. This is illustrated by the exceptional drought of 2015 that covered much of Europe [59]. The low water levels varied in duration among Polish stations. They lasted longest at the Toruń station (135 days in 2015), preventing navigation from July to mid-November. They were much briefer at the Tczew station (89 days in 2015), precluding navigation from mid-July to mid-October. This means that inland navigation is possible over much shorter distances and with lighter ship loads. Furthermore, droughts can severely disrupt inland waterway services by lowering the water level either to a completely unnavigable state or, more often, to levels that force operators to reduce cargo loads [60]. The amounts of cargo transported and the distance are reduced. More frequent low water levels may therefore substantially increase the costs of inland navigation [61]. Despite these observations, the impact of climate change on the overall costs is uncertain and ambiguous. Climate change projections up to 2050 and their projected impact on the hydrology of the two largest rivers, Danube and Rhine, have been modeled using two long-term scenarios, namely ‘dry’ and ‘wet’; the results suggest that changes are unlikely to be large enough in order to substantially modify the various modes of transport [62,63]. Climate change may have a negligible or even positive impact on inland navigation on the Rhine and Danube, probably due to early thaws. The projected higher flow would result in higher average water levels and, most importantly, it will reduce the number of days with water levels below the minimum required for navigation [60,61]. The results of the forecasts for the Rhine up to 2100 indicate that rain will be the dominant determinant of seasonal variability in flows. Snow will melt sooner and will store less water. As a consequence, the occurrence of low flows, especially in the lower stretch of the river, will increase due to the lack of buffering of flow levels that snowmelt and ice melt provide, especially in summer [64].
On the Lower Vistula, the impact of climate warming will be negative for cargo inland waterway shipping, but positive for tourist inland waterway shipping (shallow-draft vessels). Hydrological droughts occur on the Lower Vistula in the summer and fall and are usually the result of long-term meteorological droughts [65]. Research conducted by Piniewski et al. (2018) [66] showed that, for all climate scenarios, runoff annual increases in the Vistula basin dominate. Seasonal patterns show that the increase is highest in winter and lowest in spring, with spatial patterns revealing the highest increase in the inner, lowland part and lowest increase in the southern, mountainous part of the basin. An air temperature increase in the winter months will lead to early snowmelt and an increase in Vistula water levels from February or March, with the possibility of extending until May (due to meltwater supply from the Vistula source area) [67]. Increased supply to the Vistula, due to the snowmelt, during the winter and spring months, will not ensure adequate water levels in the summer months by reason of inability to retain the water supplied during period of excess. Moreover, the flow of the Lower Vistula in the summer and autumn periods is the result of rainwater. The lack of water reservoirs on the Lower Vistula, with the exception of the reservoir in Włocławek, makes it impossible to retain water over the long term or to maintain the waterway by controlling the reservoir retention system. However, the early start of the boating season due to the shorter duration of ice phenomena is certainly positive. According to Grześ and Pawłowski (2012) [68], since the mid-19th century, the duration of ice phenomena at Toruń has shortened from about 100 days to 50 days and the duration of ice cover from 70 days to about 45 days. It should be noted that the waterway on the Vistula section from Włocławek to the mouth of the Gulf of Gdańsk does not currently meet the operational parameters specified in the regulations by cause of the waterway-limited depth in some places.

5.2. Possibilities for Future Improvement of Inland Navigation on the Lower Vistula

According to many authors, this problem can be solved by construction of the Lower Vistula cascade [35,40,69]. However, this process will be expensive and lengthy. The cost–benefit analysis of economic aspects regarding the Lower Vistula development showed that such an investment would be highly profitable [70]. An additional positive result will be that the improved transport accessibility and operating conditions for passengers and tourists, and also recreational shipping would represent an economic boom for the areas along the main shipping routes. In the opinion of Pieron et al. (2022) [69], the existing navigation conditions on the Vistula waterway section from Włocławek to the mouth of the Gulf of Gdańsk enable regular inland transport for vessels having drafts of less than 1.0–1.2 m (Table 2). The planned regulatory structures will allow the waterway depth to reach 2.8 m for average water levels. Flood safety will increase as hydrotechnical structures will be able to attenuate flood waves [17]. In the shorter term, inland transport can be improved by building intermodal ports along the waterway, so that goods can be reloaded to another type of transport (e.g., rail) in the event of unfavorable shipping conditions. Greater coordination of intermodal transport flows is needed. Decision-making and support tools can assist entities and stakeholders involved in intermodal operations [71]. This will improve the supply chain system and control over cargo flows [72]. The development of seaports in Gdańsk and Gdynia will undoubtedly be of great importance, as they will contribute to dynamic changes in other cities of the region [73]. The functions of a port are not restricted to the dedicated areas but constitute an interdisciplinary place that covers a wide spectrum, from the technical to the cultural aspects [74,75]. In addition to the transport of goods, inland navigation provides passenger transport, which is part of tourism offerings. The tourist and recreation offers are steadily expanding; new forms of water tourism are emerging to meet modern expectations.
The development of tourism navigation means that many local routes that do not meet the requirements of international or even local navigation are increasingly being used for recreational purposes, contributing to the socio-economic activation of the Polish regions. Wharfs and river marinas suited to small tourist vessels are being built, often as part of comprehensive revitalizations of waterside zones in cities. There is also an increasing interest in floating buildings for housing and gastronomy in Poland [76]. The extent of inland water use for tourist purposes depends on the meteorological conditions. Good weather increases interest in tourism and various tourist activities for city dwellers who spend their time actively. This is confirmed by the magnitude of lock use in the city center, as exemplified by the Miejska lock in Bydgoszcz [58].

6. Conclusions and Implications

In the years 2010–2021, there was a clear downward trend in the transport of goods by inland waterways in the European Union (EU-27), which was particularly visible in the time interval 2018–2021. The use of inland waterways in total transport (cargo and tourism) in Poland is of marginal importance, despite the conducive system of inland waterways.
During the period 1986–2020, there was a steady decline in the number of cargo vessels served by the only lock on the Lower Vistula, at Włocławek, especially noticeable in years with low water levels on the Vistula. Freight transport is carried out in local sections, mainly for construction materials (sand) and one-off deliveries of oversized loads. In the years 2016–2020, the number of tourist vessels passing through the lock in Włocławek in the summer months increased.
In recent years, the Polish administration agreed to reinvigorate inland waterway transportation and involve it in the European system, endorsing the European Agreement on Main Inland Waterways of International Importance (AGN), and taking into account the fact that inland waterway transportation is one of the cheapest and most environmentally friendly and sustainable transport practices.
The E40 and E70 international European waterways and the Lower Vistula cascade project will create a profit surplus over costs. Adapting the waterway on the Lower Vistula to the modern needs of shipping, freight handling and tourism, and the use of infrastructure for intermodal transport requires essential short- and long-term investments. The long-term investments should include developing the dams on the Lower Vistula, while short-term investments should consider the construction of intermodal ports along the Lower Vistula waterway. Regardless of the planned infrastructure improvements, it is reasonable to keep small, shallow-draft ships in operation that will be useful in low-water conditions.
From a broader perspective, it is necessary to consider the possibilities of national and international financial support for water transport, especially in urban areas which can relieve both road passenger and freight transport, and bring benefits linked to environmental protection (decreasing atmosphere pollution, climate change effects and noise congestion).
In areas located far from the city centers, it is advisable to determine the conditions of development, including area development, as well as the location of public purpose investments, with an emphasis on financing related to inland transport advancement and use. Covering the area with local plans will facilitate and accelerate investment processes but will also require integration and coordination of the authorities’ activities in the management of the watercourse and riverside areas at various administrative levels.

Author Contributions

Conceptualization, K.K.-W. and V.-M.M.; methodology, K.K.-W. and V.-M.M.; validation, K.K.-W.; formal analysis, K.K.-W.; investigation, K.K.-W. and V.-M.M.; resources, K.K.-W.; data curation, K.K.-W.; writing—original draft preparation, K.K.-W. and V.-M.M.; writing—review and editing, K.K.-W. and V.-M.M.; visualization, K.K.-W. and V.-M.M.; supervision, K.K.-W. and V.-M.M. All authors have read and agreed to the published version of the manuscript.

Funding

This research received no external funding.

Data Availability Statement

Publicly available hydrological data was obtained from https://danepubliczne.imgw.pl/. Data on lock operations is available from the corresponding author upon reasonable request.

Conflicts of Interest

The authors declare no conflicts of interest.

References

  1. Stefaniec, A.; Hosseini, K.; Xie, J.; Li, Y. Sustainability assessment of inland transportation in China: A triple bottom line-based network DEA approach. Transport. Res. Transp. Environ. 2020, 80, 102258. [Google Scholar] [CrossRef]
  2. Wang, Y.; Chen, X.; Borthwick, A.G.L.; Li, T.; Liu, H.; Yang, S.; Zheng, C.; Xu, J.; Ni, J. Sustainability of global Golden Inland Waterways. Nat. Commun. 2020, 11, 1553. [Google Scholar] [CrossRef] [PubMed]
  3. De Barros, B.R.C.; de Carvalho, E.B.; Brasil, A.C.P., Jr. Inland waterway transport and the 2030 agenda: Taxonomy of sustainability issues. Clean. Eng. Technol. 2022, 8, 100462. [Google Scholar] [CrossRef]
  4. Hunt, J.D.; Pokhrel, Y.; Chaudhari, S.; Mesquita, A.L.A.; Nascimento, A.; Filho, W.L.; Biato, M.F.; Schneider, P.S.; Lopes, M.A. Challenges and opportunities for a South America Waterway System. Clean. Eng. Technol. 2022, 11, 100575. [Google Scholar] [CrossRef]
  5. Manoiu, V.-M.; Craciun, A.-I.; Kubiak-Wójcicka, K.; Antonescu, M.; Olariu, B. An Eco-Study for a Feasible Project: “Torun and Its Vistula Stretch—An Important Green Navigation Spot on a Blue Inland Waterway”. Water 2022, 14, 3034. [Google Scholar] [CrossRef]
  6. Rolbiecki, R.; Wojewódzka-Król, K. Changes in the transport capacity of Polish inland waterways against the background of European waterway use for transport. Transp. Econ. Logist. 2019, 81, 154–164. [Google Scholar] [CrossRef]
  7. Miloslavskaya, S.; Plotnikova, E. Current situation and optimization of inland waterway infrastructure financing. Transp. Probl. 2018, 13, 51–63. [Google Scholar] [CrossRef]
  8. Caris, A.; Limbourg, S.; Macharis, C.; van Lier, T.; Cools, M. Integration of inland waterway transport in the intermodal supply chain: A taxonomy of research challenges. J. Transp. Geogr. 2014, 41, 126–136. [Google Scholar] [CrossRef]
  9. Tolliver, D.; Lu, P.; Benson, D. Comparing rail fuel efficiency with truck and waterway. Transp. Res. Part D Transp. Environ. 2013, 24, 69–75. [Google Scholar] [CrossRef]
  10. Jonkeren, O.; Piet, R.; Van Onnoren, J. Welfare effects of low water levels on the river Rhine through the Inland Waterway Transport Sector. J. Transp. Econ. Policy 2007, 41, 387–411. [Google Scholar]
  11. Smolnik, P. Assumption of state policy concerning inland waterways in Poland. Sci. J. Marit. Univ. Szczec. 2016, 47, 154–159. [Google Scholar] [CrossRef]
  12. Kozerska, M. Inland waterway transport in Poland—The current state and prospects for development. Sci. J. Marit. Univ. Szczec. 2016, 47, 136–140. [Google Scholar] [CrossRef]
  13. Wrzesiński, D.; Sobkowiak, L. Transformation of the Flow Regime of a Large Allochthonous River in Central Europe-An Example of the Vistula River in Poland. Water 2020, 12, 507. [Google Scholar] [CrossRef]
  14. Kundzewicz, Z.W.; Januchta-Szostak, A.; Nachlik, E.; Pińskwar, I.; Zaleski, J. Challenges for Flood Risk Reduction in Poland’s Changing Climate. Water 2023, 15, 2912. [Google Scholar] [CrossRef]
  15. Marcinkowski, P. Projections of Climate Change Impact on Stream Temperature: A National-Scale Assessment for Poland. Appl. Sci. 2024, 14, 10900. [Google Scholar] [CrossRef]
  16. Ghazi, B.; Salehi, H.; Przybylak, R.; Pospieszyńska, A. Projection of climate change impact on the occurrence of drought events in Poland. Sci. Rep. 2025, 15, 5609. [Google Scholar] [CrossRef]
  17. Kubiak-Wójcicka, K.; Pokropski, T. Natężenie ruchu żeglugowego na dolnej Wiśle na podstawie analizy śluzowań we Włocławku w latach 1997-2016 [Intensity of inland navigation on the lower Vistula River based on the analysis of lockage in Włocławek in the years 1997–2016]. Pr. Geogr. 2019, 156, 79–99. [Google Scholar] [CrossRef]
  18. Inland Waterway. 2023. Available online: https://transport.ec.europa.eu/transport-modes/inland-waterways_en (accessed on 5 May 2023).
  19. Inland Waterway Transport in Europe: No Significant Improvements in Modal Share and Navigability Conditions Since 2001. Special Report, 15. 2015. Available online: https://www.eca.europa.eu/Lists/ECADocuments/SR15_01/SR15_01_EN.pdf (accessed on 12 July 2023).
  20. Mako, P.; Galieriková, A. Inland navigation on the Danube and the Rhine waterways. 14th International scientific conference on sustainable, modern and safe transport. Transp. Res. Procedia 2021, 55, 10–17. [Google Scholar] [CrossRef]
  21. Manoiu, V.-M.; Craciun, A.-I. Danube river water quality trends: A qualitative review based on the open access web of science database. Ecohydrol. Hydrobiol. 2021, 21, 613–628. [Google Scholar] [CrossRef]
  22. Eurostat Data. 2023. Available online: https://ec.europa.eu/eurostat/statistics-explained/index.php?title=Inland_waterways_freight_transport_-_quarterly_and_annual_data (accessed on 16 November 2023).
  23. Informacje sygnalne. In Transport Wodny Śródlądowy w Polsce w 2020 roku [Inland Waterway Transport in Poland in 2020]; Główny Urząd Statystyczny: Warszawa, Poland, 2021.
  24. Rudnik, S. Ratification by Poland of the European Agreement on major inland waterways of international importance (AGN). Transp. Overv. Prz. Komun. 2017, 10, 54–60. [Google Scholar] [CrossRef]
  25. Niedzielskia, P.; Durajczykb, P.; Drop, N. Utilizing the RIS system to improve the efficiency of inland waterway transport companies. Procedia Comput. Sci. 2021, 192, 4853–4864. [Google Scholar] [CrossRef]
  26. Czaja, S.; Tutaj, J. Reasons for stagnation in river transport in Poland at the turn of the 20th and 21st centuries. Econ. Environ. 2024, 88, 622. [Google Scholar] [CrossRef]
  27. Inland Waterways Transport in Poland in 2024. News Releases 2025. Available online: https://stat.gov.pl/en/topics/transport-and-communications/transport/inland-waterways-transport-in-poland-in-2024,10,15.html (accessed on 23 October 2025).
  28. Woś, K. Plany rozwoju polskich śródlądowych dróg wodnych [Development plans for Polish inland waterways]. Probl. Transp. I Logistyki 2017, 1, 297–310. [Google Scholar] [CrossRef]
  29. Strategia Zrównoważonego Rozwoju Transportu do 2030 roku [Sustainable Transport Development Strategy Until 2030]. 2019. Available online: https://www.gov.pl/attachment/e268e9f9-d7ca-473e-a7b1-8731348155d9 (accessed on 17 October 2024).
  30. Kenc, J.; Szostak, E. Decarbonisation of Transport—A Challenge for Inland Navigation. Eur. Res. Stud. J. 2022, XXV, 625–635. [Google Scholar] [CrossRef]
  31. Durajczyk, P.; Drop, N. Possibilities of Using Inland Navigation to Improve Efficiency of Urban and Interurban Freight Transport with the Use of the River Information Services (RIS) System—Case Study. Energies 2021, 14, 7086. [Google Scholar] [CrossRef]
  32. Durajczyk, P.; Drop, N.; Maruszczak, M. Possibilities of Implementation of the System of Automatic Indication of Safe Clearance under the Bridge in Poland. Eur. Res. Stud. J. 2021, XXIV, 830–849. [Google Scholar] [CrossRef]
  33. Port Szczecin. 2023. Available online: https://www.port.szczecin.pl/biznes/glebokowodny-terminal-kontenerowy (accessed on 16 November 2023).
  34. Absalon, D. New inland waterways in heavily invested areas—Conditions and hazards. AIP Conf. Proc. 2019, 2186, 120002. [Google Scholar] [CrossRef]
  35. Biegowski, J.; Robakiewicz, M.; Woś, K.; Wrzosek, K. Sediment Transport Management Using the Planned Construction of the Lower Vistula Cascade as an Example. Energies 2022, 15, 1689. [Google Scholar] [CrossRef]
  36. Port Gdańsk. 2023. Available online: https://www.portgdansk.pl/biznes/informacje-ogolne/ (accessed on 17 November 2023).
  37. Breś, J.; Lorens, P. Shaping the New Vistula Spit Channel: Political, Economic, and Environmental Aspects. Urban Plan. 2023, 8, 275–288. [Google Scholar] [CrossRef]
  38. Kosiński, J.; Zdulski, W. Hydropower potential of the Vistula. Acta Energetica 2013, 2, 38–47. [Google Scholar] [CrossRef]
  39. Babiński, Z.; Habel, M. Hydromorphological conditions of the lower Vistula in the development of navigation and hydropower. Acta Energetica 2013, 2, 83–90. [Google Scholar] [CrossRef]
  40. Wrzosek, K.; Sobiesak, P.; Sikorski, G. Characteristic technical solutions of barrages planned on the Vistula River on the international E-40 waterway. Energetyka Wodna 2021, 3, 34–42. [Google Scholar]
  41. Kubrak, J.; Kiczko, A.; Kubrak, A. Case Study: Forecasting the Lower Vistula Bed Deformation without and with Development of Dam Cascade. Water 2021, 13, 2142. [Google Scholar] [CrossRef]
  42. Ankiersztejn, I. The Lower Vistula Cascade. Acta Energetica 2013, 3, 70–74. [Google Scholar] [CrossRef]
  43. Ministerstwo Infrastruktury [Ministry of Infrastructure]. 2023. Available online: https://www.gov.pl/web/infrastruktura/program-zagospodarowania-dolnej-wisly-przyjety-przez-rade-ministrow (accessed on 16 November 2023).
  44. Jokiel, P.; Tomalski, P. Zróżnicowanie i zmienność wieloletnia sezonowości przepływu w wybranych przekrojach wodowskazowych Wisły [Differentiation of river flow seasonality and its multiannual changeability in selected cross-sections on the Vistula river]. Pr. Geogr. 2018, 155, 27–45. [Google Scholar] [CrossRef]
  45. Wrzesiński, D.; Sobkowiak, L. Detection of changes in flow regime of rivers in Poland. J. Hydrol. Hydromech. 2018, 66, 55–64. [Google Scholar] [CrossRef]
  46. Regional Water Management Board in Gdańsk Data. Available online: https://www.gov.pl/web/wody-polskie-gdansk (accessed on 1 May 2023).
  47. Babiński, Z.; Grześ, M. Monografia Hydrologiczna Zbiornika Stopnia Wodnego Włocławek [Hydrological Monograph of Włocławek Reservoir]; Zeszyty IGiPZ PAN: Warszawa, Poland, 1995; p. 30. [Google Scholar]
  48. Institute of Meteorology and Water Management National Research Institute Data. Available online: https://danepubliczne.imgw.pl/ (accessed on 5 May 2023).
  49. Rozporządzenie Rady Ministrów z dnia 7 Maja 2002, r. w Sprawie Klasyfikacji Śródlądowych Dróg Wodnych [Regulation of the Council of Ministers of 7 May 2002 on the Classification of Inland Waterways]. Available online: https://isap.sejm.gov.pl/isap.nsf/DocDetails.xsp?id=wdu20020770695 (accessed on 1 July 2022).
  50. Central Statistical Office (CSO) Data. Available online: http://stat.gov.pl/obszary-tematyczne/transport-i-lacznosc/transport/transport-wodny-srodladowy-w-polsce-w-2016-roku,4,7.html (accessed on 18 April 2024).
  51. Regional Water Management Board in Warsaw Data. Available online: https://www.gov.pl/web/wody-polskie-warszawa (accessed on 1 May 2023).
  52. Yevjevich, V. An Objective Approach to Definition and Investigation of Continental Hydrological Droughts; Hydrology Paper, 23; Colorado State University: Fort Collins, CO, USA, 1967. [Google Scholar]
  53. Scholten, A.; Rothstein, B. Navigation on the Danube—Limitations by Low Water Levels and Their Impacts; JRC Technical Reports; European Commission: Brussels, Belgium, 2016; ISBN 978-92-79-64798-7. [Google Scholar] [CrossRef]
  54. Ionita, M.; Nagavciuc, V. Extreme Floods in the Eastern Part of Europe: Large-Scale Drivers and Associated Impacts. Water 2021, 13, 1122. [Google Scholar] [CrossRef]
  55. Schoeneich, M.; Habel, M.; Szatten, D. Limitation for Inland Ships in the Area of Planned Multimodal Port on Vistula River. TRansNav Int. J. Mar. Navig. Saf. Sea Transp. 2020, 14, 551–555. [Google Scholar] [CrossRef]
  56. Gorączko, M.; Kubiak-Wójcicka, K. Waterways in Poland: The history, present state and future. In Management of Water Resources in Poland; Zeleňáková, M., Kubiak-Wójcicka, K., Negm, A.M., Eds.; Springer Water: Cham, Germany, 2021; pp. 357–378. ISBN 978-3-030-61964-0. [Google Scholar] [CrossRef]
  57. Rozporządzenie Ministra Sportu i Turystyki z dnia 9 kwietnia 2013 roku w sprawie uprawiania turystyki wodnej [Regulation of the Minister of Sport and Tourism of April 9, 2013 on Practicing Water Tourism]. Available online: https://isap.sejm.gov.pl/isap.nsf/download.xsp/WDU20130000460/O/D20130460.pdf (accessed on 1 July 2022).
  58. Kubiak-Wójcicka, K. Water Tourism on the Example of the Brda River (Central Poland). In Proceedings of the Poprad Economic and Management Forum: Conference Proceedings from International Scientific Conference, Poprad, Slovak Republic, 17–18 October 2019; Madzík, P., Askarnia, M., Eds.; Verbum-Vydavatel’stvo Katolíckej Univerzity: Poprad, Slovakia, 2019; pp. 372–382. Available online: https://www.pemf-conference.com/wp-content/uploads/2022/04/PEMF_2019_Proceedings-1.pdf (accessed on 1 May 2023).
  59. Ionita, M.; Tallaksen, L.M.; Kingston, D.G.; Stagge, J.H.; Laaha, G.; Van Lanen, H.A.J.; Scholz, P.; Chelcea, S.M.; Haslinger, K. The European 2015 drought from a climatological perspective. Hydrol. Earth Syst. Sci. 2017, 21, 1397–1419. [Google Scholar] [CrossRef]
  60. Christodoulou, A.; Christidis, P.; Bisselink, B. Forecasting the impacts of climate change on inland waterways. Transp. Res. Part D Transp. Environ. 2020, 82, 102159. [Google Scholar] [CrossRef]
  61. Vinke, F.; van Koningsveld, M.; van Dorsser, C.; Baart, F.; van Gelder, P.; Vellinga, T. Cascading effects of sustained low water on inland shipping. Clim. Risk Manag. 2022, 35, 100400. [Google Scholar] [CrossRef]
  62. Beuthe, M.; Urbain, N.; Lingemann, I.; Ubbels, B. Climate change impacts on transport on the Rhine and Danube: A multimodal approach. Transp. Res. Part D Transp. Environ. 2014, 27, 6–11. [Google Scholar] [CrossRef]
  63. Szépszó, G.; Lingemann, I.; Klein, B.; Kovács, M. Impact of climate change on hydrological conditions of Rhine and Upper Danube rivers based on the results of regional climate and hydrological models. Nat. Hazards 2014, 72, 241–262. [Google Scholar] [CrossRef]
  64. Stahl, K.; Weiler, M.; Van Tiel, M.; Kohn, I.; Haensler, A.; Freudiger, D.; Seibert, J.; Moretti, G.; Gerlinger, K. Climate change impact on rain, snow and glacier melt components of streamflow for the river Rhine: Synthesis of a model experiment and relevance for water use. In Proceedings of the EGU General Assembly 2022, Vienna, Austria, 23–27 May 2022. EGU22-11271. [Google Scholar] [CrossRef]
  65. Kubiak-Wójcicka, K.; Bąk, B. Monitoring of meteorological and hydrological droughts in the Vistula basin (Poland). Environ. Monit. Assess 2018, 190, 691. [Google Scholar] [CrossRef]
  66. Piniewski, M.; Szcześniak, M.; Huang, S.; Kundzewicz, Z.W. Projections of runoff in the Vistula and the Odra river basins with the help of the SWAT model. Hydrol. Res. 2018, 49, 303–317. [Google Scholar] [CrossRef]
  67. Kubiak-Wójcicka, K. Variability of Air Temperature, Precipitation and Outflows in the Vistula Basin (Poland). Resources 2020, 9, 103. [Google Scholar] [CrossRef]
  68. Grześ, M.; Pawłowski, B. Hydromorfologiczne Uwarunkowania Lodołamania na Wiśle od Stopnia Wodnego we Włocławku do Ujścia, z Uwzględnieniem Sezonu Zimowego 2011/2012; Regionalny Zarząd Gospodarki Wodnej: Gdańsk, Poland, 2012. [Google Scholar]
  69. Pieron, Ł.; Woś, K.; Wrzosek, K. Water Reservoirs in Plans to Improve Navigability of the Lower Section of the Vistula. Water 2022, 14, 4042. [Google Scholar] [CrossRef]
  70. Woś, K.; Wrzosek, K.; Kolerski, T. The Energy Potential of the Lower Vistula River in the Context of the Adaptation of Polish Inland Waterways to the Standards of Routes of International Importance. Energies 2022, 15, 1711. [Google Scholar] [CrossRef]
  71. Macharis, C.; Caris, A.; Jourquin, B.; Pekin, E. A decision support framework for intermodal transport policy. Eur. Transp. Res. Rev. 2011, 3, 167–178. [Google Scholar] [CrossRef]
  72. Rožić, T.; Rogić, K.; Bajor, I. Research Trends of Inland Terminals: A Literature Review. Promet-Traffic Transp. 2016, 28, 539–548. [Google Scholar] [CrossRef]
  73. Krośnicka, K.A.; Lorens, P.; Michałowska, E. Port Cities within Port Regions: Shaping Complex Urban Environments in Gdańsk Bay, Poland. Urban Plan. 2021, 6, 27–42. [Google Scholar] [CrossRef]
  74. Hein, C. Port City Porosity: Boundaries, Flows, and Territories. Urban Plan. 2021, 6, 1–9. [Google Scholar] [CrossRef]
  75. Ramos, J.S. Materiality in the Seam Space: Sketches for a Transitional Port City Dome District. Urban Plan. 2021, 6, 210–222. [Google Scholar] [CrossRef]
  76. Piątek, Ł.; Wycisk, A.A.; Parzych, D.; Modrzejewska, K. Floating buildings in the hotel, catering and water tourism industry in Poland—Business environment survey. J. Water Land Dev. 2020, 45, 100–106. [Google Scholar] [CrossRef]
Figure 1. Waterways in Poland. Explanations: 1—class of waterway, 2—international waterway number, 3—names of channels, 4—hydrological stations, 5—crosscut. Data source: author map based on Transport wodny śródlądowy w Polsce w 2020/Inland waterway transport in Poland in 2020, 2021 [23].
Water 17 03190 g001
Figure 2. Study area. Explanations: (A)—Lower Vistula, (B)—Location of locks at the mouth of the Vistula and its branches, (C)—Location of locks on the territory of Bydgoszcz city. I—class of waterway, II—dams: a—existing, b—designed, III—rivers, IV—locks, V—crosscut. Data source: author map based on Regional Water Management Board in Gdańsk [46].
Water 17 03190 g002aWater 17 03190 g002b
Figure 3. Maximum, average and minimum water levels of the Vistula at the gauges in Toruń and Tczew in the years 1986–2020. Explanations: MHW—mean high water, MLW—mean low water. Data source: author interpretation based on data from the Institute of Meteorology and Water Management National Research Institute [48].
Water 17 03190 g003
Figure 4. Distribution of number of days per year of W0, W1, W2, W3, W4 and W5 water levels at Toruń and Tczew gauges on the Vistula, 1986–2020. Data source: author interpretation based on data from the Institute of Meteorology and Water Management National Research Institute [48].
Water 17 03190 g004
Figure 5. Distribution of the average number of days per month with Vistula water levels below characteristic levels at Toruń and Tczew, 1986–2020. Explanations: MLW—average low water, HLW—high low water, MAW—average water level in 1986–2020; 1—January, 2—February, 3—March, 4—April, 5—May, 6—June, 7—July, 8—August, 9—September 10—October, 11—November, 12—December. Data source: author interpretation based on data from the Institute of Meteorology and Water Management National Research Institute [48].
Water 17 03190 g005
Figure 6. Number of passenger seats and passenger ships used in inland navigation in 2001–2020. Data source: author interpretation based on data from the Central Statistical Office [50].
Water 17 03190 g006
Figure 7. Transport of cargo on inland waterways in Poland in million tons and in million ton-kilometers (TKM). Data source: author interpretation based on data from the Central Statistical Office [50].
Water 17 03190 g007
Figure 8. Number of cargo vessels passing through selected locks by month in 2018. Explanations: 1—January, 2—February, 3—March, 4—April, 5—May, 6—June, 7—July, 8—August, 9—September, 10—October, 11—November, 12—December. Data source: author interpretation based on data from the Regional Water Management Board in Gdańsk and Warsaw [46,51].
Water 17 03190 g008
Figure 9. Number of tourist vessels passing through selected locks by month in 2018. Explanations: 1—January, 2—February, 3—March, 4—April, 5—May, 6—June, 7—July, 8—August, 9—September, 10—October, 11—November, 12—December. Data source: author interpretation based on data from the Regional Water Management Board in Warsaw and Gdańsk and Warsaw [46,51].
Water 17 03190 g009
Figure 10. Passage of vessels through the Włocławek lock, in 1986–2020. (Data source: author interpretation based on data from the Regional Water Management Board in Warsaw [51]).
Water 17 03190 g010
Figure 11. Water levels of the Vistula in Toruń and the monthly average number of vessels served at Włocławek lock in 2010 and 2015. Explanations: 1—January, 2—February, 3—March, 4—April, 5—May, 6—June, 7—July, 8—August, 9—September, 10—October, 11—November, 12—December (Data source: author interpretation based on data from the Institute of Meteorology, Water Management National Research Institute [48] and Regional Water Management Board in Warsaw [51]).
Water 17 03190 g011
Table 1. Characteristics of hydrological stations on the Lower Vistula, in the years 1986–2020.
Hydrological StationKilometer of the River The Catchment Area (km2)Maximum Flow
(m3/s)
Average Flow
(m3/s)
Minimum Flow
(m3/s)
Warszawa Nadwilanówka504.184,6415740547157
Włocławek679.4171,7636540856160
Toruń734.7180,3916190911218
Tczew908.6193,8066360985266
Note(s): Data source: author table based on data from the Institute of Meteorology and Water Management National Research Institute [48].
Table 2. Operational parameters of inland waterways according to the Regulation of the Council of Ministers of 7 May 2002 on the Classification of Inland Waterways/Rozporządzenie Rady Ministrów z dnia 7 Maja 2002, r. w sprawie klasyfikacji śródlądowych dróg wodnych [49].
Operational ParametersParameter Values
ClassesIaIbIIIIIIVVaVb
Minimum dimensions of the navigable route in the river
- width of navigable route
- transit depth
- radius of arc of fairway axis
Units
m
m
m

15
1.2
100

20
1.6
200

30
1.8
300

40
1.8
500

40
2.8
650

50
2.8
650

50
2.8
800
Minimum channel dimensions
- width of navigable route
- smallest water depth in the channel
- radius of arc of fairway axis

m
m
m

12
1.5
150

18
2.0
250

25
2.2
400

35
2.5
600

40
3.5
650

45
3.5
650

45
3.5
800
Minimum dimensions of navigation locks
- lock width
- lock length
- depth at bottom sill

m
m
m

3.3
25
1.5

5.0
42
2.0

9.6
65
2.2

79.6
72
2.2

12.0
120
3.5

12.0
120
4.0

12.0
187
4.0
Table 3. Characteristic water levels of the Vistula at selected hydrological stations, in the years 1986–2020.
ParameterToruńTczew
Zero level of the hydrological station (m a.s.l.)31.96−0.58
Warning state (cm)530700
Emergency state (cm)650820
MHW (cm)585746
LHW (cm)391442
MAW (cm)284399
HLW (cm)226354
MLW (cm)161246
Note(s): Explanations: a.s.l.—above sea level; MHW—mean high water, LHW—low high water, MAW—mean of average water levels for the multiannual period 1986–2020, HLW—high low water, MLW—mean low water. Data source: author table based on data from the Institute of Meteorology and Water Management National Research Institute [48].
Disclaimer/Publisher’s Note: The statements, opinions and data contained in all publications are solely those of the individual author(s) and contributor(s) and not of MDPI and/or the editor(s). MDPI and/or the editor(s) disclaim responsibility for any injury to people or property resulting from any ideas, methods, instructions or products referred to in the content.