Abstract
Freshwater scarcity is a critical constraint on global agriculture, with arid regions such as Saudi Arabia facing acute challenges as farming consumes most of the available water. This study evaluated the performance of a dual-lateral subsurface drip irrigation (SDI) system using fresh and brackish water for potato and tomato production under hyper-arid conditions. Over three growing seasons, six irrigation strategies combining simultaneous and sequential operation of fresh and brackish water were tested in a factorial design. Results showed that irrigation water quality and operation mode significantly affected crop response. For potatoes, yield and water productivity were highest under simultaneous application, while brackish-dominated sequences reduced performance. Tomatoes exhibited higher salt tolerance, maintaining yield across treatments, though water productivity and footprint varied with operation sequence. Overall, dual-lateral SDI with concurrent operation demonstrated superior efficiency, reducing dependence on freshwater while sustaining crop yields. These findings highlight the potential of dual-lateral SDI as a sustainable irrigation strategy for water-scarce regions.
1. Introduction
Freshwater scarcity in the Middle East has increased despite the increase in demand in all sectors, especially the agricultural industry. Irrigation exhausts up to 90% of freshwater in Saudi Arabia, for example [1]. The only solution to the water crisis is to apply conservation techniques such as using new irrigation methods like drip irrigation, accompanied by automated water application that ensures minimal water consumption per unit yield. Subsurface drip irrigation (SDI) is a revolutionary development of surface drip irrigation. In addition to the inherited advantages from the surface drip irrigation, the SDI diminishes evaporation and surface runoff and eliminates many fungal diseases that do not find a suitable environment (the wet soil surface) available. One of the main benefits of SDI is that it can be used to apply low-quality water with no fear of its health hazards or bad odors, unlike traditional surface irrigation [2]. For all these benefits, Zoldoske [3] Considered that SDI will be the future of irrigation worldwide.
SDI is continuously developing in terms of methods and technologies. One of the promising developments is to place more than one lateral line per crop row. The multi-lateral applications include laterals that work sequentially to the right and the left of the crop row, which is known as partial root-zone drying (PRD) [4,5]. On the other hand, laterals can work simultaneously for multiple reasons. Ismail, Zien-El-Abedin [6] introduced the vertical alignment of drip laterals, proposing to improve the wetting pattern and increase the crop yield, which was confirmed by other studies [7,8,9]. These studies found that the dual-lateral SDI improved crop yield and quality, in addition to proven improvement of the wetting pattern through field experiments and simulations [10]. However, previous works used freshwater in both laterals that work simultaneously, while the system allows benefiting from its structure to alter the laterals’ work sequence and even the water quality in each lateral.
In the Kingdom of Saudi Arabia, irrigated agriculture deeply depends on groundwater [11,12]. However, most of the groundwater wells have brackish water of 1000–2000 ppm, which can be used for irrigation under some constraints [13]. One constraint is the method of water application, such as mixing fresh and brackish water, alternating between brackish and fresh sources, or applying pure brackish water if feasible [14,15]. Additionally, it is essential to select salt-tolerant crops and cultivate them in low-salinity soil to ensure that the total salinity in the root zone does not exceed the crop’s salt tolerance limit.
Several works investigated the application of brackish water in crop production [15,16,17,18,19,20,21,22]. They concluded that the application of brackish water through SDI is better than that through sprinkler irrigation for onion production [16], as the reduction in the crop yield through SDI is 50% less than its value by sprinkler irrigation. It has also been proven that sub-irrigation helps to overcome the limitations of using brackish water in arid regions [23]. They concluded that they could effectively grow potatoes under brackish water by sub-irrigation. All these works confirmed the possibility of irrigating crops with brackish water without much decrease in crop yield just by selecting the proper application system and the correct management practices, especially by applying the brackish water directly in the soil so as not to affect the leaves and the top layer of the root zone.
The mixed application of fresh and brackish water can be made by mixing the two water types in a tank before irrigation and then pumping the mixture through the irrigation laterals. However, through dual-lateral technology, the study can pump the two types of water individually directly into the soil. This saves the effort and time that was wasted in the pre-irrigation mixing process.
This work aims to develop a dual-SDI system to use brackish water in one of the lines and to try sequential and simultaneous operation of the two lines. This research also aims to assess the effect of different system settings on the crop yield of two vegetable crops (potato and tomato) through field experiments.
2. Methodology
In this work, the investigation aimed to test six treatments in addition to the control treatment. The treatments have examined the effect of sequential vs. simultaneous operation, the effect of using brackish water with freshwater, and the effect of the operation order of the sequential operation. The treatments are as follows:
A—Freshwater treatments:
- Single subsurface (Control treatment, CT);
- Dual-lateral simultaneous operation (FD);
- Dual-lateral sequential operation (the upper lateral then the lower, FU);
- Dual-lateral sequential operation (the lower lateral then the upper, FL).
B—Dual-lateral treatments with two water types: brackish in the lower and fresh in the upper:
- Dual-lateral simultaneous operation (BD);
- Dual-lateral sequential operation (the upper lateral then the lower, BU);
- Dual-lateral sequential operation (the lower lateral then the upper, BL).
2.1. Field Layout and Network Design
The field is in the educational farm of the College of Agriculture and Food Science of King Saud University, Riyadh, Saudi Arabia (24.7373 N, 46.6199 E) (Figure 1). Based on the Köppen climatic classification system, Riyadh Province generally falls within the hot desert climate (BWh) [24]. While winter temperatures can drop to almost freezing, the area suffers extreme heat; summer highs often top 45 °C [25]. Mostly occurring in the winter, annual precipitation is moderate [26]. Saudi Arabia is a suitable case study for this investigation because of the unique interaction among geographical, climatic, and demographic elements [27].
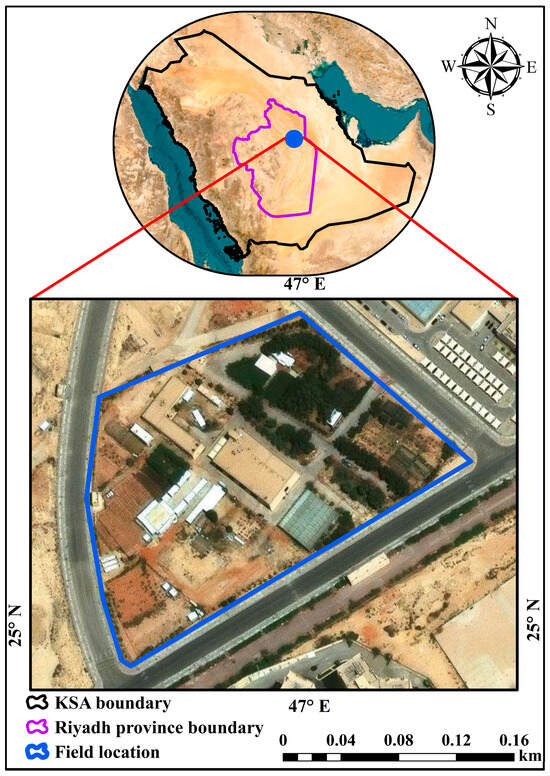
Figure 1.
Study area location map.
The investigation of climatic parameters in the study area was grounded in a reliable local climatic dataset obtained from the weather station located at the educational farm of King Saud University. This dataset, considered a dependable source, included comprehensive meteorological variables: air temperature (T), relative humidity (RH), wind speed at 2 m (U2), solar radiation (RS), and precipitation (P). The weather station recorded these parameters at a minute timestep for five years, providing a robust foundation for the current study. These five years of data were meticulously collected, organized, and prepared for analysis as one representative year.
The mentioned treatments were applied in a 35 × 25 m2 field, Figure 2. The land was split horizontally between two crops, and the treatments were randomly assigned to the sections of each half. Figure 3 depicts the field preparation. The experiment was fully automated to ensure the accuracy of timing using solenoid valves and Rainbird digital controllers, and the pipeline network was built flexibly to ease the random assignment of the treatments.
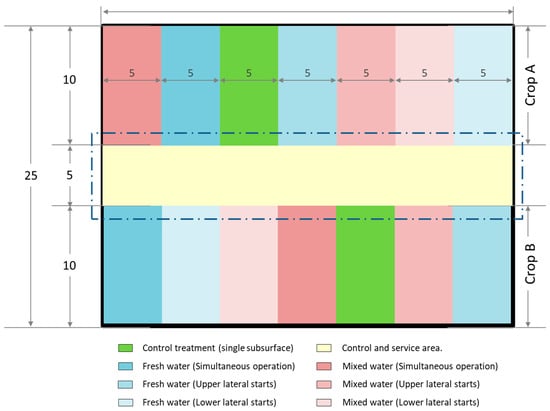
Figure 2.
Field Layout.
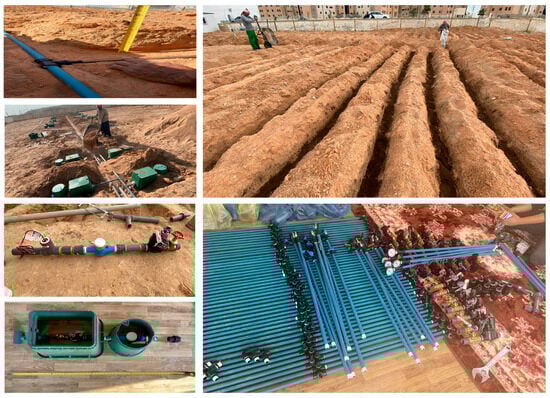
Figure 3.
Field Preparations.
Two main lines were laid in the middle of the field, one for the freshwater and one for the brackish water. For each group of laterals, the corresponding connections were implemented (Figure 4). Each group of laterals occupied a strip of 10 m length and 5 m width, with 4 crop rows: 1.2 m distance between each pair and 1.4 m between groups. The dual lateral treatments had the upper lateral buried at 15 cm depth and the lower lateral at 25 cm depth. The single lateral treatment lines were buried at 15 cm.
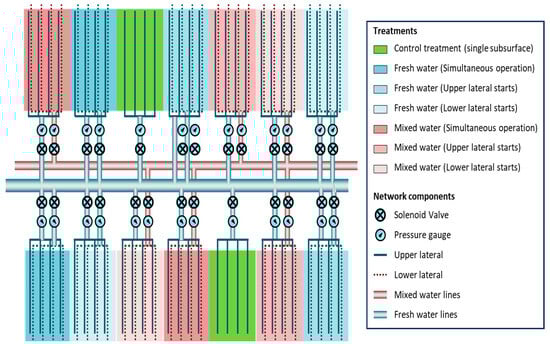
Figure 4.
Pipelines’ layout.
2.2. Cultivated Crops
Two crops were cultivated: tomatoes (Solanum lycopersicum) and potatoes (Solanum tuberosum), with each crop planted on one half of the field (as shown in Figure 2). The commercial tomato variety ‘Kilele F1’ was grown from seeds sown in seedling trays containing Jiffy-7 peat pellets (Moerdijk, The Netherlands). The seedlings were nurtured in a fiberglass greenhouse under controlled conditions, with temperatures maintained at 25 ± 1 °C during the day and 20 ± 1 °C at night. After four weeks, uniform seedlings with five true leaves were transplanted into the open field in rows measuring 10 m in length and 1 m in width with a plant spacing 50 cm. The selected potato variety, ‘Hermes’ (Hermes DDR 5158 × SW 163/55), was sourced from the NIVAP Company in the Netherlands. All necessary fertilization, cultural practices, and protection measures were applied uniformly to all treatments, following common recommendations for commercial production.
2.3. Soil Properties
The soil of this field was classified as sandy loam up to a depth of 60 cm. At the beginning of the experiment, soil samples were collected from 0–20 cm, 20–40 cm, and 40–60 cm depths. The samples were air-dried, gently crushed, sieved through a 2 mm sieve, and stored for chemical and physical analysis. Particle size distributions were determined according to the method of Gee and Bauder [28]. Soil pH and EC values were measured in a soil paste using a pH meter, as described by Thomas [29], and an EC meter, following the procedure outlined by Rhoades [30]. Calcium carbonate content was determined using a Calcimeter, according to Loppert and Suarez [31]. The concentrations of soluble cations and anions (Ca2+, Mg2+, Na+, K+, HCO3−, CO32−, Cl−, and SO42−) were measured using the methods described by Nelson and Sommers [32]. Finally, the soil organic matter content was determined following the procedure of Nelson and Sommers [32]. The soil properties are listed in Table 1.

Table 1.
Soil Physicochemical Properties at Different Depths in the Experimental Field.
2.4. Irrigation Design and Scheduling
Two types of water sources were utilized in this study for irrigation purposes. Freshwater was supplied through municipal desalinated water, which is treated to remove salt and impurities. Brackish water, characterized by its higher salinity levels, was obtained from a local groundwater well in Riyadh, KSA. The distinct chemical compositions of these sources are presented in Table 2. For all plots in the subsurface drip network, the research applied the following parameters: the main lateral line is buried 15 cm below the soil surface, with 4 L/h built-in emitters ≅33 cm apart (3 emitters/m) (Rhein dripper line, pressure compensating, clogging resistance, Saudi drip, K.S.A). For the dual-lateral plots (H1), an additional lateral line is buried 10 cm below the main lateral line (25 cm below the soil surface); the scheduled amount of water is divided equally between the two laterals.
Table 2.
Chemical Composition of used Fresh and Brackish water.
2.5. Soil-Water Measures
To track soil-water dynamics, this study deployed EnviroSCAN probes, each equipped with five TriSCAN sensors from Sentek Technologies, Australia. These probes were installed centrally in each of the fourteen treatment plots to monitor two crops across seven treatment regimes, facilitating continuous water content assessment. The sensor arrays were positioned at depths of 10, 20, 30, 40, and 60 cm. Data collection was conducted biweekly using a handheld data logger, complemented by a meticulous calibration procedure as outlined in ElNesr, Alazba [33]. Readings were logged every 30 min throughout the study period.
2.6. Crop-Water Measures
To qualify the irrigation process, the current work measured the irrigation water use efficiency (WUE, kg/m3), which is the ratio of crop yield to the applied irrigation water, Equation (1), [34].
where n: number of replicates (rows) per treatment; r: counter; Yr: yield of the row (kg); War: applied water to each row (m3/row). Additionally, the present study calculated the water footprint of potatoes and tomatoes (L/kg), which was introduced by Allan [35], Equation (2). The water footprint determination was obtained from Mekonnen and Hoekstra [36].
where FCr: fruit count per replicate.
2.7. Pre- and Post-Harvest Measures
In the 8th to 10th week of cultivation, this study took three random plant samples from each treatment (each treatment has 5 rows) to evaluate the growth indicators. The work measured each sample’s length, counted its number of primary branches, and weighed each of its parts separately; leaves, stems, and fruits (if any), and evaluated the water content in each of these parts. The water content evaluation was performed by taking about 100 g of each part (stem, leaves, fruit) then dried it at 70 °C oven for 3–5 days (till no weight loss occur between two subsequent weighs); finally, the water content percent was calculated as “[(Initial weight − dry weight)/dry weight] × 100”.
After about 90 days of cultivation for tomatoes and ~120 days for potatoes, the harvest process starts. Potatoes are harvested in one day, while tomatoes harvest is spread over 4 to 5 harvests. For each harvest, each row of the 35 crop rows was weighed individually, and the fruits of each row were counted.
The following measures were taken for the total yield of each crop:
- Total yield (kg);
- Yield of each line (kg);
- Avg. yield per plant (g/plant);
- Water footprint (L/Kg);
- Water productivity (kg/m3);
- Plants count;
- Germination percent.
While the following measures were taken for the plant samples:
- Plant height (cm);
- Green mass (g);
- Branches count;
- Fruits total weight (g);
- Fruits dry weight (g);
- Fruits moisture content (%);
- Leaves total weight (g);
- Leaves dry weight (g);
- Leaves moisture content (%);
- All fruits count (#);
- All fruits weight (kg);
- Avg. fruit weight (g/fruit).
- The following for tomatoes only:
- ○
- Large fruits count (#);
- ○
- Large fruits total weight (kg);
- ○
- Avg. large fruit weight (g/fruit);
- ○
- Small fruits count (#);
- ○
- Small fruits total weight (kg);
- ○
- Avg. small fruit weight (g/fruit).
2.8. Statistical Analysis
In this experiment, the investigation had two main treatments: the salinity of the water in the bottom line and the sequence of operating the two lateral lines. The first treatment had two levels: fresh and saline water (referred to as Salinity 0 and Salinity 1, respectively). The second treatment had three levels: simultaneous operation, the upper lateral followed by the lower lateral, and the lower lateral followed by the upper lateral (referred to as Sequence 0, 1, and −1, respectively). The statistical design used was a two-factor factorial design with blocks, where the blocks were the three seasons. It is important to note that the control treatment was not included in this design because it involved a single lateral line. To compare the treatments to the control, the current investigation performed another randomized complete block design, where the seasons served as the blocks and the combined treatments mentioned above were randomly distributed within these blocks. The treatments compared were CT, FD, FU, FL, BD, BU, and BL, as described earlier. This study used the software Statistix 10.0 and Excel 365 to perform the analysis.
3. Results and Discussion
3.1. Climatic Parameters Characterization
The climatic profile of Riyadh reflects a hyper-arid regime characterized by extreme thermal load, low humidity, and highly episodic rainfall (Figure 5). Air temperature averaged 26.1 °C, with extremes from 6.4 °C (February) to 39.8 °C (July). Heat stress was substantial, with 72 days ≥35 °C and 9 days ≥38 °C, conditions that significantly elevate evapotranspiration and crop water demand. Relative humidity averaged 30.6%, but fell below 20% on 102 days, intensifying atmospheric water deficit and accelerating soil water content depletion.
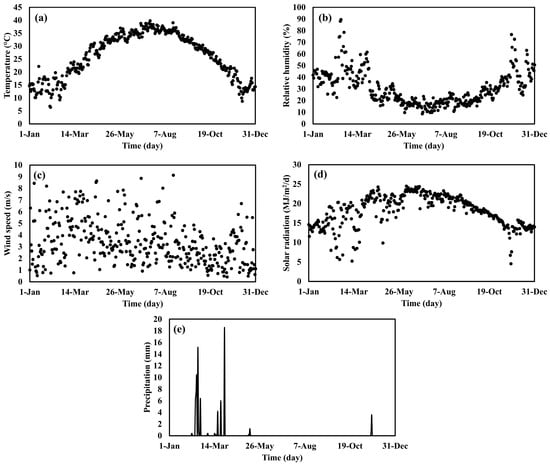
Figure 5.
Climatic parameters in the study area, where (a): temperature, (b): relative humidity, (c): wind speed, (d): solar radiation, (e): precipitation.
Wind speeds (mean 3.4 m/s, peaks > 9 m/s) combined with high solar radiation (18.1 MJ/m2/day) amplify evaporative losses, challenging irrigation efficiency. Rainfall totaled only 83.2 mm, concentrated in February and March (~93% of the annual total), followed by a 194-day dry spell. This extreme rainfall seasonality necessitates reliance on stored water or desalination for agriculture, as natural recharge is minimal and highly irregular. For agriculture, these conditions demand deficit irrigation strategies, drought-tolerant cultivars, and protected cultivation systems to mitigate heat and vapor pressure deficits. Water management must prioritize aquifer protection, treated wastewater reuse or brackish water, and precision irrigation (e.g., drip systems with soil moisture sensors) to minimize losses.
As this study employs many factors, the discussion will focus on the measures that have a significant effect on one or more of the treatments. Starting with the single effects in the next section, this section will discuss the transactions between the two treatments and compare them to the control in the following section.
3.2. Single Effect of the Treatments
The single effects results explore the independent impacts of water salinity and application sequence on both field-level and sample-level measures for potatoes and tomatoes. By isolating these factors, the discussion gains valuable insights into their individual contributions to crop productivity, resource efficiency, and plant characteristics. The single effects are shown in Table 3.
Table 3.
Single effects of the two treatments.
3.2.1. Potatoes (Field-Level Measures)
Field-level measures are the measures that were evaluated on the whole crop after harvest. The field measures for potatoes showed significant effects of both water salinity and application sequence for several attributes. Notably, the Average yield per plant, Table 3, was significantly higher under freshwater treatments (944.91 g/plant) than mixed water treatments (840.69 g/plant, α = 1%). Among application sequences, the simultaneous operation produced the highest yield per plant (949.66 g/plant), significantly surpassing the lower-lateral-first sequence (819.32 g/plant, α = 5%), while the upper-lateral-first sequence (909.42 g/plant) was intermediate. Also, the total yield (kg) (Figure 6) followed a similar trend, with freshwater treatments producing higher yields (17.01 kg) compared to mixed water treatments (15.13 kg, α = 1%). Simultaneous operation achieved the highest yield (17.09 kg), which was significantly greater than the lower-lateral-first sequence (14.75 kg, α = 5%), while the upper-lateral-first sequence (16.37 kg) was intermediate as well, as noted in Figure 7.
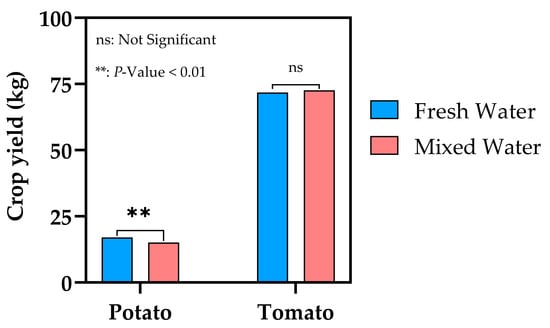
Figure 6.
Effect of irrigation water type on potato and tomato crop yield.
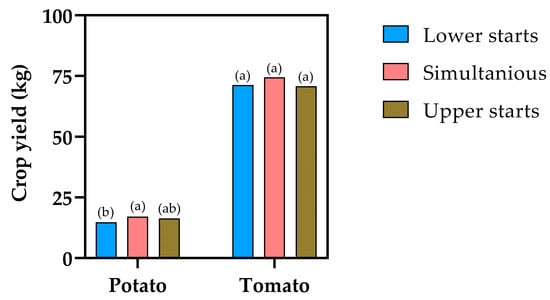
Figure 7.
Effect of application sequence on potato and tomato crop yield. Means with the same letter are not significantly different from each other.
For water productivity (Figure 8), freshwater treatments were more efficient (5.64 kg/m3) than mixed water treatments (4.98 kg/m3, α = 5%). However, no significant differences were observed between application sequences, as noted in Figure 9.
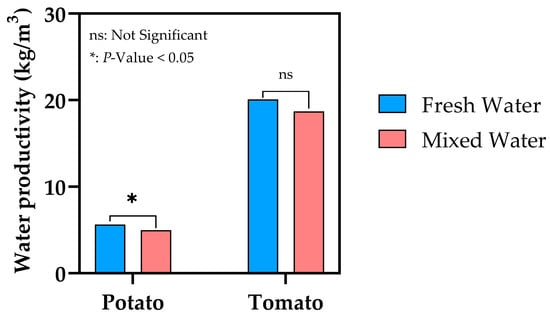
Figure 8.
Effect of irrigation water type on potato and tomato water productivity.
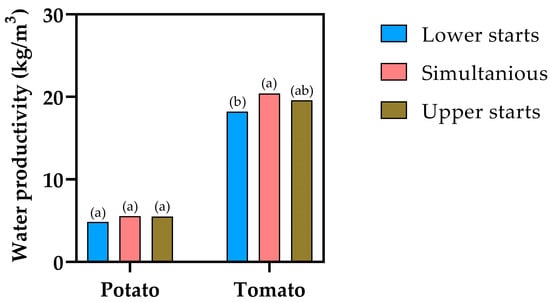
Figure 9.
Effect of application sequence on potato and tomato water productivity. Means with the same letter are not significantly different from each other.
Meanwhile, measures such as germination percent, plant count, water footprint, and yield of each line were consistent across treatments and sequences without statistical significance. These stable parameters indicate that the effects of single treatments on these attributes are minimal at the field level.
3.2.2. Potatoes (Sample Plant Measures)
Sample plant measures are the measures that were evaluated on sample plants before harvest. This analysis helps to understand variability at a smaller scale. For potato sample plants, significant differences were observed across several measures. Starting with the fruits’ dry weight, which was higher under freshwater treatments (45.34 g) compared to mixed water treatments (35.35 g, α = 5%). Among application sequences, the simultaneous operation resulted in the highest fruit dry weight (49.98 g), significantly surpassing the lower-lateral-first sequence (33.80 g, α = 1%), while the upper-lateral-first sequence (37.25 g) was intermediate. For plant height, it was significantly greater under freshwater treatments (50.72 cm) than mixed water treatments (42.65 cm, α = 5%). Simultaneous operation produced the tallest plants (55.91 cm), significantly higher than the other sequences (43.28 cm for lower-lateral and 40.86 cm for upper-lateral, α = 1%). The total fruit count of the sample plants was significantly higher under freshwater treatments (6.04 fruits) compared to mixed water treatments (4.11 fruits, α = 1%). Application sequence effects were non-significant, with values ranging from 4.61 to 5.89 fruits. Similarly, the total fruit weight was significantly greater under freshwater treatments (1.24 kg) than mixed water treatments (0.94 kg, α = 5%). Among application sequences, simultaneous operation yielded the highest weight (1.35 kg), significantly greater than the lower-lateral-first sequence (0.87 kg, α = 5%), with the upper-lateral-first sequence (1.06 kg) being intermediate.
On the other hand, the average fruit weight of the sample plants showed an inverse trend, with mixed water treatments producing heavier fruits (186.86 g) compared to freshwater treatments (150.17 g, α = 5%). However, no significant differences were observed between application sequences. The sample plants’ green mass was higher under freshwater treatments (520.39 g) than mixed water treatments (382.84 g, α = 5%). Application sequences showed no significant differences, although simultaneous operation resulted in the highest green mass (547.87 g). Other sample plants’ measures, such as branch count, fruit moisture content, and leaf-related measures, showed no significant differences between treatments. These findings suggest that these plant-specific parameters remain relatively stable under varying salinity levels and application sequences.
3.2.3. Tomatoes (Field-Level Measures)
For tomatoes, field-level measures demonstrate notable effects of treatments. The germination percent was significantly higher under freshwater treatments (91%) compared to mixed water treatments (85%, α = 1%). Simultaneous operation achieved the highest germination rate (93%), significantly exceeding the lower-lateral-first sequence (82%, α = 1%), with the upper-lateral-first sequence (89%) being intermediate. Consequently, the surviving plant count was significantly higher under freshwater treatments (16.38 plants) compared to mixed water treatments (15.24 plants, α = 1%). Simultaneous operation resulted in the highest count (16.73 plants), significantly surpassing the lower-lateral-first sequence (14.73 plants, α = 1%).
Moving to water productivity (Figure 8), it was noticed that freshwater treatments were higher (20.08 kg/m3) compared to mixed water treatments (18.72 kg/m3, NS). Application sequences showed significant differences, with simultaneous operation achieving the highest productivity (20.41 kg/m3), significantly greater than the lower-lateral-first sequence (18.21 kg/m3, α = 5%), while the upper-lateral-first sequence (19.58 kg/m3) was intermediate, as depicted in Figure 9. Water footprint (Figure 10) was significantly lower for freshwater treatments (66.58 L/kg) than mixed water treatments (73.74 L/kg, α = 5%). Simultaneous operation (Figure 11) had the lowest footprint (58.00 L/kg), significantly better than the lower-lateral-first sequence (79.97 L/kg, α = 1%).
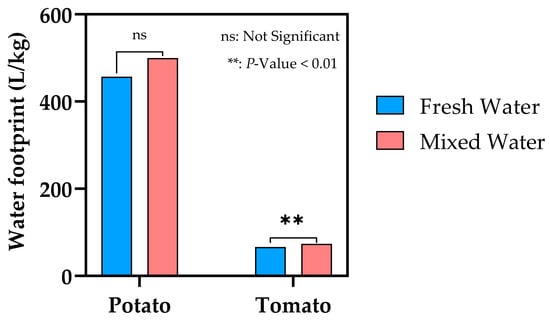
Figure 10.
Effect of water type on potato and tomato water footprint.
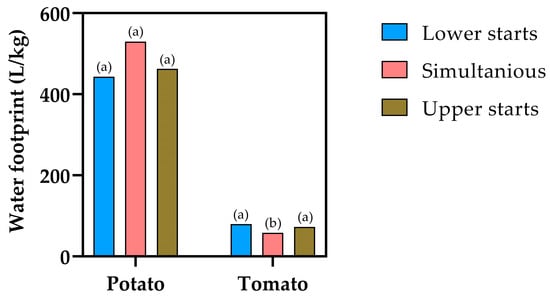
Figure 11.
Effect of application sequence on potato and tomato water footprint. Means with the same letter are not significantly different from each other.
For the tomato yield of each line (kg), there were no significant differences between freshwater (64.77 kg) and mixed water treatments (60.60 kg). However, the application sequence had a significant impact at α = 1%. The simultaneous operation achieved the highest yield of 68.45 kg, which was significantly greater than the lower-lateral-first sequence (57.65 kg). The upper-lateral-first sequence (61.96 kg) was intermediate and not significantly different from the others. In addition, the yield measures (total yield and average yield per plant) showed consistent patterns across treatments with no statistical significance. This stability suggests that these field-scale parameters are less sensitive to single treatment factors.
3.2.4. Tomatoes (Sample Plant Measures)
Sample plant measures for tomatoes revealed significant differences in many attributes. Plant height was significantly taller under freshwater treatments (88.76 cm) than mixed water treatments (67.43 cm, α = 1%). Simultaneous operation yielded the tallest plants (93.02 cm), significantly surpassing both the lower-lateral-first sequence (77.02 cm) and upper-lateral-first sequence (64.24 cm, α = 1%). Similarly, the sample plant’s fruit weight was higher under freshwater treatments (5.38 kg) compared to mixed water treatments (4.99 kg, NS). Simultaneous operation produced the highest weight (6.37 kg), significantly greater than the lower-lateral-first sequence (4.99 kg, α = 1%), with the upper-lateral-first sequence (4.20 kg) being the lowest. Unlike the plant height, the green mass showed no significant difference between water salinity treatments, but simultaneous operation produced significantly higher values (2.43 g) compared to the upper-lateral-first sequence (1.82 g, α = 1%).
The large fruit count was significantly higher under freshwater treatments (47.07) than mixed water treatments (41.48, NS). Simultaneous operation produced the highest count (56.44), significantly greater than the lower-lateral-first sequence (40.78) and upper-lateral-first sequence (35.61, α = 1%). On the other hand, the findings found no significant differences for large fruits’ weight (kg) between freshwater (3.46 kg) and mixed water treatments (3.06 kg). However, the application sequence had a significant effect at α = 1%. Simultaneous operation produced the highest large fruits total weight (4.34 kg), significantly greater than the lower-lateral-first sequence (3.00 kg) and the upper-lateral-first sequence (2.45 kg).
For the sample plant’s fruits’ dry weight, it was significantly higher under freshwater treatments (3.94 g) than mixed water treatments (3.38 g, α = 5%). However, application sequences showed no significant differences. Similarly, the fruits’ total weight (g) showed a significant effect of the water salinity at α = 5%, with freshwater treatments (98.29 g) yielding significantly higher total weight than mixed water treatments (88.32 g), and no significant differences were observed between application sequences.
On the contrary, the fruits count (#) showed no significant effect of water salinity, while the application sequence effects were significant at α = 5%. Simultaneous operation yielded the highest count (99.83 fruits), significantly surpassing the lower-lateral-first sequence (84.00 fruits) and the upper-lateral-first sequence (72.89 fruits). Similar to the fruits count, the average fruit weight (g/fruit) followed the same trends, that no significant effect of the water salinity, and a significant effect at α = 5% of the application sequence; the simultaneous operation also resulted in the highest average fruit weight (61.90 g), which was significantly greater than the upper-lateral-first sequence (53.99 g), while the lower-lateral-first sequence (58.47 g) was intermediate. The branches count showed similar results, where only the application sequence effects were significant at α = 5%. Simultaneous operation resulted in the highest branch count (8.06), which was significantly greater than the lower-lateral-first sequence (6.67), while the upper-lateral-first sequence (6.56) was the lowest.
Finally, the freshwater treatments (22.86 g) produced significantly higher leaf dry weight than mixed water treatments (20.19 g, α = 5%). Application sequences showed no significant differences. Nevertheless, the water salinity had no significant effect on the leaves’ moisture content (%). While the application sequence effects were significant at α = 5%. The lower-lateral-first sequence had the highest leaf moisture content (76.33%), significantly greater than the upper-lateral-first sequence (72.36%), while simultaneous operation (74.91%) was intermediate. Meanwhile, the remaining measures, such as the count and weight of small fruits and the total weight of leaves, show consistent trends across treatments with no significant effects on any of the treatments.
The key findings from the data concerning yield and water productivity are in the context of the study’s primary objective: water conservation. This work focused on studying the impact of different treatments on potato and tomato yields across three seasons, with a particular emphasis on comparing the effectiveness of various irrigation methods.
When examining the potato yield (Figure 6), the present findings demonstrate that both water salinity and irrigation application sequence exert significant and independent effects on potato yield. The decline in yield under mixed (fresh + brackish) water compared with freshwater irrigation confirms the salt sensitivity of potato, a crop widely reported to suffer reductions in growth and tuber formation under elevated salinity conditions [37]. The observed yield gap between freshwater and mixed water treatments can be attributed to osmotic stress and possible ion toxicity, both of which reduce water uptake, impair nutrient absorption, and ultimately limit biomass accumulation, as concluded by Chourasia, Lal [38]. These results reinforce earlier evidence that even partial reliance on brackish water can significantly compromise the performance of salt-sensitive crops, despite the potential water-saving benefits.
In addition to water quality, the mode of applying irrigation water through the dual-lateral system also influenced yield outcomes (Figure 7). Simultaneous operation of both laterals produced the highest yields, significantly outperforming the lower-first sequence, while the upper-first sequence resulted in intermediate performance. These differences may be explained by the interaction between water distribution patterns and salt dynamics in the root zone. When the lower lateral was applied first, brackish water likely moved upward toward the active root zone, increasing salt exposure early in the irrigation cycle and reducing plant performance as reported by Sanwal, Kumar [39]. By contrast, when the upper lateral was initiated first with freshwater, salts may have been pushed downward, partially protecting the root zone from immediate stress. Nevertheless, the most favorable outcome occurred under simultaneous operation, where the mixing of fresh and brackish streams created a more uniform wetting front and diluted salt concentrations in the rhizosphere.
Taken together, these results highlight that the adverse effect of water salinity on potato yield can be partially mitigated by careful management of irrigation sequencing. While the use of brackish water inevitably reduces yield potential, simultaneous operation of dual laterals emerges as a promising strategy to minimize salt accumulation in the active root zone and sustain crop performance. These insights have important implications for regions facing freshwater scarcity, where dual-lateral systems could enhance the feasibility of using marginal-quality water without causing severe yield restrictions.
On the other hand, the lack of significant yield response in tomato to either water salinity (Figure 6) or irrigation sequence (Figure 7) contrasts sharply with the sensitivity observed in potato. This difference reflects inherent physiological and morphological traits: tomato possesses a higher salt tolerance threshold, greater osmotic adjustment capacity, and a more extensive root system that enables it to avoid or compensate for localized salt stress. Consequently, tomatoes can maintain yield stability even when brackish water is included in irrigation, provided salinity levels remain within its tolerance range.
Furthermore, the absence of significant differences among irrigation sequences suggests that salt distribution dynamics were not critical to tomato performance under the experimental conditions. Although simultaneous operation produced the numerically highest yield, the differences were not statistically meaningful, implying that tomato growth was resilient to variations in water distribution. This resilience contrasts with potato, where improper sequencing (lower-first) exacerbated salt stress and reduced yields.
Overall, the results highlight a key crop-specific distinction: while dual-lateral systems with brackish water require careful management for potatoes to minimize salinity impacts, tomatoes can be irrigated with more flexibility. For tomato production systems in water-scarce regions, this finding suggests that the inclusion of brackish water in dual-lateral irrigation does not compromise yield, offering greater scope for sustainable water resource utilization.
Regarding water productivity, a crucial metric in the present study, it revealed interesting patterns across the different seasons. The findings show that water salinity is a decisive factor governing potato water productivity, as depicted in Figure 8, whereas the sequence of water application does not significantly influence water productivity under the tested conditions (Figure 9). The reduction in water productivity under mixed (fresh + brackish) irrigation aligns with earlier studies that reported declines in irrigation water use efficiency under saline conditions due to reduced crop growth and yield per unit of applied water [40].
Interestingly, while application sequence significantly affected yield in potato (with simultaneous irrigation being superior), these differences did not manifest in water productivity. This indicates that the yield advantage achieved by adjusting irrigation sequencing was not large enough, relative to water applied, to significantly alter water productivity values. The water volumes used across treatments were comparable, suggesting that water productivity was mainly constrained by the physiological restrictions of salinity rather than the hydrodynamic effects of water distribution.
Overall, these results underline the central role of water quality in sustaining high water productivity in salt-sensitive crops such as potato. Even with advanced irrigation strategies, the use of brackish water undermines water productivity due to inherent yield losses. While dual-lateral sequencing can optimize yield outcomes, particularly under simultaneous operation, its contribution to improving water productivity appears limited compared with the overriding impact of water salinity.
Examining water productivity in tomato cultivation revealed interesting insights. The tomato results highlight a contrasting response pattern compared with the potato. As shown in Figure 8, water salinity had no significant impact on tomato water productivity, confirming that tomato is more tolerant to salinity and can sustain efficient water use under mixed irrigation regimes. This aligns with earlier reports that tomato, being moderately salt-tolerant, can maintain productivity and water use efficiency within moderate salinity ranges [41].
By contrast, irrigation sequence significantly influenced water productivity as depicted in Figure 9. The lower water productivity observed under lower-first operation likely resulted from salt displacement into the active root zone, which reduced plant efficiency despite similar volumes of applied water. Simultaneous irrigation emerged as the most effective strategy, yielding the highest water productivity values, as it promotes balanced root-zone wetting and salt dilution. These results are consistent with findings from dual-lateral and blended irrigation studies, which emphasize the role of water application strategies in modifying root-zone salinity distribution and plant response [42,43].
Overall, tomato water productivity was determined more by how water was applied (sequencing) than by water quality. This resilience suggests that dual-lateral irrigation systems using brackish water can be managed flexibly for tomato, provided that simultaneous operation is prioritized to maximize efficiency.
Finally, with the water footprint, unlike crop yield and water productivity, where significant impacts of water salinity were observed, as shown in Figure 10 and Figure 11, the potato water footprint showed no statistically significant variation due to either water quality or irrigation sequence. The slightly higher water footprint under mixed water indicates that brackish irrigation tends to reduce efficiency by requiring more water per kilogram of yield, but the magnitude of this effect was insufficient to reach significance. This outcome may reflect the compensatory balance between water use and yield reduction: although mixed water reduced yield, the applied irrigation volumes were similar, resulting in modest differences in water footprint.
Similarly, the absence of significant sequence effects suggests that irrigation timing and lateral operation strategies, which influenced yield patterns, did not translate into strong differences in water footprint. Since water footprint is calculated as the ratio of applied water to harvested output, modest yield shifts do not necessarily cause large changes in water footprint unless accompanied by major differences in irrigation input.
These results imply that, for potatoes, water footprint is a relatively stable indicator compared with yield and water productivity, being less sensitive to management practices under moderate salinity levels. However, the numerical trends suggest that reliance on mixed water may still raise the water footprint, which, over time, could signal less sustainable use of scarce water resources.
For tomatoes, the results demonstrate that both water quality (Figure 10) and irrigation sequence (Figure 11) significantly affect the water footprint of tomato production. The higher water footprint under mixed irrigation indicates that salinity reduces the efficiency of water use by lowering yield per unit of water applied. Although tomatoes are considered moderately salt-tolerant, these results show that efficiency restrictions still occur when brackish water is introduced. This aligns with earlier reports that salinity stress increases water demand per unit yield even in crops with moderate tolerance [44].
Irrigation sequence, however, exerted an even stronger influence on water footprint. The superior performance of simultaneous irrigation highlights the importance of uniform wetting and dilution of salts in the rhizosphere. By distributing fresh and brackish water together, simultaneous operation minimized localized salinity buildup and enhanced root-zone conditions, resulting in a markedly lower water footprint. In contrast, the poor performance of the lower-first sequence underscores the risk of exposing roots to brackish water early in the irrigation cycle, which increases salt stress and reduces water-use efficiency. These findings are consistent with studies emphasizing that irrigation strategies can strongly influence the spatial dynamics of salts and crop response [45].
Overall, the tomato water footprint is determined by the combined effects of water salinity and irrigation sequence. While fresh water remains the most efficient option, management practices such as simultaneous operation can substantially reduce the water footprint even when brackish water is included. These results provide practical guidance for improving water-use sustainability in tomato production under conditions of limited freshwater availability.
3.3. Analysis of the Interactions Between Treatments
The interaction between the two treatments (two levels of salinity and three sequence levels) was described earlier. In the following paragraphs will discuss the six interactions in comparison to the control treatment.
3.3.1. Potatoes (Field-Level Measures)
The field-level measures for potatoes (Table 4) provide a broad perspective on how treatments influence overall crop productivity and efficiency. Key indicators such as yield, water use, and plant population metrics were analyzed to understand the combined impact of water salinity and application sequence. For the average yield per plant (g/plant), the control treatment (CT) had the highest average yield per plant (1013.76 g/plant), which was statistically comparable to fresh water with simultaneous application treatment, FD (950.09 g/plant), fresh upper, FU (980.68 g/plant), and mixed simultaneous, BD (949.22 g/plant). The fresh lower, FL, (903.95 g/plant) and the mixed simultaneous, BU, (838.17 g/plant) were intermediate, while the mixed lower treatment, BL, had the lowest yield (734.68 g/plant), which was significantly lower than CT (α = 1%).
Table 4.
Statistical results show all treatments, including control.
Similarly, as depicted in Figure 12, the total Yield (kg) followed the same trends, where the CT treatment produced the highest yield (18.25 kg), statistically similar to FD (17.10 kg), FU (17.65 kg), and BD (17.09 kg). On the other hand, FL (16.27 kg) and BU (15.09 kg) were intermediate, while BL (13.22 kg) was significantly lower than the first group (CT, FD, FU, and BD) at α = 1%.
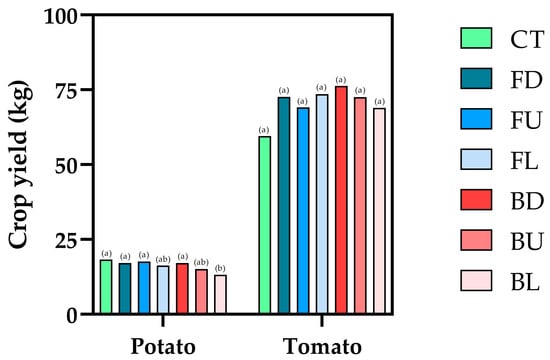
Figure 12.
Interaction effect of water quality and application sequence on potato and tomato crop yield. Means with the same letter are not significantly different from each other.
For the water footprint (L/kg), the FD had the highest (worst) water footprint (576.58 L/kg), significantly greater than CT (441.04 L/kg) at α = 5%. FU recorded the lowest (best) footprint (365.56 L/kg), which was significantly better than CT. Other treatments, including FL, BL, BD, and BU, showed no significant differences from all the treatments except FU as Figure 13 depicts. Meanwhile, non-significant measures (Table 4), including germination percent, plant count, yield of each line, and water productivity (Figure 14), demonstrate consistent trends across treatments without significant variations.
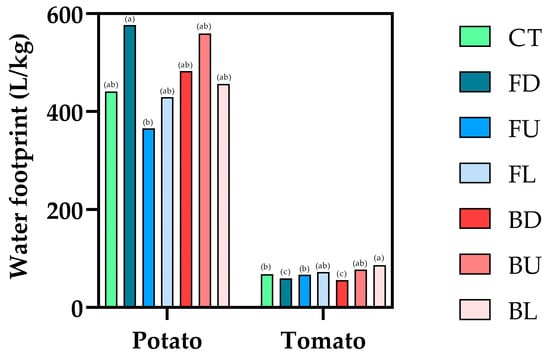
Figure 13.
Interaction effect of water quality and application sequence on potato and tomato water footprint. Means with the same letter are not significantly different from each other.
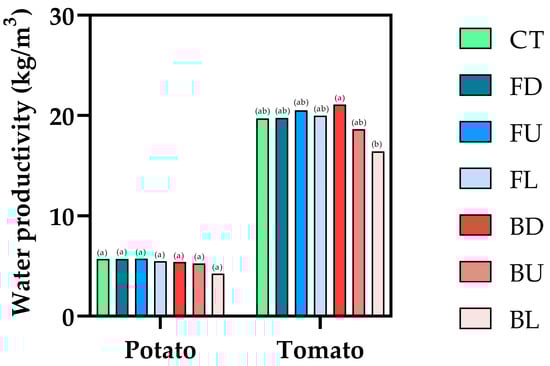
Figure 14.
Interaction effect of water quality and application sequence on potato and tomato water productivity. Means with the same letter are not significantly different from each other.
3.3.2. Potatoes (Sample Plant Measures)
The sample-level measures for potatoes focus on detailed plant-level attributes, including fruit weight, plant height, and biomass. These metrics are essential for evaluating the localized effects of treatments on individual plant performance.
Starting with the fruits (tubers) count, FD produced the highest tubers count per plant (7.89), significantly greater than CT (4.00 fruits, α = 1%). FL (5.44 fruits) and FU (4.78 fruits) were intermediate, while BL, BD, and BU had lower counts. The tubers’ total weight per plant followed the same trends, where FD achieved the highest weight (1.87 kg), significantly exceeding CT (1.11 kg, α = 1%). All other treatments (FL, FU, BL, BD, BU) were statistically like CT. Similar trends were also achieved for the tubers’ dry weight, where FD recorded the highest fruits dry weight (63.46 g), significantly greater than CT (40.29 g, α = 1%). All other treatments had dry weights between 32.60 g and 39.96 g, showing no significant difference from CT. Correspondingly, the plant’s green mass also followed the same trends: FD had the highest green mass (715.10 g), significantly greater than CT (387.21 g, α = 1%). FL (451.08 g) was intermediate, while other treatments were comparable to CT. Nevertheless, the weight of the plants’ leaves and the plant height also followed similar patterns. For the leaves mass, FD had the highest leaves total weight (86.16 g), significantly surpassing CT (42.74 g, α = 1%). FL (64.78 g), BL (63.69 g), and BU (63.79 g) were intermediate, while FU and BD were comparable to CT. FD also produced the tallest plants (66.05 cm), significantly taller than CT (44.21 cm, α = 1%). All other treatments had plant heights ranging from 38.25 cm to 45.77 cm, showing no significant difference from CT. Similarly, FD produced the highest total tubers weight (258.68 g), significantly greater than CT (184.03 g, α = 5%). All other treatments were intermediate, with no significant differences from CT.
On the other hand, some measures show variable trends. For instance, CT produced the heaviest fruits (213.42 g), significantly greater than FL (119.91 g, α = 5%). FD (167.37 g), FU (163.22 g), and BU (189.82 g) were intermediate, while BL and BD were statistically like CT. For the Branches Count, FL treatment (3.00 branches) was significantly greater than CT (1.44 branches, α = 5%). All other treatments were statistically like CT, with values ranging from 1.78 to 2.56 branches. Finally, for the leaves’ moisture content (%), BL had the highest leaves moisture content (59.68%), significantly greater than CT (53.88%, α = 5%). Other treatments, including FL, FD, FU, BD, and BU, were intermediate and not significantly different from CT. The tubers’ moisture content showed no significant difference between any of the studied treatments.
3.3.3. Tomatoes (Field-Level Measures)
Field-level measures for tomatoes highlight the treatment effects on overall crop output and resource use efficiency. Measures such as germination, plant count, and water use efficiency were analyzed to assess treatment impacts on field-scale productivity.
Starting with the germination percent, CT achieved the highest germination rate (94.44%), statistically comparable to FD (92.22%), FU (94.07%), and BD (93.70%). BL (77.04%) and BU (83.33%) were significantly lower than CT (α = 1%). The plants count per line showed the same pattern: CT (17.00 plants) was statistically similar to FD (16.60), FU (16.93), and BD (16.87). BL (13.87 plants) and BU (15.00 plants) were significantly lower than CT (α = 1%).
On the other hand, the water footprint, water productivity, and the yield of each line followed different patterns. BD (56.33 L/kg) had the lowest footprint, significantly better than CT (68.30 L/kg, α = 1%). FD (59.67 L/kg) was also significantly lower than CT, while BL had the highest footprint (86.95 L/kg), significantly greater than CT. For the yield of each line, BD produced the highest yield per line (70.59 kg), significantly greater than CT (56.19 kg, α = 1%). FL (63.14 kg), FD (66.31 kg), and FU (64.86 kg) were intermediate, while BL (52.16 kg) was significantly lower than CT. Meanwhile, measures like yield and average yield per plant display consistent results with no significant differences across treatments.
3.3.4. Tomatoes (Sample Plant Measures)
The sample-level analysis for tomatoes highlights the detailed effects of treatments on plant growth and fruit characteristics. Several measures showed significant interactions between treatments, particularly in fruit weights, counts, and plant attributes. FD treatment produced the best attributes in general, significantly greater than CT, as detailed below.
For the fruit weights (kg/sample plant), FD produced the highest of all fruit weights (6.52 kg), which was significantly greater than CT (3.83 kg, α = 5%). FL (5.50 kg), BD (6.22 kg), and FU (4.13 kg) were intermediate, while BL (4.48 kg) and BU (4.27 kg) were comparable to CT. similarly, the average fruit weight (g/fruit), FD produced the heaviest fruits (65.13 g), significantly greater than CT (42.34 g, α = 1%). FU (51.32 g), BL (56.82 g), and BD (58.67 g) were intermediate, while FL (60.12 g) was also significantly greater than CT. For the fruits’ total weight (g), FD also achieved the highest fruits’ total weight (106.81 g), significantly greater than CT (82.66 g, α = 5%). FL (98.61 g) was intermediate, while other treatments (FU, BL, BD, BU) were not significantly different from CT.
By splitting the tomato fruits into large and small, then evaluating the results, this study found that for the large fruits’ total weight (kg), FD achieved the highest total weight (4.51 kg), significantly greater than CT (1.76 kg, α = 1%). FL (3.46 kg), BD (4.16 kg), and FU (2.40 kg) were intermediate. The large fruits count followed the same trend, as FD had the highest large fruits count (58.67), significantly surpassing CT (31.89, α = 5%). FL (44.56) and BD (54.22) were intermediate, while FU (38.00), BL (37.00), and BU (33.22) were statistically similar to CT. On the contrary, the small fruits’ total weight was not significantly affected by any of the treatments. With the opposite trend, the avg. small fruit weight (g/fruit) significantly affected by the FD treatment, while the avg. large fruit weight was insignificantly affected by any treatment. Finally, the plant stem and leaves were also slightly affected by the treatments. While the green mass and the leaves’ dry weight showed a significant difference, other measures like branches count, leaves’ total weight, and leaves’ moisture content showed no significant differences across treatments.
Regarding the interaction effect of water quality and operation sequence on crop yield (Figure 12), the results clearly demonstrate that potato yield is shaped by a strong interaction between irrigation water quality and lateral operation sequence. With fresh water, yield restrictions from sequencing are small, showing that potatoes respond relatively stable under non-saline conditions. With brackish water, however, the choice of sequencing becomes critical. Simultaneous irrigation (BD) sustained yields equal to freshwater dual treatments, proving its buffering effect against salinity. In contrast, lower-first (BL) significantly reduced yield, highlighting the risks of salt accumulation in the rhizosphere when brackish water is applied from below. These findings are consistent with previous studies showing that soil salinity distribution within the root zone strongly depends on irrigation strategy [42,43]. For salt-sensitive crops like potato, irrigation management can therefore be as important as water quality in determining yield outcomes.
Unlike potato, where the interaction between salinity and irrigation sequence was decisive, tomato yield showed remarkable stability across all treatments (Figure 12). Neither the use of brackish water nor the sequencing of lateral operation significantly influenced yield. Instead, the introduction of dual-lateral irrigation itself enhanced performance compared with single-line control, most likely due to improved soil moisture distribution and root-zone environment. The fact that brackish treatments (BD, BU, BL) performed as well as, or even slightly better than, freshwater treatments demonstrate that tomato can be cultivated efficiently under mixed water regimes without yield loss. This tolerance is advantageous in water-scarce environments, where freshwater is limited, and supports the feasibility of integrating brackish water into tomato irrigation strategies.
For water footprint (Figure 13), the interaction analysis reveals that while both salinity and irrigation sequence influence the water footprint of potato, their effects differ depending on water type. Freshwater irrigation showed clear sequencing effects: upper-first (FU) minimized water footprint and improved water use efficiency, whereas simultaneous (FD) maximized water footprint, indicating inefficient water use. Under brackish irrigation, the water footprint remained within a narrower range, though upper-first (BU) tended toward a higher water footprint, suggesting that sequencing fresh before brackish does not provide the same advantage as pure freshwater. Importantly, the results show that dual-lateral irrigation with freshwater can be optimized through sequencing, particularly by initiating irrigation in the upper lateral. With brackish water, however, efficiency gains are harder to realize, likely due to overriding salinity effects.
For tomato, the results reveal a clear interaction between salinity and irrigation sequence in shaping the tomato water footprint. While freshwater applications produced relatively consistent water footprint values, brackish water amplified sequencing effects dramatically. The lowest water footprint (BD) occurred under brackish simultaneous irrigation, indicating that properly managed brackish water can even outperform freshwater irrigation in efficient terms. Conversely, the highest water footprint (BL) emerged when brackish water was applied first from the lower lateral, demonstrating how mismanagement of sequencing can negate the potential benefits of dual-lateral systems. These findings suggest that in tomato production, dual-lateral irrigation with brackish water is not only feasible but can be highly efficient when operated simultaneously. However, the system is also vulnerable: lower-first brackish irrigation should be strictly avoided, as it severely increases the water footprint, reducing sustainability.
Regarding water productivity for potatoes (Figure 14), although the statistical test showed no significant interaction, the numerical patterns highlight important agronomic insights. Freshwater irrigation ensures stable water productivity across sequences. However, when brackish water is introduced, sequence choice becomes decisive. The markedly lower water productivity under BL (4.26 kg/m3) suggests that starting with brackish water from the lower lateral enhances salt intrusion into the root zone, reducing both yield and water use efficiency. Thus, while dual-lateral systems can maintain high water productivity under fresh or mixed water, simultaneous operation is the most reliable approach under brackish conditions, and lower-first should be avoided to prevent water productivity restrictions.
Finally, with tomato water productivity (Figure 14), the results highlight a clear interaction: while fresh water ensures stable water productivity regardless of sequencing, using brackish water makes irrigation sequence a critical management factor. Simultaneous operation emerges as the most efficient strategy, achieving even higher water productivity than all freshwater treatments. In contrast, lower-first brackish irrigation significantly reduced water productivity, showing that sequencing can determine whether brackish water becomes an opportunity or a liability in tomato production. These findings are consistent with tomato’s moderate salt tolerance, which allows it to perform well under mixed irrigation if salinity is managed spatially within the root zone. However, they also demonstrate the risks of poor sequencing (BL), where salts accumulate near active roots, undermining water use efficiency.
3.4. Practical Implications
The results emphasize dual-lateral SDI as an effective and scalable approach for agriculture in arid environments. The technique diminishes reliance on freshwater and increases productivity by allowing the direct utilization of brackish water without yielding penalties, especially during simultaneous operation. Tomato yields were consistent across varying salt levels, whereas potato yields necessitated meticulous sequencing, highlighting the significance of crop-specific management. In addition to conserving water and enhancing crop performance, the system’s capacity to regulate soil temperature during peak summer also bolsters resistance in hot, arid conditions. Collectively, these benefits establish dual-lateral SDI as a revolutionary method to enhance agricultural adaptability to climate change and promote enduring food and water security.
3.5. Limitations and Future Directions
Despite the strong performance of dual-lateral SDI under hyper-arid conditions, several limitations must be considered. Field trials were conducted in a single environment and may not fully reflect the diversity of soils, water qualities, and crop species across other regions. The long-term consequences of sustained brackish water use—particularly gradual salinization, shifts in soil microbial dynamics, and potential impacts on nutrient cycling—remain unresolved and call for multi-year monitoring. In addition, higher installation costs and system complexity could restrict adoption among smallholder farmers. Potential solutions include (i) integrating soil salinity monitoring sensors for adaptive irrigation scheduling, (ii) combining dual-lateral SDI with salt-tolerant crop varieties, and (iii) promoting public–private partnerships to subsidize installation costs and build local manufacturing capacity, thereby reducing expenses.
Future research should extend these findings through multi-year trials that capture cumulative soil and crop responses to brackish irrigation across diverse agroecosystems. Expanding crop selection to include both salt-sensitive and salt-tolerant species will clarify the breadth of the system’s applicability. Integrating real-time monitoring technologies, such as soil moisture and salinity sensors, could enable adaptive, data-driven irrigation management and further improve resource efficiency. Equally important are economic assessments at farm and regional scales to quantify cost–benefit trade-offs and guide policy and investment decisions. Finally, exploring synergies between dual-lateral SDI and complementary practices—such as deficit irrigation, soil amendments, or renewable-powered pumping systems—may unlock even greater water savings and improve the resilience of agricultural systems in hyper-arid environments.
4. Conclusions
Water scarcity is a global challenge, and the Kingdom has recognized the importance of adopting innovative approaches to address it effectively. This study focuses on water conservation and the utilization of brackish water, in alignment with the Kingdom’s strategic objectives. These strategies not only conserve water but also reduce pressure on freshwater resources, thereby contributing to the long-term sustainability of national water supplies. The primary objective of this work is to introduce and implement advanced technologies that optimize water use while promoting the integration of brackish water alongside freshwater. By leveraging state-of-the-art techniques, this study aimed to address water scarcity challenges and support the sustainable management of this critical resource.
A key feature of the present study is the application of dual-lateral subsurface drip irrigation (SDI) technology for brackish water use in irrigation. This method reduces reliance on energy-intensive and costly desalination processes by directly incorporating brackish water into agricultural production. The sequential operation of dual laterals also facilitates salt flushing and improves root-zone soil conditions. Findings from this study demonstrate the promise of dual-lateral SDI as a viable technology to enhance yield and water productivity. Notably, FD consistently outperformed CT in most measures for both crops, including yield, plant height, and fruit weight. FL and FU showed marginal differences from CT in most parameters but did not significantly outperform in key areas. BL often resulted in lower values compared to CT, particularly in yield and green mass. BD demonstrated competitive performance in tomatoes but showed no significant advantage over CT in potatoes. BU treatments were generally comparable to CT but did not offer significant improvements. Distinct seasonal yield responses highlight the importance of considering seasonality in crop production. Notably, the “upper start” dual-lateral configuration showed superior performance during summer, likely due to a topsoil cooling effect before subsequent irrigation from the lower lateral.
Beyond agronomic performance, the adoption of dual-lateral SDI has clear economic and sustainability implications. It opens new avenues for private-sector investment in local manufacturing, reduces the cost burden of desalination, and aligns directly with global sustainability frameworks, including SDG 6: Clean Water and Sanitation. By promoting innovative water-saving technologies and sustainable practices, this study addresses both local water challenges and the global effort to secure clean water access. Scaling this approach may require multi-year, multi-crop evaluations, economic feasibility analyses, and integration with complementary practices such as deficit irrigation and renewable-powered pumping. Nonetheless, the evidence presented here positions dual-lateral SDI as a transformative technology capable of enhancing food security, conserving scarce water resources, and strengthening resilience in some of the world’s most water-limited regions.
Author Contributions
Conceptualization, A.A.A., M.N.E., F.R., N.A. and M.E.; data curation, A.A.A., M.N.E., F.R., N.A. and M.E.; formal analysis, A.A.A., M.N.E., F.R., N.A. and M.E.; investigation, A.A.A., M.N.E., F.R., N.A. and M.E.; methodology, A.A.A., M.N.E., F.R., N.A. and M.E.; project administration, A.A.A.; software, A.A.A., M.N.E., F.R., N.A. and M.E.; supervision, A.A.A.; validation, A.A.A., M.N.E., F.R., N.A. and M.E.; visualization, A.A.A., M.N.E., F.R., N.A. and M.E.; writing—original draft, A.A.A., M.N.E., F.R., N.A. and M.E.; writing—review and editing, A.A.A., M.N.E., F.R., N.A. and M.E. All authors have read and agreed to the published version of the manuscript.
Funding
This project was funded by the National Plan for Science, Technology and Innovation (MAARIFAH), King Abdulaziz City for Science and Technology, Kingdom of Saudi Arabia, award number (WAT539) and the APC was funded by (MAARIFAH).
Data Availability Statement
The data can be provided by the appropriate author upon reasonable request.
Acknowledgments
This project was funded by the National Plan for Science, Technology and Innovation (MAARIFAH), King Abdulaziz City for Science and Technology, Kingdom of Saudi Arabia, Award Number (WAT539).
Conflicts of Interest
The authors declare no conflict of interest.
References
- Faruqui, N.I.; Biswas, A.K.; Bino, M.J. Water Management in Islam; IDRC: Ottawa, ON, Canada, 2001. [Google Scholar]
- Alazba, A.A.; Mattar, M.A.; El-Shafei, A.; Radwan, F.; Ezzeldin, M.; Alrdyan, N. Comparative Analysis of ANN, GEP, and Water Advance Power Function for Predicting Infiltrated Water Volume in Furrow of Permeable Surface. Water 2025, 17, 1304. [Google Scholar] [CrossRef]
- Zoldoske, D.F. Subsurface Drip Irrigation: The Future of Irrigation is Underground; The Western Chestnut Grower Association, Inc.: Ridgefield, WA, USA, 2000; Volume 3, pp. 6–7. [Google Scholar]
- Hutton, R.; Loveys, B. A partial root zone drying irrigation strategy for citrus—Effects on water use efficiency and fruit characteristics. Agric. Water Manag. 2011, 98, 1485–1496. [Google Scholar] [CrossRef]
- Ahmadi, S.H.; Agharezaee, M.; Kamgar-Haghighi, A.A.; Sepaskhah, A.R. Effects of dynamic and static deficit and partial root zone drying irrigation strategies on yield, tuber sizes distribution, and water productivity of two field grown potato cultivars. Agric. Water Manag. 2014, 134, 126–136. [Google Scholar] [CrossRef]
- Ismail, S.; Zien-El-Abedin, T.; Wassif, M.; Elnesr, M.N. Physical and hydraulic barriers under surface and subsurface drip irrigation systems. Misr J. Agr. Eng. Res. MSAE 2006, 23, 1001–1016. [Google Scholar]
- Awady, M.N.; Wassif, M.A.; Abd-El-Salam, M.F.; El-Farrah, M.A. Moisture distribution from subsurface dripping using saline water in sandy soil. In Proceedings of the 15th Annual Conference of the Misr Society of Agricultural Engineering, Cairo, Egypt, 12–13 March 2008. [Google Scholar]
- Elnesr, M.N.; Alazba, A.A. The effects of three techniques that change the wetting patterns over subsurface drip-irrigated potatoes. Span. J. Agric. Res. 2015, 13, e1204. [Google Scholar] [CrossRef]
- Elnesr, M.N.; Alazba, A.A.; El-Abedein, A.I.Z.; El-Adl, M.M. Evaluating the effect of three water management techniques on tomato crop. PLoS ONE 2015, 10, e0129796. [Google Scholar] [CrossRef]
- El-Nesr, M.N.; Alazba, A.A.; Šimůnek, J. HYDRUS simulations of the effects of dual-drip subsurface irrigation and a physical barrier on water movement and solute transport in soils. Irrig. Sci. 2014, 32, 111–125. [Google Scholar] [CrossRef]
- Alsharhan, A.; Rizk, Z.; Nairn, A.; Bakhit, D.; Alhajari, S. Hydrogeology of an Arid Region: The Arabian Gulf and Adjoining Areas; Elsevier: Amsterdam, The Netherlands, 2001. [Google Scholar]
- Ouda, O.K. Towards assessment of Saudi Arabia public awareness of water shortage problem. Resour. Environ. 2013, 3, 10–13. [Google Scholar]
- Ashraf, M.; Rahmatullah, R.; Gill, M.A. Irrigation of crops with brackish water using organic amendments. Pak. J. Agric. Sci. 2005, 42, 33–37. [Google Scholar]
- Slama, F.; Zemni, N.; Bouksila, F.; De Mascellis, R.; Bouhlila, R. Modelling the impact on root water uptake and solute return flow of different drip irrigation regimes with brackish water. Water 2019, 11, 425. [Google Scholar] [CrossRef]
- Zhang, Y.; Li, X.; Šimůnek, J.; Shi, H.; Chen, N.; Hu, Q. Optimizing drip irrigation with alternate use of fresh and brackish waters by analyzing salt stress: The experimental and simulation approaches. Soil Tillage Res. 2022, 219, 105355. [Google Scholar] [CrossRef]
- Pasternak, D.; De Malach, Y.; Borovic, I. Irrigation with brackish water under desert conditions I. Problems and solutions in production of onions (Allium cepa L.). Agric. Water Manag. 1984, 9, 225–235. [Google Scholar] [CrossRef]
- Mantell, A.; Frenkel, H.; Meiri, A. Drip irrigation of cotton with saline-sodic water. Irrig. Sci. 1985, 6, 95–106. [Google Scholar] [CrossRef]
- Pasternak, D.; De Malach, Y.; Borovic, I.; Twersky, M. Irrigation with brackish water under desert conditions III. Methods for achieving good germination under sprinkler irrigation with brackish water. Agric. Water Manag. 1985, 10, 335–341. [Google Scholar] [CrossRef]
- Meiri, A.; Lauter, D.J.; Sharabani, N. Shoot growth and fruit development of muskmelon under saline and non-saline soil water deficit. Irrig. Sci. 1995, 16, 15–21. [Google Scholar] [CrossRef]
- Saqib. Agro-Sciences: A Sustainable Use of Brackish Water for Cropping. In: Agro-Sciences. 2010. Available online: https://agro-sciences.blogspot.com/2010/07/sustainable-use-of-brackish-water-for.html (accessed on 25 August 2025).
- Zhang, Y.; Li, X.; Šimůnek, J.; Shi, H.; Chen, N.; Hu, Q.; Tian, T. Evaluating soil salt dynamics in a field drip-irrigated with brackish water and leached with freshwater during different crop growth stages. Agric. Water Manag. 2021, 244, 106601. [Google Scholar] [CrossRef]
- Wang, Y.; Xiao, Y.; Puig-Bargués, J.; Zhou, B.; Liu, Z.; Muhammad, T.; Liang, H.; Maitusong, M.; Wang, Z.; Li, Y. Assessment of water quality ions in brackish water on drip irrigation system performance applied in saline areas. Agric. Water Manag. 2023, 289, 108544. [Google Scholar] [CrossRef]
- Patel, R.; Prasher, S.; Donnelly, D.; Bonnell, R.; Broughton, R. Subirrigation with brackish water for vegetable production in arid regions. Bioresour. Technol. 1999, 70, 33–37. [Google Scholar] [CrossRef]
- Alazba, A.A.; Mosad, A.; Geli, H.M.E.; El-Shafei, A.; Ezzeldin, M.; Alrdyan, N.; Radwan, F. Transboundary Urban Basin Analysis Using GIS and RST for Water Sustainability in Arid Regions. Water 2025, 17, 1463. [Google Scholar] [CrossRef]
- Alazba, A.A.; Mattar, M.A.; El-Shafei, A.; Ezzeldin, M.; Radwan, F.; Alrdyan, N. Water Demand Determination for Landscape Using WUCOLS and LIMP Mathematical Models. Water 2025, 17, 1429. [Google Scholar] [CrossRef]
- Alazba, A.A.; Mattar, M.A.; El-Shafei, A.; Radwan, F.; Ezzeldin, M.; Alrdyan, N. Daily Reference Evapotranspiration Derived from Hourly Timestep Using Different Forms of Penman–Monteith Model in Arid Climates. Water 2025, 17, 2272. [Google Scholar] [CrossRef]
- Ezzeldin, M.; Alazba, A.A.; Alrdyan, N.; Radwan, F. Rationalizing Irrigation Water Consumption in Arid Climates Based on Multicomponent Landscape Coefficient Approach. Earth Syst. Environ. 2025, 9, 277–298. [Google Scholar] [CrossRef]
- Gee, G.W.; Bauder, J.W. Particle-size analysis. In Methods of Soil Analysis: Part 1 Physical Mineralogical Methods; American Society of Agronomy: Madison, WI, USA, 1986; Volume 5, pp. 383–411. [Google Scholar]
- Thomas, G.W. Soil pH and soil acidity. In Methods of Soil Analysis: Part 3 Chemical Methods; American Society of Agronomy: Madison, WI, USA, 1996; Volume 5, pp. 475–490. [Google Scholar]
- Rhoades, J. Salinity: Electrical conductivity and total dissolved solids. In Methods of Soil Analysis: Part 3 Chemical Methods; American Society of Agronomy: Madison, WI, USA, 1996; Volume 5, pp. 417–435. [Google Scholar]
- Loppert, R.H.; Suarez, M. Carbonate and Gypsum. In Methods of Soil Analysis. Part 3; Sparks, D.L., Ed.; American Society of Agronomy: Madison, WI, USA, 1996; Volume 3. [Google Scholar]
- Nelson, D.W.; Sommers, L.E. Total carbon, organic carbon, and organic matter. In Methods of Soil Analysis: Part 3 Chemical Methods; American Society of Agronomy: Madison, WI, USA, 1996; Volume 5, pp. 961–1010. [Google Scholar]
- ElNesr, M.N.; Alazba, A.A.; El-Farrah, M.A. Correcting inaccurately recorded data due to faulty calibration of a capacitance water content probe. Appl. Environ. Soil Sci. 2013, 2013, 530732. [Google Scholar] [CrossRef]
- Kuşçu, H.; Turhan, A.; Demir, A.O. The response of processing tomato to deficit irrigation at various phenological stages in a sub-humid environment. Agric. Water Manag. 2014, 133, 92–103. [Google Scholar] [CrossRef]
- Allan, J.A. Virtual water: A strategic resource. Ground Water 1998, 36, 545–547. [Google Scholar] [CrossRef]
- Mekonnen, M.M.; Hoekstra, A.Y. The green, blue and grey water footprint of crops and derived crop products. Hydrol. Earth Syst. Sci. 2011, 15, 1577–1600. [Google Scholar] [CrossRef]
- Han, X.; Yang, R.; Zhang, L.; Wei, Q.; Zhang, Y.; Wang, Y.; Shi, Y. A Review of Potato Salt Tolerance. Int. J. Mol. Sci. 2023, 24, 10726. [Google Scholar] [CrossRef] [PubMed]
- Chourasia, K.N.; Lal, M.K.; Tiwari, R.K.; Dev, D.; Kardile, H.B.; Patil, V.U.; Kumar, A.; Vanishree, G.; Kumar, D.; Bhardwaj, V.; et al. Salinity Stress in Potato: Understanding Physiological, Biochemical and Molecular Responses. Life 2021, 11, 545. [Google Scholar] [CrossRef]
- Sanwal, S.K.; Kumar, P.; Kesh, H.; Gupta, V.K.; Kumar, A.; Kumar, A.; Meena, B.L.; Colla, G.; Cardarelli, M.; Kumar, P. Salinity Stress Tolerance in Potato Cultivars: Evidence from Physiological and Biochemical Traits. Plants 2022, 11, 1842. [Google Scholar] [CrossRef]
- Wang, R.; Cao, H.; Kang, S.; Du, T.; Tong, L.; Kang, J.; Gao, J.; Ding, R. Agronomic measures improve crop yield and water and nitrogen use efficiency under brackish water irrigation: A global meta-analysis. Agric. Syst. 2025, 226, 104304. [Google Scholar] [CrossRef]
- Madugundu, R.; Al-Gaadi, K.A.; Tola, E.; Patil, V.C.; Sigrimis, N. The Impact of Salinity and Nutrient Regimes on the Agro-Morphological Traits and Water Use Efficiency of Tomato under Hydroponic Conditions. Appl. Sci. 2023, 13, 9564. [Google Scholar] [CrossRef]
- Rhoades, J.D.; Kandish, A.; Mashali, A.M. The Use of Saline Waters for Crop Production; FAO: Rome, Italy, 1992. [Google Scholar]
- Shani, U.; Dudley, L.M. Field studies of crop response to water and salt stress. Soil Sci. Soc. Am. J. 2001, 65, 1522–1528. [Google Scholar] [CrossRef]
- Katerji, N.; van Hoorn, J.; Hamdy, A.; Mastrorilli, M. Salinity effect on crop development and yield, analysis of salt tolerance according to several classification methods. Agric. Water Manag. 2003, 62, 37–66. [Google Scholar] [CrossRef]
- Ma, J.; Ding, Y.; Zhang, J.; Fan, K.; Bai, Y.; Cui, B.; Hao, X.; Fu, G.; Ding, B. Exploring the response relationship between crop rooting, seedling emergence and soil water, heat and salt environmental factors in dry sowing wet emergent cotton fields. Ind. Crop. Prod. 2025, 231, 121201. [Google Scholar] [CrossRef]
Disclaimer/Publisher’s Note: The statements, opinions and data contained in all publications are solely those of the individual author(s) and contributor(s) and not of MDPI and/or the editor(s). MDPI and/or the editor(s) disclaim responsibility for any injury to people or property resulting from any ideas, methods, instructions or products referred to in the content. |
© 2025 by the authors. Licensee MDPI, Basel, Switzerland. This article is an open access article distributed under the terms and conditions of the Creative Commons Attribution (CC BY) license (https://creativecommons.org/licenses/by/4.0/).