Article

Characterization of Groundwater Chemistry Under the Influence of Seawater Intrusion in Northern Laizhou, Shandong Province, China

1
Yantai Center of Coastal Zone Geological Survey, China Geological Survey, Yantai 264004, China
2
Observation and Research Station of Seawater Intrusion and Soil Salinization, Laizhou Bay, Ministry of Natural Resources, Qingdao 266061, China
3
Ministry of Natural Resources Observation and Research Station of Land-Sea Interaction Field in the Yellow River Estuary, Yantai 264004, China
4
The Yellow River Delta National Nature Reserve Management Committee Shandong, Dongying 257000, China
*
Author to whom correspondence should be addressed.
Water 2025, 17(20), 2954; https://doi.org/10.3390/w17202954
Submission received: 20 August 2025 / Revised: 25 September 2025 / Accepted: 25 September 2025 / Published: 14 October 2025

Abstract

The rise in sea levels due to global warming and the excessive extraction of groundwater in coastal regions significantly encourages seawater intrusion, resulting in a cascade of ecological and environmental issues, including water quality degradation and soil salinization. The northern sector of Laizhou City, situated on the eastern coast of Laizhou Bay, exemplifies a typical location of seawater intrusion in China, where the rising salinity of groundwater has adversely affected local economic development and public health. This investigation involved the collection of 115 groundwater samples and 13 isotope samples from the northern region of Laizhou City. Statistical analysis, Piper’s trilinear diagrams, and various analytical techniques were employed to examine the chemical properties of the groundwater in the study area; characteristic ion ratios, Gibbs diagram, and hydrogen–oxygen isotope methods were utilized to analyze the sources of salinity and groundwater recharge; and a seawater intrusion groundwater quality index, which was applied to the present condition of seawater intrusion, was assessed utilizing the seawater intrusion groundwater quality index (GQISWI). The findings indicate that the chemical composition of groundwater in the research area is notably intricate. From freshwater to saline water, the groundwater chemistry transitions from Ca-HCO3·Cl-type water to Ca·Na-SO4·Cl-type water, and finally to Na-Cl-type water. Seawater intrusion in the research area is the primary cause of elevated groundwater salinity, alongside cation exchange and water–rock interactions that affect water chemistry. Seawater intrusion is predominantly focused in the northern region of the research area. The primary source of groundwater recharge is atmospheric precipitation.

1. Introduction

Coastal regions are favored for human settlement due to their distinctive geography and aesthetic appeal. Nonetheless, the rise in population, economic expansion, and engineering infrastructure in coastal regions has heightened the demand for fresh groundwater, resulting in diminishing water levels and subsequent seawater intrusion into coastal aquifers. The literature indicates that seawater intrusion has affected around 500 coastal towns globally [1], encompassing regions such as East Asia [2,3,4,5], South Asia [6,7], the Mediterranean [8,9], North America [10], and Europe [11,12].
Seawater intrusion events have resulted in extensive contamination of freshwater aquifers and ecological deterioration along the Chinese coastline. Seawater intrusion in China predominantly occurs in the Bohai Sea region (Shandong, Hebei, Tianjin, and Liaoning) [4,13], the Yangtze River Delta, the Pearl River Delta, the Beibu Gulf coastal area, Hainan, and the central and western plains of Taiwan [3,14].
Current research on seawater intrusion encompasses inquiry and assessment, modeling of seawater intrusion [15], and strategies for its prevention and control [16]. Methods for investigating and evaluating seawater intrusion encompass water chemistry techniques [17,18], isotope analysis [19], and geophysical approaches [20], among others. The water chemistry approach serves as the most direct and complete indicator; however, its drawbacks include an excessive number of indicators, susceptibility to human impact, interference from hydrogeological circumstances, and inconsistencies among indicators. The extensive application of various approaches is the prevailing trend in the investigation of seawater intrusion [13,21,22,23].
Laizhou Bay, recognized as a critical region experiencing seawater intrusion in China, has been adversely impacted in terms of residential water consumption and industrial and agricultural output [24,25,26,27,28,29]. The south coast of Laizhou Bay is a hot research area for seawater intrusion and saline (brine) water intrusion, and the methods used to study it are mostly hydrogeochemical and isotope geochemical methods, etc. In the case of saline (brine) water, there are debates on the evaporation and concentration of ancient seawater and the dissolution of evaporite rocks in sediments [4,30,31,32,33,34,35]. Since the discovery of seawater intrusion in the study area located on the east coast of Laizhou Bay in the 1970s, scholars have also carried out a great deal of research. Currently, it is generally agreed that groundwater salinization along the east coast of Laizhou Bay is mainly caused by seawater intrusion, and the presence of brine has not been found [25,36]. In the 1990s, Xue Yuqun and Yin Zesheng examined the current state of seawater intrusion, the transport dynamics at the saline-freshwater interface, as well as the causes, mechanisms, and classifications of seawater intrusion [25,29]. They employed various methodologies, including water chemistry analysis, groundwater isotope research, statistical groundwater assessments, monitoring section construction, numerical simulations, remote sensing interpretation, ecological investigations, and modeling, resulting in significant insights and accomplishments. In recent years, certain scholars conducted predictive modeling in the study area [37], performed a disaster risk assessment of seawater intrusion in the coastal zone of Laizhou City [38], and proposed control measures for seawater intrusion [39]; however, they neglected to analyze the water chemistry affected by seawater intrusion.
Groundwater serves as the primary water source in the study area, a significant grain-producing region and mining development zone in Laizhou City. The 2017–2020 Yantai City Water Resources Bulletin indicates that groundwater constitutes over 50% of the total water supply in the study region. Seawater intrusion has significantly affected the water supply for agricultural, industrial, and residential use in the studied region. This research project aims to assess the existing condition of the chemical properties of groundwater in the study area due to persistent seawater intrusion. To accomplish these objectives, a comparative schematic map illustrating the progression of seawater intrusion over the years was created, and the origins of groundwater salinity and recharge were examined utilizing hydrochemical and isotopic techniques. The study area is crucial for water resource management, prevention and control of saltwater intrusion disasters, and conservation of the coastal ecological environment.

2. Study Area

The study area is situated in the northern region of Laizhou City, Yantai City, Shandong Province, along the eastern coast of Laizhou Bay (Figure 1). The study area exhibits a continental climate within the northern temperate East Asian monsoon zone, characterized by an average annual precipitation of 616.05 mm and an average temperature of 12.6 °C from 1970 to 2021.
The research area’s topography is predominantly elevated in the southeast and depressed in the northwest, characterized primarily by low hills and plains, with an elevation range of 0–478 m. The primary stratigraphy of the study area comprises the Neoproterozoic Jiao Dong Rock Group, the Paleoproterozoic Jingshan Group, and the Powder Mountain Group, alongside the Cenozoic Paleocene and Quaternary. Additionally, a significant expanse of magmatic intrusion affects the exposed strata, with the Quaternary predominantly constituting the principal aquifer, which includes Quaternary alluvial deposits, fine sand, coarse sand, and pebble gravels. The primary aquifers consist of Quaternary alluvial and floodplain medium and fine sands, coarse sands, and pebble gravel. Typically, there exists a singular aquifer layer, though there may be two to four levels, with a close hydraulic relationship between them, and thickness varying from 2 to 30 m. In the southern region of the city, the ancient Yuan dynasty rock formation is visible, and the aquifer consists of carbonate rock, with the water level depth varying from 14.50 to 19.00 m. In the eastern and southeastern regions of the city, granite and metamorphic rock are exposed, with weathering fissure water as the primary source. The area is characterized by limited tectonic water management, and the thickness of the weathering zone typically ranges from 30 to 40 m. With the exception of a portion of the karst fissure water, the groundwater is predominantly submerged. Groundwater discharge routes mostly consist of runoff into the ocean and artificial extraction [40,41].
Groundwater recharge primarily originates from the infiltration of atmospheric precipitation, supplemented by surface water recharge during flood and irrigation events. The flow direction of groundwater runoff aligns with that of surface water systems, predominantly towards the north and northwest. The watershed for surface water coincides with that of groundwater, with the exception of the Xiaogu River, which discharges into Jiaozhou Bay to the south; all other rivers flow northward and northwestward into the Bohai Sea. The coastal region of the study area features extensive mariculture bases, a significant gold mining zone in the north, and a marble mining area in the south. The predominant land use type is arable land, primarily cultivated with winter wheat and maize.

3. Materials and Methods

3.1. Data Sources

Informed by the historical seawater intrusion line (1979–2016) [39,41], the depositional environment of the aquifer, and the groundwater storage types in the study area, a total of 115 groundwater samples were systematically collected at the end of August and the beginning of September 2020 (Figure 1). There are eight samples of fissure water, three samples of karst water, and 104 samples of pore water. The sampling depth is concentrated in 3–17 m, and a few of them can reach more than 25 m. Additionally, 13 hydrogen and oxygen isotope samples were obtained in mid-November, comprising two seawater samples and 11 groundwater samples. Water was taken from the well using a Baylor tube, the sampling bottle was rinsed three times, and two bottles of water samples were collected: 1000 mL and 500 mL. A foam box was used to hold the water samples, with ice packs inside the box. The water samples were filtered through a 0.45 μm filter membrane, and one of the samples was added to a protective reagent, nitric acid, to make the pH less than 2.
Testing of the samples was done by the University of Science and Technology Beijing. Groundwater samples were tested for: pH, Na+, K+, Ca2+, Mg2+, Cl, SO42−, HCO3, and total dissolved solids (TDS). pH was determined by the glass electrode method using a multi-parameter meter (S220, Shanghai Yidian Analytical Instrument Co., Ltd. Shanghai, China); potassium and sodium ions were measured by flame atomic absorption spectrophotometry using a flame photometer (FP640, Shanghai Yidian Analytical Instrument Co., Ltd. Shanghai, China); calcium and magnesium ions were determined by titration with disodium EDTA; chloride ion was determined by volumetric method with silver nitrate; potassium chromate was used as the indicator; sulphate was determined by the turbidimetric method using a double-beam ultraviolet-visible spectrophotometer (UV-1800, Shimadzu, Kyoto, Japan); bicarbonate and carbonate were determined by titrimetric method; and the total dissolved solids were determined by gravimetric method. Determination of hydroxide isotope content by isotope mass spectrometry using a stable isotope mass spectrometer (ISOPRIM 100, Elementar, Hamburg, Germany). The limit of quantification is shown in Table 1.

3.2. Method

3.2.1. Hydrochemical Facies Evolution Diagram

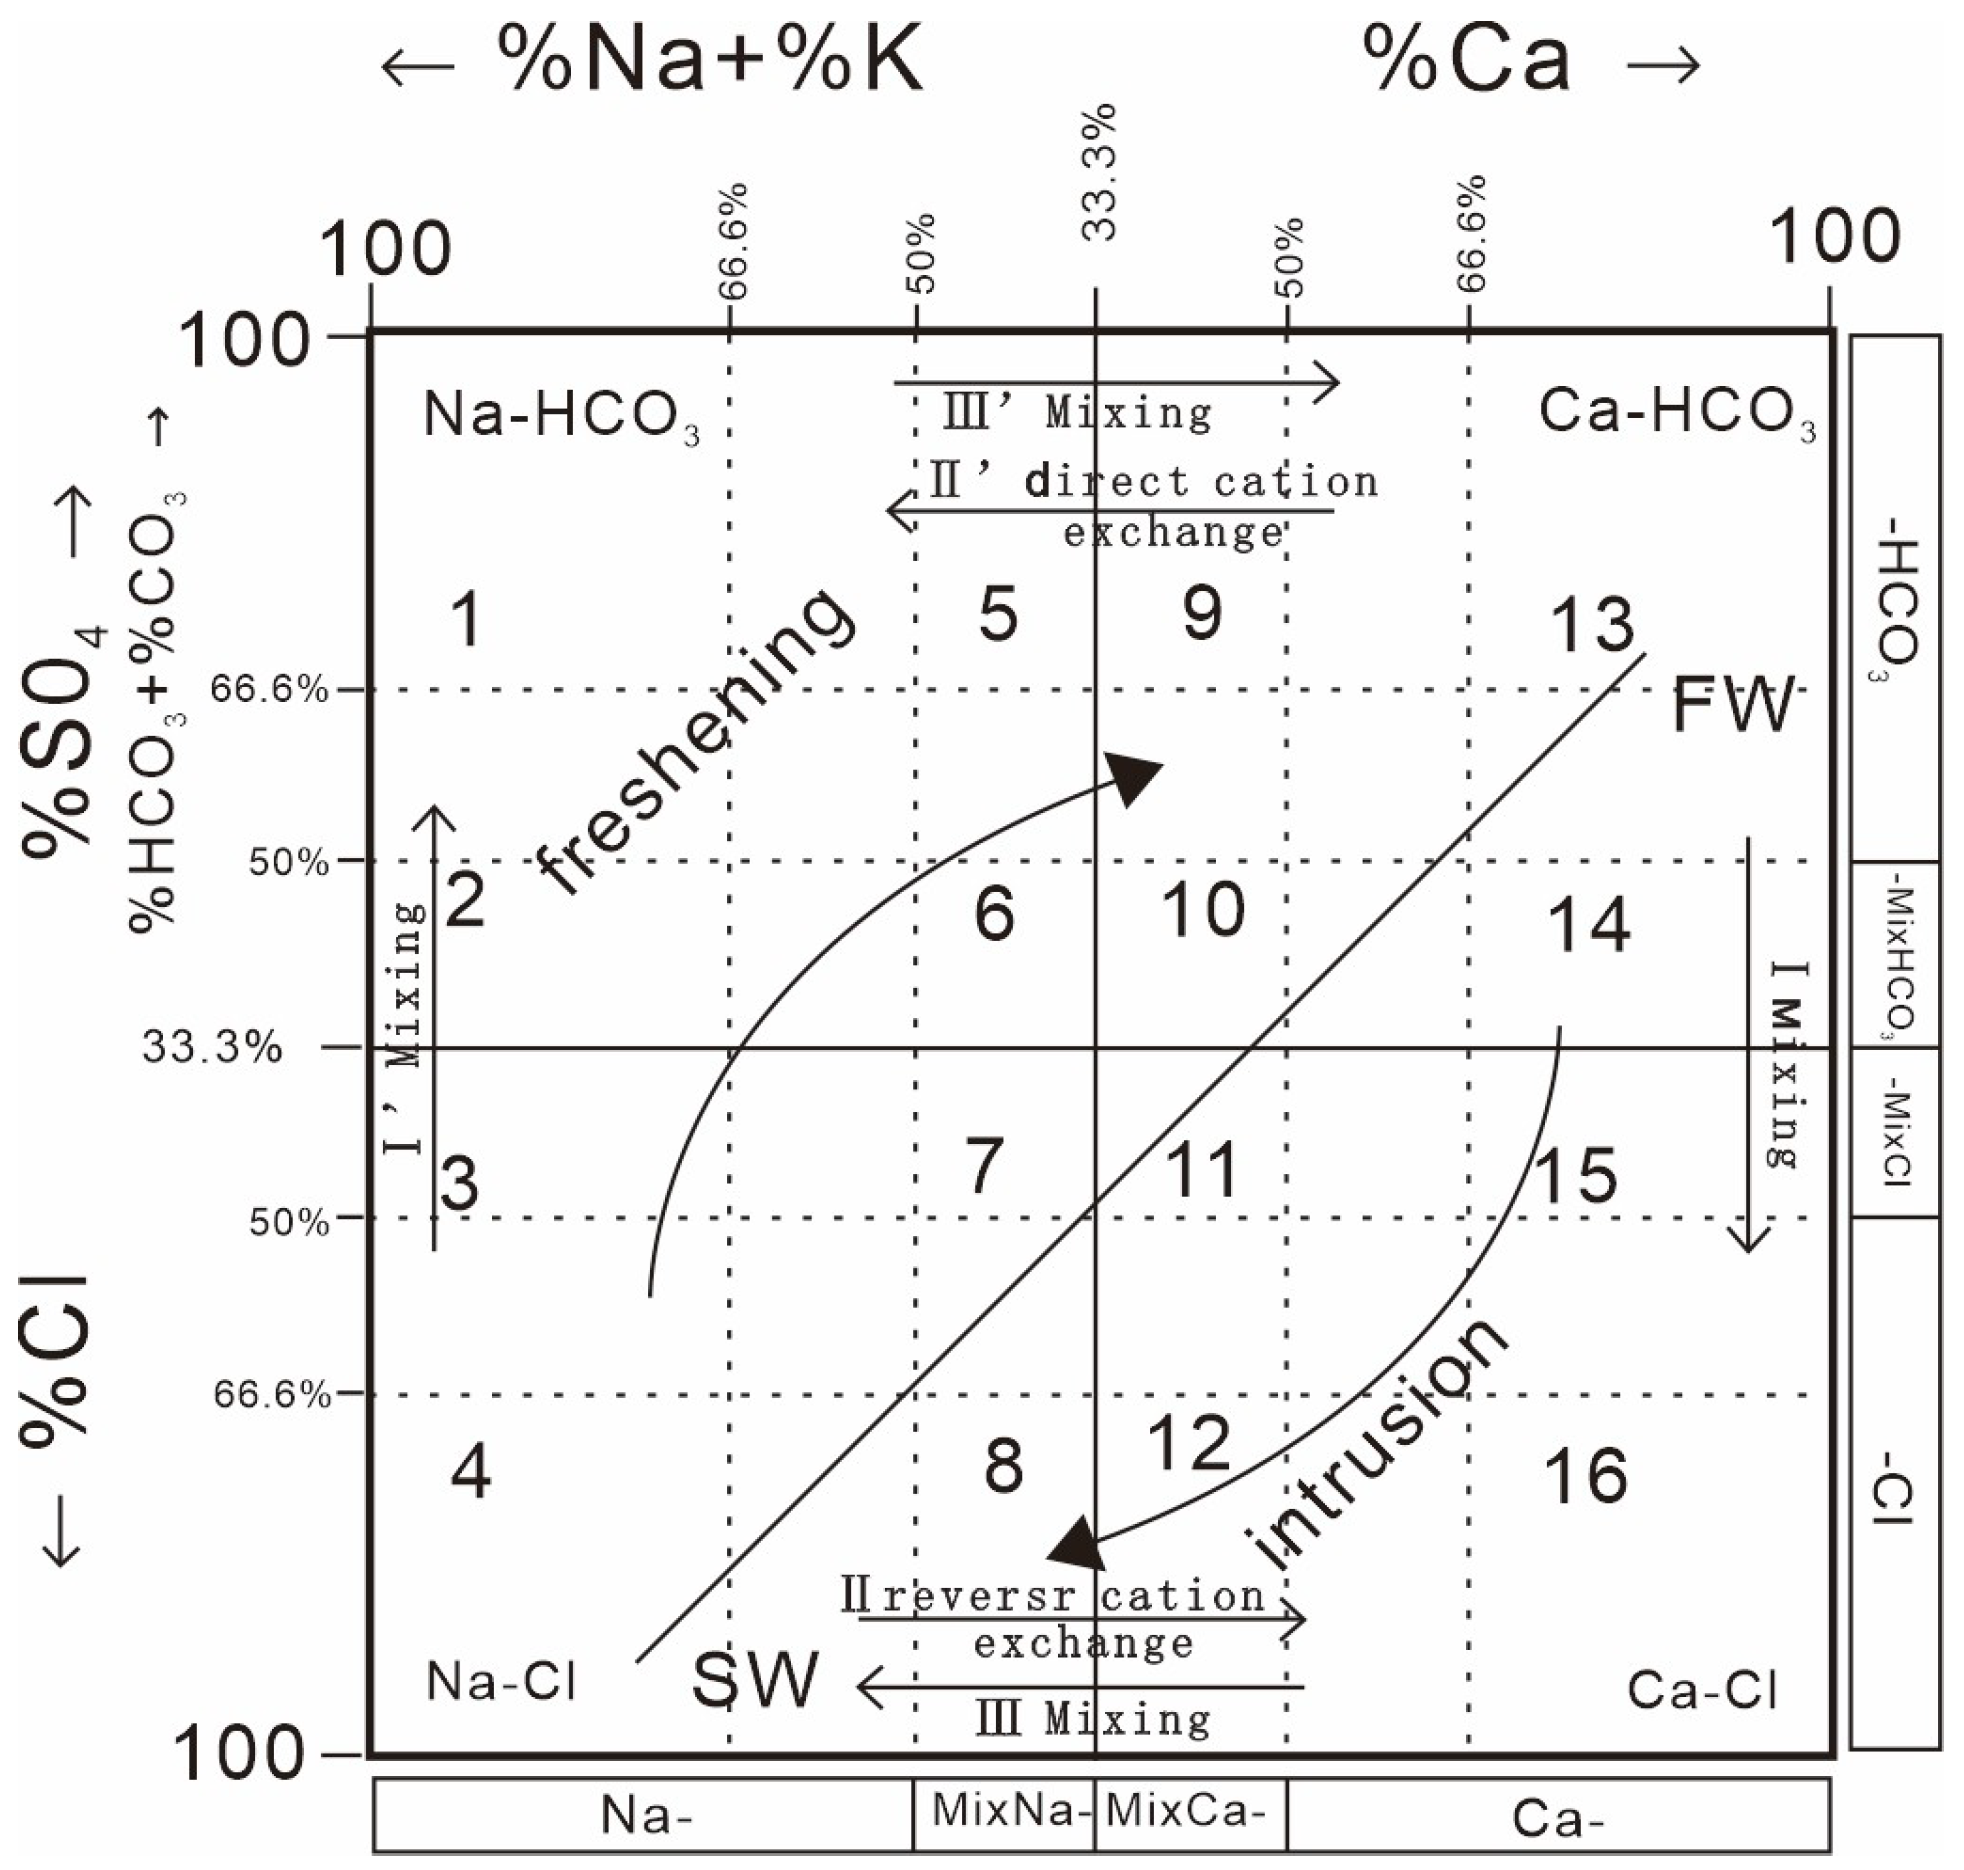
The hydrochemical facies evolution diagram is based on the classification method proposed by Stuyfzand [42,43,44], presented in 2010. It has been refined since then and is now widely used [34,45,46]. The hydrochemical facies evolution diagram provides a simple method of identifying the state of the intrusion/freshening processes occurring over time within a seawater intrusion zone and is determined using the distribution of anions and cations in the diagram.
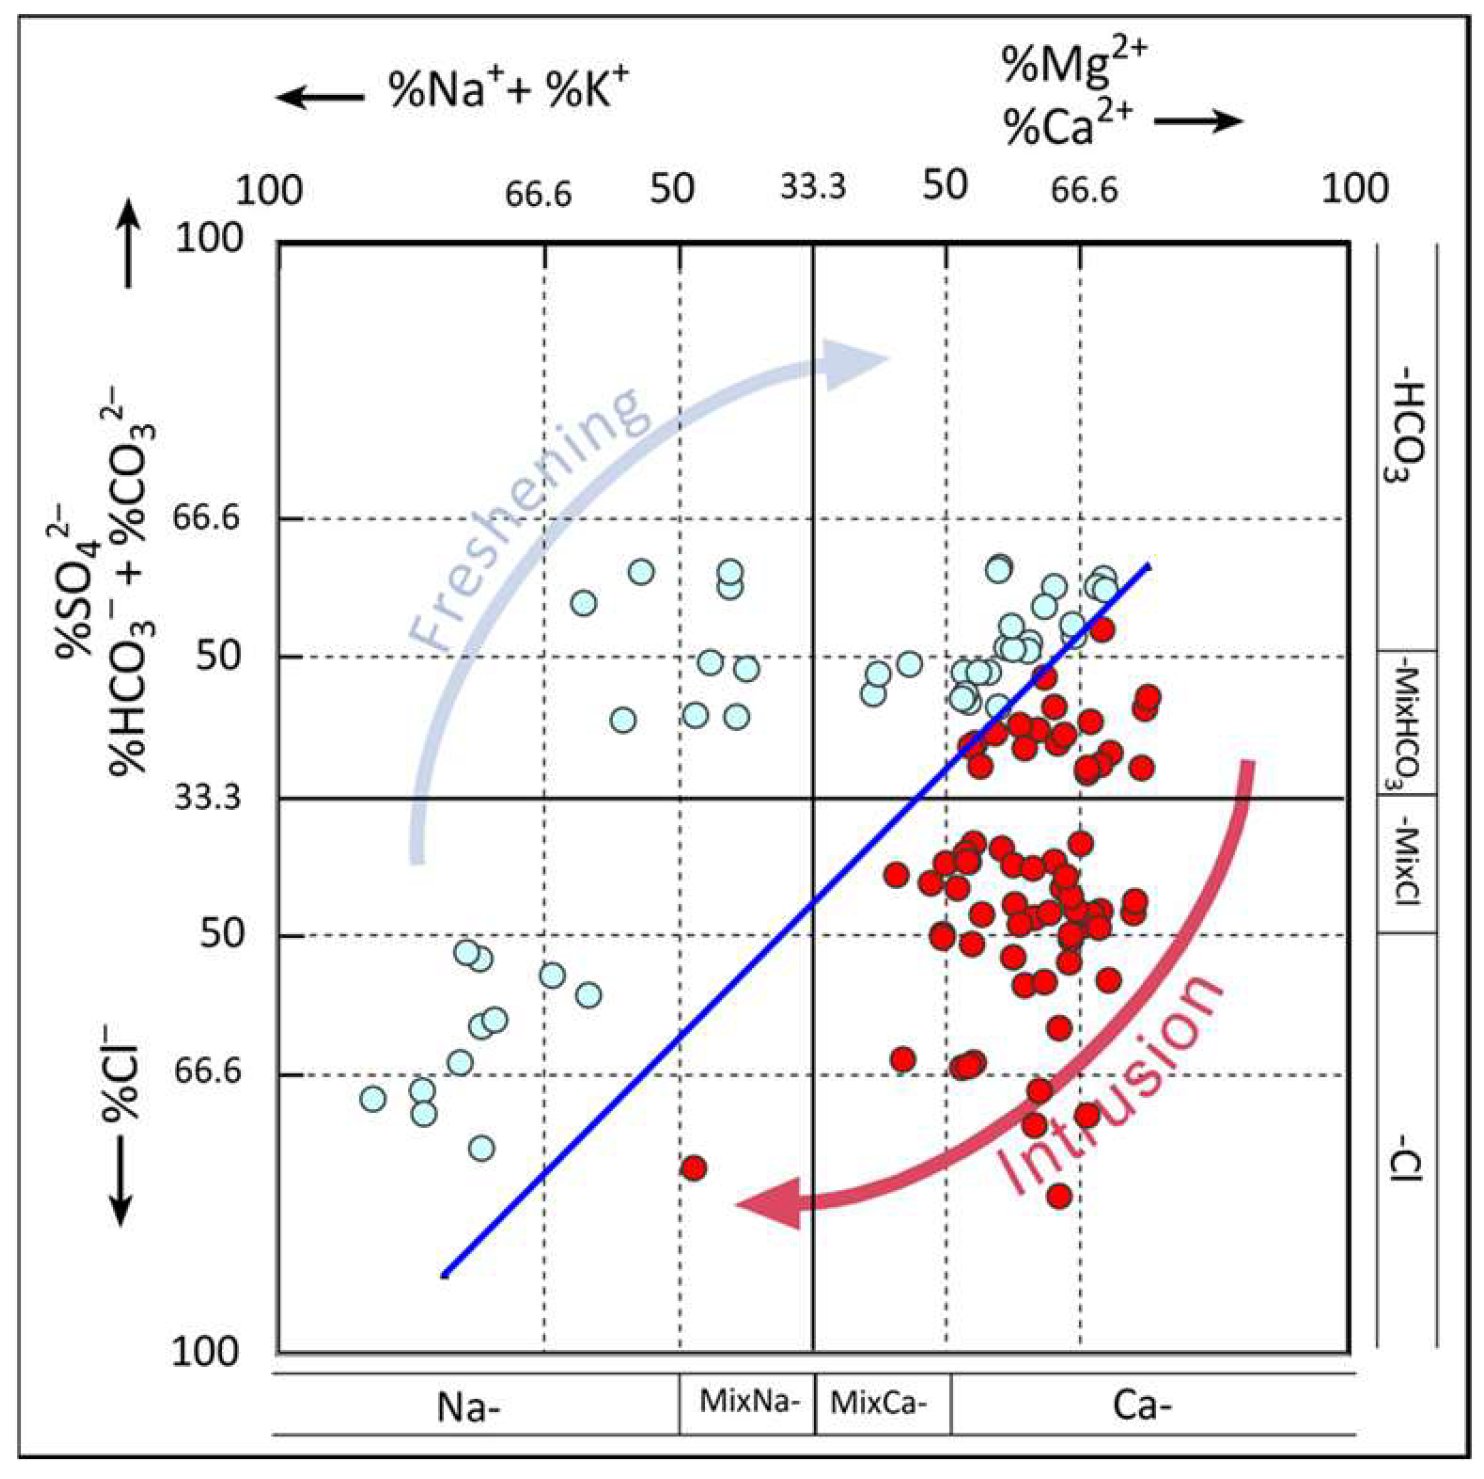
The horizontal axis of HFE-D denotes the percentage of Ca2+ and Na+ + K+ concentrations within the total cation concentration, while the vertical axis indicates the percentage of HCO3 and Cl concentrations within the total anion concentration (Figure 2). HFE-D categorizes the hydrochemical evolution of seawater intrusion into two phases: the invasion phase, which denotes intrusion, and the recovery phase, which signifies freshening. Furthermore, HFE-D excludes the segment of the axis from 0 to 33.3% to elucidate the hydrochemical progression more distinctly [42,43].

3.2.2. Ion Ratios

The principal ion concentrations were transformed from mg/L to meq/L, a normalizing process to exclude the influence of charges.
This study employed the seawater ratio, defined as the concentration of each standard seawater ion relative to Cl concentration, to investigate the extent of groundwater and saltwater mixing, as well as the dissolution of rocks and minerals in the study area. Figures 6–8 illustrate the relationship between the ratios of the primary ions Ca2+, Mg2+, Na+, K+, SO42−, and HCO3 to Cl, as well as Cl concentration, using logarithmic coordinates. This comparison with seawater ratios elucidates the mechanism of groundwater salinization. The horizontal line in the illustration represents the standard seawater ratio line for the respective ions. The ratio of the primary ions to Cl along the line corresponds to the seawater ratio, so it is referred to as the seawater ratio line [17].
In the chemical composition of water, certain proportionality coefficients of groundwater formed by different causes or under different conditions have relatively significant differences in values, so such coefficients can be used to determine the cause of groundwater formation.

3.2.3. Gibbs Diagram

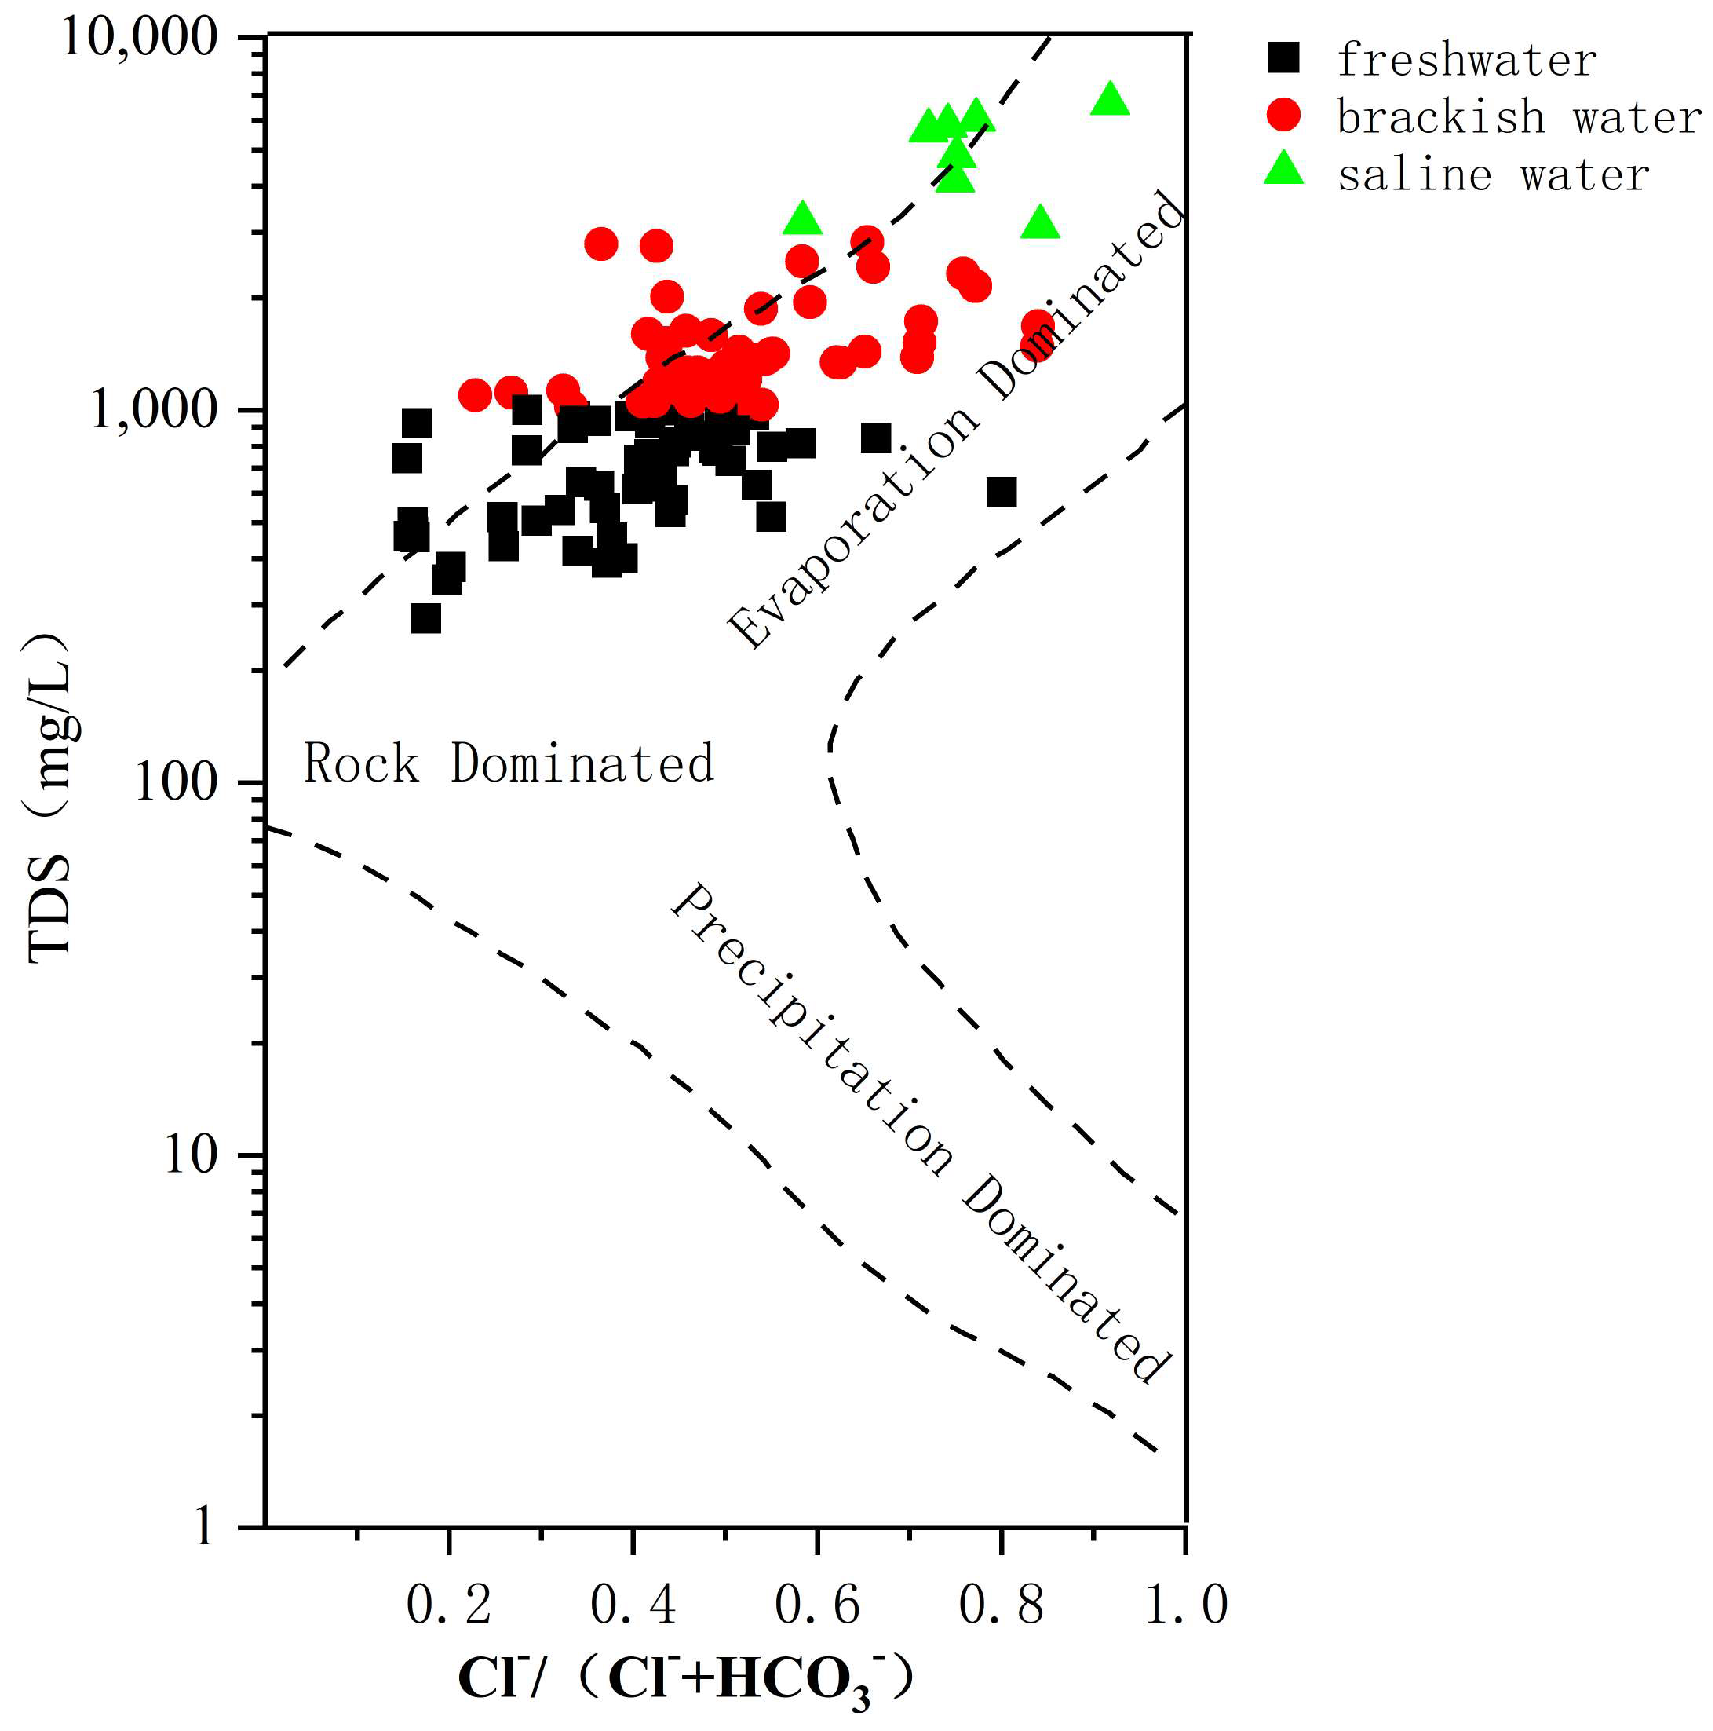
The Gibbs diagram is a widely employed technique for qualitatively analyzing the sources of compounds in water, primarily ascribed to natural phenomena such as evaporation-dominated, rock-dominated, and precipitation-dominated water [47]. A Gibbs plot was constructed with Cl/(Cl + HCO3) as the abscissa, and the logarithm of TDS was used as the ordinate.

3.2.4. GQISWI

The assessment of seawater intrusion employs various methodologies, each possessing distinct advantages and disadvantages. The seawater intrusion groundwater quality index (GQISWI), introduced in 2014, is a multi-index synthesis method that integrates the proportion of seawater contribution (fsea) and Piper diagrams, while considering the intricate hydrogeochemical reactions involved in seawater intrusion. The GQISWI may assess the extent of seawater intrusion by utilizing the scores directly, offering a more comprehensive approach than the single-indicator evaluation method and a simpler alternative to numerical simulation [48].
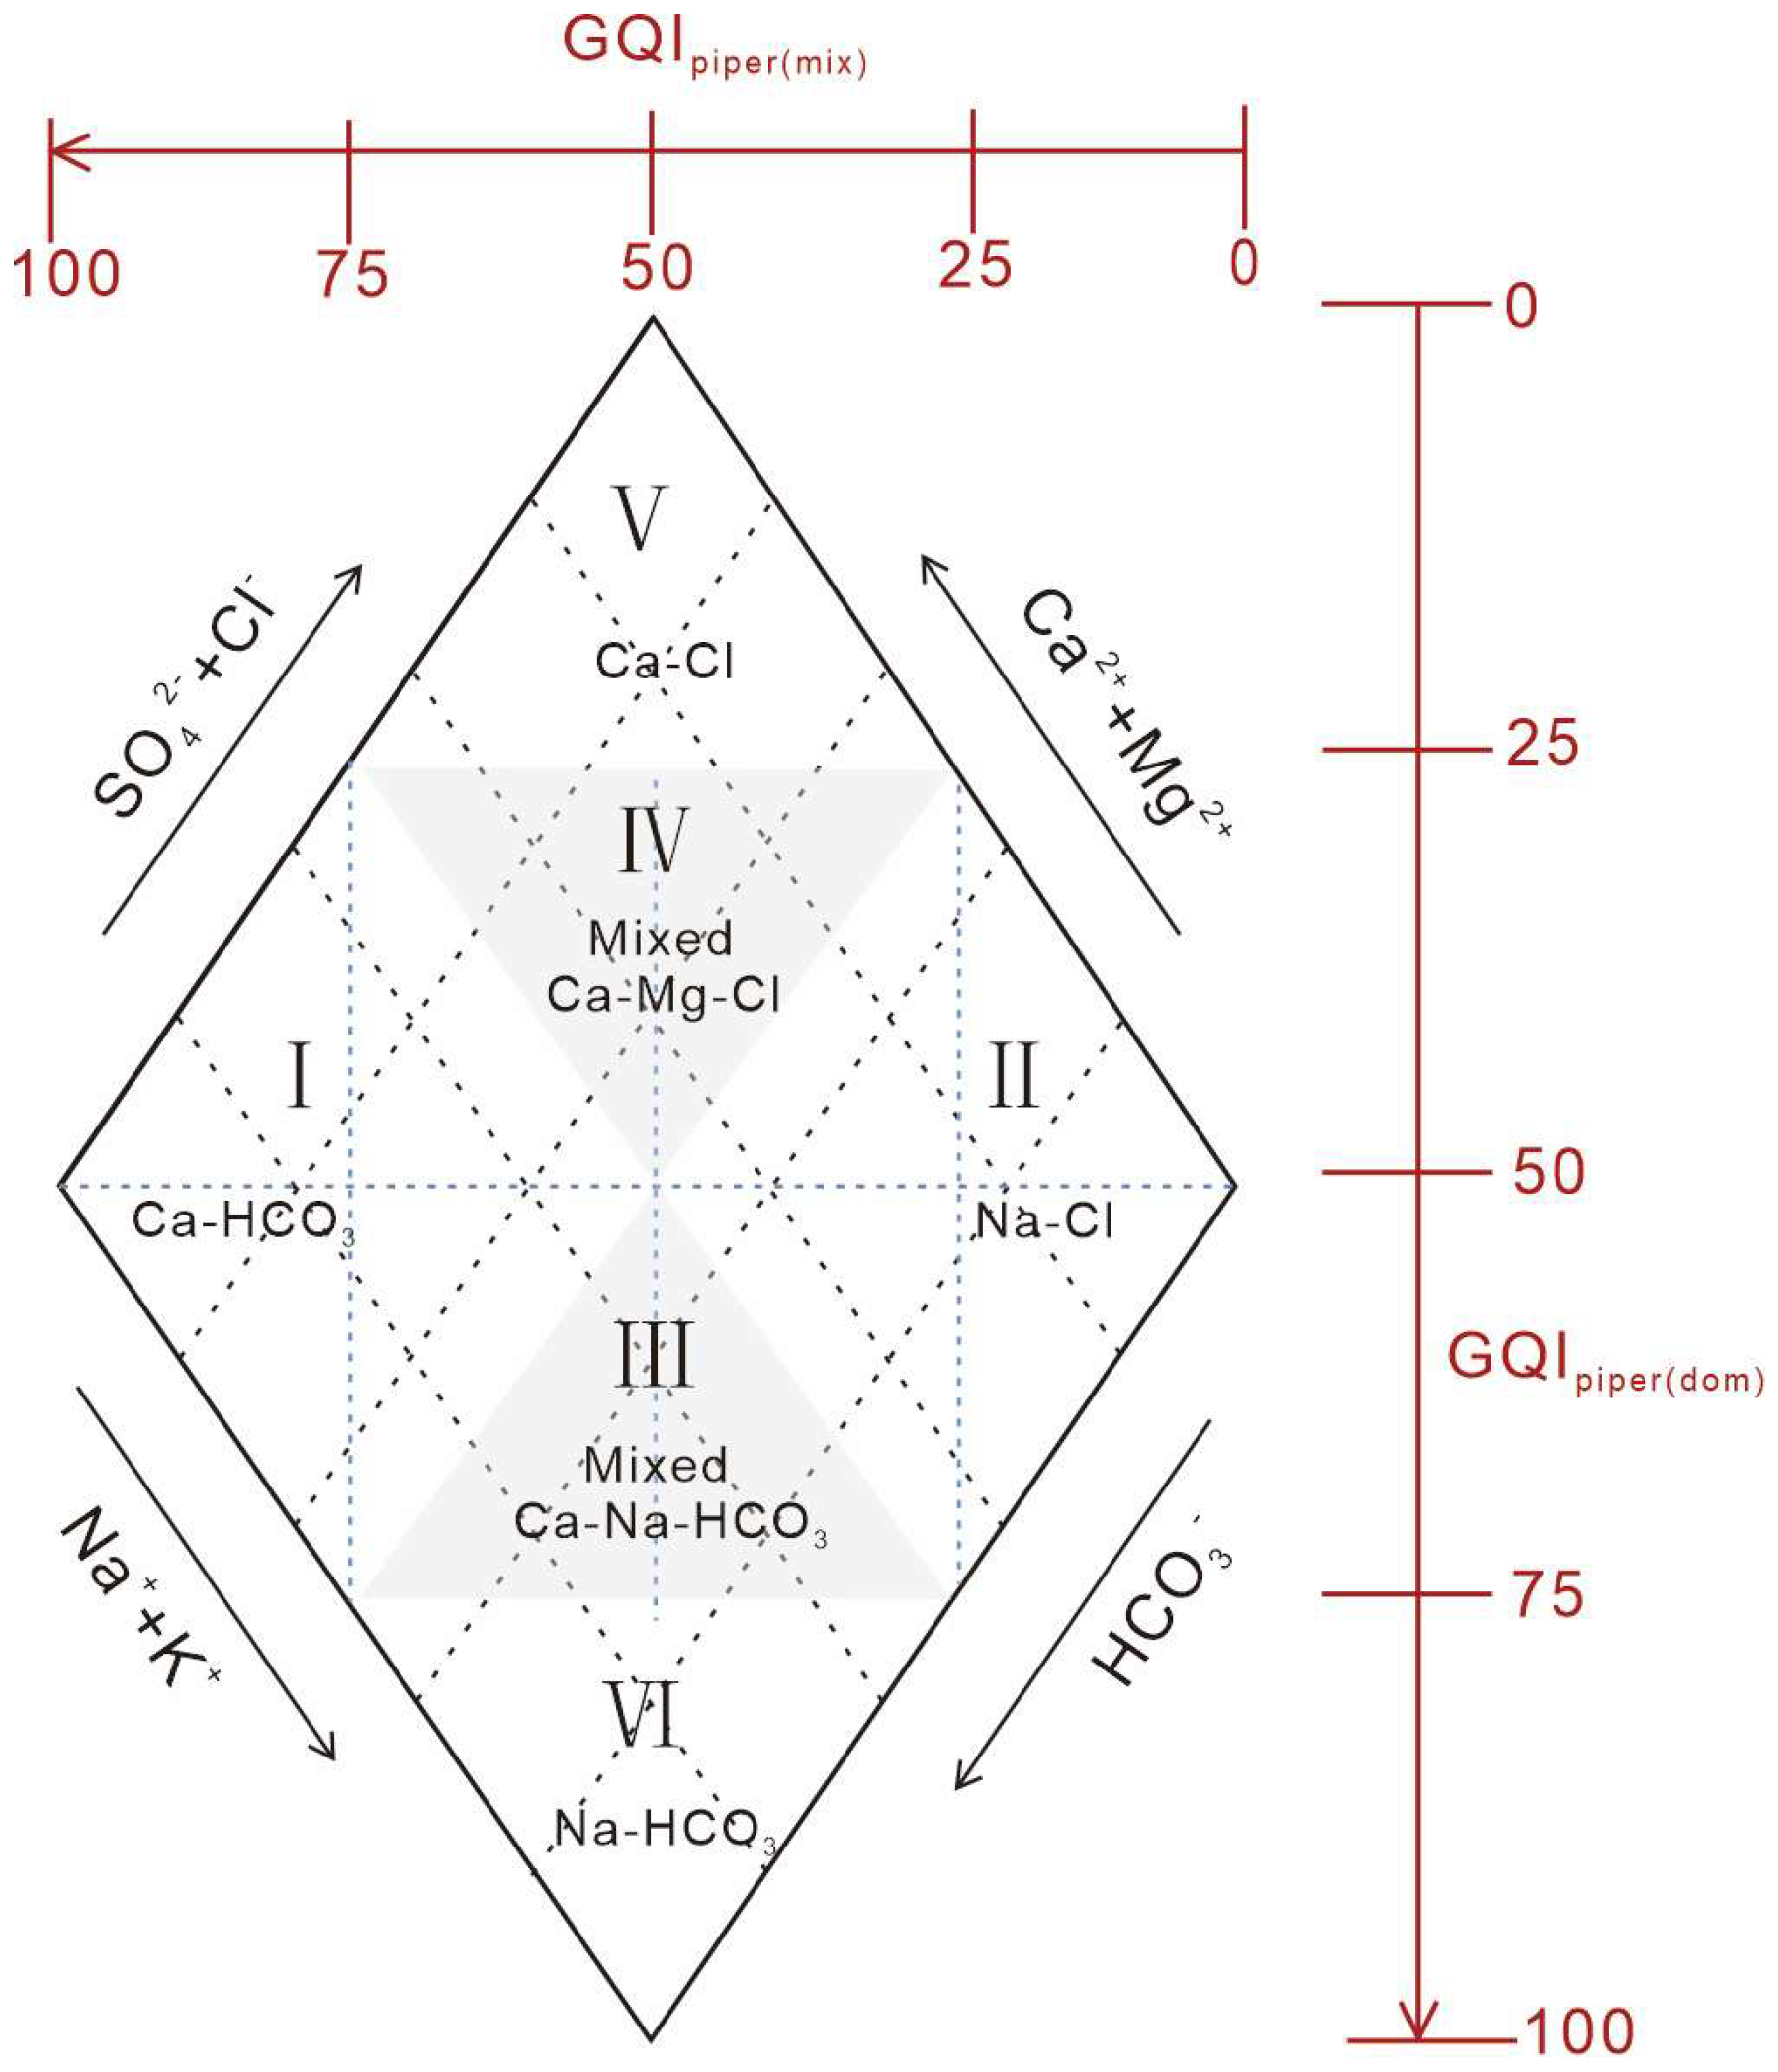
The diamond-shaped area of the Piper diagram can be segmented into six distinct domains: I, II, III, IV, V, and VI, denoting Ca-HCO3, Na-Cl, mixed Ca·Na-HCO3, mixed Ca·Mg-Cl, Ca-Cl, and Na-HCO3 types of water, respectively. Freshwater is typically depicted in domain I, while saltwater (seawater) is portrayed in domain II. The basic amalgamation of freshwater and seawater is illustrated by a horizontal line at the center of the picture, designated as GQIPiper (mix) (Figure 3):
GQI Piper ( mix ) = Ca + + Mg + Total   cations + HCO 3 Total   anions × 50   ( meq / L )
GQIPiper(mix) varies from 0 (high-concentration saline water in domain II) to 100 (freshwater in domain I). GQIPiper(mix) and GQIPiper(dom) can be utilized in conjunction to enhance the definition and description of the other domains. GQIPiper(dom) varies from 0, representing CaCl-type water (domain V), to 100, denoting NaHCO3-type water (domain VI). The GQIPiper(dom) spans from 0, representing CaCl-type water (domain V), to 100, indicating NaHCO3-type water (domain VI):
GQI Piper ( dom ) = Na + + K + Total   cations   + HCO 3   Total   anions   ×   50   ( meq / L )
The range of GQIPiper (mix) and GQIPiper (dom) and the hydrochemical domains used in pairs are shown in Table 2.
A straightforward method for detecting seawater intrusion is the seawater contribution proportion (fsea), which ranges from 0 to 100, yielding an index, GQIfsea, where freshwater has a lower fsea value:
GQI fsea   =   1     fsea   ×   100
Cl measurements in specific places can be utilized to compute fsea, and in the absence of such observations, the freshwater to seawater ratio may be designated to range from 0 to 566 meq/L. The integration of the GQIPiper (mix) and fsea produces a novel index, the Groundwater Quality Index for Seawater Intrusion (GQISWI). The formulas are presented below:
GQI SWI   =   GQI Piper ( mix )     GQI fsea 2
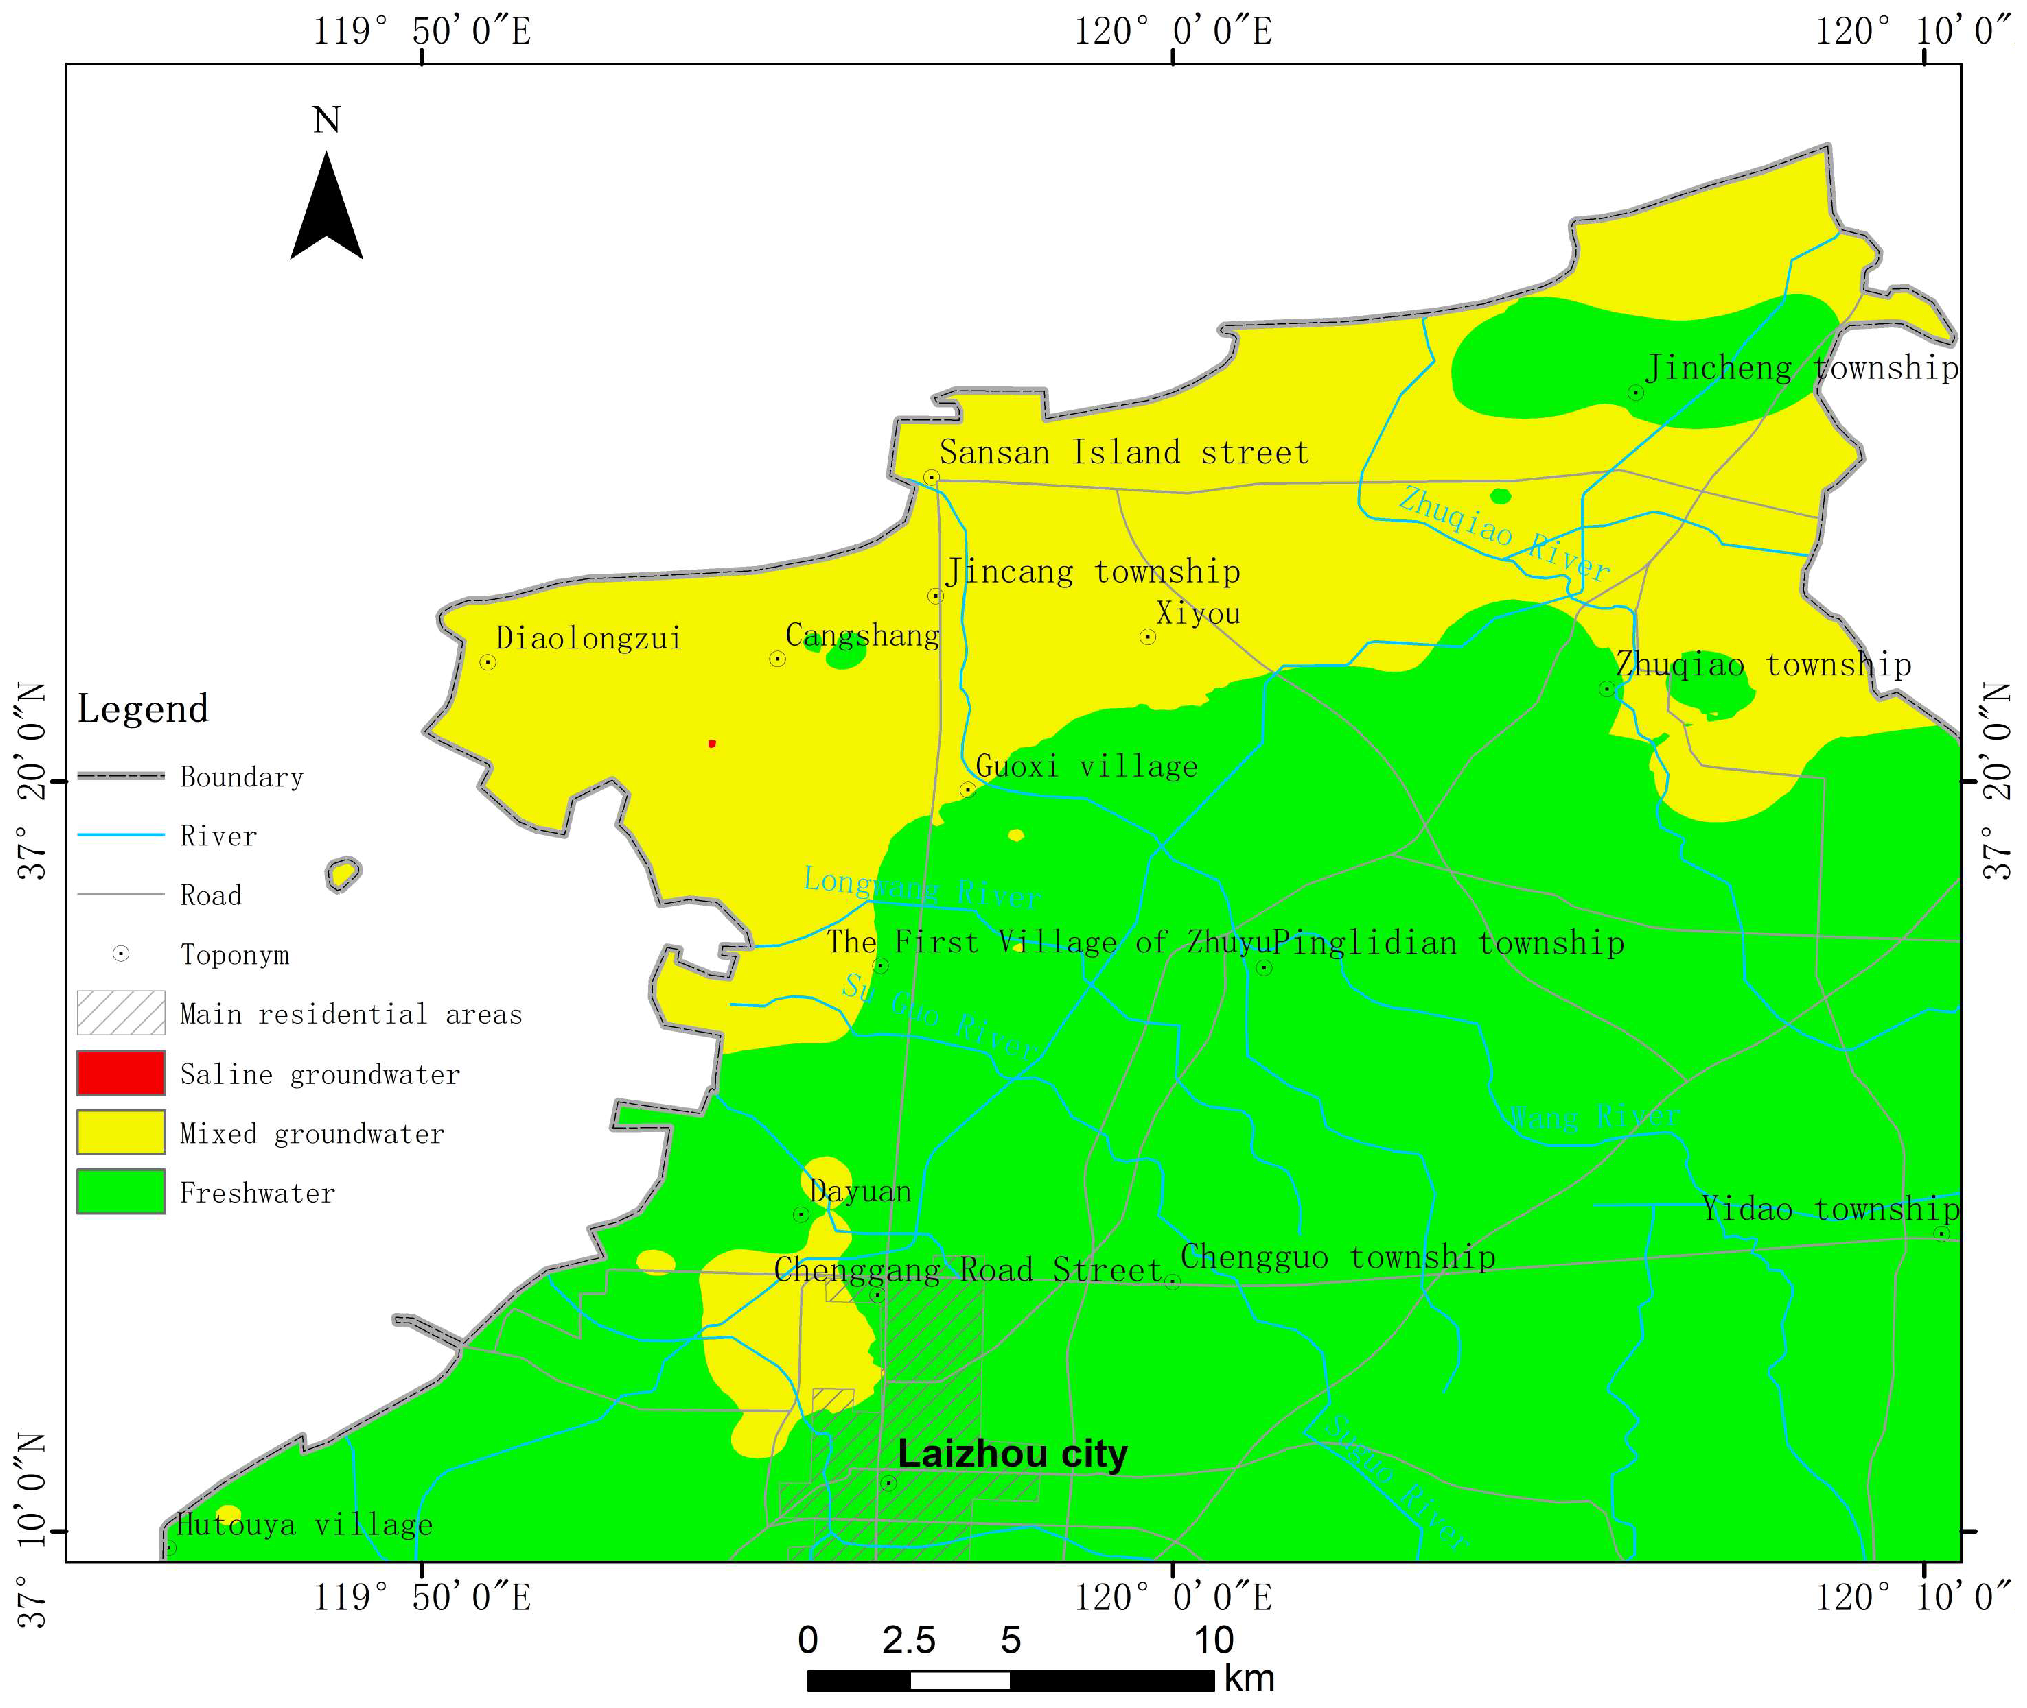
The GQISWI spans from 0 to 100, with 0 representing seawater and 100 representing freshwater. Indicator values for freshwater typically exceed 75, whereas those for seawater generally fall below 50. GQISWI scores for mixed groundwater fluctuate between 50 and 75 [48].

3.2.5. Hydrogen and Oxygen Stable Isotopes

The thousandths deviation method is utilized to denote the isotopes of hydrogen and oxygen. The isotope ratios of the collected samples are compared to those of the standard samples based on the kilo deviation, specifically the kilo deviation of the Rsamples from the Rstandards. The δ-value of a sample based on this ratio is defined as:
δ   ( )   =   R s a m p l e   R   standard R   s t a n d a r d × 1000
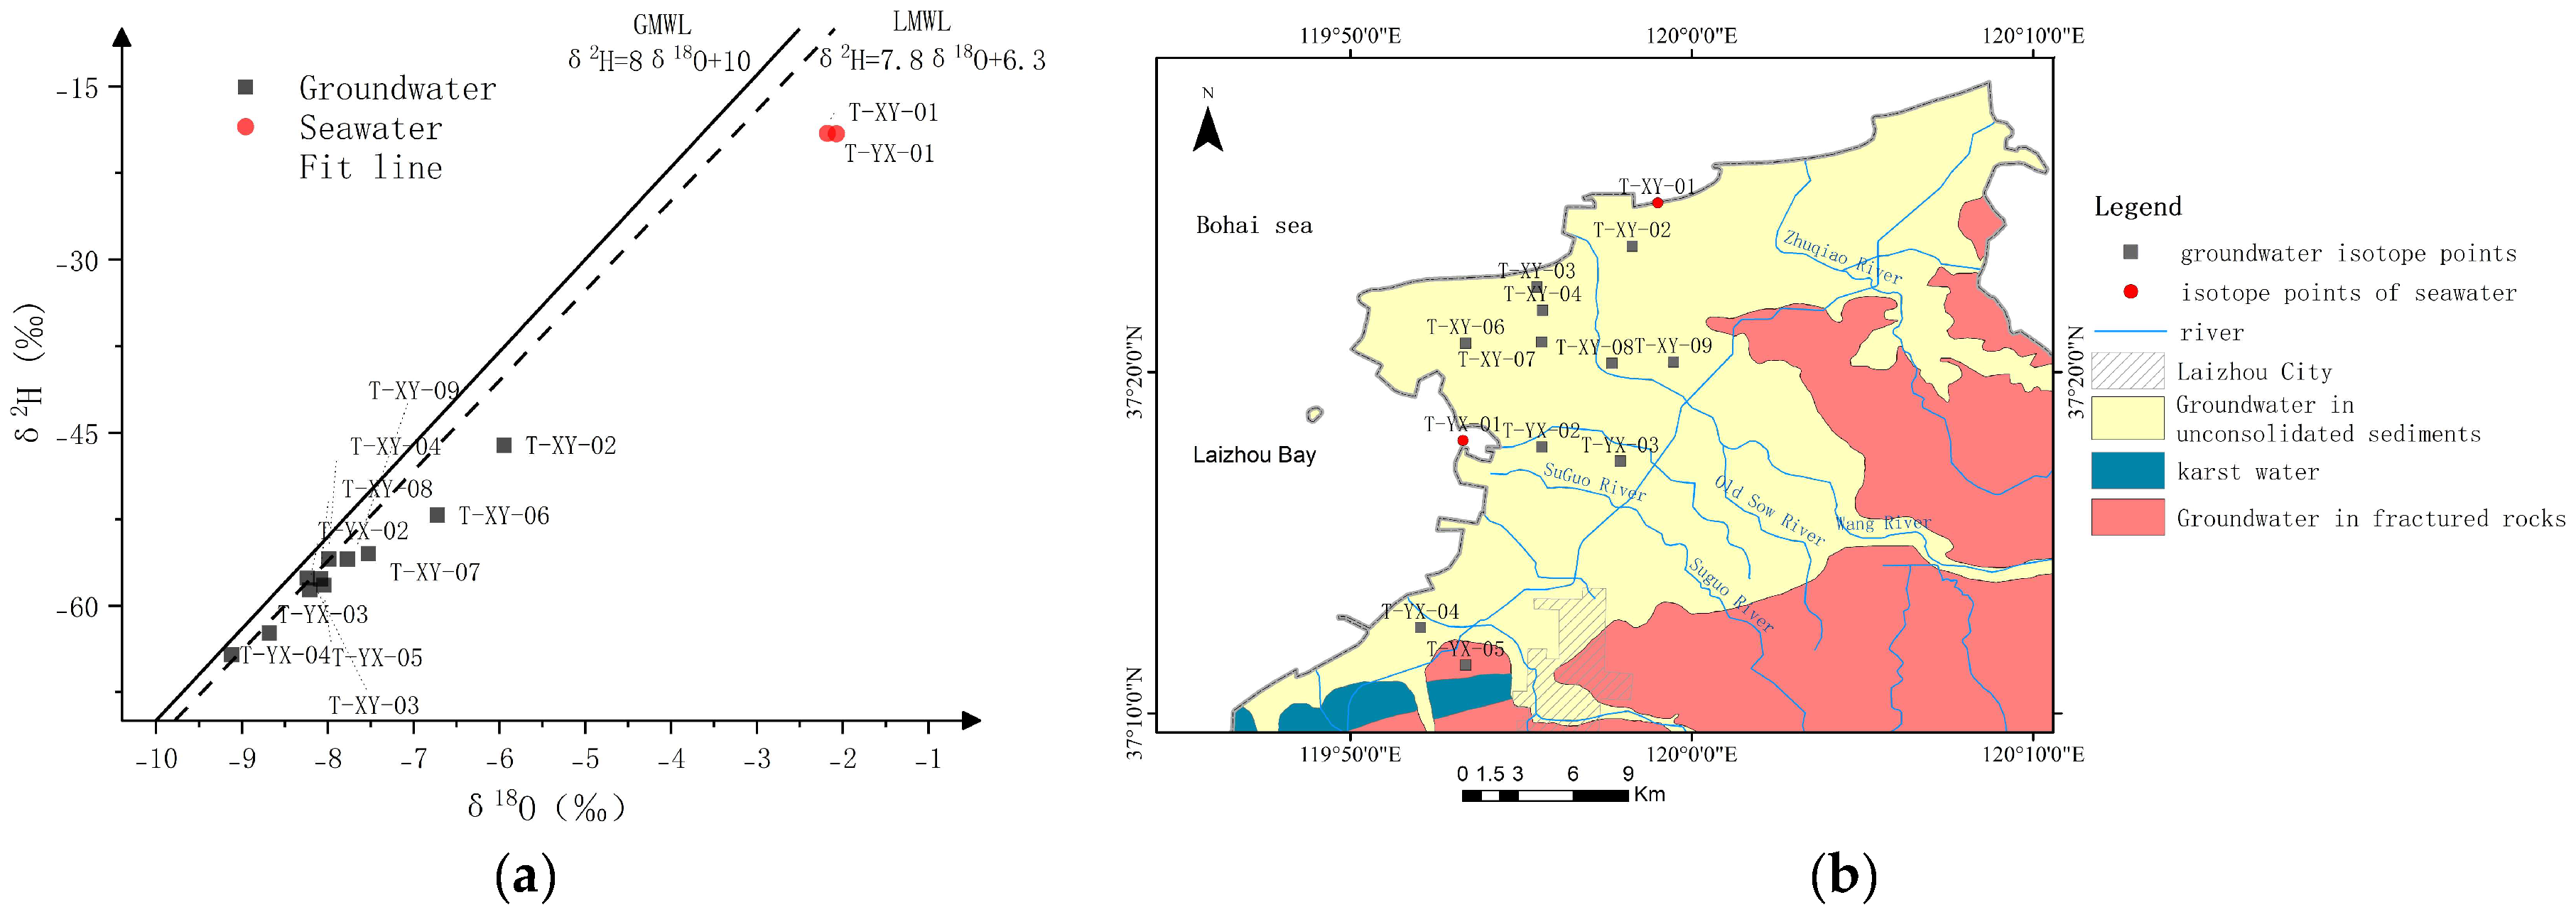
where Rsample and Rstandard are the abundance ratios of the water sample and standard. The more enriched the heavy isotopes, the higher the δ-value. In 1961, Craig found that the composition of δ2H and δ18O in atmospheric precipitation in North America showed a linear relationship of δ2H = 8δ18O + 10, known as the Global Atmospheric Precipitation Line (GMWL), or Craig line. In addition, each region also has a regional atmospheric precipitation line (LMWL), and the expression of the local atmospheric precipitation line (LMWL) in the Gulf of Lehigh is: δ2H = 7.8δ18O + 6.3 [24].

4. Results and Discussion

Groundwater chemistry in fresh groundwater and seawater intrusion areas has different characteristics, and analyzing the characteristics of groundwater chemistry is of great significance for seawater intrusion studies. Groundwater was categorized into freshwater TDS (g/L) < 1, brackish water TDS (g/L) 1–3, and saline water TDS (g/L) > 3 based on TDS values [49]. The groundwater samples were categorized. Among the 115 samples in the 2020 water-abundance period, 55 samples were fresh water, accounting for 47.83%, 52 samples were brackish water, accounting for 45.22%, and eight samples were saline water, accounting for 6.95%.

4.1. Hydrochemical Composition

The pH value (Table 3) of the groundwater samples varied from 6.18 to 8.88, with an average value of 7.07. The pH value in the study area tended to be stable in general, and showed a pattern of change from weakly acidic to weakly alkaline; the TDS value varied from 276 mg/L to 6674.9 mg/L, with an average value of 1346.16 mg/L, and the maximum value was about 24.2 times the minimum value.
The changes of cation concentration in the groundwater samples in the study area were as follows: TDS < 1 g/L (Table 4), Ca2+ > Na+ > Mg2+ > K+ in descending order, with Ca2+ occupying the main advantage; 1 g/L < TDS < 3 g/L (Table 5), Ca2+ > Na+ > Mg2+ > K+ in descending order, with Ca2+ occupying the main advantage; some samples with Na+ > Ca2+ > K+, and some samples with Na+ > Ca2+ > K+. Ca2+ > Na+ > Mg2+ > K+, with Ca2+ dominating, and Na+ > Ca2+ in some of the samples; the concentrations of cations in groundwater with TDS > 3 g/L (Table 6) were, in descending order, Na+ > Ca2+ > Mg2+ > K+, and Mg2+ > Ca2+ in some of the samples.
The anion concentration of groundwater samples varied as follows: TDS < 1 g/L (Table 4), HCO3 > Cl > SO42−, SO42−, in which the concentration of some samples was higher than that of Cl or HCO3; TDS > 1 g/L, Cl and SO42− > HCO3, SO42− and Cl concentration of different samples had their own advantages compared to each other; SO42− and Cl concentrations of different samples had their own advantages.

4.2. Water Chemistry Type

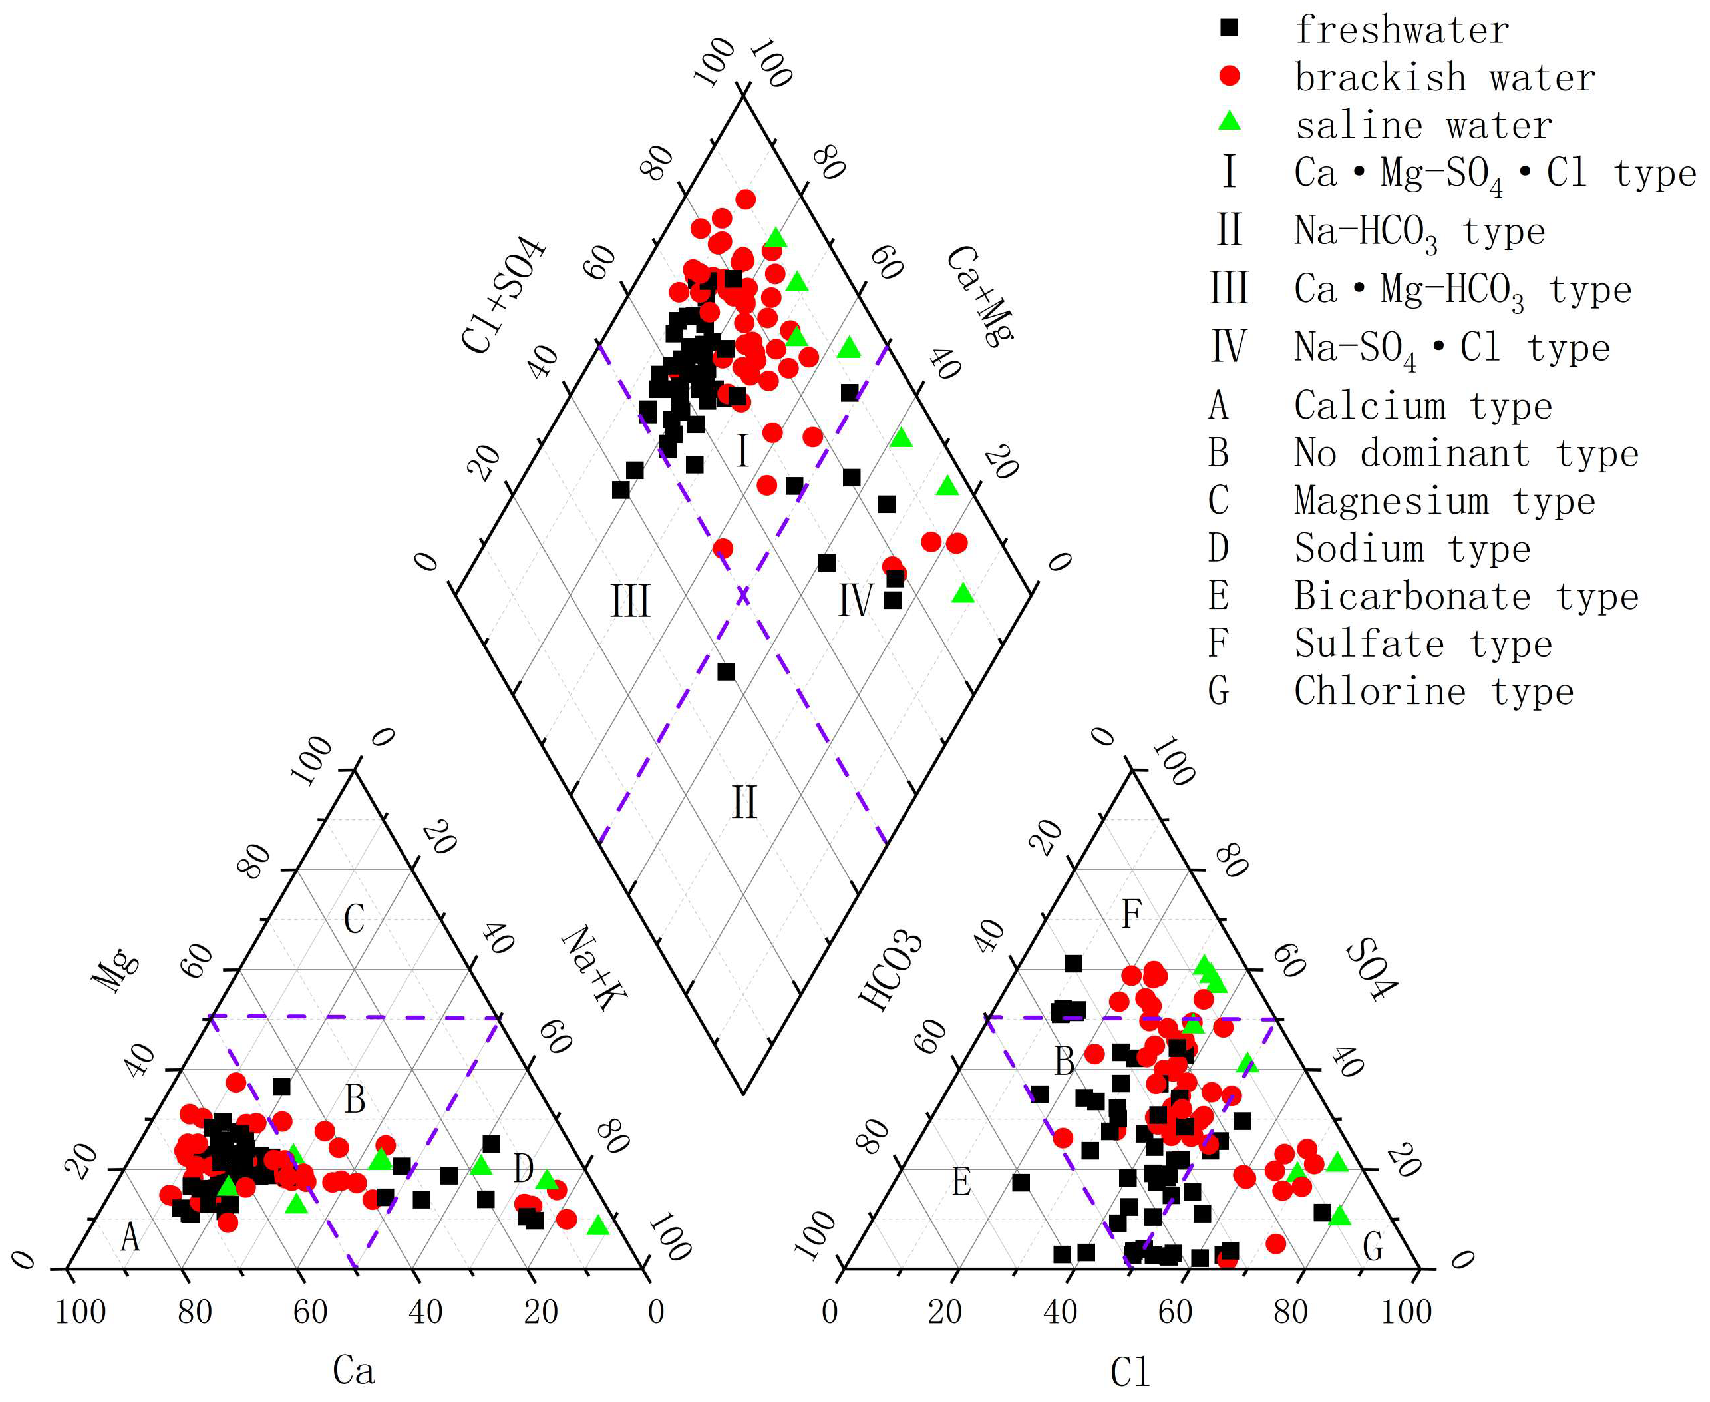
From Figure 4, it can be seen that the cations of freshwater samples of groundwater samples are dominated by Ca2+, and there is no obvious dominant anion; the cations of brackish water samples are dominated by Ca2+, and the anions are dominated by Cl and SO42−; and the cations of saline water samples are dominated by Na+ and Ca2+, and the anions are dominated by Cl and SO42−.
Combined with the results of previous research and the results of the present analysis, it is believed that under the influence of aerosol diffusion by the sea breeze [40,50], the chemical type of the unpolluted natural groundwater in the northern part of Laizhou City is the Ca-HCO3·Cl type. The Piper diagram reveals that cations in freshwater and brackish water samples are dominated by Ca2+, with groundwater samples concentrated in Zone I. Based on the characteristics of major ions, it is inferred that the higher Ca2+ concentration in brackish water may result from cation exchange [40]. Combined with Shukarev classification, from freshwater to saline water, the groundwater chemistry transitions from Ca-HCO3·Cl-type water to Ca·Na-SO4·Cl-type water, and finally to Na-Cl-type water.
Groundwater samples occupy 40 percent of the freshening phase and 60 percent of the intrusion phase, with intrusion dominating. Groundwater samples occupy 13 of the 16 phases in the hydrochemical evolution diagram (Figure 5). The main hydrochemical facies of 115 groundwater samples are Ca-MixCl, Ca-MixHCO3/MixSO4, Ca-HCO3/SO4, Ca-Cl, and Na-Cl, which accounted for 83.48% of the total samples. There were 27 samples of Ca-MixCl phase, 26 samples of Ca-MixHCO3/MixSO4 phase, 11 samples of Ca-MixHCO3 phase, and 15 samples of Ca-MixSO4 phase. Also, 46.09% of the total samples were Ca-MixHCO3/MixSO4 and Ca-MixCl facies samples, 46.09% of the total samples were Ca-HCO3/MixSO4 facies samples of 17 samples, 15 samples were Ca-SO4 facies, and only two samples were Ca-HCO3 facies. There were 15 Ca-Cl facies samples and 11 Na-Cl facies samples. Groundwater hydrochemical facies are characterized by complexity and variability.
As can be seen from Figure 6, most of the groundwater samples in the study area are evolving from Ca-HCO3-type water to Ca-Cl-type water, with mixing dominating the invasion phase. During the desalination stage, positive cation exchange has a greater influence on the groundwater chemistry type. Only very few areas of the study area exhibit Na-HCO3-type water, indicating that there is no obvious trend of desalination of brackish water in the study area, which may be attributed to insufficient groundwater recharge.

4.3. Hydrogeochemical Variations

The Na/Cl ratio has no specific pattern in the scatter plot (Figure 6a). The range of Na/Cl ratios in the study area is 0.11–1.88, and 75.65% of the groundwater samples have Na/Cl ratios less than 0.86, indicating that the study area is mainly affected by seawater intrusion [51]. Furthermore, 21.74% of the groundwater samples have Na/Cl ratios equal to or greater than 1, and areas with high Na/Cl ratios (>1) may be contaminated by anthropogenic activities [51].
The Mg/Cl ratios in the scatter plots showed a decrease with the increase of Cl concentration and converged around the seawater ratio line (Figure 6b). Typical Mg/Ca ratios for seawater range from 4.5 to 5, while freshwater Mg/Ca ratios are less than 1 [52]. The Mg/Ca ratios in the study area ranged from 0.14 to 2.35 and did not tend to be close to the seawater Mg/Ca ratio line with increasing Cl concentration (Figure 6c), indicating that a considerable number of samples had excess Ca2+ and deficient Mg2+, which was presumably affected by the mixing of seawater and freshwater, as well as by the influence of Mg2+ and the influence of seawater and freshwater mixing. It is assumed that Mg2+ is affected by the mixing of seawater and freshwater, as well as by the cation exchange.
The K/Cl ratio in the scatter plot shows an increase with Cl concentration and a certain degree of proximity to the seawater dilution line (Figure 7a), suggesting that the K+ may be primarily sourced from invaded seawater and influenced by cation exchange.
The Ca/Cl ratios all show a pattern of decreasing with increasing Cl concentration in the scatter plots, and the Ca/Cl ratios of some samples were higher than the seawater ratio line (Figure 7b). Ca2+ is inferred to be affected by seawater intrusion and cation exchange in conjunction with water chemistry components and the location of groundwater Piper diagrams.
The HCO3/Cl ratios in the scatter plots all show a pattern of decreasing with increasing Cl concentration, and HCO3 is higher than the seawater ratio line in the scatter plots of the groundwater samples and shows a certain linear pattern (Figure 7c), which indicates that HCO3 is mainly derived from freshwater and mineral dissolution, and that the content is affected by seawater intrusion mainly because of the mixing of seawater and freshwater from the groundwater in the aquifer.
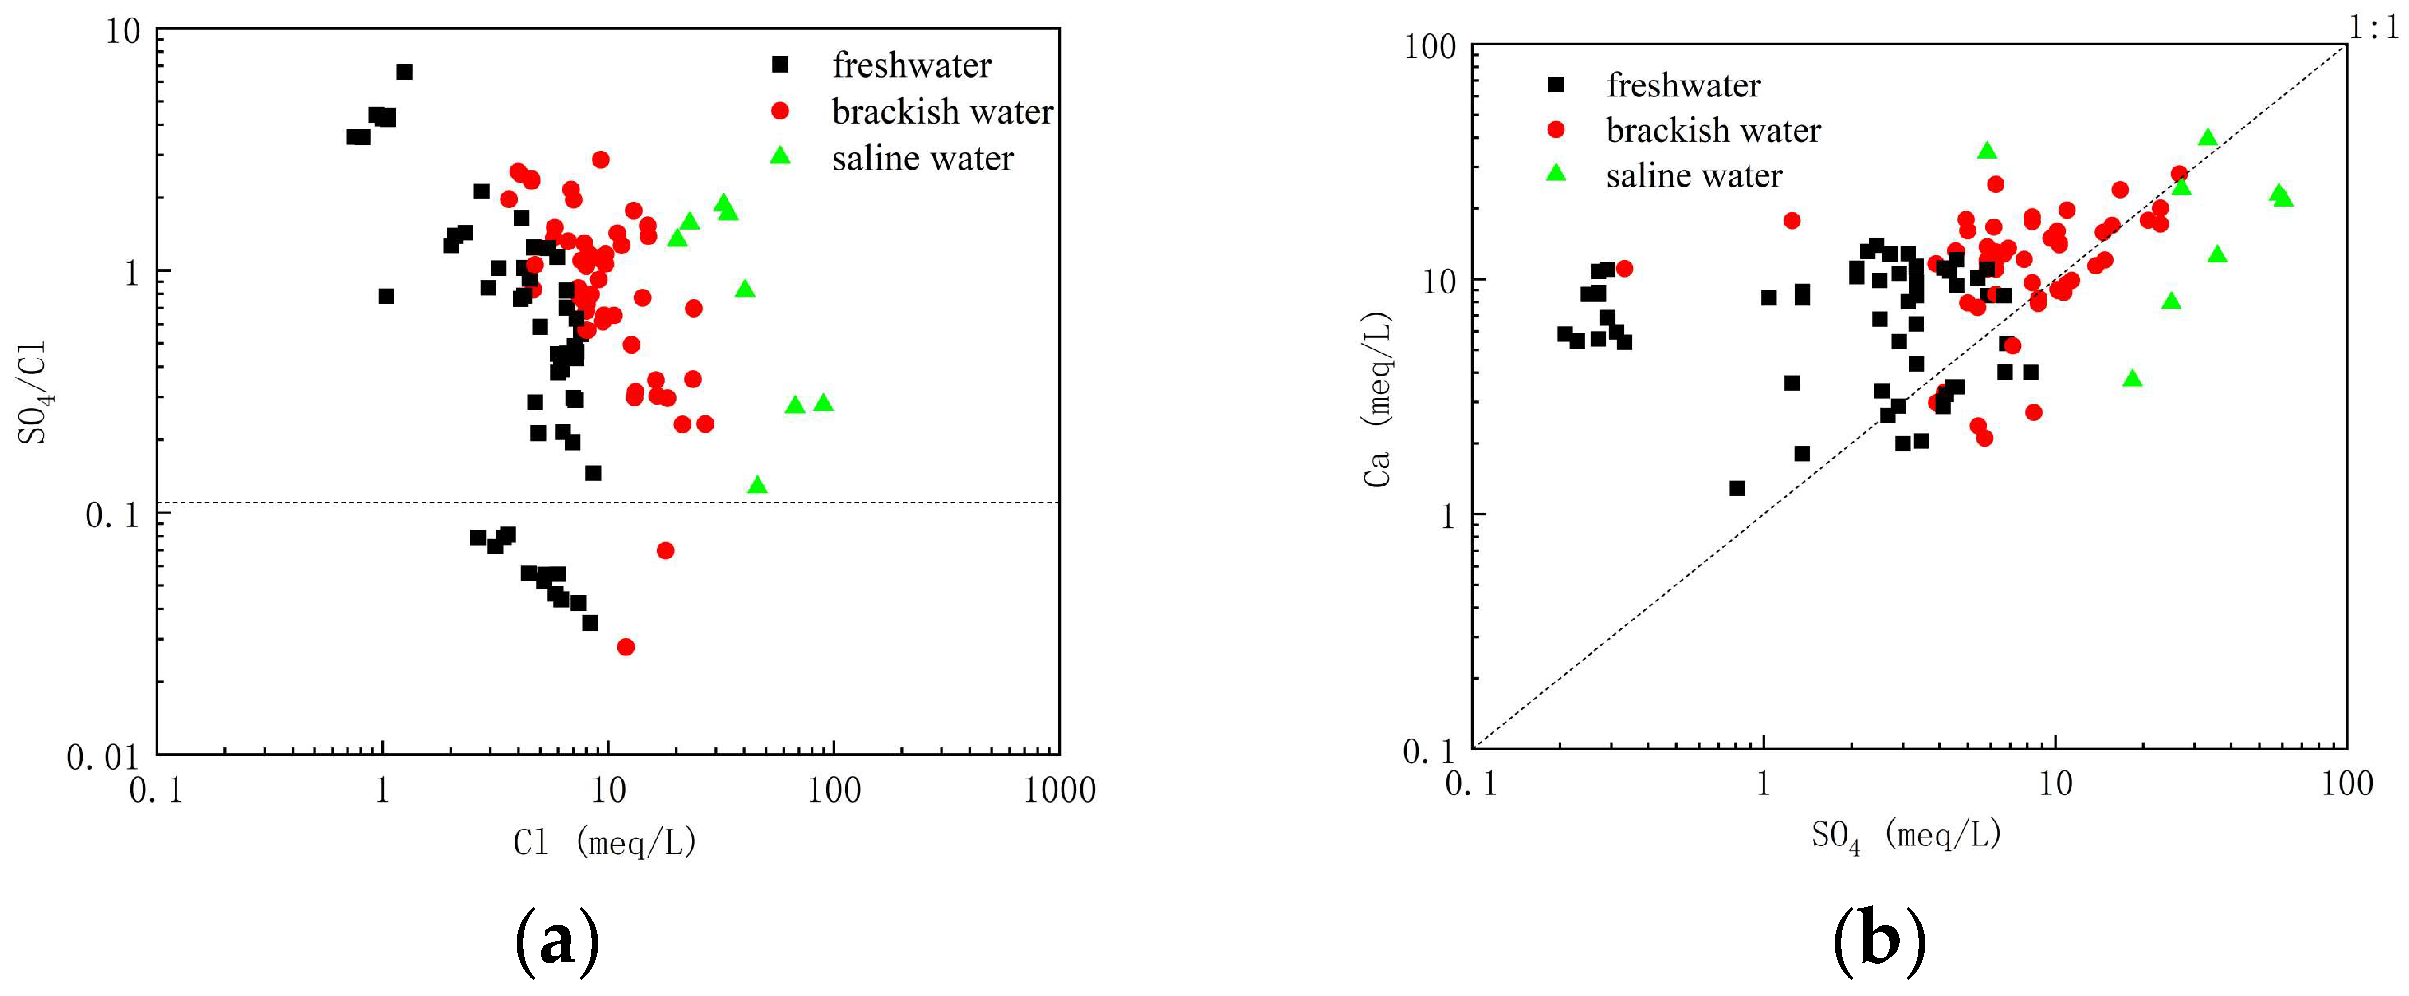
The SO4/Cl ratios in the scatter plot show an increase in Cl concentration and a certain degree of closeness to the seawater ratio line of the pattern (Figure 8a), indicating that SO42− originated from invaded seawater. Some samples fell above the 1:1 line, suggesting that dissolution of gypsum is one of the sources of SO42; in addition, some samples were far above the 1:1 line (Figure 8b), suggesting that they may be affected by human activities (mariculture).
From Figure 9, it can be seen that most of the groundwater samples fall within the rock-dominated and evaporation-dominated zones. Freshwater and brackish water are dominated by rock, and saline water is mainly affected by evaporation dominance. As TDS increases, groundwater changes from rock-dominated to evaporation-dominated. It shows the same pattern as the southern coast of Leizhou Bay [33].

4.4. Scope of Seawater Intrusion

The distribution of GQISWI values for the 115 samples ranged from 49.34 to 85.34, with a mean value of 74.18 and a median value of 76.33. The main types of groundwater in the study area are freshwater and mixed groundwater (Figure 10), and only one area with GQISWI values lower than 50 exists in the southwestern part of Cangshang. Mixed groundwater is mainly distributed in the western part of the city of Laizhou, along the area from Zhuyueyi village, over the west to the northern part of Zhuqiao town.

4.5. Sources of Groundwater Recharge

The theoretical values of δ2H and δ18O of seawater are both 0, but the near-shore surface seawater is affected by land surface water and groundwater, which will deviate from the theoretical values. Two surface seawater hydrogen and oxygen isotope samples were collected: T-XY-01 had a δ2H value of −19.07 ‰ and a δ18O value of −2.18 ‰; T-YX-01 had a δ2H value of −19.10 ‰ and a δ18O value of −2.07 ‰.
The δ2H value of groundwater samples: −9.12 ‰~−5.94 ‰, mean value −7.85 ‰; δ18O value: −62.40 ‰~−46.08 ‰, mean value −56.76 ‰. It can be seen that the hydrogen and oxygen isotope values of the groundwater samples all fall near or below the global atmospheric precipitation line and the regional atmospheric precipitation line (Figure 11), which indicates that atmospheric precipitation is the main source of groundwater.
In addition, points 7, 6, and 2 deviate from the regional atmospheric precipitation line, and, according to the location of the sampling points, this is probably due to the fact that the groundwater in the region is subjected to the effect of evaporation and fractionation.

5. Conclusions

The distribution of groundwater samples in Piper’s trilinear map indicates the complexity of groundwater chemistry types in the study area. From freshwater to saline water, the groundwater chemistry transitions from Ca-HCO3·Cl-type water to Ca·Na-SO4·Cl-type water, and finally to Na-Cl-type water. The hydrochemical evolution diagram shows that most of the groundwater samples in the study area are in the invasive stage, and the hydrochemical phases of the groundwater samples are complex. Ca-MixCl and Ca-Cl phases are the major hydrochemical phases of the groundwater samples.
The main ions in the groundwater in the study area are controlled by seawater intrusion: Na+, Cl, K+, Mg2+, SO42− are mainly derived from seawater intrusion, and are affected by human activities, cation exchange, and water–rock interactions; HCO3 is mainly derived from freshwater and mineral dissolution, and its content is affected by seawater intrusion; changes in Ca2+ content are affected by seawater intrusion, cation exchange, and mineral dissolution. As TDS increases, groundwater changes from rock-dominated to evaporation-dominated.
The current status of seawater intrusion in the study area was evaluated using the seawater intrusion groundwater quality index (GQISWI), and seawater intrusion was mainly concentrated in the northern part of the study area. In view of the extent of seawater intrusion in the past, it is recommended that the monitoring of seawater intrusion in the northern part of the study area be strengthened and that groundwater recharge to the study area be increased.
Hydrogen and oxygen isotope data of groundwater and seawater showed that the main source of recharge in the study area is atmospheric precipitation.

Author Contributions

Software, X.H. and D.Z.; Investigation, Z.Z., Y.L. and H.Z.; Data curation, Y.Z. and K.S.; Writing—original draft, X.H.; Writing—review and editing, X.H. and L.K.; Project administration, L.Z. All authors have read and agreed to the published version of the manuscript.

Funding

This study was supported by Open Research Fund of Observation and Research Station of Seawater Intrusion and Soil Salinization, Laizhou Bay, Ministry of Natural Resources (2024LZORS003), and the China Geological Survey program (DD20242961, DD20243124, and DD20208080).

Data Availability Statement

The original contributions presented in this study are included in the article. Further inquiries can be directed to the corresponding author.

Acknowledgments

The authors give their most sincere thanks to the editors and reviewers for their contributions to the improvement of this article.

Conflicts of Interest

The authors declare no conflicts of interest.

Abbreviations

The following abbreviations are used in this manuscript:
GQISWIThe groundwater quality index for seawater intrusion

References

  1. Cao, T.; Han, D.; Song, X. Past, present, and future of global seawater intrusion research: A bibliometric analysis. J. Hydrol. 2021, 603 Pt A, 126844. [Google Scholar] [CrossRef]
  2. Jeen, S.-W.; Kang, J.; Jung, H.; Lee, J. Review of Seawater Intrusion in Western Coastal Regions of South Korea. Water 2021, 13, 761. [Google Scholar] [CrossRef]
  3. Shi, L.; Jiao, J.J. Seawater intrusion and coastal aquifer management in China: A review. Environ. Earth Sci. 2014, 72, 2811–2819. [Google Scholar] [CrossRef]
  4. Zhang, Z.; Liu, C.; Yi, L.; Ren, H.; Li, S.; Liu, N.; Ren, L.; Liu, J.; Li, R.; Dong, Y. Hydrochemical fingerprints and health risk assessment of groundwater contamination in the Bohai Sea region, China. Mar. Pollut. Bull. 2025, 212, 117559. [Google Scholar] [CrossRef] [PubMed]
  5. Yamanaka, M.; Bottrell, S.H.; Wu, J.H.; Kumagai, Y.; Mori, K.; Satake, H. Chlorine stable isotope evidence for salinization processes of confined groundwater in southwestern Nobi Plain aquifer system, central Japan. J. Hydrol. 2014, 519, 295–306. [Google Scholar] [CrossRef]
  6. V, S.P.; S.K, A.; S, R.A.; R.J, J.J. An assessment of vulnerability in aquifer using GALDIT model in aquifer zones between Mookkaiyur to Tharuvaikulam, Southeast coast of India. J. Coast. Conserv. 2025, 29, 5. [Google Scholar] [CrossRef]
  7. Hossain, M.I.; Reza, A.H.M.S.; Shafiuzzaman, S.M.; Islam, M.S.-U.; Rahman, M.A. The effects of seawater intrusion on sustainable coastal areas: A comprehensive study on Bagerhat district, Bangladesh. Reg. Stud. Mar. Sci. 2025, 82, 104038. [Google Scholar] [CrossRef]
  8. Souid, F.; Telahigue, F.; Agoubi, B.; Kharroubi, A. Isotopic behavior and self-organizing maps for identifying groundwater salinization processes in Jerba Island, Tunisia. Environ. Earth Sci. 2020, 79, 175. [Google Scholar] [CrossRef]
  9. Mountadar, S.; Younsi, A.; Hayani, A.; Siniti, M.; Tahiri, S. Groundwater salinization process in the coastal aquifer Sidi Abed-Ouled Ghanem (Province of El Jadida, Morocco). J. Afr. Earth Sci. 2018, 147, 169–177. [Google Scholar] [CrossRef]
  10. Zha, X.; Hernández Anguiano, J.H.; Padilla Benítez, F.; Cruz-Falcón, A.; Miranda-Avilés, R.; Mendoza Cantú, M.E.; Perera-Burgos, J.A.; Liao, X.; Navarro-Céspedes, J.M.; Acosta-Reyes, M.A.; et al. Status of seawater intrusion in Mexico: A review. J. Hydrol.-Reg. Stud. 2025, 57, 102189. [Google Scholar] [CrossRef]
  11. Cruz, J.V.; Andrade, C. Groundwater salinization in Graciosa and Pico islands (Azores archipelago, Portugal): Processes and impacts. J. Hydrol.-Reg. Stud. 2017, 12, 69–87. [Google Scholar] [CrossRef]
  12. Gil-Márquez, J.M.; Barberá, J.A.; Andreo, B.; Mudarra, M. Hydrological and geochemical processes constraining groundwater salinity in wetland areas related to evaporitic (karst) systems. A case study from Southern Spain. J. Hydrol. 2017, 544, 538–554. [Google Scholar] [CrossRef]
  13. Wang, Y.; Tong, J.; Hu, B.X.; Dai, H. Combining Isotope and Hydrogeochemistry Methods to Study the Seawater Intrusion: A Case Study in Longkou City, Shandong Province, China. Water 2022, 14, 789. [Google Scholar] [CrossRef]
  14. Xiong, G.; Chen, G.; Wu, J.; Wang, Z.; Yu, H.; Fu, T.; Liu, W.; Xu, X.; Hou, G.; Yang, Y.; et al. Identifying the characteristics and potential risk of seawater intrusion for southern China by the SBM-DEA model. Sci. Total Environ. 2022, 844, 157205. [Google Scholar] [CrossRef]
  15. Al-Taliby, W.; Dekhn, H. Modeling of Groundwater Pollution by Former Seawater in Submarine Groundwater Discharge Driven by Saltwater Intrusion. J. Ecol. Eng. 2022, 23, 166–175. [Google Scholar] [CrossRef]
  16. Zang, Y.; Li, M. Numerical assessment of compressed air injection for mitigating seawater intrusion in a coastal unconfined aquifer. J. Hydrol. 2021, 595, 125964. [Google Scholar] [CrossRef]
  17. Yamanaka, M.; Kumagai, Y. Sulfur isotope constraint on the provenance of salinity in a confined aquifer system of the southwestern Nobi Plain, central Japan. J. Hydrol. 2006, 325, 35–55. [Google Scholar] [CrossRef]
  18. Wang, Y.; Jiao, J.J. Origin of groundwater salinity and hydrogeochemical processes in the confined Quaternary aquifer of the Pearl River Delta, China. J. Hydrol. 2012, 438–439, 112–124. [Google Scholar] [CrossRef]
  19. Zhao, Q.; Su, X.; Kang, B.; Zhang, Y.; Wu, X.; Liu, M. A hydrogeochemistry and multi-isotope (Sr, O, H, and C) study of groundwater salinity origin and hydrogeochemcial processes in the shallow confined aquifer of northern Yangtze River downstream coastal plain, China. Appl. Geochem. 2017, 86, 49–58. [Google Scholar] [CrossRef]
  20. Zeynolabedin, A.; Ghiassi, R.; Norooz, R.; Najib, S.; Fadili, A. Evaluation of geoelectrical models efficiency for coastal seawater intrusion by applying uncertainty analysis. J. Hydrol. 2021, 603, 127086. [Google Scholar] [CrossRef]
  21. Balasubramanian, M.; Sridhar, S.G.D.; Ayyamperumal, R.; Karuppannan, S.; Gopalakrishnan, G.; Chakraborty, M.; Huang, X. Isotopic signatures, hydrochemical and multivariate statistical analysis of seawater intrusion in the coastal aquifers of Chennai and Tiruvallur District, Tamil Nadu, India. Mar. Pollut. Bull. 2022, 174, 113232. [Google Scholar] [CrossRef] [PubMed]
  22. Wang, Z.; Su, Q.; Wang, S.; Gao, Z.; Liu, J. Coupling hydrochemistry and stable isotopes (δ2H and δ18O) to identify the major factors affecting the hydrochemical evolution of groundwater in the Western Yellow Sea Coast, China. Appl. Geochem. 2022, 138, 105221. [Google Scholar] [CrossRef]
  23. Zhang, Z.; Yi, L. Research methods for seawater intrusion in China and recommendations for novel radium-radon technologies. Mar. Environ. Res. 2024, 198, 106530. [Google Scholar] [CrossRef]
  24. Han, D.; Kohfahl, C.; Song, X.; Xiao, G.; Yang, J. Geochemical and isotopic evidence for palaeo-seawater intrusion into the south coast aquifer of Laizhou Bay, China. Appl. Geochem. 2011, 26, 863–883. [Google Scholar] [CrossRef]
  25. Yin, Z.; Geng, S.; Zou, B.; Lin, W.; Cai, Z.; Yang, M.; Cheng, R.; Li, B.; Ning, P. Study on Seawater Intrusion in the Coastal Area of Laizhou City; Ocean Press: Beijing, China, 1992. [Google Scholar]
  26. Zhang, Z.; Wang, L. Driving Mechanism of Land Use/Coverage Change in Southern Laizhou Bay. Sci. Geogr. Sin. 2007, 5, 40. [Google Scholar]
  27. Du, Y.; Ma, T.; Chen, L.; Shan, H.; Xiao, C.; Lu, Y.; Liu, C.; Cai, H. Genesis of salinized groundwater in Quaternary aquifer system of coastal plain, Laizhou Bay, China: Geochemical evidences, especially from bromine stable isotope. Appl. Geochem. 2015, 59, 155–165. [Google Scholar] [CrossRef]
  28. Chen, Q.; Wei, J.; Wang, H.; Shi, L.; Gao, Z.; Liu, S.; Ning, F.; Jia, C.; Ji, Y.; Dong, F.; et al. Discussion on the Fluorosis in Seawater-Intrusion Areas Along Coastal Zones in Laizhou Bay and Other Parts of China. Int. J. Environ. Res. 2019, 13, 435–442. [Google Scholar] [CrossRef]
  29. Xue, Y.; Xie, C.; Wu, J.; Liu, P.; Shi, H. Seawater Intrusion and Saltwater-Freshwater Interface Migration Mechanism Research; Nangjing University Press: Nanjing, China, 1991. [Google Scholar]
  30. Fu, T.; Fu, Y.; Li, C.; Dong, M.; Qi, C.; Wang, Z.; Chen, G.; Su, Q.; Xu, X.; Yu, H. Seawater intrusion-triggered high fluoride groundwater development on the eastern coast of China. Environ. Sci. Pollut. Res. 2024, 31, 11307–11320. [Google Scholar] [CrossRef]
  31. Sun, Q.; Gao, M.; Wen, Z.; Hou, G.; Dang, X.; Liu, S.; Zhao, G. Hydrochemical evolution processes of multiple-water quality interfaces (fresh/saline water, saline water/brine) on muddy coast under pumping conditions. Sci. Total Environ. 2023, 857, 159297. [Google Scholar] [CrossRef]
  32. Yang, F.; Liu, S.; Jia, C.; Gao, M.; Chang, W.; Wang, Y. Hydrochemical characteristics and functions of groundwater in southern Laizhou Bay based on the multivariate statistical analysis approach. Estuar. Coast. Shelf Sci. 2021, 250, 107153. [Google Scholar] [CrossRef]
  33. Wang, Z.; Wang, S.; Liu, W.; Su, Q.; Tong, H.; Xu, X.; Gao, Z.; Liu, J. Hydrochemical Characteristics and Irrigation Suitability Evaluation of Groundwater with Different Degrees of Seawater Intrusion. Water 2020, 12, 3460. [Google Scholar] [CrossRef]
  34. Liu, S.; Tang, Z.; Gao, M.; Hou, G. Evolutionary process of saline-water intrusion in Holocene and Late Pleistocene groundwater in southern Laizhou Bay. Sci. Total Environ. 2017, 607–608, 586–599. [Google Scholar] [CrossRef]
  35. Han, D.M.; Song, X.F.; Currell, M.J.; Yang, J.L.; Xiao, G.Q. Chemical and isotopic constraints on evolution of groundwater salinization in the coastal plain aquifer of Laizhou Bay, China. J. Hydrol. 2014, 508, 12–27. [Google Scholar] [CrossRef]
  36. Xue, Y.W.; Xie, J.; Xie, C.; Zhang, Y. Research on Seawater Intrusion and Saline Intrusion along the Coast of Laizhou Bay. Chin. Sci. Bull. 1997, 42, 2360–2368. [Google Scholar]
  37. Wang, T.; Dai, W.; Bai, Y. Analysis of Seawater Intrusion Status and Development Trends in the Eastern Coast of Laizhou Bay. West. Resour. 2020, 5. [Google Scholar]
  38. Shu, L.; Huang, L.; Chen, H.; Lu, C.; Liu, B. Risk Assessment and Zoning of Seawater Intrusion Hazard in Coastal Region of Laizhou City Based on AHP-EWM Method. J. Jilin Univ. (Earth Sci. Ed.) 2023, 53, 16. [Google Scholar] [CrossRef]
  39. Wang, W.; Feng, L.; Lin, Y. This study presents an analysis of seawater intrusion status in Yantai City and discusses engineering and ecological prevention measures. Ground Water 2018, 40, 3. [Google Scholar]
  40. Wu, J.; Xue, Y.; Liu, P.; Wang, J.; Jiang, Q.; Shi, H.; Ning, P. Development and Hydrochemical Characteristic of Seawater Intrusion in Longkou-Laizhou District. J. NanJing Univ. (Nat. Sci.) 1994, 30, 98–110. [Google Scholar]
  41. Li, F. Monitoring and Numerical Simulation of Saltwater Intrusion in the Eastern Coast of Laizhou Bay, China; Ocean University of China: Qingdao, China, 2005. [Google Scholar]
  42. Giménez-Forcada, E. Space/time development of seawater intrusion: A study case in Vinaroz coastal plain (Eastern Spain) using HFE-Diagram, and spatial distribution of hydrochemical facies. J. Hydrol. 2014, 517, 617–627. [Google Scholar] [CrossRef]
  43. Giménez-Forcada, E. Dynamic of Sea Water Interface using Hydrochemical Facies Evolution Diagram. Groundwater 2010, 48, 212–216. [Google Scholar] [CrossRef]
  44. Giménez-Forcada, E.; Sánchez San Román, F.J. An Excel Macro to Plot the HFE-Diagram to Identify Sea Water Intrusion Phases. Groundwater 2015, 53, 819–824. [Google Scholar] [CrossRef] [PubMed]
  45. Aladejana, J.A.; Kalin, R.M.; Sentenac, P.; Hassan, I. Groundwater quality index as a hydrochemical tool for monitoring saltwater intrusion into coastal freshwater aquifer of Eastern Dahomey Basin, Southwestern Nigeria. Groundw. Sustain. Dev. 2021, 13, 100568. [Google Scholar] [CrossRef]
  46. Le, T.T.V.; Lertsirivorakul, R.; Bui, T.V.; Schulmeister, M.K. An Application of HFE-D for Evaluating Sea Water Intrusion in Coastal Aquifers of Southern Vietnam. Groundwater 2020, 58, 1012–1022. [Google Scholar] [CrossRef]
  47. Gibbs, R.J. Mechanisms Controlling World Water Chemistry. Science 1970, 170, 1088–1090. [Google Scholar] [CrossRef]
  48. Tomaszkiewicz, M.; Abou Najm, M.; El-Fadel, M. Development of a groundwater quality index for seawater intrusion in coastal aquifers. Environ. Model. Softw. 2014, 57, 13–26. [Google Scholar] [CrossRef]
  49. Gao, M.; Zhang, Y.; Liu, S.; Wang, S.; Kong, X.; Zhao, J.; Guo, F. Palaeogeographic Condition for Origin of Underground Brine in Southern Coast of Laizhou Bay, Bohai Sea. Geol. Rev. 2015, 61, 393–400. [Google Scholar] [CrossRef]
  50. Bouzourra, H.; Bouhlila, R.; Elango, L.; Slama, F.; Ouslati, N. Characterization of mechanisms and processes of groundwater salinization in irrigated coastal area using statistics, GIS, and hydrogeochemical investigations. Environ. Sci. Pollut. Res. 2015, 22, 2643–2660. [Google Scholar] [CrossRef]
  51. Asare, A.; Appiah-Adjei, E.K.; Ali, B.; Owusu-Nimo, F. Assessment of seawater intrusion using ionic ratios: The case of coastal communities along the Central Region of Ghana. Environ. Earth Sci. 2021, 80, 307. [Google Scholar] [CrossRef]
  52. Jimmy, J.; Vincentive, P. Coastal Hydrogeology; Cambridge University Press: Cambridge, UK, 2019. [Google Scholar] [CrossRef]
Figure 1. Location map of the study area.
Water 17 02954 g001
Figure 2. Hydrochemical facies evolution diagram. The hydrochemical constituents of the entire HFE-D are as follows: 1: Na-HCO3/SO4, 2: Na-MixHCO3/MixSO4, 3: Na-MixCl, 4: Na-Cl, 5: MixNa-HCO3/SO4, 6: MixNa-MixHCO3/MixSO4, 7: MixNa-MixCl, 8: MixNa-Cl, 9: MixCa-HCO3/SO4, 10: MixCa-MixHCO3/MixSO4, 11: MixCa-MixCl, 12: MixCa-Cl, 13: Ca-HCO3/SO4, 14: Ca-MixHCO3/MixSO4, 15: Ca-MixCl, 16: Ca-Cl.
Water 17 02954 g002
Figure 3. Development of the GQIPiper(mix) and GQIPiper(dom) resultant domains.
Water 17 02954 g003
Figure 4. Piper triple line map of groundwater hydrochemistry [22].
Water 17 02954 g004
Figure 5. The hydrochemical evolution facies diagram.
Water 17 02954 g005
Figure 6. The relationship between main ion ratios to Cl and Cl: (a) Na+/Cl and Cl; (b) Mg2+/Cl and Cl; (c) Mg2+/ Ca2+ and Cl. The horizontal dotted line indicates the seawater ratio line.
Water 17 02954 g006
Figure 7. The relationship between main ion ratios to Cl and Cl: (a) K+/Cl and Cl; (b) Ca2+/Cl and Cl; (c) HCO3/Cl and Cl. The horizontal dotted line indicates the seawater ratio line.
Water 17 02954 g007
Figure 8. The relationship between main ion ratios: (a) SO42−/Cl and Cl; (b) Ca2+ / SO42−. The horizontal dotted line indicates the seawater ratio line.
Water 17 02954 g008
Figure 9. Gibbs diagram.
Water 17 02954 g009
Figure 10. Spatial distribution of the extent of saltwater intrusion.
Water 17 02954 g010
Figure 11. δ2H and δ18O relation: (a) The relationship between δ2H and δ18O; (b) Map of isotope sampling point locations.
Water 17 02954 g011
Table 1. The limit of quantification (LOQ).
Test ItemsLOQ
Na+, K+0.5 mg/L
Ca2+4 mg/L
Mg2+3 mg/L
Cl3 mg/L
SO42−1 mg/L
HCO35 mg/L
TDS4 mg/L
Table 2. GQIPiper(mix) and GQIPiper(dom) to determine hydrogeochemical domains.
DomainGQIPiper(mix)GQIPiper(dom)
I50–10025–75
II0–5025–75
III25–7550–75
IV25–7525–50
V25–750–25
VI25–7575–100
Table 3. Groundwater chemical parameters (N = 115 in mg/L).
Ca2+Mg2+Na+K+HCO3SO42−ClTDSpH
Min25.76.921.20.476.271026.62766.18
Max786.57218.8121009070529123190.776674.98.88
Avg213.1352.47165.758.84291.81370.43358.371346.167.07
Med197.1942.5569.42.3283.7324025210236.98
Sd132.3439.33279.9913.72107.78465.55427.461162.020.48
CV(%)62.0075.00169.00155.0037.00126.00119.0086.007.00
Table 4. Freshwater chemical parameters (N = 55 in mg/L).
Ca2+Mg2+Na+K+HCO3SO42−ClTDSpH
Min25.706.9021.200.7076.2710.0026.60276.006.43
Max278.4062.48235.0031.00493.02395.00304.90999.717.94
Avg145.7531.4869.404.96247.90135.33167.94693.067.04
Med160.3231.1249.402.20247.12139.00177.27729.006.82
Sd69.2714.8052.106.3781.5196.7579.24204.560.44
CV(%)47.5347.0075.07128.4632.8871.5047.1829.526.24
Table 5. Brackish chemical parameters (N = 52 in mg/L).
Ca2+Mg2+Na+K+HCO3SO42−ClTDSpH
Min42.1022.4034.700.40111.0016.00129.001007.666.18
Max560.10167.80684.0047.20622.371278.00957.232827.938.88
Avg253.0459.24156.409.18317.36431.85373.651486.797.07
Med241.8455.25129.002.20305.40359.00324.311354.507.02
Sd112.1626.99140.0612.75102.06259.36190.39492.620.55
CV(%)44.3345.5689.55138.8432.1660.0650.9633.137.80
Table 6. Saline chemical parameters (N = 8 in mg/L).
Ca2+Mg2+Na+K+HCO3SO42−ClTDSpH
Min74.1069.29249.002.20272.00280.00719.703112.336.85
Max786.57218.812100.0090.00705.002912.003190.776674.907.65
Avg417.04152.75888.8833.33427.571587.501568.374922.107.24
Med445.25167.40628.0027.95433.451450.001322.725217.547.27
Sd248.0253.82664.5827.62144.79901.27838.651336.780.29
CV(%)59.4735.2374.7782.8933.8656.7753.4727.164.62
Disclaimer/Publisher’s Note: The statements, opinions and data contained in all publications are solely those of the individual author(s) and contributor(s) and not of MDPI and/or the editor(s). MDPI and/or the editor(s) disclaim responsibility for any injury to people or property resulting from any ideas, methods, instructions or products referred to in the content.