Article

Occurrence and Seasonal Variation of Picoplankton at Saiysad Freshwater in Taif City, Saudi Arabia

by
Najwa Al-Otaibi
1,2,3
1
Department of Biology, College of Science, Taif University, P.O. Box 11099, Taif 21944, Saudi Arabia
2
High Altitude Research Centre, Taif University, P.O. Box 11099, Taif 21944, Saudi Arabia
3
Health Sciences Research Centre, Taif University, P.O. Box 11099, Taif 21944, Saudi Arabia
Water 2025, 17(18), 2788; https://doi.org/10.3390/w17182788
Submission received: 14 August 2025 / Revised: 5 September 2025 / Accepted: 15 September 2025 / Published: 22 September 2025
(This article belongs to the Special Issue Freshwater Ecosystems—Biodiversity and Protection: 2nd Edition)

Abstract

A wadi ecosystem, a wetland characterized by seasonal water flow, is a unique freshwater environment typically found in semi-arid and arid regions. This study investigates the seasonal and spatial dynamics of environmental properties and microbial plankton communities at Wadi Saiysad in Taif City, Saudi Arabia. Using flow cytometry, three distinct picoplankton populations were observed: Synechococcus and heterotrophic prokaryotes classified as low (LNA) or high (HNA) nucleic acid content. Surface freshwater samples were collected from three distinct sites, representing habitats with actively flowing water, biodiverse communities, and human-influenced areas. Interestingly, no significant differences among stations were observed, suggesting that the sampled stretch of Wadi Saiysad receives similar nutrient inputs. Seasonal water temperature reached 24.5 ± 0.57 °C in summer and the pH ranged from neutral to slightly alkaline. Nutrient analyses revealed that Wadi Saiysad is eutrophic and limited by phosphorus. Phytoplankton biomass was dominated by nanoplankton, particularly in summer (46.60 ± 5.33%), while Synechococcus increased significantly with a maximum abundance of 1.32 × 10⁴ cells mL−1 during the cooler months. HNA prokaryotes displayed marked seasonal variation (1.95 × 10⁴–1.78 × 10⁵ cells mL−1) compared to LNA prokaryotes (2.05–8.17 × 10⁴ cells mL−1). This study highlights the urgent need for monitoring and managing the nutrient inputs in Wadi Saiysad to protect its biodiversity and support sustainable use.

Graphical Abstract

1. Introduction

Wetlands provide unique functions linked to numerous ecosystem services essential for biodiversity conservation, climate change, and human well-being, while also supporting important economic activities such as agriculture and tourism [1,2]. Despite their ecological importance, these temporary aquatic systems have frequently been neglected in conservation initiatives [3,4]. However, numerous studies have highlighted the critical ecological functions of intermittent rivers, emphasizing their role in sustaining biodiversity and nutrient cycling, and advocating for a reassessment of their conservation value [5,6]. In arid and semi-arid regions, wetlands often resemble intermittent or ephemeral valleys, known as Wadis, that flow only during specific seasons or after rainfall [7,8]. These systems are increasingly threatened by pollution and human activities and require integrated protection and management to safeguard water resources and strengthen the resilience of vulnerable ecosystems [7,9,10].
Saudi Arabia, one of the most water-scarce countries in the world, is characterized by its extreme aridity, receiving minimal annual rainfall (averaging around 114 mm) and experiencing exceptionally high evapotranspiration rates (up to 4550 mm), where summer temperatures may exceed 50 °C [11,12,13]. To meet rising water demands, Saudi Arabia primarily relies on deep non-renewable groundwater, limited shallow renewable aquifers, desalinated seawater, and a small fraction of surface water and treated wastewater [14,15]. Among these limited freshwater sources, Wadis serve a crucial ecological role and are highly vulnerable to agricultural runoff, industrial discharge, and untreated wastewater, which can cause a significant degradation in water quality and aquatic habitats [8,16]. Despite their importance, comprehensive investigations into the ecological condition of Wadis remain limited. Recent assessments have been mostly concentrated in the Riyadh Region, with Wadi Hanifa [17,18] and Wadi Namar [14] serving as key case studies due to their proximity to expanding urban development and sustained exposure to domestic, agricultural, and industrial effluents. Both sites exhibit clear signs of contamination, including elevated levels of pollutants linked to urban runoff, agricultural discharge, and potential sewage infiltration.
Wadi Saiysad, located northeast of Taif City in western Saudi Arabia, is the upstream section of Wadi Wajj, a major drainage system that flows through Taif toward the Red Sea or interior plains [19]. Wadi Saiysad is mainly sustained by two water sources: surface runoff originating from rainfall events in the Sarawat Mountains (a prominent mountain range in the western Arabian Peninsula) and groundwater contributions from surrounding wells and shallow aquifers [20]. Previous investigations have classified Wadi Saiysad as an eutrophic ecosystem, with phosphate concentrations reaching up to exceeding 0.02 mg L−1, reflecting nutrient enrichment [20,21]. Although previous studies have documented aspects of its biological composition, e.g., the diversity of zooplankton, phytoplankton, and cyanobacteria [20,22], and have reported signs of sewage contamination [21], whilst comprehensive assessments of its broader hydrological variability and ecological status have been insufficiently explored. Furthermore, there has been insufficient exploration of the potential reuse of its water for agricultural or irrigation purposes. These gaps highlight the need for more comprehensive, long-term monitoring strategies to inform the sustainable management of this ecologically significant freshwater ecosystem.
Comprehensive investigations into the presence and seasonal dynamics of picoplanktonic communities, microorganisms smaller than 2 µm, including both picophytoplankton and heterotrophic prokaryotes, are essential for evaluating ecosystem health and monitoring water quality [23,24]. These microorganisms are highly responsive to changes in nutrient concentrations, pollution levels, and other environmental stressors. Flow cytometry is a powerful tool for detecting, quantifying, and characterizing picoplankton in diverse ecosystems [25,26,27]. Picophytoplankton are distinguished by their natural fluorescence, such as orange from Synechococcus, red from Prochlorococcus, and characteristic chlorophyll fluorescence from picoeukaryotes, while heterotrophic prokaryotes are stained and classified into low nucleic acid (LNA) and high nucleic acid (HNA) prokaryotes [28,29,30]. Seasonal patterns in picoplankton abundance have been extensively documented in tropical marine waters [27,31], polar regions [32], and temperate regions [33]. In contrast, freshwater picoplankton has largely been studied in temperate and high-latitude lakes [25,26,34], with limited attention being paid to tropical freshwater ecosystems, particularly ephemeral systems such as Wadis, where seasonal dynamics remain poorly understood.
This study presents a year-long investigation of the seasonal and spatial variability of both autotrophic and heterotrophic picoplankton, assessed using flow cytometry, at three stations along Wadi Saiysad in Taif, Saudi Arabia. The main objectives of this study are to (1) investigate the seasonal and spatial variability of both autotrophic and heterotrophic picoplankton in a freshwater ecosystem, and (2) evaluate the influence of environmental changes and nutrient inputs from human activities, particularly agriculture and irrigation, on their abundance, distribution, and community structure. Two key hypotheses were tested: (1) Synechococcus and HNA cells are expected to dominate in abundance over Prochlorococcus (which may be absent) and LNA cells, with each group exhibiting distinct seasonal patterns; and (2) nutrient inputs from human activities are likely to promote eutrophication, thereby influencing the abundance and dynamics of these microbial communities.

2. Materials and Methods

2.1. Sample Collection and Environmental Parameter Measurements

Wadi Saiysad (21.32816° N, 40.46742° E) is located in the northeast of Taif City, western Saudi Arabia (Figure 1A) and characterized by muddy sedimentation, running water, abundant filamentous algae, aquatic macrophytes, and small fish (Figure 1B) and is impacted by various anthropogenic activities (e.g., agricultural runoff and groundwater extraction). Periodic sampling was conducted from 2022 to 2023, covering four seasonal periods: winter (23 January and 23 February 2023), spring (23 March and 23 April 2023), summer (23 July and 23 August 2023), and fall (22 November and 22 December 2022). Surface samples were systematically collected using acid-washed 1 L polycarbonate bottles from three ecologically distinct sites along Wadi Saiysad: Station 1 (St. 1) was situated in a heavily used area with evident human activity and visible nutrient enrichment (Figure 1C), Station 2 (St. 2) was dominated by aquatic vegetation and supported diverse populations of zooplankton and small fish (Figure 1D), and Station 3 (St. 3) was located in a stretch of actively flowing freshwater (Figure 1E). The three sampling stations were at relatively short distances to ensure that the water was consistently present throughout the year, as sediment accumulation can occasionally limit water availability. In situ measurements of water temperature and pH were obtained using a HANNA meter (HANNA Edge® Multiparameter, Woonsocket, RI, USA), while salinity was determined with a Digital Water Quality Tester (JUANJUAN, Guangzhou, China).
Chlorophyll a (Chl a) concentrations were determined by sequentially filtering 200 mL of surface water through membrane filters with pore sizes of 20 µm, 2 µm, and 0.2 µm, representing microphytoplankton, nanophytoplankton, and picophytoplankton size fractions, respectively. Filters were immediately stored at −80 °C until further analysis. Pigments were extracted in 90% acetone and incubated for 24 h in the dark at 4 °C. The Chl a concentration was then quantified spectrophotometrically using the monochromatic method with acidification, as described by [35].
Water samples for nitrate (NO3) and phosphate (PO43−) analyses were filtered through 0.2 µm membrane filters and stored at 4 °C until analysis. NO3 concentrations were determined using the hydrazine reduction colorimetric method described by [36]. A calibration curve was constructed using serial dilutions of sodium nitrate (NaNO3) and absorbance was measured at 450 nm using a spectrophotometer (SP-300 OPTIMA, OPTIMA Inc., Tokyo, Japan). Sample NO3 concentrations were calculated based on the calibration curve and the final concentration was converted from mg L−1 to µmol L−1 using the molar mass of nitrate (62 g mol−1). Phosphate concentrations were measured using the molybdenum blue colorimetric method with acidified molybdate reagents. A phosphate standard curve was prepared from serial dilutions of sodium dihydrogen phosphate (NaH2PO4) and absorbance was measured at 885 nm using the SP-300 OPTIMA spectrophotometer. Sample concentrations were calculated by comparison to the standard curve and the final concentration converted from mg L−1 to µmol L−1 using the molar mass of phosphate (94.97 g mol−1).

2.2. Flow Cytometric Analyses

A 1.8 mL aliquot of surface freshwater was fixed with 1% paraformaldehyde and 0.05% glutaraldehyde, incubated in the dark for approximately 10 min, then rapidly frozen in liquid nitrogen and stored at −80 °C until analysis. Flow cytometry was performed using a FACSCanto II flow cytometer (BD-Biosciences, Heidelberg, Germany) instrument, with 1 µm fluorescent latex beads (Molecular Probes, Eugene, OR, USA) employed as internal standards for both size and fluorescence calibration. Autotrophic (0.6 mL) and heterotrophic (0.4 mL) picoplankton fractions were analyzed at average flow rates of 136.0 µL min−1 and 21.0 µL min−1, respectively, with at least 10,000 events recorded per sample. Heterotrophic cells were stained with SYBR Green II (2.5 µmol L−1) as described in [37]. Autotrophic picoplankton were discriminated based on side scatter (SSC) and fluorescence in the orange (PE, 433 nm) and red (PerCP-Cy5-5, 498 nm) channels, while heterotrophic prokaryotes were identified via green fluorescence (FITC, 360 nm) using FCSExpress 7 software.

2.3. Statistical Analyses

Since normal data distribution and homoscedasticity were usually not met, a Kruskal–Wallis analysis of variance was used to evaluate seasonal and spatial differences for environmental parameters and picoplankton abundance. The multiple comparison Dunn’s test was used to determine the cases with significant differences. Spearman’s rank correlation coefficient was used to assess the relationships between picoplankton abundance and environmental parameters. Statistical analyses were performed using OriginPro software (Version 10.1).

3. Results

3.1. Seasonal and Spatial Variability in Hydrographic Conditions

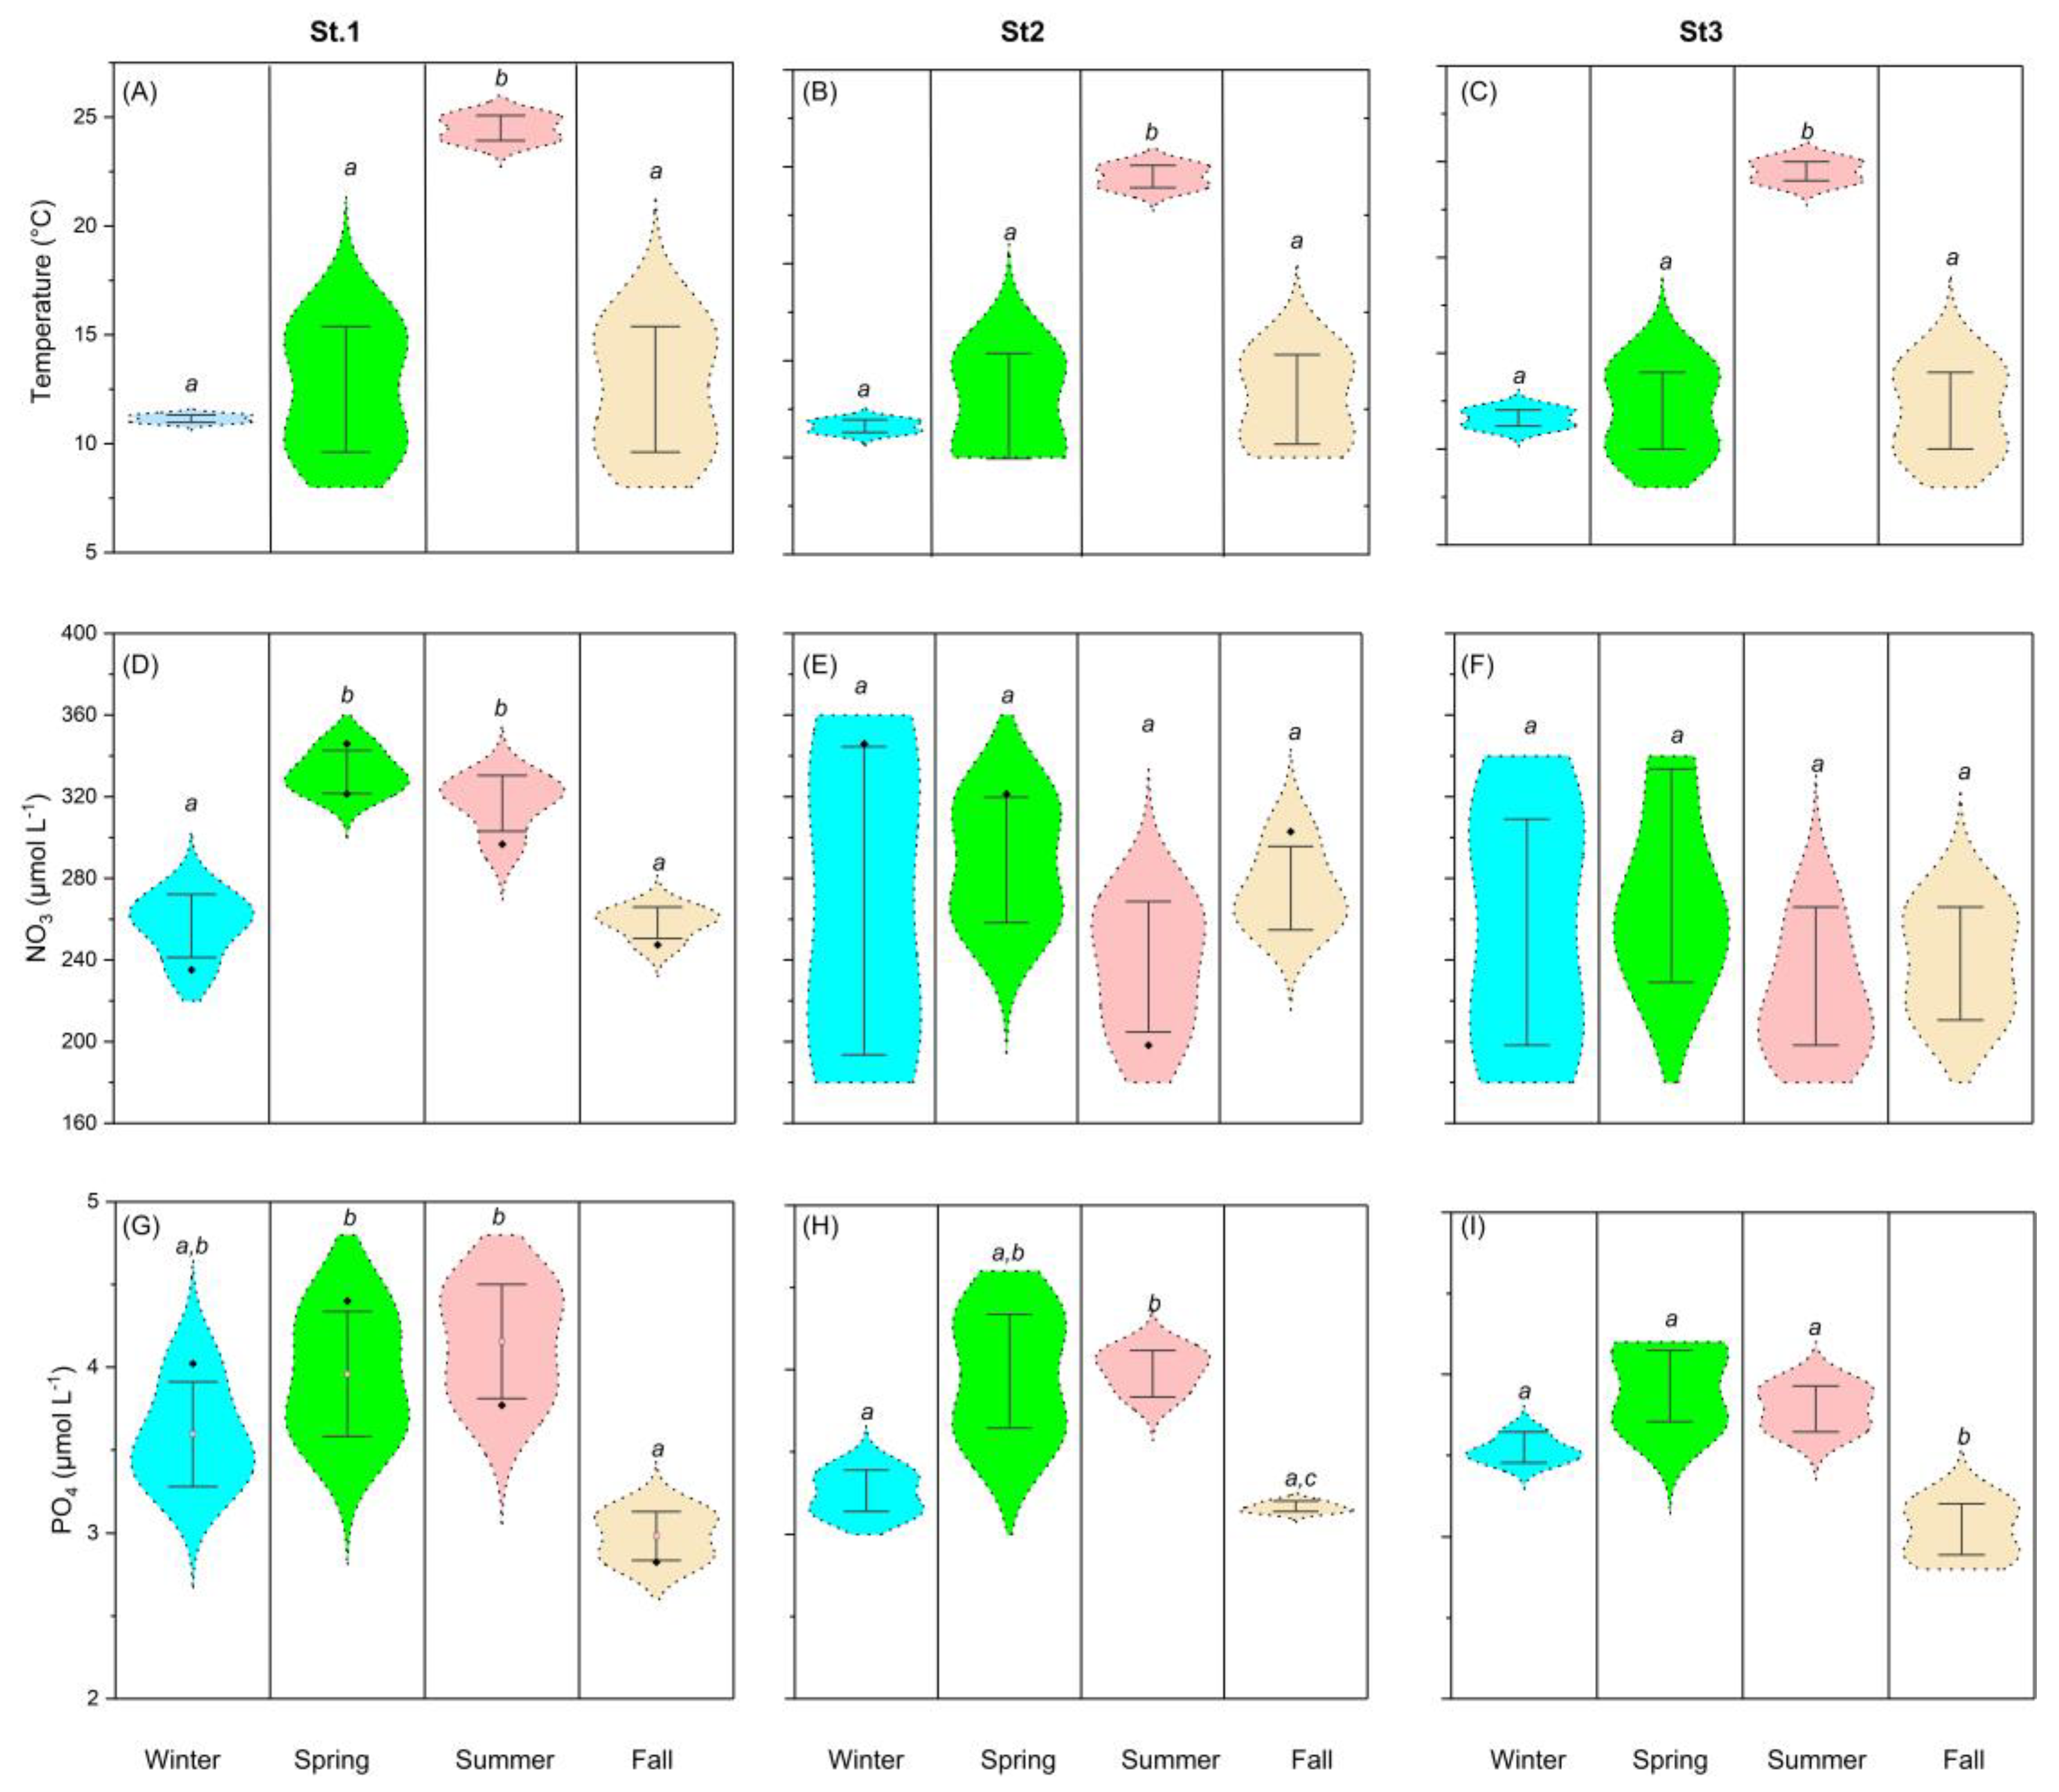
The mean seasonal and spatial variations in environmental parameters are shown in Figure 2 and Table S1. Water temperature varied significantly across seasons (Kruskal–Wallis test: H = 26.84, df = 3, p < 0.001, n = 48), reaching the highest mean in summer at 24.5 ± 0.57 °C, while no significant differences were observed between stations (Figure 2A–C). Salinity remained constant throughout the study period across all stations and seasons (0.4 ± 0.0 PSU, Table S1). pH values ranged from neutral to slightly alkaline during spring and showed significant seasonal variation (Kruskal–Wallis test: H = 8.9, df = 3, p = 0.03, n = 48), while no significant spatial differences were detected among the stations (Table S1). Nitrate (NO3) concentrations exhibited significant seasonal variation at St. 1 (Kruskal–Wallis test: H = 28.3, df = 3, p < 0.001, n = 48), peaking in spring (3.15 ± 0.30 µmol L−1) and summer (4.44 ± 0.16 µmol L−1), and declining sharply in fall (0.70 ± 0.34 µmol L−1), while no statistically significant differences were detected at St. 2 and St. 3 (Figure 2D–F). Phosphate (PO43−) concentrations showed significant seasonal variation (Kruskal–Wallis test: H = 35.3, df = 3, p < 0.001, n = 48), with peak values observed in spring and summer (3.9–4.4 µmol L−1), followed by a marked decline during fall (2.8 µmol L−1) across all stations (Figure 2G–I). The nitrogen to phosphorus ratio (N:P) exhibited substantial seasonal variation (Kruskal–Wallis test: H = 11.49, df = 3, p = 0.009), with persistently elevated values across most seasons (70.1–91.9) and a notable decline during summer (50.1–66.5), reflecting a consistently phosphorus-limited and potentially eutrophic ecosystem (Table S1).

3.2. Total and Size Fractionated Chlorophyll a Concentration

Seasonal mean values of total chlorophyll a (Chl a) concentrations ranged from 0.62 to 1.51 mg L−1. The picoplankton size fraction contributed an average of 31.61 ± 12.74% to total Chl a, while nanoplankton and microplankton accounted for 34.90 ± 12.10% and 33.51 ± 16.66%, respectively (Figure 3). Among these groups, only the nanoplankton fraction exhibited a significant seasonal variation in its relative contribution (Kruskal–Wallis test: H = 10.0, df = 3, p < 0.01, n = 24), with the highest proportion observed in summer (46.60 ± 5.33%). No significant differences in size-fraction contributions were detected among stations.

3.3. Seasonal and Spatial Variability Picoplankton Abundances

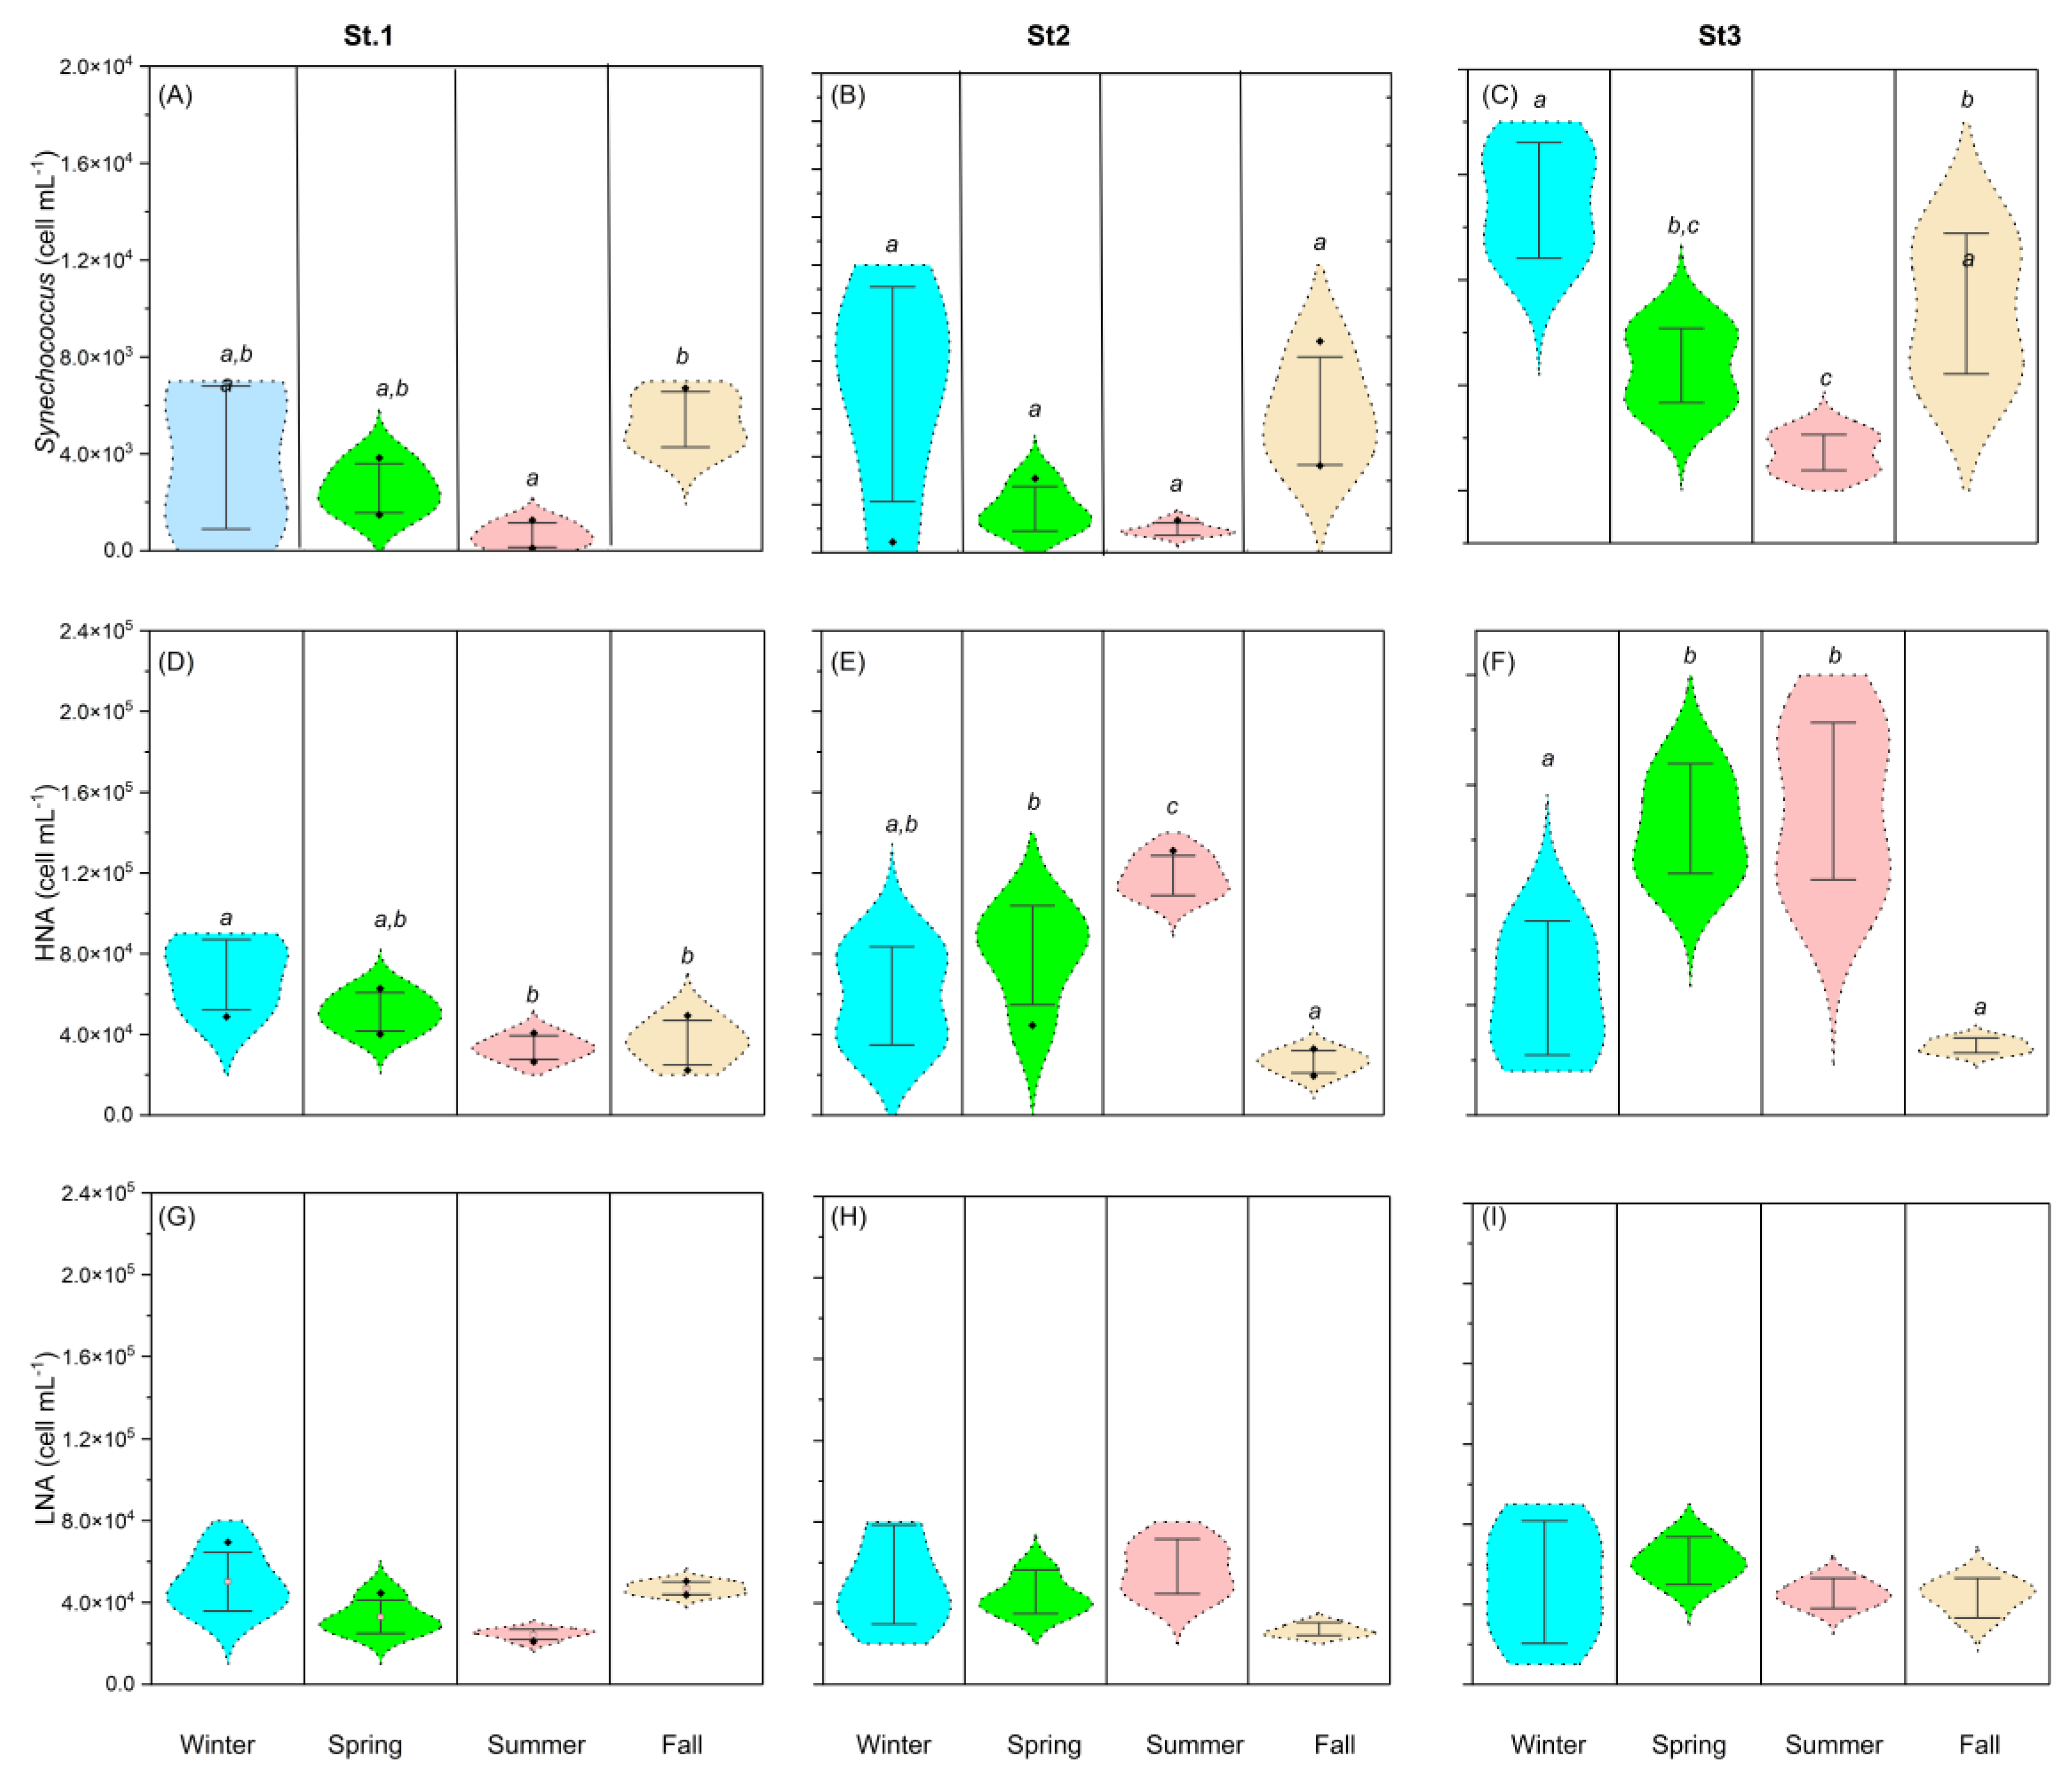
Within the picoplankton community, Synechococcus, high (HNA), and low (LNA) nucleic acid prokaryotes were the main dominant groups consistently detected across all seasons and stations (Figure S1). Synechococcus showed significant seasonal variability (Kruskal–Wallis test: H = 26.2, df = 3, p < 0.001, n = 48) with the highest abundances recorded during winter (seasonal mean values ranged from 1.03 × 10³ to 1.32 × 10⁴ cells mL−1) and fall (3.63 × 10³ to 9.78 × 10³ cells mL−1), while lower concentrations were observed in spring (1.04–6.16 × 10³ cells mL−1) and summer (1.09 × 10² to 2.12 × 10³ cells mL−1) (Figure 4A–C). HNA prokaryotes exhibited significant seasonal patterns (Kruskal–Wallis test: H = 21.1, df = 3, p < 0.001, n = 48), with mean seasonal values ranging from 1.60 × 10⁵ to 1.78 × 10⁵ cells mL−1 (Figure 4D–F). At Stations 2 and 3, HNA prokaryotes displayed a clear seasonal trend, peaking in spring (1.60 × 10⁵ cells mL−1) and reaching maximum values in summer at St. 3 (1.78 × 10⁵ cells mL−1). HNA prokaryotes were more abundant than LNA cells, contributing an average of 57.7 ± 10.7% to the total prokaryotic community, with peak contributions during summer (ranging from 51.8% to 79.5%). HNA prokaryotes dominated the prokaryotic community, contributing a consistently high proportion to the total cell abundance (HNA%), with a seasonal average of 57.7 ± 10.7%, particularly during the warmer summer months when their contribution peaked at up to 79.5%. LNA prokaryotes displayed weaker seasonality than HNA, with mean seasonal values ranging from 2.05 to 8.17 × 10⁴ cells mL−1 (Figure 4G–I). Overall, no significant spatial differences in the abundances of these microbial groups were detected among the stations.

3.4. Relationships Between Environmental Variables and Picoplankton Abundances

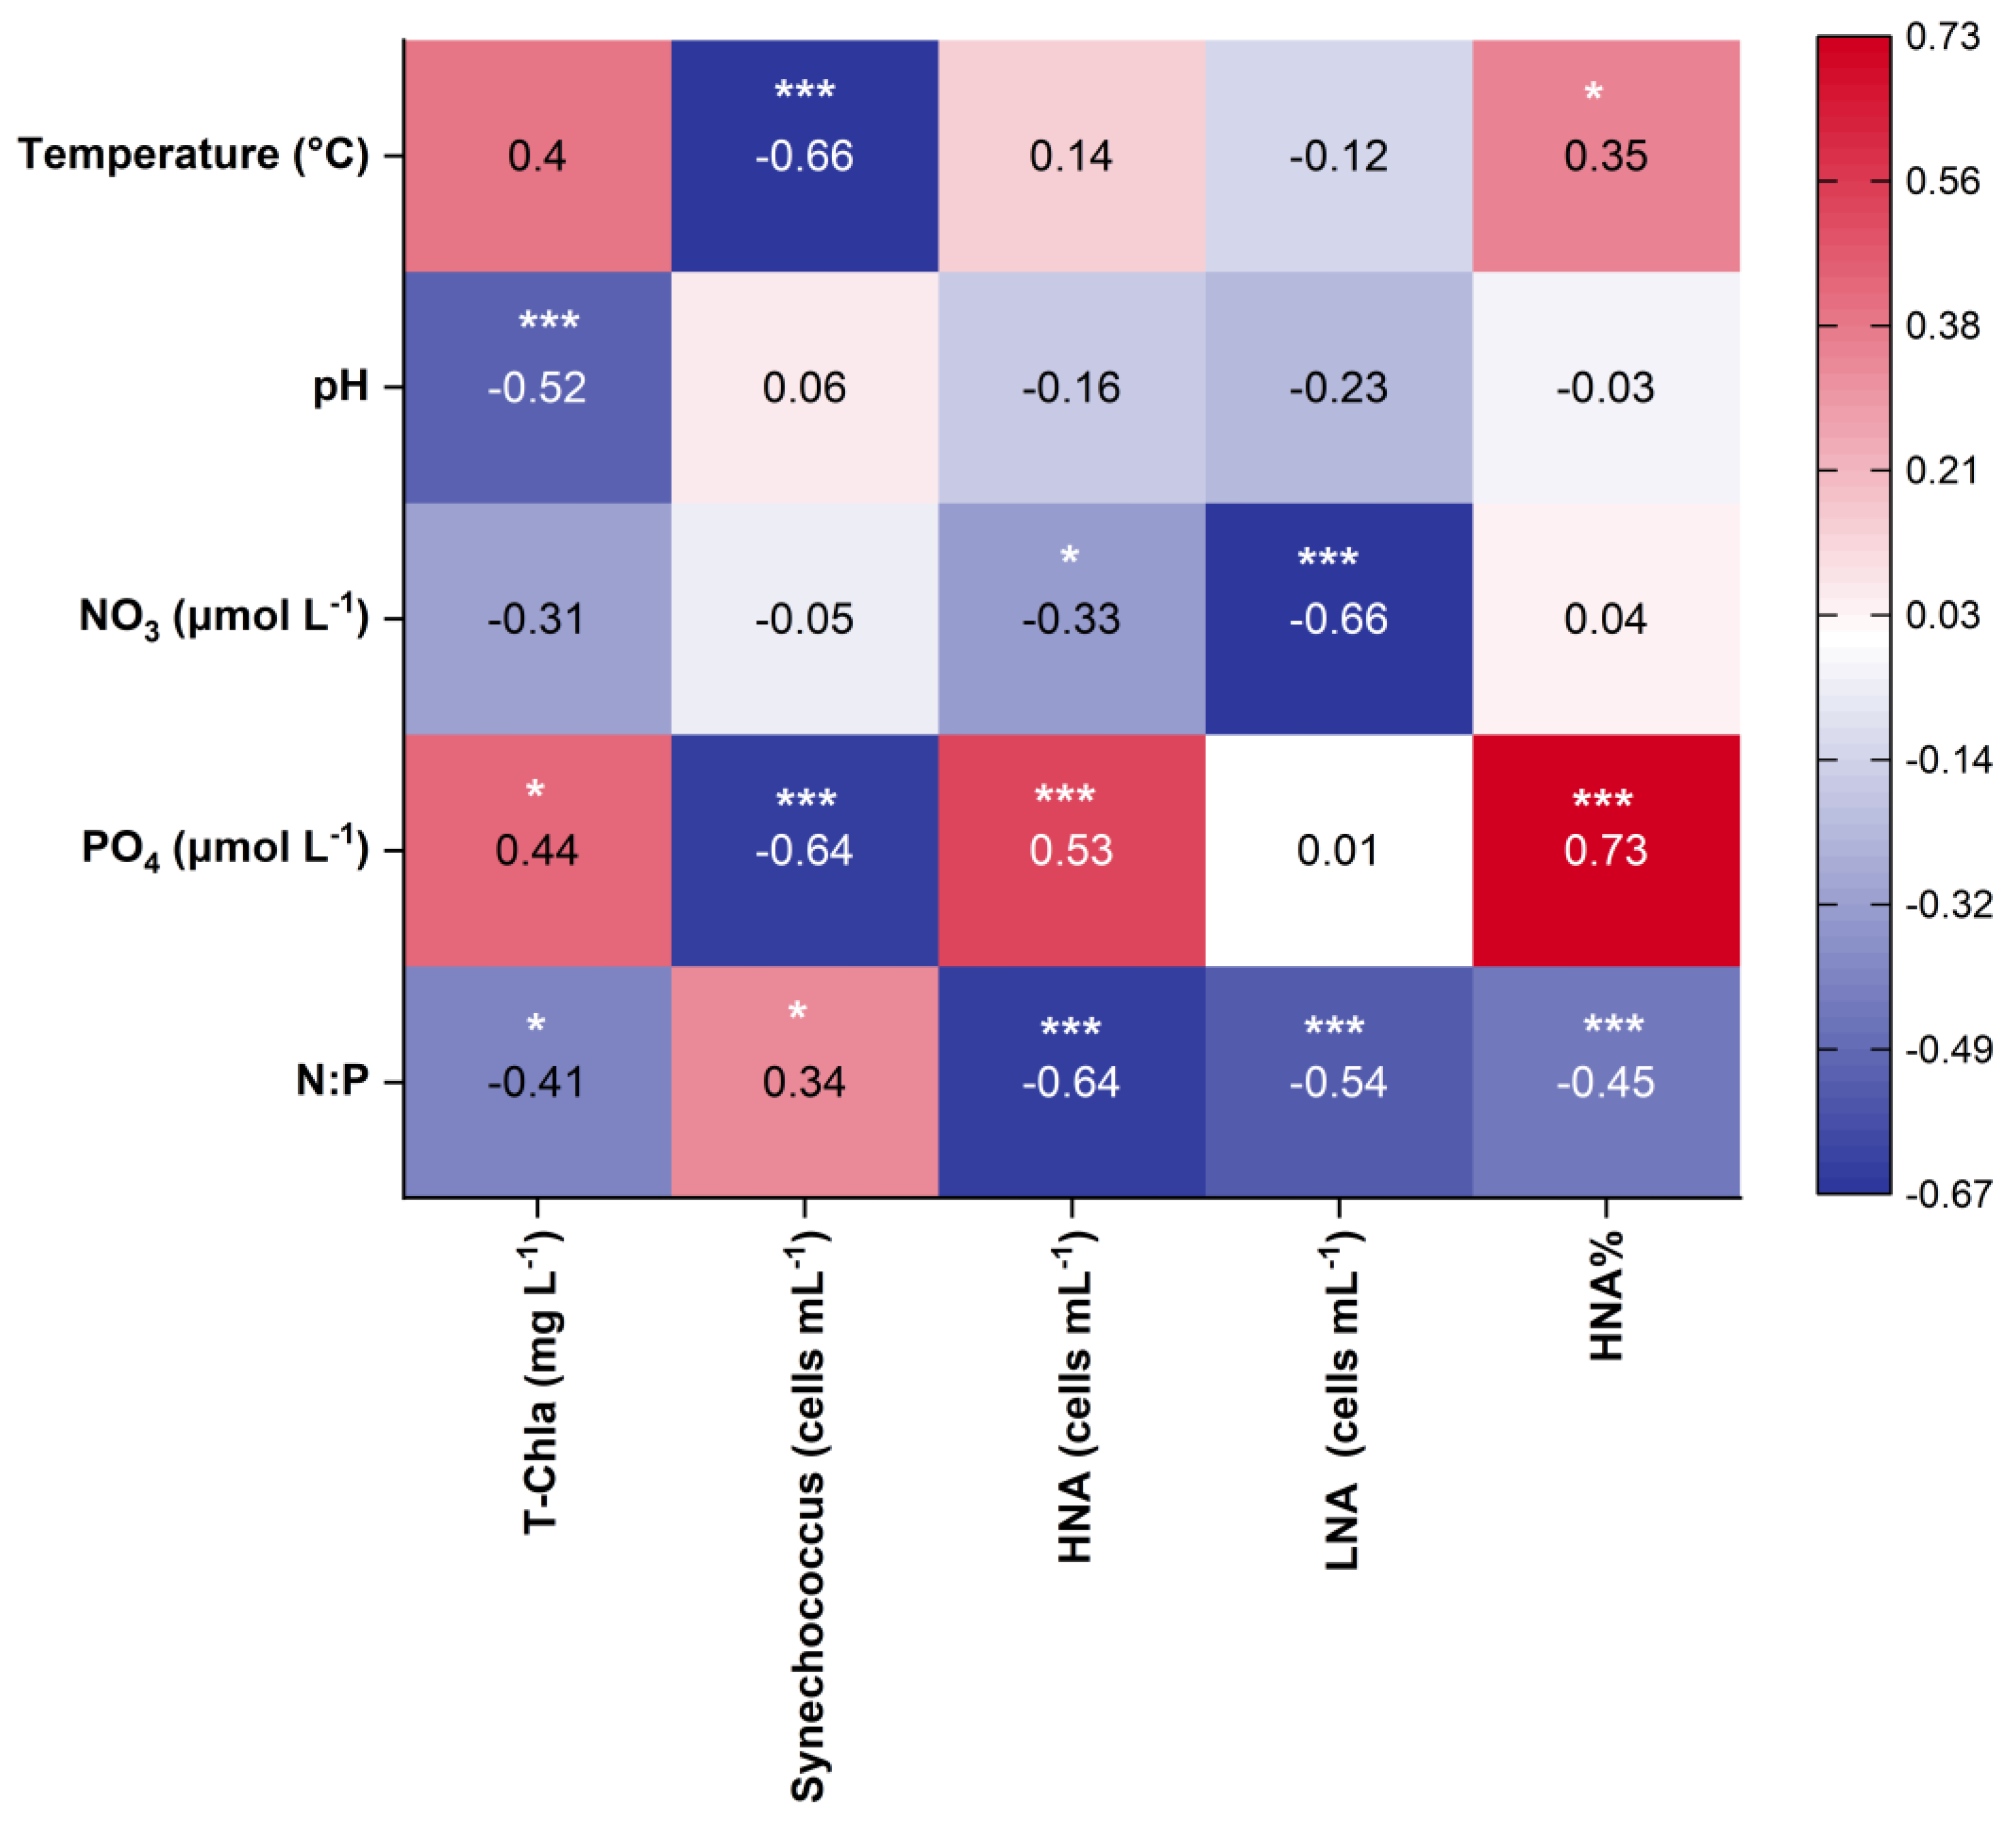
Spearman’s correlation analysis revealed distinct relationships between environmental parameters, total Chl a (T-Chl a) and the abundances of autotrophic and heterotrophic picoplankton (Figure 5). T-Chl a was negatively correlated with pH (r = −0.52, p = 0.001) and N:P ratio (r = −0.41, p = 0.05), while positively correlated with PO4 (r = 0.44, p = 0.03). Synechococcus abundance was strongly and negatively correlated with both water temperature (r = −0.66, p < 0.0001) and PO4 concentrations (r = −0.64, p < 0.0001), while showing a positive correlation with the N:P ratio (r = 0.34, p = 0.02). HNA prokaryotes showed a significant positive correlation with PO4 (r = 0.53, p < 0.0001), but a negative correlation with NO3 concentrations (r = −0.33, p = 0.02) and N:P ratio (r = −0.64, p < 0.0001). LNA prokaryotes exhibited a strong negative correlation with NO3 concentrations (r = −0.66, p < 0.001) and N:P ratio (r = −0.54, p < 0.0001). HNA% was positively correlated with temperature (r = 0.35, p < 0.01) and PO4 concentrations (r = 0.73, p < 0.0001), but negatively correlated with the N:P ratio (r = −0.45, p < 0.001).

4. Discussion

Wadi ecosystems, characterized by alternating wet–dry cycles and distinctive hydro-ecological processes, are vital for maintaining ecological functions and supporting biodiversity, recharging groundwater, supplying water for agriculture and domestic use, especially in arid and semi-arid regions where water scarcity is severe [7,9,15,38]. Wadis are increasingly exposed to multiple anthropogenic pressures, including pollution, human activities, urban expansion, wastewater discharge, nutrient- and contaminant-rich agricultural runoff and climate change [8,14,18,39], contributing to spatial variability in water quality. Most studies and reviews have highlighted the ecological significance of wadis; however, further research is essential to comprehensively assess their ecological integrity and to characterize the biological and chemical components within these unique ecosystems. The present study addresses these critical knowledge gaps by investigating the seasonal and spatial variations of physicochemical parameters and microbial plankton through comprehensive data collection involving regular sampling at Wadi Saiysad, the drainage system influenced by runoff from the Sarawat Mountains, seasonal rainfall, and shallow groundwater aquifers in Taif City, western Saudi Arabia (SA) (Figure 1). Despite its ecological importance and the presence of sensitive flora and fauna, scientific investigations into the water quality and long-term ecological changes of the region remain limited. Only a few studies have focused on Wadi Saiysad, including the interactions between phytoplankton and zooplankton [20], the microflora (cyanobacteria, algae and fungi) associated with the medicinal leech Limnatis nilotica [40] and the impact of sewage disposal on zooplankton community structures [21].
The results of this study further highlight the importance of seasonality in shaping the physicochemical conditions and microbial plankton communities in Wadi Saiysad, providing a more accurate assessment of ecosystem functioning and biogeochemical cycling, while spatial variation had a comparatively minor influence on these patterns likely due to the close proximity of the stations. Surface water temperature showed pronounced seasonal variation closely tracking regional air temperature patterns, primarily due to the shallow depth that inhibits thermal stratification (Figure 2A–C), while salinity remained consistently within freshwater ranges (Table S1). The neutral to slightly alkaline pH values observed in this study reflect the typical conditions of a rain-fed mountain stream and are likely influenced by diverse runoff inputs and inherent geological variability along the Wadi (Table S1), with comparable values previously documented by [19]. The present findings identify Wadi Saiysad as a eutrophic freshwater ecosystem, exhibiting nutrient enrichment under phosphorus-limited conditions (Figure 2D–I). NO3 concentrations (12.3–22.5 mg L−1; 198–346 µmol L−1) substantially exceed those previously reported at the same Wadi (4.2 ± 3.58 mg L−1; [22]) while PO4 concentrations measured here are lower than those documented (5.1 ± 2.66 mg L−1; [20,22]). The elevated levels of nitrate likely result from a combination of allochthonous nutrient inputs and in-stream processes. Runoff from surrounding agricultural areas enriched with nitrogen-based fertilizers and inputs from treated wastewater discharges, as previously reported by [19], are the primary contributors to nutrient enrichment. Intense wet-season rainfall flushes nutrients like fertilizers and organic matter into streams, while nitrate stored in sediments can be remobilized during high flows, elevating nutrient levels. Future studies on sediment dynamics will help improve our understanding of these processes. The low phosphorus values, coupled with elevated N:P ratios (~60–80), indicate chronic phosphorus limitation in the ecosystem, driven by either enhanced phosphorus retention or limited phosphorus availability, which profoundly affects phytoplankton dynamics and productivity. Overall, these results reveal ongoing nutrient inputs that drive eutrophication and disrupt nutrient balance, highlighting the critical need for the effective regulation of nutrient sources to protect this freshwater habitat and ensure its sustainable functioning.

4.1. Microbial Planktonic Community Structure at Wadi Saiysad

Phytoplankton are key primary producers in freshwater ecosystems and are highly sensitive to environmental changes such as nutrient enrichment, pollution, and seasonal hydrological fluctuations [41,42]. Due to this sensitivity, they are widely regarded as reliable bioindicators of water quality, particularly in ecosystems influenced by anthropogenic pressures [43]. This study provides a detailed temporal and spatial assessment of phytoplankton biomass distribution by size fraction in Wadi Saiysad, complementing earlier ecological investigation in the region [20]. Size-fractionated chlorophyll a (Chl a) analysis revealed moderate seasonal variations in total phytoplankton biomass, with peaks occurring during warmer and nutrient-enriched periods (Figure 3). These findings are consistent with [19], who documented similar seasonal phytoplankton patterns in the freshwater ecosystems of Taif, including Wadi Saiysad, driven primarily by temperature and nutrient availability. Nanoplankton size fractions dominate the phytoplankton biomass in Wadi Saiysad, consistent with a previous study identifying phytoplankton species predominantly within the nanoplankton size class (e.g., Xanthophyta, certain Cyanobacteria, Chlorophyta, and smaller Bacillariophyta) [20].
Picoplankton are ubiquitous across aquatic ecosystems worldwide and particularly dominate biomass and production in nutrient-poor tropical and subtropical waters [27,44,45]. Comprehensive investigations of these microbial components are crucial for assessing ecological status, understanding microbial food web dynamics, and determining their contributions to ecosystem functioning. However, their behavior and ecological significance in Wadi ecosystems have not been extensively studied yet, where fluctuations in nutrient supply and water flow are pronounced. Using flow cytometry allows for the accurate detection, counting, and profiling of these microbial populations, enabling new insights into their seasonal patterns and contributions within these unique ecosystems. In this study, three ecological groups were consistently distinguished by flow cytometry across all sampling periods: Synechococcus and two groups of heterotrophic prokaryotes (high (HNA) and low (LNA) nucleic acid bacteria) (Figure S1). Among autotrophic picoplankton, Synechococcus was the dominant group due to its ability to thrive in nutrient-rich waters [46,47], while Prochlorococcus was absent as expected, since it typically inhabits stratified and nutrient-poor waters [27,31,44]. Although spatial differences were minimal, seasonal factors played a dominant role in shaping Synechococcus distribution, reflecting its preference for colder months and nutrient-poor conditions (Figure 4A–C and Figure 5). This indicates that Synechococcus distribution may be limited by its thermal tolerance or by competition from microbes favored by higher temperatures, while elevated nutrients, especially phosphate, could promote the growth of other microorganisms that outcompete or negatively affect Synechococcus. For heterotrophic prokaryotes, the seasonality of the LNA group was less pronounced than that of the HNA counterpart, which contributed more to the total abundance, highlighting its ecological significance and potential role in active microbial processes (Figure 4D–I). HNA bacterial cells can be tentatively considered copiotrophs, based on their positive relationship with phosphate (Figure 5), which thrive in eutrophic and mesotrophic environments and represent the more metabolically active fraction of bacterial communities [33,48,49]. However, the negative correlation with elevated nitrate suggests additional ecological interactions that may limit HNA growth or alter community composition (Figure 5). LNA prokaryotes mostly dominate stratified oligotrophic waters [30,50,51] and some studies have challenged the earlier assumption that LNA cells are inactive or dead, demonstrating instead that they can exhibit significant activity [52,53]. Overall, understanding the dynamic changes in microbial plankton in Wadi Saiysad under increasing anthropogenic pressures is vital for developing informed management strategies to preserve the ecological integrity and sustainable functioning of this freshwater ecosystem.

4.2. Ecological and Management Implications

Saudi Arabia faces severe limitations in water source availability due to its arid climate, characterized by low rainfall and high evaporation rates, requiring the development of robust water management strategies [54]. In response, the Kingdom is implementing comprehensive initiatives under its Vision 2030 framework to maintain and enhance the availability and quality of its vital water resources. This study directly supports Saudi Vision 2030’s emphasis on sustainable water management by providing the critical ecological insights needed to protect the Kingdom’s freshwater resources.
Wadis ecosystems, already heavily utilized for multiple purposes e.g., irrigation, livestock watering, recreation, and occasional urban water supply, are increasingly subjected to anthropogenic pressures and various forms of pollutions, which in turn could threaten groundwater—the main water source in SA [54]. The condition of Wadi Saiysad reflects broader trends across the Kingdom, where surface freshwaters are highly exposed to anthropogenic pressures and nutrient enrichment. From an ecological perspective, the phosphorus-limited status of Wadi Saiysad, coupled with occasional nutrient pulses (Figure 2D–I), critically shapes the microbial plankton community by favoring smaller autotrophic plankton (pico- and nanoplankton; Figure 3 and Figure 4). This shift in trophic structure cascades through the aquatic food web, influencing zooplankton dynamics and potentially impacting higher trophic levels. A thorough understanding of these nutrient-driven ecological processes is essential for conserving biodiversity and sustaining vital ecosystem services in this freshwater environment. Without proper management, these factors can severely degrade and ultimately compromise the ecological integrity of these ecosystems.
From a management perspective, the findings highlight the urgent need to continuously monitor water quality and control nutrient inputs, particularly phosphorus, which is a limiting nutrient and a key factor in regulating eutrophication risks. Integrating ecological data into water resource management can advance strategies to protect biodiversity, maintain ecosystem services, and enhance water security for local communities. This work establishes a substantial foundation of evidence for informed policy making aligned with national priorities and serves as a model for managing arid-region freshwater ecosystems experiencing similar water scarcity and quality challenges across the Middle East. Protecting Wadi Saiysad is essential not only for conserving microbial biodiversity and maintaining vital ecosystem services but also for securing water resources crucial to local communities and agriculture in this arid region. Ongoing ecological monitoring, combined with further research on sediment dynamics, pollutant sources, and microbial interactions, will provide a basis for effective conservation policies and sustainable water management in Wadi ecosystems facing escalating anthropogenic and climate-related pressures.

5. Conclusions

This work presents seasonal variability as a key factor influencing the microbial plankton community, while spatial differences across sampling stations were minimal in Wadi Saiysad in Taif City, Saudi Arabia. Wadi Saiysad is primarily sustained by surface runoff and groundwater from wells and shallow aquifers and is characterized as a eutrophic ecosystem limited by phosphorus availability. Nanoplankton overwhelmingly dominated the phytoplankton biomass during summer, while Synechococcus distinctly prevailed in cooler periods, highlighting pronounced seasonal shifts and contrasting ecological roles between these two size fractions. Heterotrophic prokaryotes displayed contrasting patterns, with HNA prokaryotes showing pronounced seasonality and markedly higher abundance than the LNA cells throughout the year. These findings emphasize the importance of incorporating seasonal patterns and nutrient dynamics in future ecological assessments and water management strategies for freshwater ecosystems in arid regions.

Supplementary Materials

The following supporting information can be downloaded at https://www.mdpi.com/article/10.3390/w17182788/s1, Figure S1: An example of cytograms of (A,B) autotrophic and (C,D) heterotrophic picoplankton groups. (A,B) Synechococcus was detected according to orange (PE) and red (PerCP-Cy5-5) fluorescence and side scatter (SSC) signals. (C,D) HNA and LNA groups of heterotrophic prokaryotes were distinguished based on their relative green fluorescence (FITC) side scatter (SSC) signals. Table S1: Average seasonal values (mean ± SD) of salinity, pH, and nitrogen to phosphorus (N:P) ratios at three stations (St. 1: Station 1, St. 2: Station 2, and St.3: Station 3) in Wadi Saiysad. Stars and superscript letters indicate significant differences between seasons (Kruskal–Wallis and Dunn’s post hoc tests (* p = 0.05; ** p = 0.01; *** p = 0.001).

Author Contributions

Conceptualization, N.A.-O.; methodology, N.A.-O.; software, N.A.-O.; validation, N.A.-O.; formal analysis, N.A.-O.; investigation, N.A.-O.; resources, N.A.-O.; data curation, N.A.-O.; writing—original draft preparation, N.A.-O.; writing—review and editing, N.A.-O.; visualization, N.A.-O.; supervision, N.A.-O.; project administration, N.A.-O.; funding acquisition, N.A.-O. All authors have read and agreed to the published version of the manuscript.

Funding

This research was funded by the Vice Deanship of Scientific Research and Deanship of Graduate Studies and Scientific Research at Taif University (TU) under Research No. 202213 (Da’em Program).

Data Availability Statement

The raw data supporting the conclusions of this article will be made available by the authors upon request.

Acknowledgments

The author extends appreciation to the Vice Deanship of Scientific Research and Deanship of Graduate Studies and Scientific Research at Taif University (TU) for funding this research through Project Number 202213 (Da’em Program). The author also gratefully acknowledges the High Altitude and Health Sciences Research Centers at Taif University (TU) for providing facilities and equipment. Special thanks are extended to Nada Al-Qarni for her assistance in the analysis of nutrients.

Conflicts of Interest

The author declares no conflicts of interest.

Abbreviations

The following abbreviations are used in this manuscript:
St. 1Station 1
St. 2Station 2
St. 3Station 3
NO3Nitrate
PO4Phosphate
N:PNitrate–phosphate ratio
Chl aChlorophyll a
TChl aTotal chlorophyll a
pChlaPicoplankton
nChlaNanoplankton
mChlaMicroplankton
HNAHigh nucleic acid
LNALow nucleic acid
PEPhycoerythrin
PerCP-Cy5-5Peridinin chlorophyll protein-Cyanine 5.5
SSCSide scatter signals

References

  1. Ferreira, C.S.S.; Kašanin-Grubin, M.; Solomun, M.K.; Sushkova, S.; Minkina, T.; Zhao, W.; Kalantari, Z. Wetlands as nature-based solutions for water management in different environments. Curr. Opin. Environ. Sci. Health 2023, 33, 100476. [Google Scholar] [CrossRef]
  2. Hambäck, P.A.; Dawson, L.; Geranmayeh, P.; Jarsjö, J.; Kačergytė, I.; Peacock, M.; Collentine, D.; Destouni, G.; Futter, M.; Hugelius, G.; et al. Tradeoffs and synergies in wetland multifunctionality: A scaling issue. Sci. Total Environ. 2023, 862, 160746. [Google Scholar] [CrossRef]
  3. Leigh, C.; Boulton, A.J.; Courtwright, J.L.; Fritz, K.; May, C.L.; Walker, R.H.; Datry, T. Ecological research and management of intermittent rivers: An historical review and future directions. Freshw. Biol. 2016, 61, 1181–1199. [Google Scholar] [CrossRef]
  4. Acuña, V.; Datry, T.; Marshall, J.; Barceló, D.; Dahm, C.N.; Ginebreda, A.; McGregor, G.; Sabater, S.; Tockner, K.; Palmer, M.A. Why Should We Care About Temporary Waterways? Science 2014, 343, 1080–1081. [Google Scholar] [CrossRef]
  5. Datry, T.; Larned, S.T.; Tockner, K. Intermittent Rivers: A Challenge for Freshwater Ecology. BioScience 2014, 64, 229–235. [Google Scholar] [CrossRef]
  6. Larned, S.T.; Datry, T.; Arscott, D.B.; Tockner, K. Emerging concepts in temporary-river ecology. Freshw. Biol. 2010, 55, 717–738. [Google Scholar] [CrossRef]
  7. Al-Obaid, S.; Samraoui, B.; Thomas, J.; El-Serehy, H.A.; Alfarhan, A.H.; Schneider, W.; O’Connell, M. An overview of wetlands of Saudi Arabia: Values, threats, and perspectives. Ambio 2017, 46, 98–108. [Google Scholar] [CrossRef] [PubMed]
  8. Moosavi, S.; Grose, M.J.; Lake, P.S. Wadis as dryland river parks: Challenges and opportunities in designing with hydro-ecological dynamics. Landsc. Res. 2020, 45, 193–213. [Google Scholar] [CrossRef]
  9. Al-Hammad, B.A.; Abd El-Salam, M.M. Monitoring Water Pollution Levels in Wadi Hanifa, Riyadh, Saudi Arabia and its Public Health Implications. Bull. Environ. Contam. Toxicol. 2017, 98, 525–533. [Google Scholar] [CrossRef] [PubMed]
  10. Alsabhan, A.H.; Perveen, K.; Alwadi, A.S. Heavy metal content and microbial population in the soil of Riyadh Region, Saudi Arabia. J. King Saud Univ. Sci. 2022, 34, 101671. [Google Scholar] [CrossRef]
  11. Almulhim, A.I.; Abubakar, I.R. Developing a sustainable water conservation strategy for Saudi Arabian cities. Groundw. Sustain. Dev. 2023, 23, 101040. [Google Scholar] [CrossRef]
  12. Mir, M.A.; Ashraf, M.W. The challenges and potential strategies of Saudi Arabia’s water Resources: A review in analytical way. Environ. Nanotechnol. Monit. Manag. 2023, 20, 100855. [Google Scholar] [CrossRef]
  13. Shayboub, M. Water–Demand Management in the Kingdom of Saudi Arabia for Enhancement Environment. IOSR J. Comput. Eng. 2013, 14, 57–75. [Google Scholar] [CrossRef]
  14. Alotaibi, M.O.; Mohammed, A.E.; Eltom, K.H. Metagenomic analysis of bacterial communities of Wadi Namar Lake, Riyadh, Saudi Arabia. Saudi J. Biol. Sci. 2022, 29, 3749–3758. [Google Scholar] [CrossRef]
  15. Alotaibi, B.A.; Baig, M.B.; Najim, M.M.M.; Shah, A.A.; Alamri, Y.A. Water Scarcity Management to Ensure Food Scarcity through Sustainable Water Resources Management in Saudi Arabia. Sustainability 2023, 15, 10648. [Google Scholar] [CrossRef]
  16. Al-Hetari, M.; Haider, H.; Ghumman, A.R.; Al-Salamah, I.S.; Thabit, H.; Shafiquzzaman, M. Development of a Water Quality Management Model for Dry Rivers in Arid Regions: Application on Wadi Rumah, Saudi Arabia. Ecosyst. Health Sustain. 2023, 9, 1. [Google Scholar] [CrossRef]
  17. Alharbi, T.; El-Sorogy, A.S. Quality and groundwater contamination of Wadi Hanifa, central Saudi Arabia. Environ. Monit. Assess. 2023, 195, 525. [Google Scholar] [CrossRef] [PubMed]
  18. Aqel, H.; Sannan, N.; Al-Hunaiti, A.; Fodah, R. Integrated water quality dynamics in Wadi Hanifah: Physical, chemical, and biological perspectives. PLoS ONE 2024, 19, e0298200. [Google Scholar] [CrossRef]
  19. Al-Shaibani, A.M. Hydrogeology and hydrochemistry of a shallow alluvial aquifer, western Saudi Arabia. Hydrogeol. J. 2008, 16, 155–165. [Google Scholar] [CrossRef]
  20. Hassan, M.; Issa, A.; Ebied, A. Interaction between Phytoplankton and Zooplankton in Some Freshwater Bodies in Relation to Some Ecological Factors in Taif, KSA. Annu. Res. Rev. Biol. 2017, 20, 1–12. [Google Scholar] [CrossRef]
  21. Hassan, M.; Mahmoud, H.; Habashy, M.; El-Wakeil, K.A. Effect of sewage disposal in some torrents streams on zooplankton community structure. Egypt. J. Aquat. Biol. Fish. 2022, 26, 493–514. [Google Scholar] [CrossRef]
  22. Hassan, M.M.; Mahmoud, H.M.; Abd El-Wakeil, K.F. Community Structure of Zoobenthos in Some Freshwater Bodies in Taif, Saudi Arabia. Int. J. Adv. Res. 2014, 2, 114–127. [Google Scholar]
  23. McQuatters-Gollop, A.; Stern, R.F.; Atkinson, A.; Best, M.; Bresnan, E.; Creach, V.; Devlin, M.; Holland, M.; Ostle, C.; Schmidt, K.; et al. The silent majority: Pico- and nanoplankton as ecosystem health indicators for marine policy. Ecol. Indic. 2024, 159, 111650. [Google Scholar] [CrossRef]
  24. Li, P.; Luo, Z.; Zhu, X.; Dang, Z.; Zhang, D.; Sui, X. Picoplankton Groups and Their Responses to Environmental Factors in Small Cascade Hydropower Stations. Water 2025, 17, 903. [Google Scholar] [CrossRef]
  25. Schiaffino, M.; Gasol, J.; Izaguirre, I.; Unrein, F. Picoplankton abundance and cytometric group diversity along a trophic and latitudinal lake gradient. Aquat. Microb. Ecol. 2013, 68, 231–250. [Google Scholar] [CrossRef]
  26. Callieri, C. Picophytoplankton in Freshwater Ecosystems: The Importance of Small-Sized Phototrophs. Freshw. Rev. 2008, 1, 1–28. [Google Scholar] [CrossRef]
  27. Al-Otaibi, N.; Huete-Stauffer, T.M.; Calleja, M.L.; Irigoien, X.; Morán, X.A.G. Seasonal variability and vertical distribution of autotrophic and heterotrophic picoplankton in the Central Red Sea. PeerJ 2020, 8, e8612. [Google Scholar] [CrossRef]
  28. Agustí, S. Viability and niche segregation of Prochlorococcus and Synechococcus cells across the Central Atlantic Ocean. Aquat. Microb. Ecol. 2004, 36, 53–59. [Google Scholar] [CrossRef]
  29. Biller, S.J.; Berube, P.M.; Lindell, D.; Chisholm, S.W. Prochlorococcus: The structure and function of collective diversity. Nat. Rev. Microbiol. 2015, 13, 13–27. [Google Scholar] [CrossRef]
  30. Gasol, J.M.; Zweifel, U.L.; Peters, F.; Fuhrman, J.A.; Hagström, Å. Significance of Size and Nucleic Acid Content Heterogeneity as Measured by Flow Cytometry in Natural Planktonic Bacteria. Appl. Environ. Microbiol. 1999, 65, 4475–4483. [Google Scholar] [CrossRef] [PubMed]
  31. Malmstrom, R.R.; Coe, A.; Kettler, G.C.; Martiny, A.C.; Frias-Lopez, J.; Zinser, E.R.; Chisholm, S.W. Temporal dynamics of Prochlorococcus ecotypes in the Atlantic and Pacific oceans. ISME J. 2010, 4, 1252–1264. [Google Scholar] [CrossRef]
  32. Iversen, K.R.; Seuthe, L. Seasonal microbial processes in a high-latitude fjord (Kongsfjorden, Svalbard): I. Heterotrophic bacteria, picoplankton and nanoflagellates. Polar Biol. 2011, 34, 731–749. [Google Scholar] [CrossRef]
  33. Calvo-Díaz, A.; Morán, X. Seasonal dynamics of picoplankton in shelf waters of the southern Bay of Biscay. Aquat. Microb. Ecol. 2006, 42, 159–174. [Google Scholar] [CrossRef]
  34. Bell, T.; Kalff, J. The contribution of picophytoplankton in marine and freshwater systems of different trophic status and depth. Limnol. Oceanogr. 2001, 46, 1243–1248. [Google Scholar] [CrossRef]
  35. Aminot, A.; Rey, F. Standard procedure for the determination of chlorophyll a by spectroscopic methods. ICES Tech. Mar. Environ. Sci. 2002, 112, 1–25. [Google Scholar]
  36. Kamphake, L.J.; Hannah, S.A.; Cohen, J.M. Automated analysis for nitrate by hydrazine reduction. Water Res. 1967, 1, 205–216. [Google Scholar] [CrossRef]
  37. Gasol, J.M.; Morán, X.A.G. Flow Cytometric Determination of Microbial Abundances and Its Use to Obtain Indices of Community Structure and Relative Activity; Springer: Berlin/Heidelberg, Germany, 2015; pp. 159–187. [Google Scholar] [CrossRef]
  38. Nicolás Ruiz, N.; Suárez Alonso, M.L.; Vidal-Abarca, M.R. Contributions of dry rivers to human well-being: A global review for future research. Ecosyst. Serv. 2021, 50, 101307. [Google Scholar] [CrossRef]
  39. Hamadou, W.S.; Sulieman, A.M.E.-H.; Alshammari, N.; Snoussi, M.; Alanazi, N.A.; Alshammary, A.; Al-Azmi, M. Water quality assessment of the surface and groundwater from Wadi Al-Adairey, Hail, Saudi Arabia. Sustain. Water Resour. Manag. 2023, 9, 144. [Google Scholar] [CrossRef]
  40. Ebied, A.-B.; Issa, A.; Awad, M. Micro Flora Associated with Freshwater Medicinal Leeches in Taif City, Saudi Arabia. Annu. Res. Rev. Biol. 2018, 25, 1–14. [Google Scholar] [CrossRef]
  41. Borics, G.; Abonyi, A.; Salmaso, N.; Ptacnik, R. Freshwater phytoplankton diversity: Models, drivers and implications for ecosystem properties. Hydrobiologia 2021, 848, 53–75. [Google Scholar] [CrossRef]
  42. Updhyay, D.; Shukla, K.; Mishra, A.; Shukla, S. Freshwater Phytoplankton: The Significant Ecosystems Services Provider in Aquatic Environment; Springer: Singapore, 2025; pp. 179–196. [Google Scholar] [CrossRef]
  43. Chandel, P.; Mahajan, D.; Thakur, K.; Kumar, R.; Kumar, S.; Brar, B.; Sharma, D.; Sharma, A.K. A review on plankton as a bioindicator: A promising tool for monitoring water quality. World Water Policy 2024, 10, 213–232. [Google Scholar] [CrossRef]
  44. DuRand, M.D.; Olson, R.J.; Chisholm, S.W. Phytoplankton population dynamics at the Bermuda Atlantic Time-series station in the Sargasso Sea. Deep Sea Res. Part II Top. Stud. Oceanogr. 2001, 48, 1983–2003. [Google Scholar] [CrossRef]
  45. Partensky, F.; Blanchot, J.; Lantoine, F.; Neveux, J.; Marie, D. Vertical structure of picophytoplankton at different trophic sites of the tropical northeastern Atlantic Ocean. Deep Sea Res. Part I Oceanogr. Res. Pap. 1996, 43, 1191–1213. [Google Scholar] [CrossRef]
  46. Flombaum, P.; Gallegos, J.L.; Gordillo, R.A.; Rincón, J.; Zabala, L.L.; Jiao, N.; Karl, D.M.; Li, W.K.W.; Lomas, M.W.; Veneziano, D.; et al. Present and future global distributions of the marine Cyanobacteria Prochlorococcus and Synechococcus. Proc. Natl. Acad. Sci. USA 2013, 110, 9824–9829. [Google Scholar] [CrossRef] [PubMed]
  47. Zwirglmaier, K.; Jardillier, L.; Ostrowski, M.; Mazard, S.; Garczarek, L.; Vaulot, D.; Not, F.; Massana, R.; Ulloa, O.; Scanlan, D.J. Global phylogeography of marine Synechococcus and Prochlorococcus reveals a distinct partitioning of lineages among oceanic biomes. Environ. Microbiol. 2008, 10, 147–161. [Google Scholar] [CrossRef]
  48. Zubkov, M.V.; Allen, J.I.; Fuchs, B.M. Coexistence of dominant groups in marine bacterioplankton community—A combination of experimental and modelling approaches. J. Mar. Biol. Assoc. United Kingd. 2004, 84, 519–529. [Google Scholar] [CrossRef]
  49. Morán, X.; Bode, A.; Suárez, L.; Nogueira, E. Assessing the relevance of nucleic acid content as an indicator of marine bacterial activity. Aquat. Microb. Ecol. 2007, 46, 141–152. [Google Scholar] [CrossRef]
  50. Servais, P.; Casamayor, E.; Courties, C.; Catala, P.; Parthuisot, N.; Lebaron, P. Activity and diversity of bacterial cells with high and low nucleic acid content. Aquat. Microb. Ecol. 2003, 33, 41–51. [Google Scholar] [CrossRef]
  51. Lebaron, P.; Servais, P.; Agogué, H.; Courties, C.; Joux, F. Does the High Nucleic Acid Content of Individual Bacterial Cells Allow Us To Discriminate between Active Cells and Inactive Cells in Aquatic Systems? Appl. Environ. Microbiol. 2001, 67, 1775–1782. [Google Scholar] [CrossRef] [PubMed]
  52. Silva, L.; Calleja, M.L.; Huete-Stauffer, T.M.; Ivetic, S.; Ansari, M.I.; Viegas, M.; Morán, X.A.G. Low Abundances but High Growth Rates of Coastal Heterotrophic Bacteria in the Red Sea. Front. Microbiol. 2019, 9, 3244. [Google Scholar] [CrossRef] [PubMed]
  53. Nishimura, Y.; Kim, C.; Nagata, T. Vertical and Seasonal Variations of Bacterioplankton Subgroups with Different Nucleic Acid Contents: Possible Regulation by Phosphorus. Appl. Environ. Microbiol. 2005, 71, 5828–5836. [Google Scholar] [CrossRef] [PubMed]
  54. Baig, M.B.; Alotibi, Y.; Straquadine, G.S.; Alataway, A. Water Resources in the Kingdom of Saudi Arabia: Challenges and Strategies for Improvement; Springer: Berlin/Heidelberg, Germany, 2020; pp. 135–160. [Google Scholar] [CrossRef]
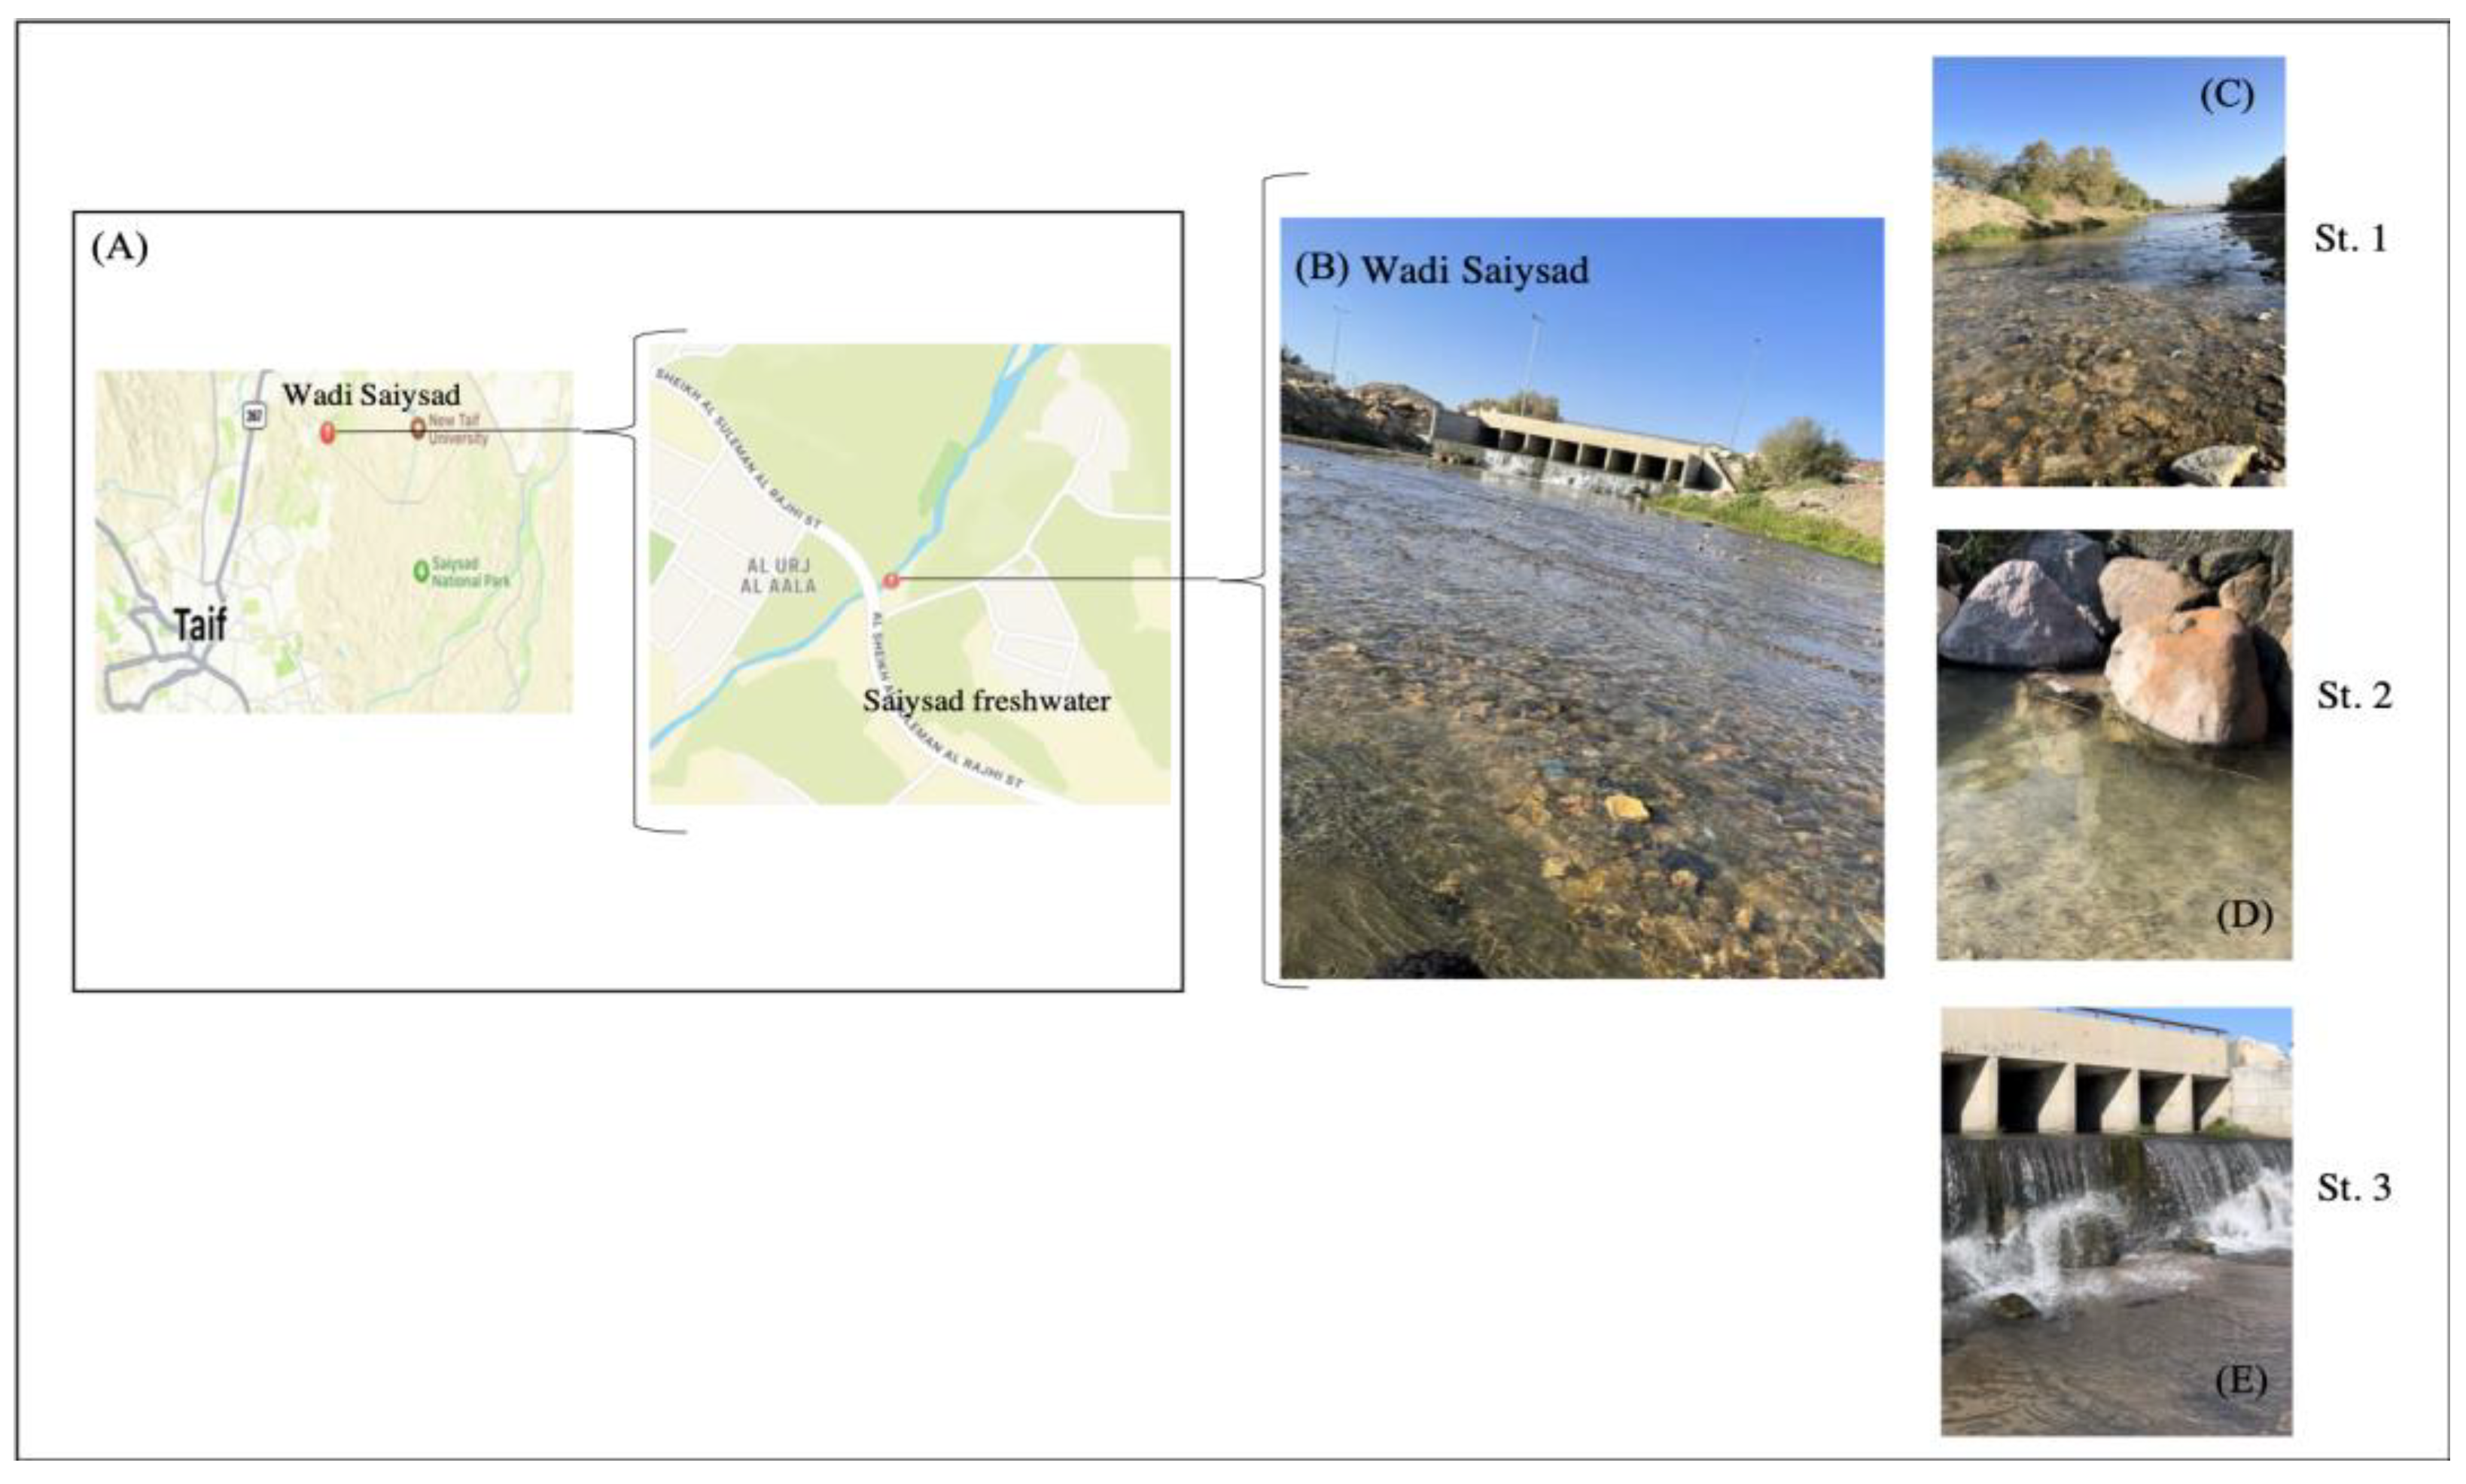
Figure 1. (A) Google map showing the location of the Wadi Saiysad freshwater ecosystem in the northeast of Taif City, western Saudi Arabia. (B) A general view of Wadi Saiysad, characterized by flowing water and surrounding vegetation. Surface water samples were collected seasonally from three stations along the Wadi: (C) Station 1 (St. 1), a eutrophic zone with visible nutrient enrichment; (D) Station 2 (St. 2), characterized by dense aquatic vegetation and the presence of zooplankton and small fish; and (E) Station 3 (St. 3), located in a segment of actively flowing freshwater.
Water 17 02788 g001
Figure 2. The mean seasonal values of environmental parameters at three stations (St. 1: Station 1, St. 2: Station 2, and St. 3: Station 3) in Wadi Saiysad. Violin plots display the distribution of (AC) water temperature (°C), (DF) nitrate (NO3, µmol L−1), and (GI) phosphate (PO4, µmol L−1) across winter, spring, summer, and fall. Box plots within the violins represent the median and interquartile range. Superscript letters indicate significant differences between seasons (Kruskal–Wallis and Dunn’s post hoc tests.
Water 17 02788 g002
Figure 3. Mean seasonal and spatial values of total and size-fractionated chlorophyll a concentrations. The mean contributions of the three size-fractions (picoplankton, nanoplankton, and microplankton) at three stations (St. 1: Station 1, St. 2: Station 2, and St. 3: Station 3) in Wadi Saiysad among seasons. Error bars represent standard deviation.
Water 17 02788 g003
Figure 4. Seasonal means for the autotrophic and heterotrophic picoplankton abundances at three stations (St. 1: Station 1, St. 2: Station 2, and St. 3: Station 3) in Wadi Saiysad. Violin plots show the mean seasonal abundance of Synechococcus (AC), high (HNA, DF), and low (LNA, GI) nucleic acid prokaryotes in winter, spring, summer, and fall. Box plots within violins indicate median and interquartile range. Superscript letters indicate significant differences between seasons (Kruskal–Wallis and Dunn’s post hoc tests.
Water 17 02788 g004
Figure 5. Heatmap showing Spearman correlation coefficients between environmental variables (temperature, pH, nitrate (NO3), phosphate (PO4), and the ratio nitrate–phosphate (N:P) and microbial groups (total chlorophyll a (T-Chl a), Synechococcus, high nucleic acid (HNA), and low nucleic acid (LNA) prokaryotic cells and the HNA%). Asterisks denote significance levels: * p < 0.05, *** p < 0.001.
Water 17 02788 g005
Disclaimer/Publisher’s Note: The statements, opinions and data contained in all publications are solely those of the individual author(s) and contributor(s) and not of MDPI and/or the editor(s). MDPI and/or the editor(s) disclaim responsibility for any injury to people or property resulting from any ideas, methods, instructions or products referred to in the content.