You are currently viewing a new version of our website. To view the old version click .
Water
  • Article
  • Open Access

22 September 2025

Assessing Recent Changes in the Contribution of Rainfall and Air Temperature Effects to Mean Flow and Runoff in Two Slovenian–Croatian Basins Using MLR and MLLR

,
and
1
Faculty of Civil Engineering, Architecture and Geodesy, Split University, Matice Hrvatske 15, 21000 Split, Croatia
2
Department of Physical and Environmental Sciences, University of Toronto Scarborough, 1065 Military Trail, Scarborough, Toronto, ON M1C 1A4, Canada
*
Author to whom correspondence should be addressed.
This article belongs to the Special Issue The Impact of Climate Change and Land Use on Water Resources—an Issue of Environmental Global Safety

Abstract

This study investigates the recent changes in the relationship between annual precipitation, mean annual air temperature, mean annual river discharge, and annual runoff coefficients in two small, neighboring continental catchments in Slovenia and Croatia: the Sutla/Sotla and Krapina River basins. Analyses of discharge, precipitation, and temperature time series were conducted on an annual scale using simple linear regression, multiple linear regression (MLR), and multiple log-linear regression (MLLR). Despite their geographical proximity and similar climatic conditions, the two basins exhibit markedly different runoff coefficients. Lower values observed in the Krapina River at Kupljenovo likely reflect gentle slopes, permeable soils, dense vegetation, and significant infiltration losses, while higher runoff coefficients at the Sutla River near Rakovec suggest more rapid surface runoff, reduced infiltration, and potentially distinct land use. In both basins, a pronounced rise in mean annual air temperatures has been evident since 1992, followed approximately eight years later by a sharp decline in mean annual flows and annual runoff coefficients. Our results show that the influence of air temperature on both discharge and runoff coefficients has become significantly stronger in recent decades, especially since the year 2000, contributing to a notable decline in mean annual discharges as well as annual runoff coefficients. Mean annual discharges have decreased by 19% in the Sutla and 15% in the Krapina basin, coinciding with temperature increases. Regression analyses confirm that air temperature has become a dominant negative predictor of discharge and runoff, with its influence intensifying over the past two decades. The runoff coefficient declined from 0.483 to 0.394 in the Sutla basin and from 0.325 to 0.270 in the Krapina basin during the same period. These findings highlight the importance of catchment-specific assessments for understanding and managing the localized impacts of climate change on hydrological processes. However, future work should incorporate evaporation as a key variable to better attribute the observed runoff reductions.

1. Introduction

The global, regional, and local hydrological cycles are governed by the partitioning of precipitation over a given area into three components: evapotranspiration losses, surface runoff, and groundwater storage. The water balance characteristics of any region or catchment are influenced by various factors, among which the amount and spatiotemporal distribution of precipitation play a crucial role. Rising air temperatures in recent decades, particularly in the most recent years, have exerted an increasing influence on the complex and heterogeneous hydrological processes within catchments.
Global warming impacts all components of the water cycle—globally, regionally, and locally. Lehner et al. [] emphasize that, as a result of climate change—primarily due to rising temperatures—significant alterations to the hydrological cycle have already occurred in nearly every catchment. Continued temperature rise is expected to intensify these changes, with serious implications for water security and resource management across various regions and catchments [,].
Climate change is profoundly altering hydrological systems worldwide, affecting water availability, flow regimes, ecological health, and even triggering social instability [,,,,,,,]. Rising temperatures lead to increased evapotranspiration, reduced soil moisture, and shifts in the spatial and temporal patterns of precipitation. In warmer climates, less winter precipitation falls as snow, and snowmelt occurs earlier in spring. Even without changes in precipitation intensity or volumes, these shifts alone cause peak river runoff to move toward winter and early spring [].
In addition to climate change, human interventions in catchments affect scientific, environmental, ecological, social, and economic systems. Therefore, effective strategies for mitigation and adaptation must be comprehensive and interdisciplinary [].
As warming continues and intensifies, more severe water-related impacts are expected across different environments and catchments of varying sizes. Therefore, deeper scientific understanding is needed to address the impacts of climate change scenarios on the functioning of individual catchments []. These complex interactions highlight the need for studies across a wide range of environments and hydrological basins.
Based on analyses conducted in the German Low Mountain Range Basin, Grosser and Schmalz [] projected that rising air temperatures could reduce summer low flows by up to 85%, and autumn low flows by 38% by 2100. Similarly, Eckhardt and Ulbrich [] found that the warmer winters will lead to less snowfall and reduced spring snowmelt, increasing the risk of winter floods, while summer groundwater recharge and streamflow may decline by as much as 50%.
In understanding vegetation–atmosphere interactions, the Leaf Area Index (LAI), which measures green leaf area per ground area, is a critical variable []. LAI is strongly and rapidly influenced by air temperature. Higher temperatures contribute to drought, which in turn reduces vegetation cover. This feedback intensifies evapotranspiration and lowers runoff. These processes are evident in many basins. In the Colorado River basin, Milly and Dunne [] demonstrated that the streamflow has declined primarily due to enhanced evapotranspiration from reduced snow albedo due to snowpack loss, which leads to greater absorption of solar radiation. This drying effect may surpass any increase in precipitation associated with climate warming, thereby intensifying the risk of even more severe water scarcity in this already vulnerable region.
In the Murray–Darling Basin, Yu et al. [] found streamflow more sensitive to changes in precipitation than to temperature, though the influence of air temperature on streamflow has increased over recent decades, driven by the accelerating warming trend in the region. Fan et al. [] found that in the high mountain regions of northwestern China, runoff is more strongly controlled by temperature than precipitation.
The combined effects of climate and human activities were evident in the Sanchuanhe River basin (Loess Plateau), where runoff and sediment yield declined due to land conservation measures and precipitation variability []. Similarly, streamflow in the Duero River basin, the largest catchment on the Iberian Peninsula, is projected to decline by up to 40% by the end of the century, particularly in spring and summer [].
In western Norway, Tsegaw et al. [] used high-resolution models to project increases in annual runoff and flood peaks, with earlier spring floods and delayed autumn peaks, indicating a shift in hydrological seasonality.
In Brazil, Alvarenga et al. [] predicted up to 69% reduction in annual runoff in the Lavrinha Creek catchment, indicating substantial changes in the water balance as a consequence of climate change. A study of 44 sub-catchments in northern Thailand highlighted variability in the regionalization of runoff characteristics, with the runoff coefficient being the most stable index [].
In Patagonia, the Senguerr River basin has seen warming, reduced winter precipitation, and summer water since 1950, along with an acceleration of desertification processes and increased dust transport []. In Alaska, Blaskey et al. [] projected higher evapotranspiration and river water temperatures, threatening both aquatic species and the livelihoods of local communities. Rising river discharge and warmer stream temperatures could also accelerate coastal sea ice loss.
Studies have extensively documented the link between rising air and stream water temperatures and their ecological consequences, particularly for ichthyofauna [,,,,]. Accurate prediction of runoff requires a comprehensive evaluation of both hydrological and statistical methods. Zhang et al. [] applied a Regression Tree Ensemble Approach (RTEA), along with Multiple Linear Regression (MLR), Multiple Log-Linear Regression (MLLR), and hydrological modeling. These four methods were used to evaluate the predictive accuracy of 13 runoff and catchment characteristics using a dataset comprising 605 basins across Australia. Their analysis revealed that climatic variables, particularly mean annual precipitation and the aridity index, exert the strongest influence on runoff characteristics. LAI, terrain slope, and soil water holding capacity also had significant effects. Among the models tested, regression-based approaches performed best in estimating specific runoff metrics, especially under low-flow conditions.
Hydrological regime changes will impact water stress, flood risk, water quality, and food security, which can differ considerably across climatic zones. Schneider et al. [] reported that Mediterranean basins will face drier conditions and reduced flow, while snow-dominated regions will experience changes in runoff due to diminished snowmelt and drier summers. In the Croatian Lowlands, Zaninović and Gajić-Čapka [] documented increases in potential and actual evapotranspiration and a reduction in soil moisture and runoff over the 20th century.
These findings reinforce the need for tailored adaptation strategies for each catchment. The purpose of this study is to improve the understanding of how rising temperatures affect small continental catchments in the Pannonian Plain of Slovenia, Hungary, and Croatia, and potentially beyond. Even modest increases in air and river temperature can have significant and numerous negative consequences.
This study assesses the impact of climate change on runoff processes in two neighboring catchments using linear regression, multiple linear regression (MLR), and multiple log-transformed linear regression (MLLR). The Sutla and Krapina River basins, although geographically close and climatically similar, differ in hydrology and geomorphology, providing a natural comparative framework for evaluating how basin properties, such as topography, infiltration capacity, and runoff dynamics, mediate the hydrological effects of rising temperatures.
This dual-basin approach highlights the limitations of applying uniform hydrological models across diverse catchments and underscores the need for context-specific analyses to guide water resource management under changing climatic conditions.

2. Materials and Methods

2.1. Basin Description
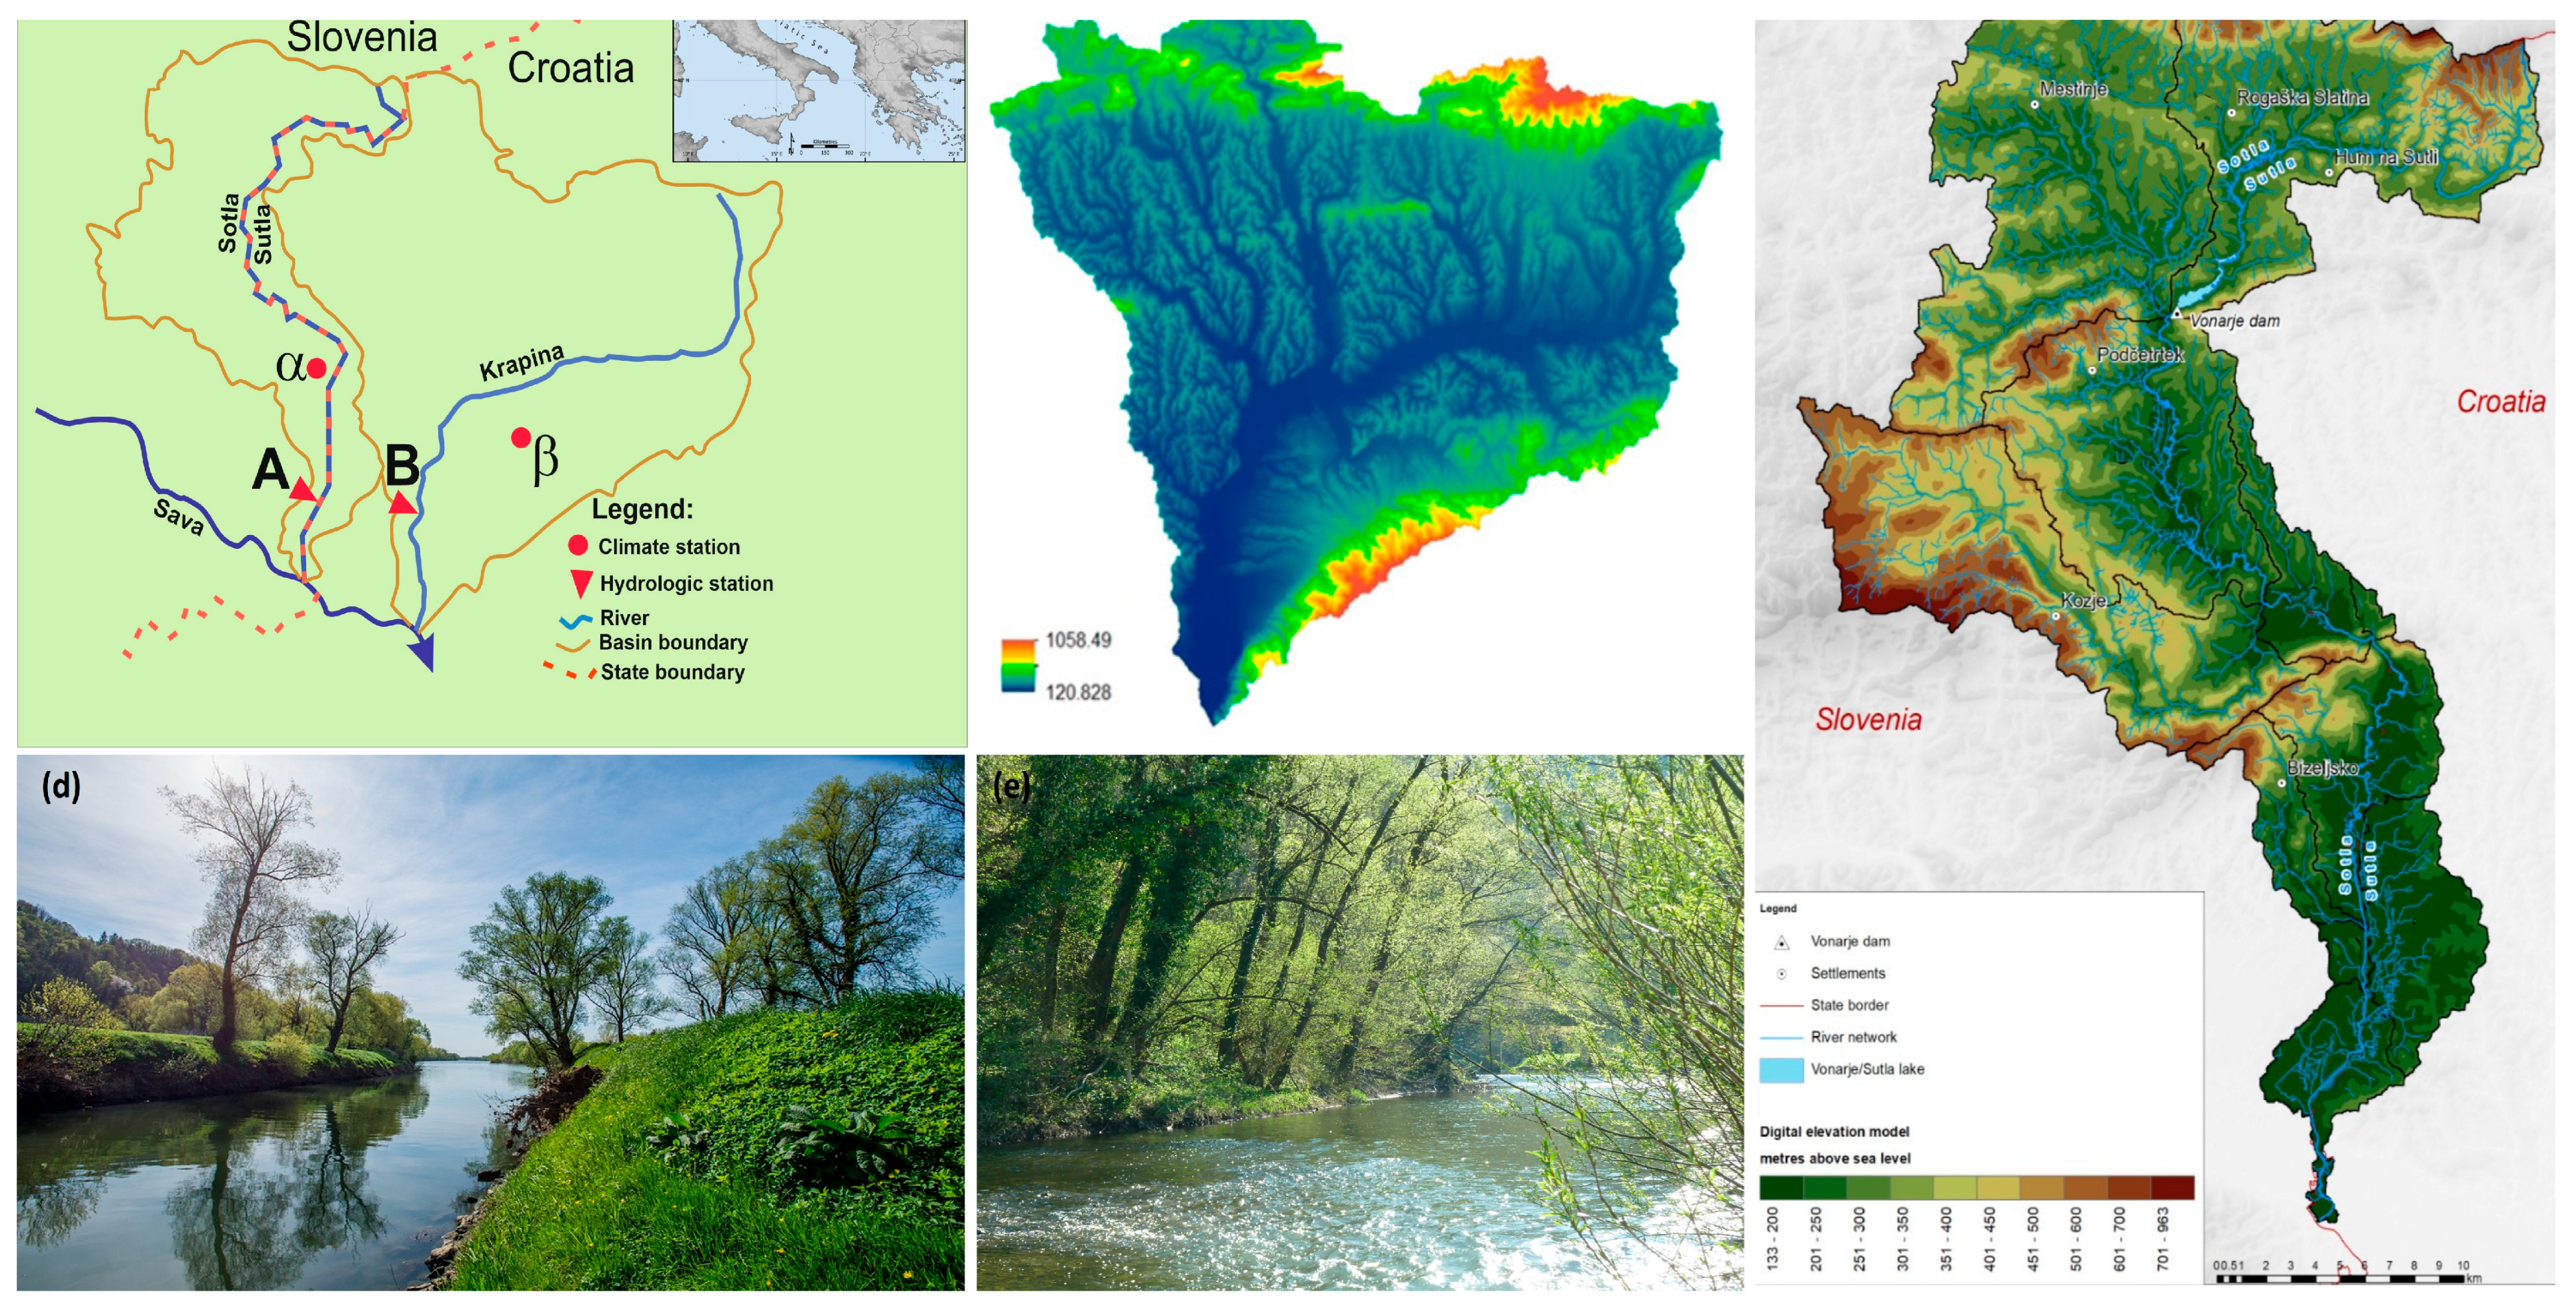
Figure 1 shows the catchment map of the Sutla and Krapina Rivers, indicating the locations of two hydrological gauging stations (A–Rakovec and B–Kupljenovo) and two climatological stations (α–Bizeljsko and β–Stubičke Toplice), whose data were used in the analyses. Both basins are located in Northern Croatia and Slovenia, draining into the Sava River, and are characterized by a temperate oceanic climate (Cfb, Köppen classification) with mild winters, moderately warm summers, and evenly distributed precipitation []. These conditions support a landscape of deciduous forest, pastures, and agricultural land, such as cereals and vineyards.
Sutla River Basin
The Sutla River (Sotla in Slovenian), a left-bank tributary of the Sava River, forms the natural border between Slovenia and Croatia along much of its 93.9 km course []. The catchment covers 581 km2, of which 451 km2 lies in Slovenia. The river originates at 625–640 m a.s.l. [,], and enters the Sava River at ~130 m a.s.l. []. The basin is highly asymmetric, with dominant right-bank tributaries (e.g., Mestinjščica, Bistrica ob Sotli), while left-bank tributaries are short, flashy and erosion-prone. The hydrological regime is classified as sub-Pannonian pluvial [] with annual high flows in late autumn and spring and pronounced low flows typically observed in August. Increasingly extreme seasonal hydrological events, linked to rising temperatures and short-duration, high-intensity precipitation, are threatening the river ecosystem by accelerating sediment and nutrient washout and endangering protected species [].
Krapina River Basin
The Krapina River, also a left-bank tributary of the Sava, lies in northern Croatia, bordered by the Sutla basin (east), the Lonja basin (west), and the Bednja basin (north). It originates on Ivanščica Mountain at ~1000 m a.s.l. [], and flows 68 km before reaching the Sava at 125 m a.s.l. The basin covers 1236 km2 with an asymmetric structure: 867 km2 on the right side and 369 km2 on the left [,]. The watershed length is 209.7 km. Poorly permeable soils (pseudogley, leached loess soils, and gleysols) contribute to surface water retention and infiltration losses, shaping local runoff processes. Land use consists of ~58% agriculture (13% pastures and meadows), 40% forest, and 2% urban and industrial areas [,]. While the basin lacks major dams or extensive urbanization, land use and soil properties strongly influence its hydrological response.
Figure 1. (a) Geographical location of the Sutla and Krapina River Basins, including the hydrological and meteorological stations listed in Table 1 (Rakovec—A; Kupljenovo—B; Bizeljsko—α; Stubičke Toplice—β); (b) Elevation map of the Krapina River Basin (adapted from []); (c) Digital elevation model of the Sutla River Basin (adapted from []); (d) Photograph of the Sutla River (source: Wikimedia Commons); and (e) Photograph of the Krapina River (source: Flickr—Vlado Ferenčić).
Shared Characteristics of Sutla and Krapina Basins
Neither basin has undergone extensive urbanization or damming, but both are affected by long-standing anthropogenic activities, primarily agriculture, forestry, and rural settlement. These interventions alter hydrological processes through land cover change, soil compaction, and drainage practices. Despite these pressures, the Sutla and Krapina basins remain ecologically significant and relatively unaffected by large-scale infrastructure development, supporting biodiversity and natural ecosystems. Their preservation requires continuous monitoring, protective measures, and sustainable management strategies to safeguard both environmental integrity and community wellbeing.

2.2. Data Used

All analyses in this study were conducted on an annual temporal scale, using precipitation, air temperature, and mean annual discharge data.
Annual mean streamflow data for the Rakovec gauging station on the Sutla River (known as Sotla in Slovenia) were obtained from the website of the Slovenian Environmental Agency (ARSO) in Ljubljana [].
Data for the Kupljenovo gauging station on the Krapina River were provided by the Croatian Meteorological and Hydrological Service (DHMZ) in Zagreb. The hydrological and meteorological data sources used in this study are summarized in Table 1.
Table 1. Hydrological and Meteorological Data Sources.
Station
(Label)
River/StationCoordinatesElevation
(m a.s.l.)
Record
Period
Drainage
Area
Rakovec (A)Sutla River—Discharge45°55′48″ N, 15°37′30″ E140.021926–2022
(93 years)
561.3 km2 (96.6%)
Kupljenovo (B)Krapina River—Discharge45°56′05″ N, 15°49′03″ E128.881964–2023
(60 years)
1150 km2 (93%)
Bizeljsko (α)Meteorological—Slovenia46°00′58″ N, 15°41′46″ E1751951–2024
(74 years)
Stubičke Toplice (β)Meteorological—Croatia45°58′31″ N, 15°55′26.9″ E1801961–2024
(64 years)
At the Rakovec gauging station (label A in Figure 1) on the Sutla River in Slovenia, a total of 93 complete years of annual mean discharge observations were available for the period 1926–2022, excluding the gap during World War II (1942–1945). On the Krapina River in Croatia, data for the Kupljenovo gauging station (label B in Figure 1) covered the period 1964–2023. The straight-line distance between the Rakovec and the Kupljenovo gauging stations is 15,896 m, while the distance between the Bizeljsko and Stubičke Toplice meteorological stations is 19,005 m.

2.3. Methods

Linear regression is a statistical method that describes the relationship between a dependent variable (Y) and one or more independent or predictor variables (X) using a linear function. This study employed methods of simple linear regression, multiple linear regression (MLR) [], and multiple log-linear regression (MLLR) [].
The general form of the simple linear regression equation is:
Y = (A × X) + B,
The coefficients A and B are estimated using the least squares method, which minimizes the sum of squared differences between the observed values and the regression line. A negative value of coefficient A indicates an inverse relationship between the analyzed variables or a declining trend, while a positive value implies a direct relationship.
MLR and MLLR models were applied to assess the extent to which the dependent variable Y can be explained by the predictors X. In this study, the dependent variables were the mean annual discharge (Q) and the annual runoff coefficient (RC), while the predictor variables were annual precipitation (P) and mean annual air temperature (T).
The equation for MLR is:
Y = A + (B × P) + (C × T),
where A, B, and C are coefficients determined by the least squares method
The equation for MLLR is:
Y = A × PB × TC,
For each analyzed relationship between the dependent and independent variables, the coefficient of determination (R2) was calculated. This coefficient indicates how well the predictor or predictors in a simple or multiple regression model explain the variation in the dependent variable. For example, a value of R2 = 0.80 implies that 80% of the total variation in the dependent variable can be explained by its relationship with the predictors.
The Rescaled Adjusted Partial Sums (RAPS) method is a statistical technique used to detect changes in trends or distribution within time series data [,]. The RAPS method identifies changepoints or inhomogeneities in the analyzed time series, such as abrupt or gradual shifts. In this study, the RAPS method was used to determine sub-periods with statistically significant differences in the average values of the analyzed variable.
The RAPS equation is defined as:
RAPSk = Σk ((Yk − YN)/SN),
where Yk is the value of the analyzed parameter at time step k, YN is the average of the entire time series, SN is the standard deviation of the complete series consisting of N observations, and k = 1, 2, …, N is the index used during summation.
The statistical significance of differences in average values between two adjacent sub-periods defined using the RAPS method was assessed through the F-test and t-test []. The F-test was used to evaluate whether there were significant differences in variances, while the t-test was applied to determine whether the average values of the two adjacent temporal subsets were statistically significantly different. In both tests, the significance level for rejecting the null hypothesis was set at p > 0.05.
Annual runoff coefficient (RC) values were calculated for the Rakovec gauging station on the Sutla River for the period 1951–2022, and at the Kupljenovo station on the Krapina River for the period 1964–2023. The runoff coefficient is one of the fundamental parameters in hydrological theory and practice. It quantifies the proportion of precipitation that becomes surface runoff relative to the total amount of precipitation falling over a given catchment area []. Theoretically, RC ranges between zero and one. The RC represents the ratio between the volume of water discharged through the gauging profile and the total volume of precipitation falling on the corresponding catchment area [].
The dimensionless annual runoff coefficient is defined as:
RC = Q/(P × A × t),
where Q is the mean annual discharge (in m3/s), P is the annual precipitation over the catchment area (in m), A is the catchment area (in m2), and t is the number of seconds in a year.

3. Results

3.1. Mean Annual Discharges

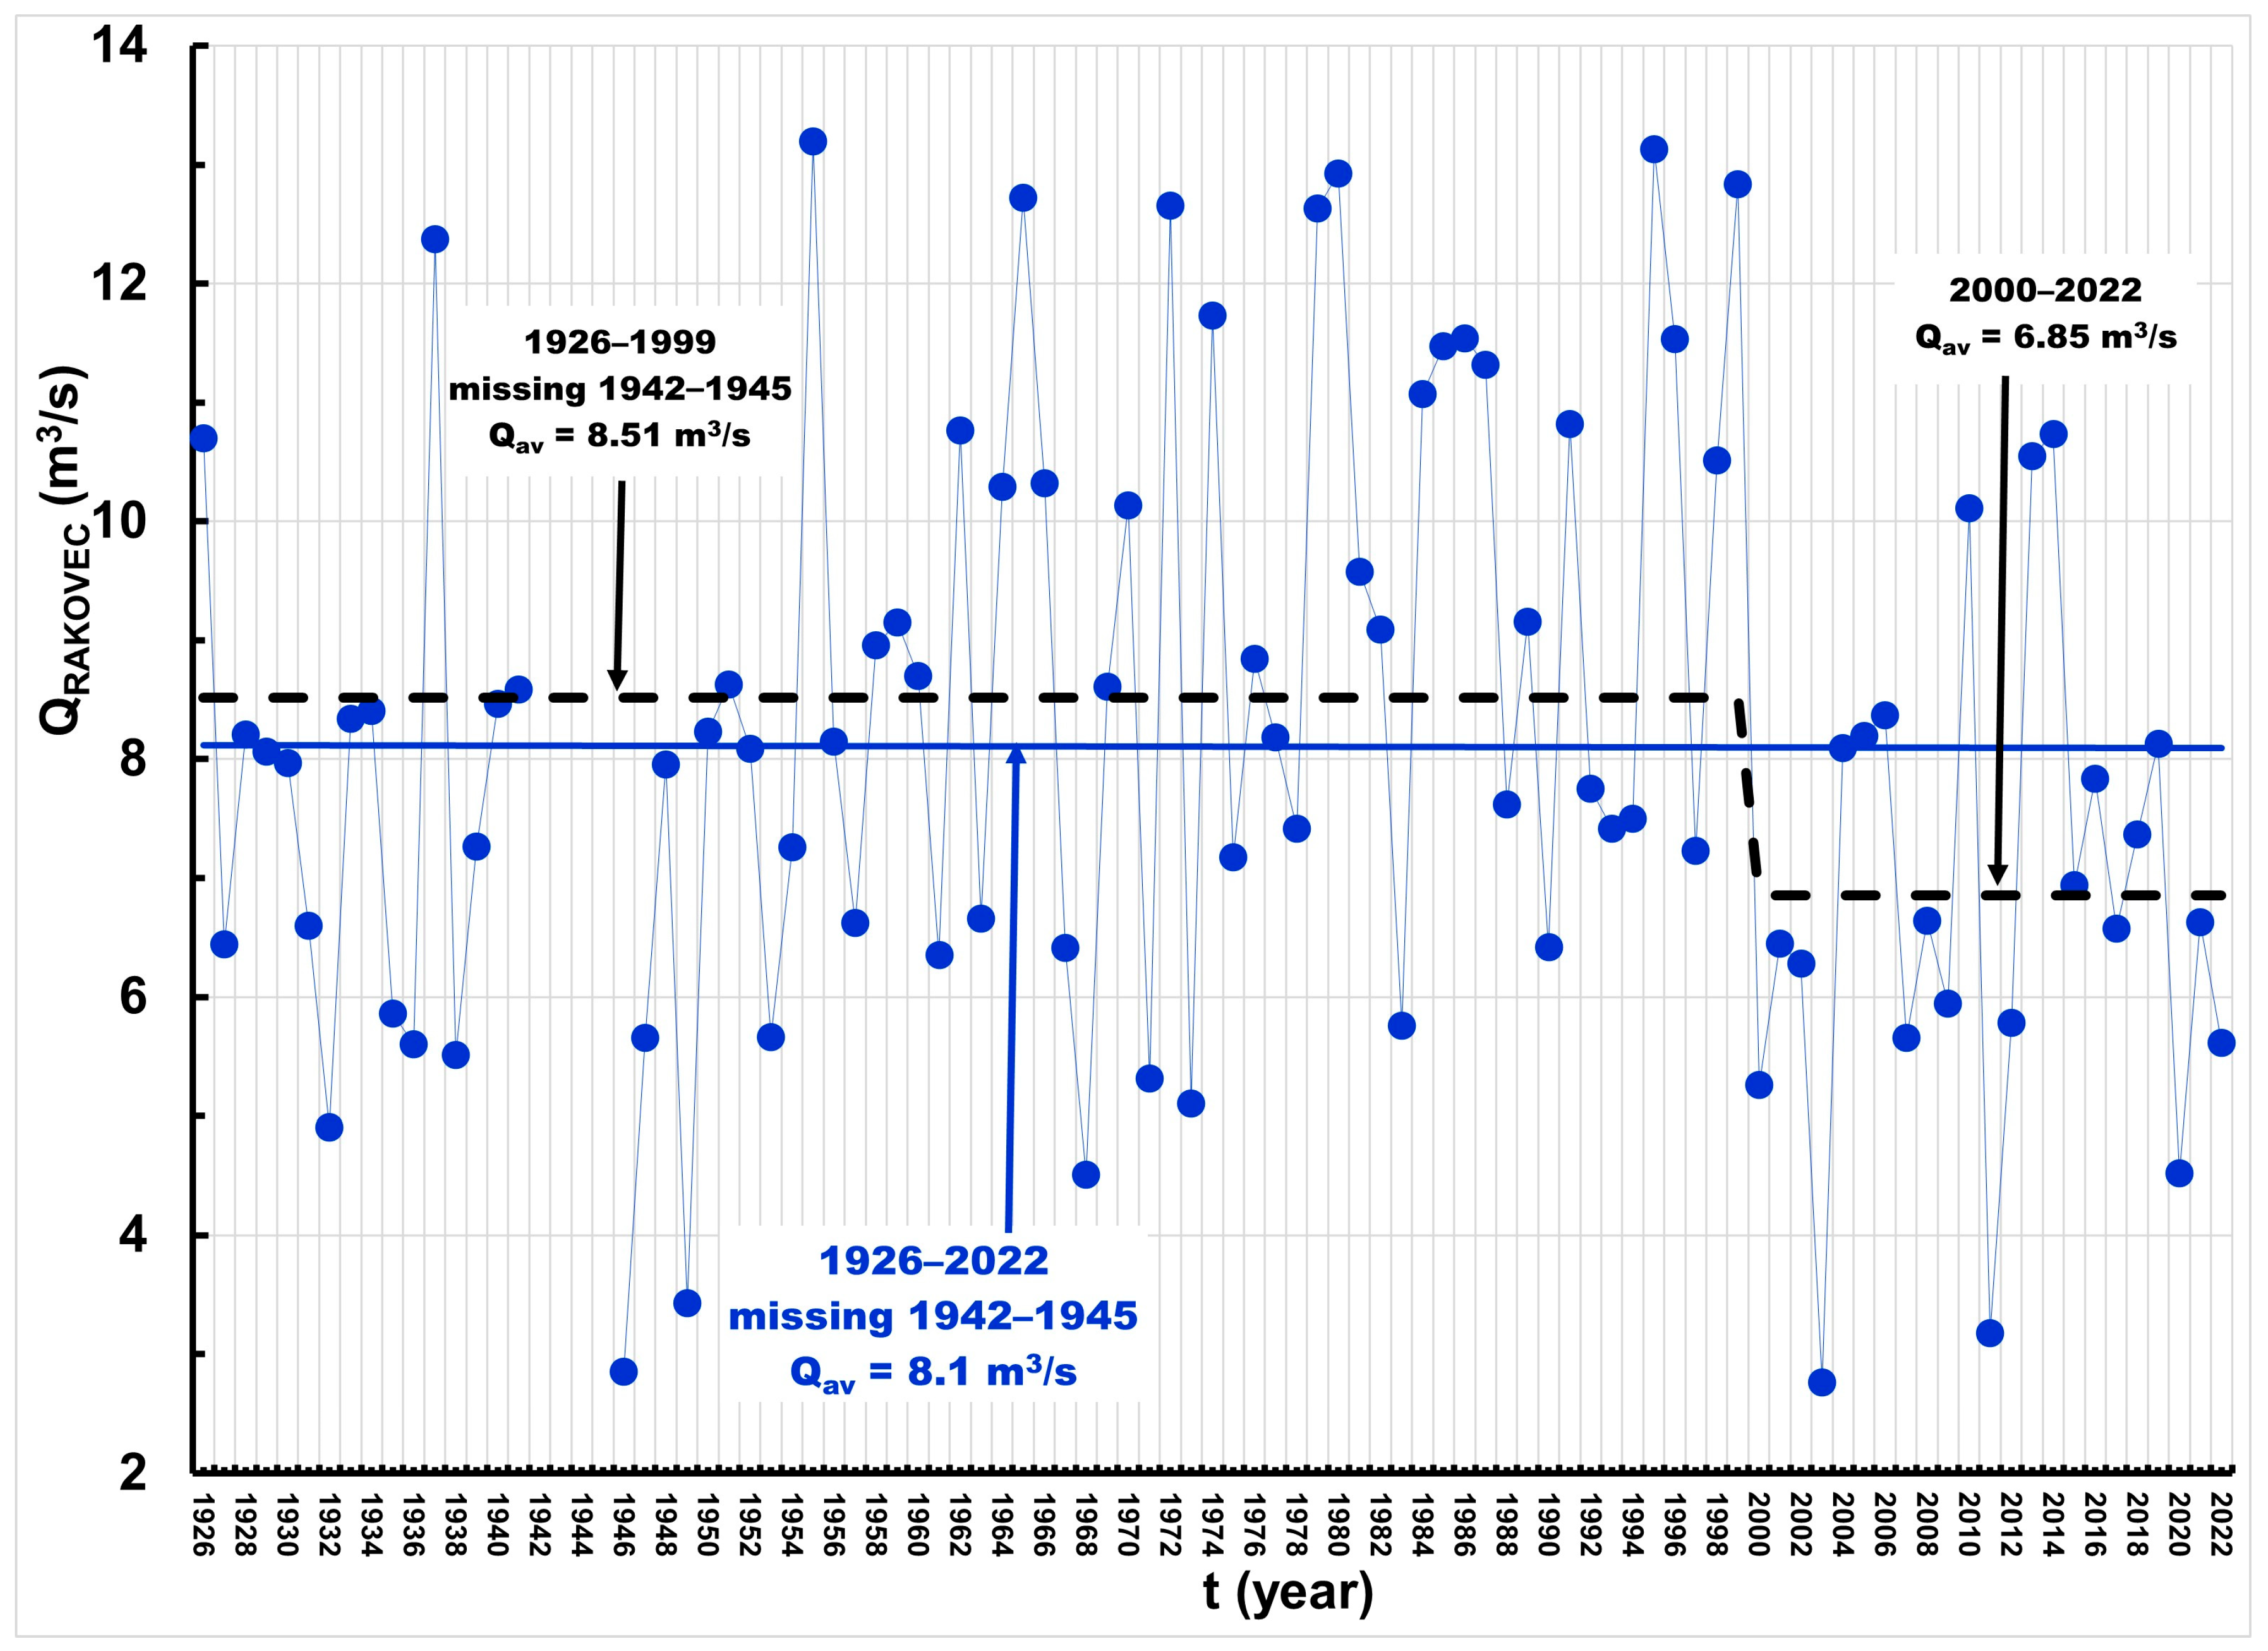
Figure 2 shows the time series of mean annual discharges observed at the Rakovec gauging station on the Sutla River during the period 1926–2022, with a gap in observations from 1942 to 1945.
Figure 2. Time series of mean annual discharges of the Sutla River at the Rakovec gauging station.
The average value of the mean discharge for the available period is 8.10 m3/s, ranging from a minimum of 2.76 m3/s observed in 2003 to a maximum of 13.2 m3/s observed in 1955. No clear increasing or decreasing trend was detected over this extended time series. Using the RAPS method, two sub-periods were identified with statistically significantly different average mean annual discharges. In the first sub-period (1926–1999, excluding 1942–1945), the average discharge was 8.51 m3/s, whereas in the more recent 23-year period (2000–2022), it was 1.66 m3/s lower, amounting to 6.85 m3/s. The probability value calculated using the t-test was well below the adopted significance threshold of p = 0.05. It is important to note that the F-test did not reveal a statistically significant difference in variance between the two adjacent subsets.
Figure 3 presents the time series of mean annual discharges observed at the Kupljenovo gauging station on the Krapina River over the 1964–2023 period.
Figure 3. Time series of mean annual discharges of the Krapina River at the Kupljenovo gauging station.
The average value of the mean discharge over this 60-year period was 11.2 m3/s, ranging from a minimum of 3.25 m3/s in 2011 to a maximum of 18.3 m3/s in 1965. Using the RAPS method, two sub-periods were identified with statistically significantly different average annual discharges. In the first sub-period (1964–1999), the average discharge was 11.9 m3/s, whereas in the most recent 24-year period (2000–2023), the mean value was 1.8 m3/s lower, at 10.1 m3/s. In this case as well, the F-test did not indicate a statistically significant difference in variance between the two subsets.
During the period 1964–2022 (a total of 59 years), when measurements were available from both gauging stations, the coefficient of determination between the mean annual discharge series of the Sutla River at Rakovec and the Krapina River at Kupljenovo was R2 = 0.810. This very high value clearly indicates the similarity of the hydrological regimes in the two neighboring catchments.

3.2. Annual Precipitation

Figure 4 displays the series of annual precipitation totals measured at the Bizeljsko meteorological station (in blue) for the period 1951–2024, and at the Stubičke Toplice station (in red) for the period 1961–2024.
Figure 4. Annual precipitation series measured at the Bizeljsko (blue) and Stubičke Toplice (red) climatological stations.
Both time series exhibit a slight but statistically insignificant decreasing trend in precipitation. On average, the decline at Bizeljsko is 6.5 mm per decade, while at Stubičke Toplice it is slightly higher, amounting to 22 mm per decade. At Bizeljsko, annual precipitation ranged from a minimum of 602.2 mm in 2003 to a maximum of 1335.9 mm in 1965. At Stubičke Toplice, the range was between 605.6 mm (2003) and 1458.9 mm (1962).
During the overlapping period of 1961–2024 (a total of 64 years), the average annual precipitation recorded at both stations was nearly identical: 1030.8 mm at Bizeljsko and 1037.0 mm at Stubičke Toplice. The coefficient of determination between the annual precipitation series measured at the Bizeljsko and Stubičke Toplice climatological stations was R2 = 0.731, indicating a strong similarity in precipitation regimes of the two adjacent catchments.

3.3. Mean Annual Air Temperatures

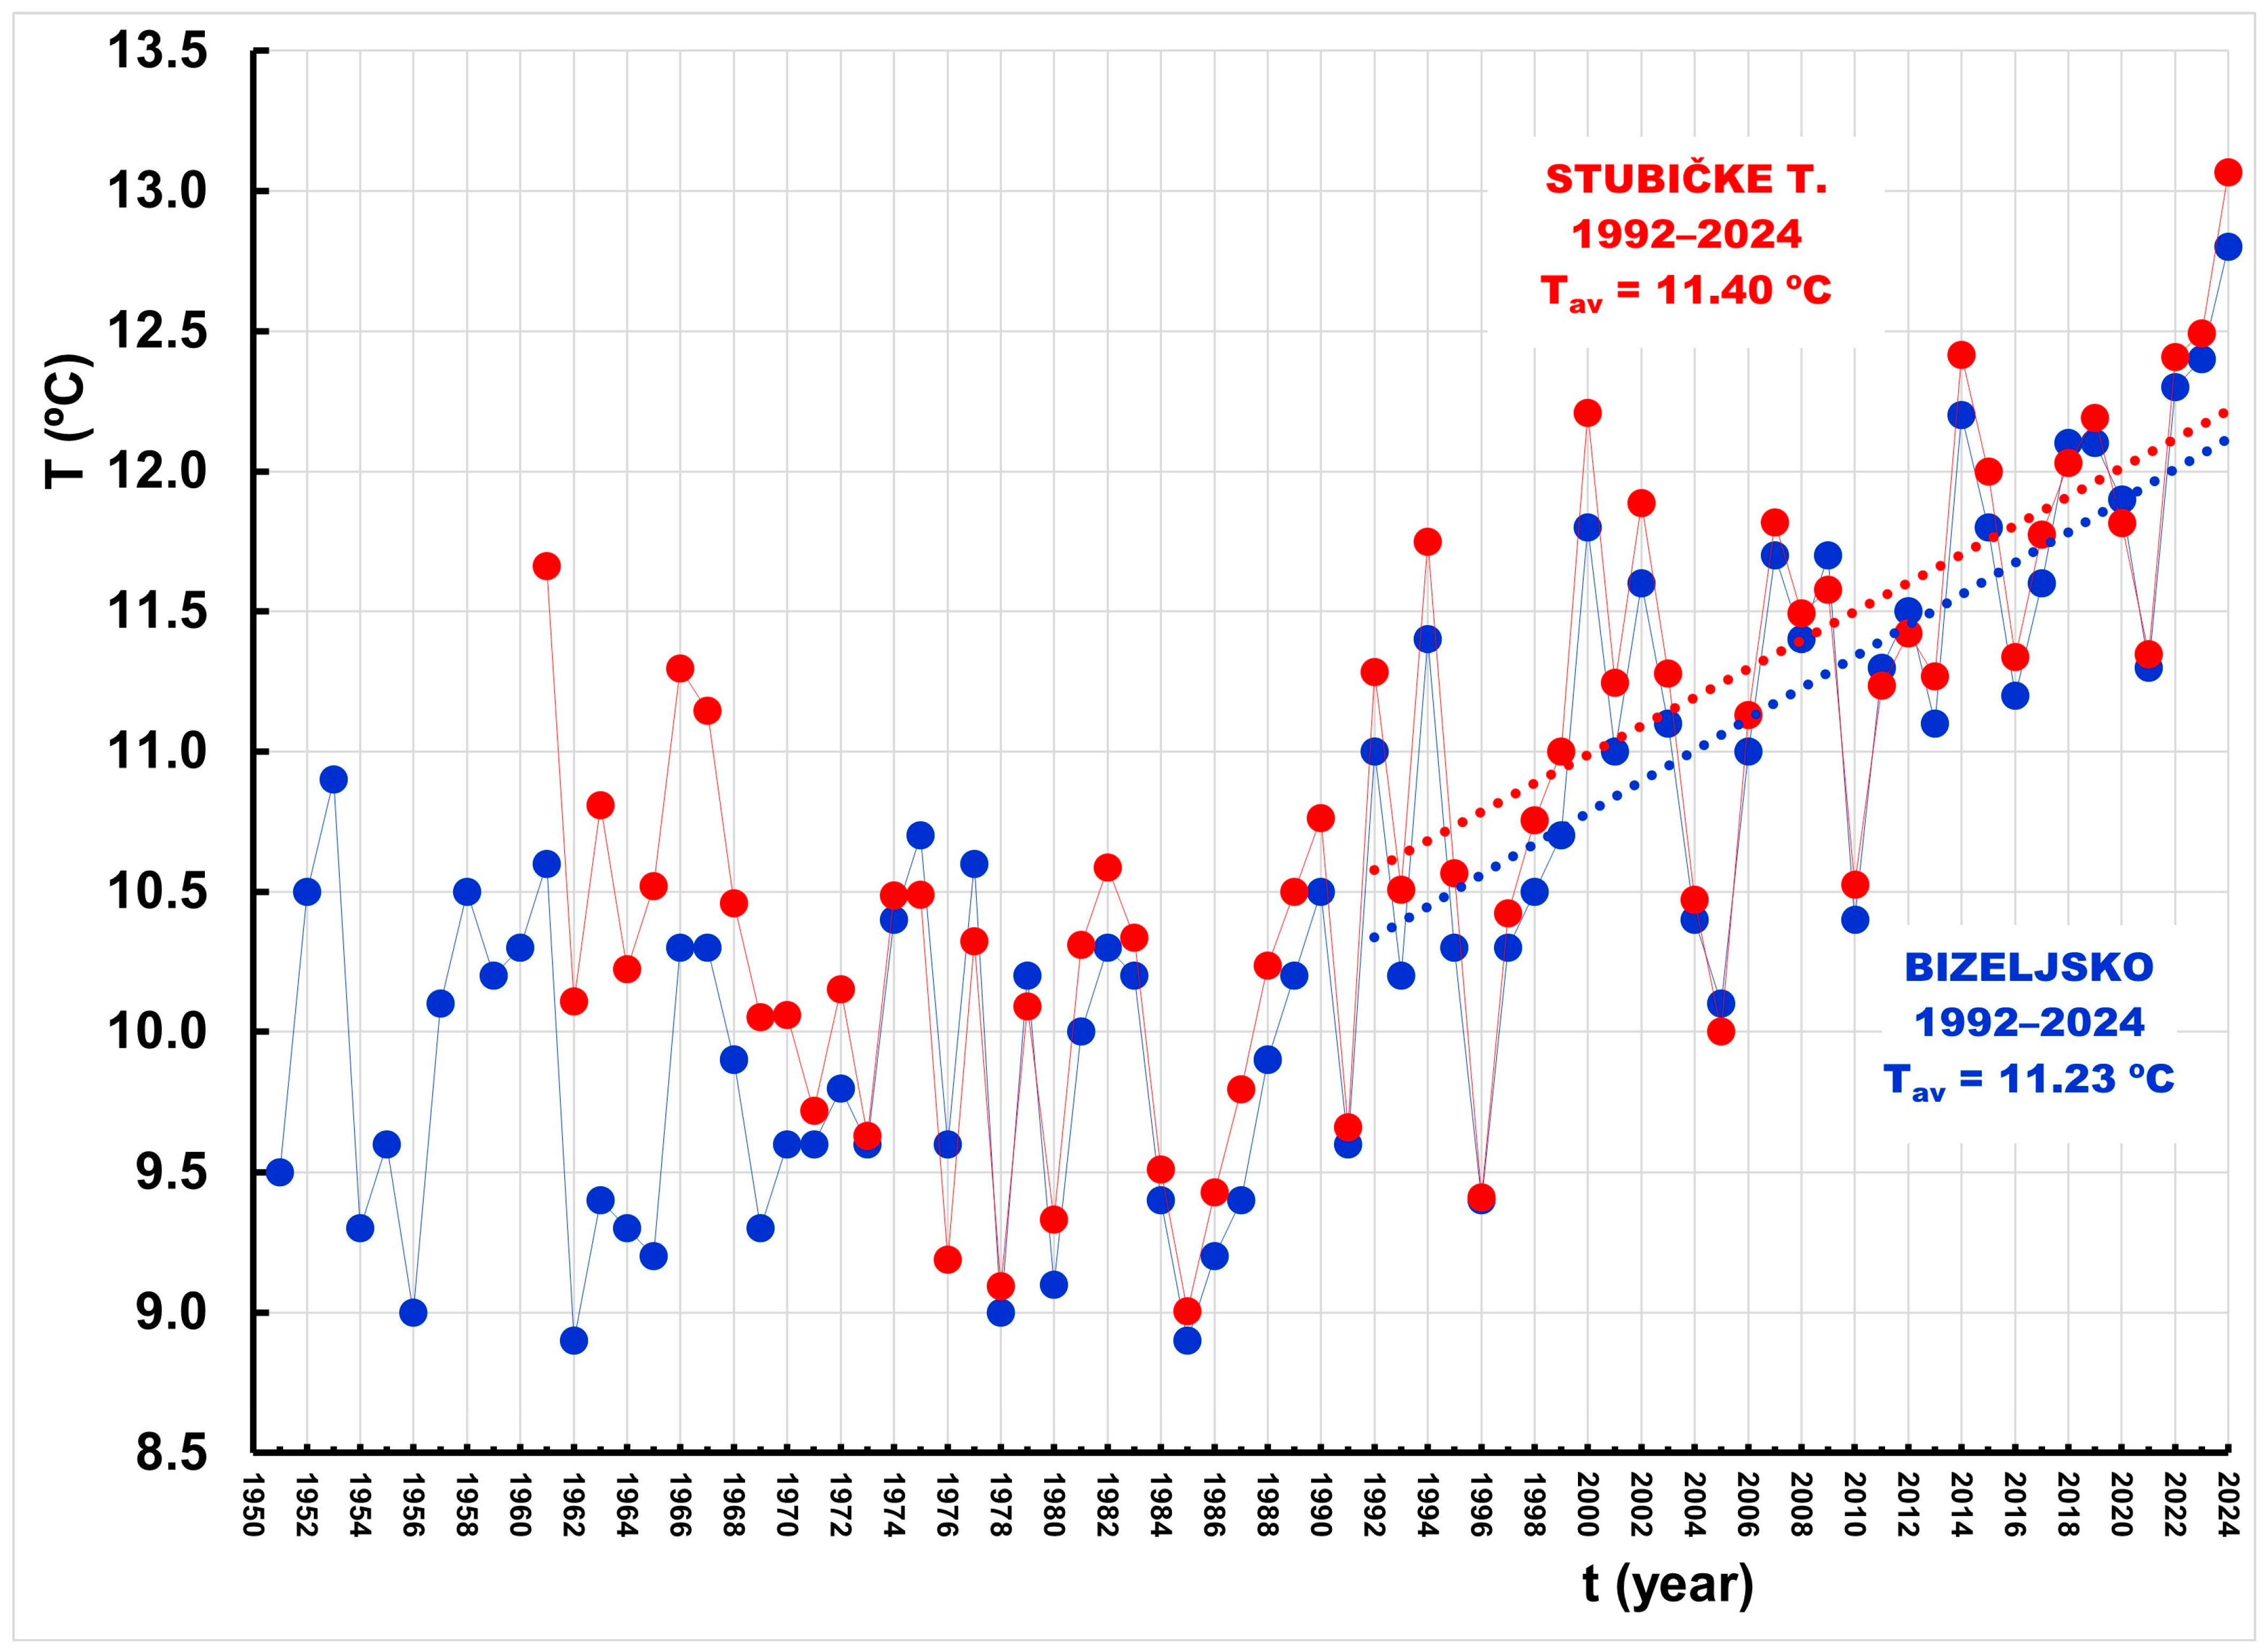
Figure 5 presents the series of mean annual air temperatures measured at the Bizeljsko meteorological station (in blue) for the period 1951–2024, and at the Stubičke Toplice station (in red) for the period 1961–2024.
Figure 5. Time series of mean annual air temperatures measured at the Bizeljsko (blue) and Stubičke Toplice (red) climatological stations.
A pronounced warming trend is clearly visible at both stations, beginning in 1992. At Bizeljsko, during the recent 33-year period (1992–2024), the average increase in mean annual air temperature was 0.577 °C per decade. At Stubičke Toplice, the warming trend was slightly less pronounced, with an average increase of 0.512 °C per decade over the same period.
For the overlapping period 1961–2024 (64 years), the coefficient of determination between the mean annual air temperature series measured at the Bizeljsko and Stubičke Toplice climatological stations was R2 = 0.871, indicating a high degree of similarity in the air temperature regimes of the two neighboring catchments.
It is noteworthy that the sharp decline in mean annual discharge at both gauging stations began in the year 2000—eight years after the onset of the intensified warming trend across the catchments.

3.4. Annual Runoff Coefficient

Although simple, the runoff coefficient is a powerful tool essential for water resources analysis, as it enables a rapid estimation of surface runoff. It serves as a foundation for designing and modeling many aspects of water engineering and risk management. In engineering practice, RC is used for the following purposes: (1) Drainage design and flood protection; (2) Urban planning and infrastructure development; (3) Flash flood risk assessment; and (4) Water resources management [,,].
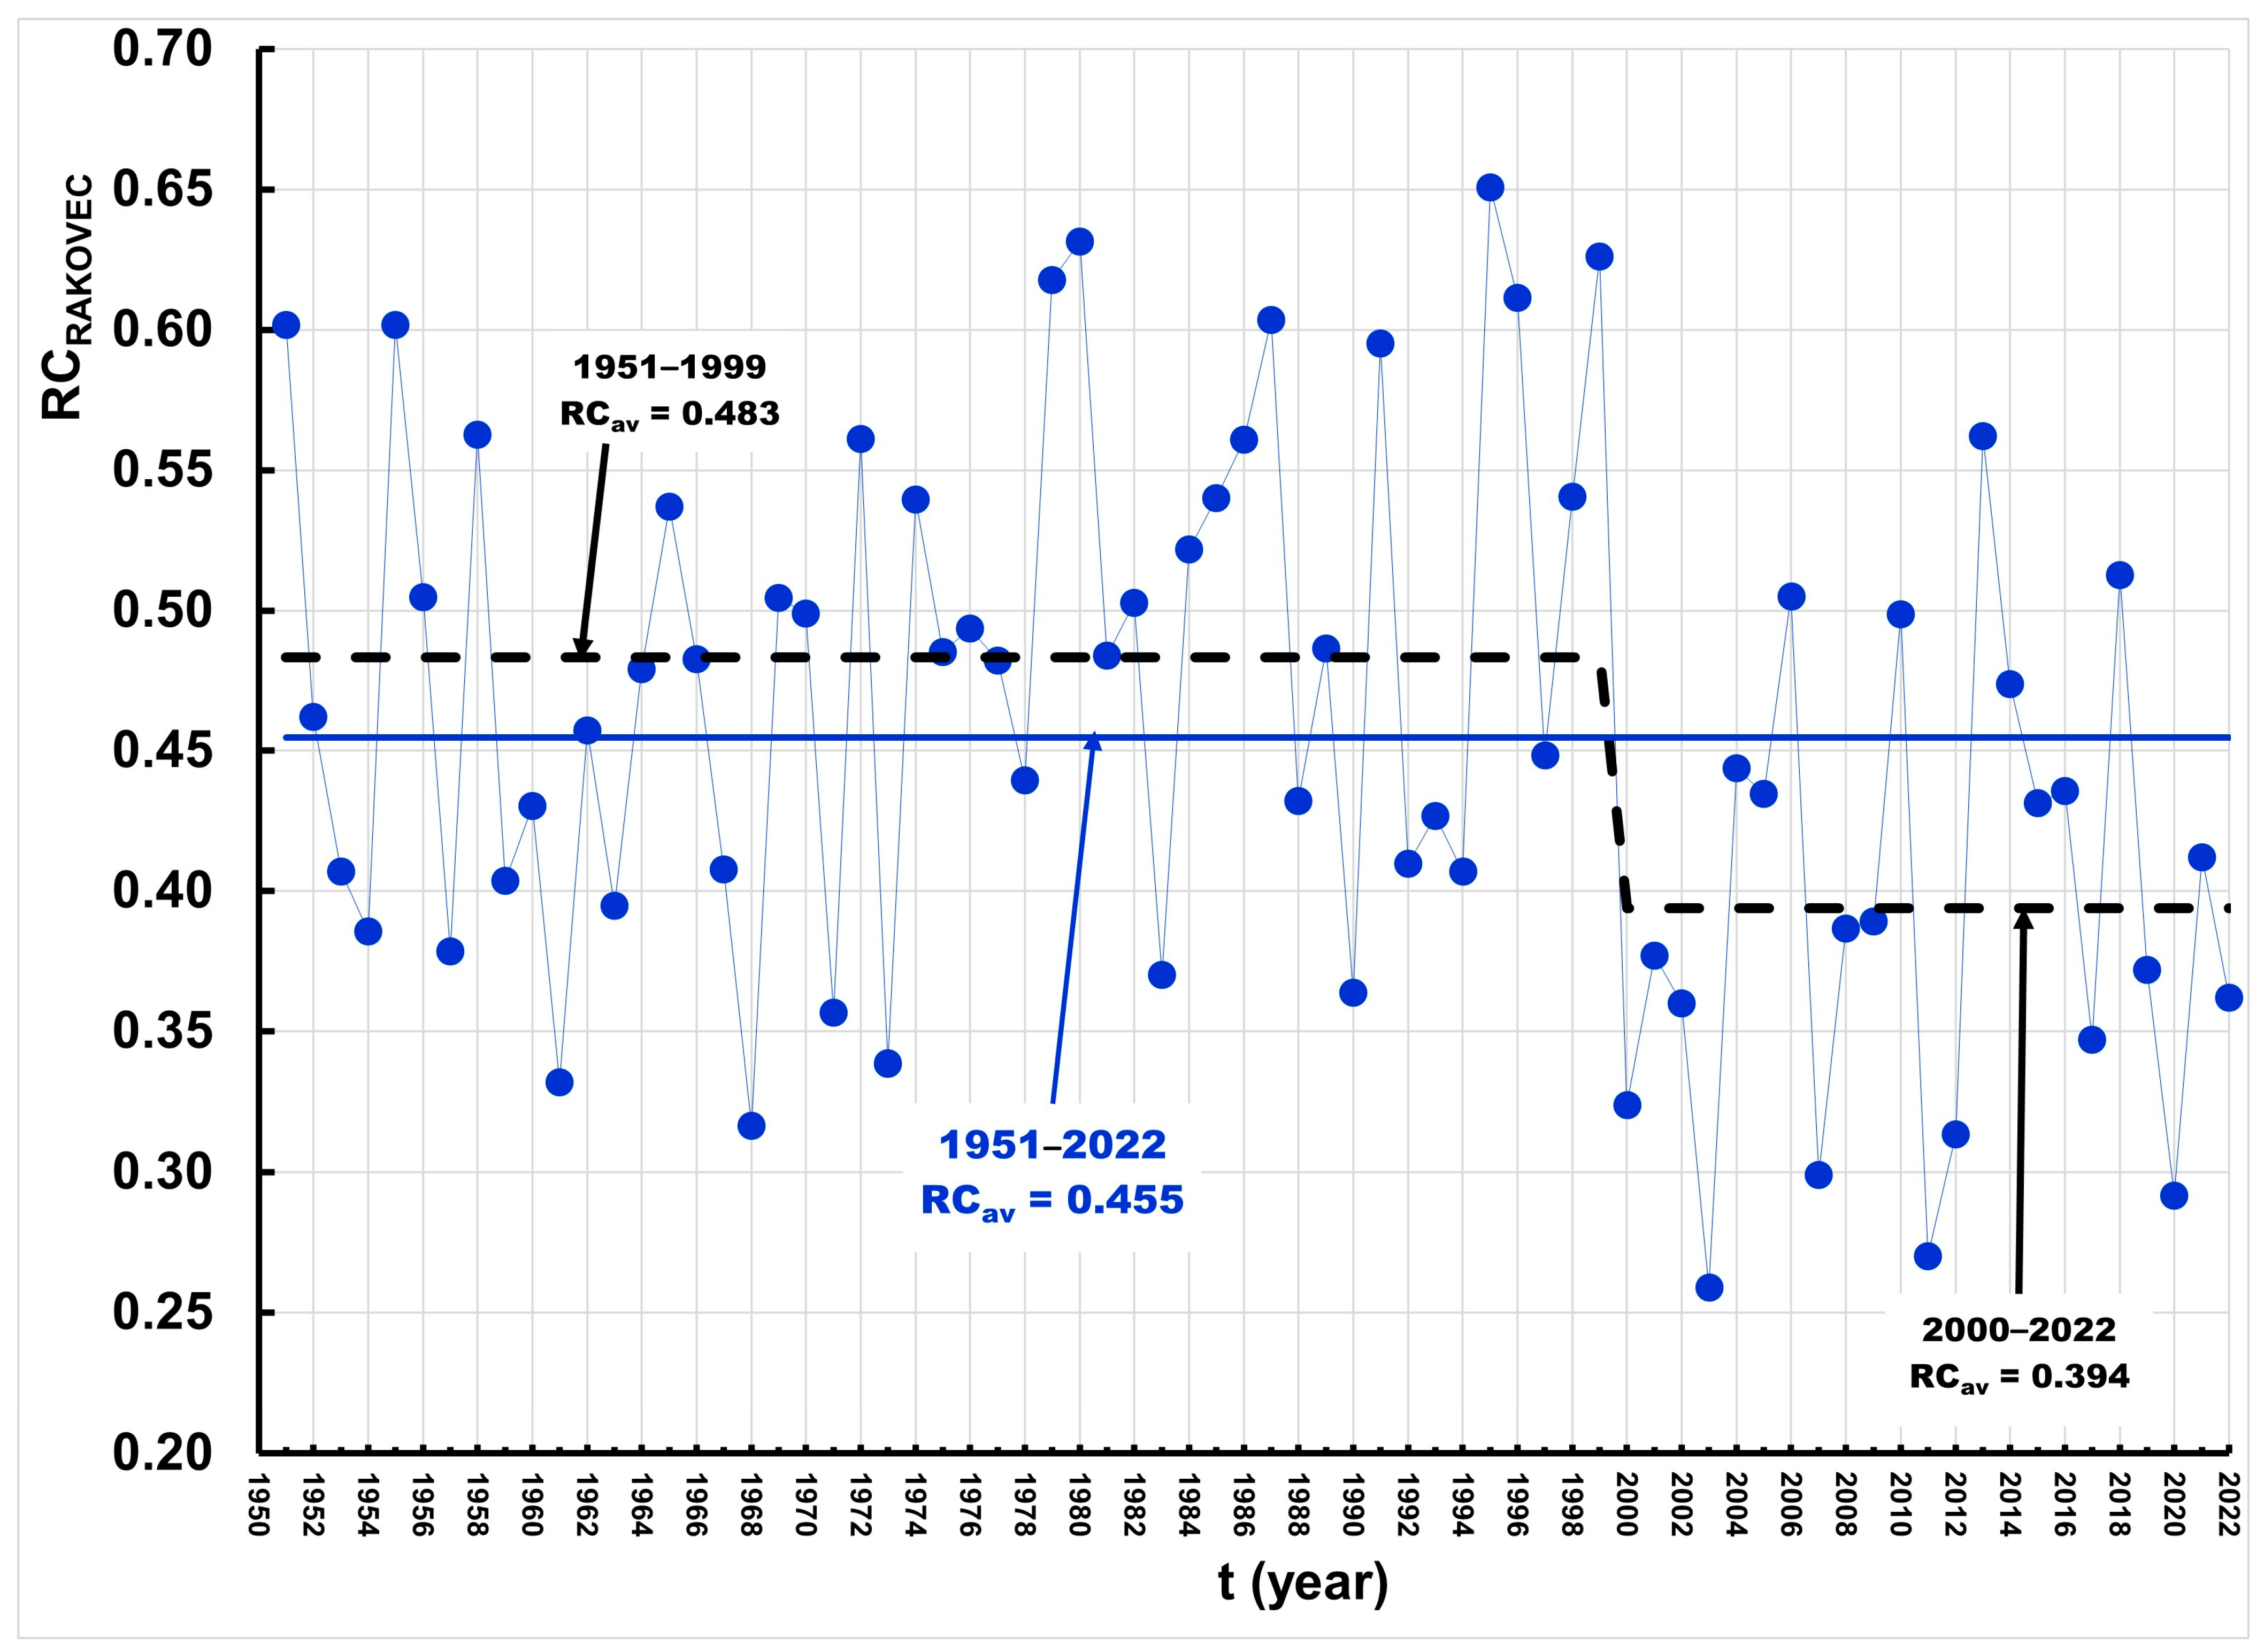
Figure 6 presents the series of annual runoff coefficients for the Sutla River at the Rakovec gauging station for the period 1951–2022.
Figure 6. Time series of annual runoff coefficients of the Sutla River at the Rakovec gauging station.
The average value of the series is 0.455, ranging from a minimum of 0.259 in 2003 to a maximum of 0.651 in 1995. Using the RAPS method, two sub-periods were identified with statistically significantly different averages. In the first sub-period (1951–1999), the average runoff coefficient was 0.483, which is notably higher than in the more recent sub-period (2000–2022), when it declined to 0.394.
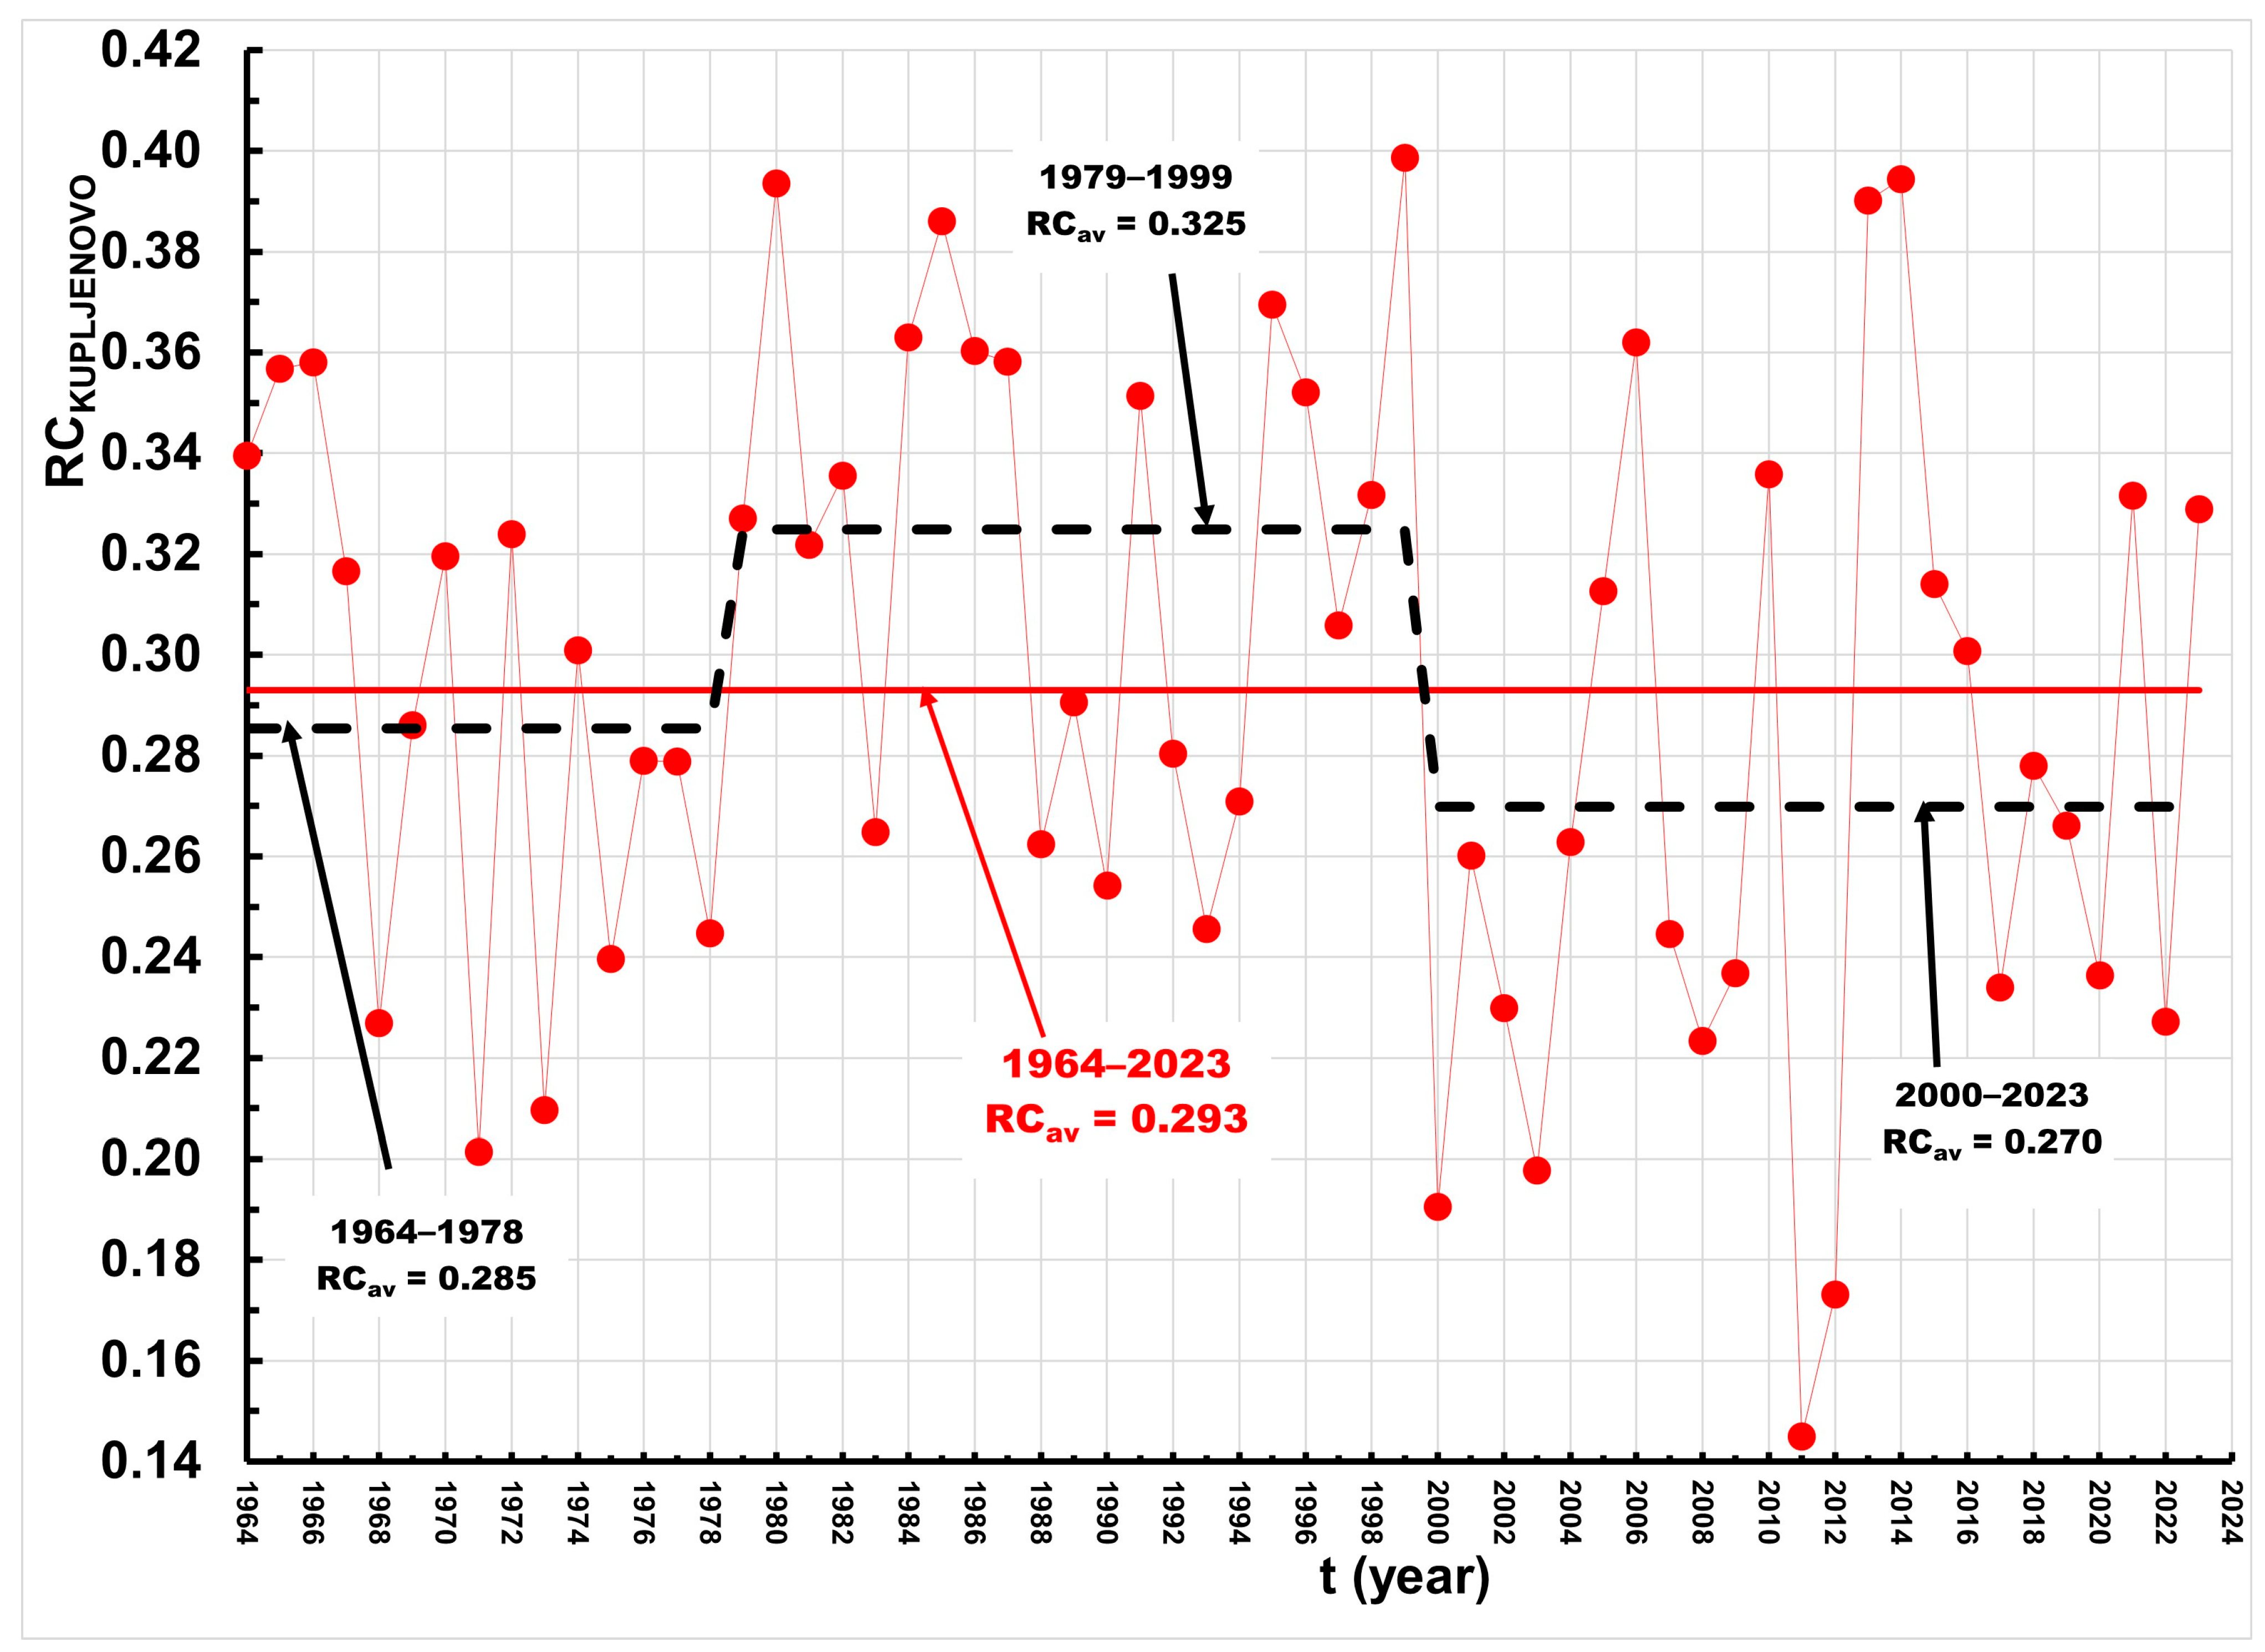
Figure 7 shows the series of annual runoff coefficients for the Krapina River at the Kupljenovo gauging station for the period 1964–2023.
Figure 7. Time series of annual runoff coefficients of the Krapina River at the Kupljenovo gauging station.
The average value of the series is 0.293, with a minimum of 0.145 recorded in 2011 and a maximum of 0.399 in 1999. The RAPS method identified three sub-periods with statistically significant differences in mean values between adjacent intervals. In the first sub-period (1964–1978), the average runoff coefficient was 0.285. In the second sub-period (1979–1999), the average increased to 0.325. In the most recent sub-period (2000–2023), the average declined to its lowest recorded value of 0.270.
When comparing the annual runoff coefficients for the two neighboring catchments, it is evident that values in the Sutla basin are significantly higher. During the period 1964–2022, when measurements were available at both stations, the coefficient of determination between the annual runoff coefficient series of the Sutla River at Rakovec and the Krapina River at Kupljenovo was R2 = 0.714, indicating a strong similarity in the hydrological behavior of the two catchments.
Figure 8 illustrates the relationship between the annual runoff coefficients in the Krapina River at Kupljenovo (ordinate axis) and the Sutla River at Rakovec (abscissa axis) for the 1964–2022 period.
Figure 8. Relationship between annual runoff coefficients of the Krapina River at Kupljenovo and the Sutla River at Rakovec for the period 1964–2022.
A comparison of the annual runoff coefficients in the two neighboring catchments reveals that values in the Sutla catchment are significantly higher, as shown in Figure 8. Between 1964 and 2022, the average runoff coefficient at Kupljenovo was 0.292, while at Rakovec it was 0.458.
One limitation of the annual runoff coefficient calculations in this study is that precipitation data for each basin were obtained from only a single climatological station. This was necessary due to the lack of continuous, long-term observations at other climatological or rain gauge stations in the area. However, this limitation does not appear to have significantly affected the reliability of the presented results. The precipitation regimes in both catchments are highly uniform and comparable, with average annual precipitation typically ranging between 1000 mm and 1100 mm, as confirmed by previous studies using denser station networks [,,,,]. We estimate that the potential error in the annual runoff coefficients calculated here is approximately ±5%, and at most ±10%.

3.5. Relationship Between Mean Annual Discharges (Q), Annual Precipitation (P) and Mean Annual Air Temperatures (T)

Table 2 presents the regression coefficients A, B, and C calculated using the MLR and MLLR methods for the relationship Q = f(P, T), where Q is the mean annual discharge, P is the annual precipitation, and T is the mean annual air temperature. The results refer to the Sutla River at the Rakovec gauging station based on predictor data from the Bizeljsko meteorological station.
Table 2. Matrix of regression coefficients A, B, and C (with corresponding p-values) and the coefficient of determination (R2) for the relationship Q = f(P, T), calculated using the MLR and MLLR methods for three time periods at the Rakovec gauging station on the Sutla River. Calculations were performed for the following three periods: (1) 1951–2022; (2) 1951–1999; and (3) 2000–2022. The final column of the table provides the corresponding coefficients of determination (R2).
Based on the R2 values, it can be concluded that the MLR and MLLR models yield nearly identical results. It is worth noting that R2 values for the period 1951–1999 are slightly lower than those for the more recent period 2000–2022. In the recent period, the influence of temperature has increased considerably in a negative sense, contributing to a reduction in mean annual discharge. Average annual air temperatures in 2000–2022 were higher than in the preceding period, 1951–1999. The temperature-related regression coefficient C is negative in both models, with a higher absolute value in the recent period, confirming that air temperature now plays a more pronounced role in reducing mean annual discharge. The difference in the absolute values of the C coefficients between the two adjacent periods is more pronounced in the MLLR model than in the MLR model.
Table 3 presents the regression coefficients A, B, and C calculated using the MLR and MLLR methods for the relationship Q = f(P, T), where Q represents the mean annual discharge of the Krapina River at the Kupljenovo gauging station. The predictor variables, annual precipitation and mean annual temperature, were obtained from the Stubičke Toplice meteorological station.
Table 3. Matrix of regression coefficients A, B, and C (with corresponding p-values) and the coefficient of determination (R2) for the relationship Q = f(P, T), calculated using the MLR and MLLR methods for three time periods at the Kupljenovo gauging station on the Krapina River. Calculations were performed for the following three periods: (1) 1951–2022; (2) 1951–1999; and (3) 2000–2022. The final column of the table provides the corresponding coefficients of determination (R2).
Calculations were performed for the following three periods: (1) 1964–2023; (2) 1964–1999; and (3) 2000–2023. The final column in the table lists the corresponding R2 values.
At this gauging station as well, the values of the determination coefficients calculated using the MLR and MLLR methods yield nearly identical results. The R2 values for the Krapina catchment are slightly higher than those obtained for the Sutla catchment. As observed previously, the R2 values for the 1964–1999 period are somewhat lower than those for the more recent period, 2000–2023. In the recent period, the influence of temperature has increased significantly, contributing to the reduction of mean annual discharge. In both models, the regression coefficient C, associated with mean annual air temperature, is negative, with a higher absolute value in the recent period compared to the earlier one. This suggests that air temperature now plays a more pronounced role in reducing mean annual discharge. As in the Sutla catchment, the difference in the absolute values of coefficient C between the two adjacent sub-periods is more pronounced in the MLLR model than in the MLR model.

3.6. Relationship Between Annual Runoff Coefficients, Annual Precipitations, and Mean Annual Air Temperatures

Table 4 presents the regression coefficients A, B, and C, calculated using the MLR and MLLR methods for the relationship RC = f(P, T), based on annual runoff coefficients (RC) of the Sutla River at the Rakovec gauging station. The predictor variables, annual precipitation and mean annual air temperature, were obtained at the Bizeljsko meteorological station.
Table 4. Matrix of regression coefficients A, B, and C (with corresponding p-values) and the coefficient of determination (R2) for the relationship RC = f(P, T), calculated using the MLR and MLLR methods for three time periods at the Rakovec gauging station on the Sutla River. Calculations were performed for the following three periods: (1) 1951–2022; (2) 1951–1999; and (3) 2000–2022. The final column of the table provides the corresponding coefficients of determination (R2).
The calculations were performed for the following three time periods: (1) 1951–2022; (2) 1951–1999; and (3) 2000–2022. The final column provides the corresponding coefficients of determination (R2).
The R2 values indicate that both the MLR and MLLR methods produce nearly identical results. It is worth noting that R2 values for the 1951–1999 period are slightly lower than those for the more recent period, 2000–2022. In the recent period, the influence of temperature has significantly increased, negatively affecting the annual runoff coefficients by contributing to their decline. Average annual temperatures during 2000–2022 were higher than in the previous period, 1951–1999. The regression coefficient C, associated with temperature, is negative in both models but exhibits a slightly higher absolute value in the recent period, indicating a stronger influence of temperature on the reduction in runoff coefficients in recent decades. The difference in the absolute values of coefficient C between the two sub-periods is greater in the MLLR model than in the MLR model.
Table 5 presents the regression coefficients A, B, and C calculated using the MLR and MLLR methods for the relationship RC = f(P, T), based on annual runoff coefficients of the Krapina River at the Kupljenovo gauging station. The predictor variables, annual precipitation and mean annual air temperature, were obtained from the Stubičke Toplice meteorological station.
Table 5. Matrix of regression coefficients A, B, and C (with corresponding p-values) and the coefficient of determination (R2) for the relationship RC = f(P, T), calculated using the MLR and MLLR methods for three time periods at the Kupljenovo gauging station on the Krapina River. Calculations were performed for the following three periods: (1) 1951–2022; (2) 1951–1999; and (3) 2000–2022. The final column of the table provides the corresponding coefficients of determination (R2).
Calculations were performed for the following three periods: (1) 1964–2023; (2) 1964–1999; and (3) 2000–2023. The final column provides the corresponding coefficients of determination (R2).
As with the Sutla River, the R2 values from both regression methods are nearly identical. The values for the earlier period (1964–1999) are slightly lower than those for the more recent period (2000–2023). In the recent period, temperature has exerted a stronger negative influence on the annual runoff coefficients. Air temperatures in 2000–2023 were higher than in 1964–1999. The coefficient C in both models is again negative and has a slightly higher absolute value in the recent period, confirming its growing influence on reducing runoff. The change in the absolute value of the coefficient C between the two sub-periods is also greater in the MLLR model than in the MLR model.
When comparing the results presented in Table 1 and Table 2, which analyze the relationship Q = f(P, T), with those in Table 3 and Table 4 for RC = f(P, T), it is important to observe that the coefficients of determination (R2) for the runoff coefficient series are significantly lower than those for mean annual discharge. This indicates that annual runoff coefficients are less dependent on annual precipitation and mean annual temperature than the mean discharge. While Q is directly proportional to annual precipitation (P), the runoff coefficient is defined as the ratio Q/P. If both Q and P increase proportionally, the runoff coefficient may remain constant. However, in the analyzed cases, precipitation has generally stagnated, while air temperature has risen substantially, leading to a marked decrease in the runoff coefficient. Moreover, annual runoff coefficients are sensitive to other local factors. As these involve more complex interactions, including additional variables and nonlinear effects, both regression methods yield weaker model performance, as indicated by the lower R2 values.

4. Discussion

The runoff coefficient is a key hydrological parameter that reflects the influence of natural geomorphological features, soil properties, and land use on the transformation of precipitation into streamflow []. As highlighted by Lallam et al. [], RC is governed by a broad set of variables—many difficult to quantify precisely—including rainfall intensity, timing, spatial variability, antecedent soil moisture, vegetation cover, and land use. Even within a single catchment, RC values can vary significantly in response to changing environmental and meteorological conditions.
Previous studies support this complexity. For instance, Machado et al. [] found that catchments dominated by natural vegetation exhibited more stable RC values, while those altered by human activity showed greater variability. Typically, high RC values are linked with impermeable or saturated soils, steep slopes, and urban areas, while low RC values occur in regions with permeable soils, flat terrain, and dense vegetation cover. A large-scale analysis of nearly 50,000 flood events in 337 Austrian catchments also demonstrated that RC varies depending on flood type, being lowest during flash floods and progressively increasing from short- to long-duration rain floods, rain-on-snow events, and snowmelt-driven floods [].
In the present study, the observed differences in RC between the Sutla and Krapina basins can largely be attributed to contrasting physical and geological characteristics. The Sutla River catchment upstream of the Rakovec station features more varied topography and steeper slopes, which promote rapid surface runoff and limit infiltration [,]. In contrast, the Krapina basin upstream of Kupljenovo is characterized by flatter terrain and more permeable soils, including karst formations that enhance subsurface water movement and reduce runoff efficiency [,]. Additionally, the Sutla basin has a denser stream network and a shorter time of concentration due to its steep terrain and shorter flow paths []. The time of concentration—the time required for runoff from the most distant point in the basin to reach the outlet—plays a crucial role in shaping hydrological response, influencing both flood risk and streamflow dynamics [].
These catchment-specific differences highlight the need for high-resolution, long-term hydrometeorological data and site-specific modeling to accurately assess and predict the impacts of climate change on water resources in small basins. The results of this study demonstrate that mean annual discharge and RC have declined markedly since 2000 in both basins, largely driven by a rise in mean annual air temperatures. The reduced runoff efficiency, particularly under low-flow conditions and during summer baseflow periods, is often associated with elevated river water temperatures. While this relationship was not directly analyzed in the present study, it has been documented in many parts of the region [,,,,,,].
Concerning trends have been documented for the water temperatures of many tributaries of the Danube in Croatia [,] and for the Drava River along its entire course through Croatia [,,]. Tadić et al. [] have drawn attention to potentially negative climate-driven hydrological changes in the Mura, Drava, and Danube rivers, with implications for natural resources in several UNESCO biosphere reserves across the region. The troubling rise in water temperatures of the Sava River near Zagreb has been thoroughly addressed in Bonacci et al. []. Unfortunately, the lack of systematic and long-term water temperature monitoring in the Sutla and Krapina basins prevented such analysis in this study. This gap underlines the urgent need to implement continuous water temperature monitoring programs, especially in smaller rivers where climate impacts are often more acute.
While changes in mean discharge and RC occur gradually, their cumulative effects are likely to intensify over time, potentially resulting in significant ecological disruption and socio-economic challenges. The effects of changing climate, land use, and associated human interventions are especially pronounced in small catchments such as Sutla and Krapina, where even moderate shifts in agricultural practices or forest cover can significantly alter runoff dynamics. These catchments are particularly vulnerable to the compounded effects of climate change and land use transformation. As these stressors increase, the risk of more frequent and severe hydrological droughts is also expected to rise.
Importantly, our analysis revealed a distinct shift in flow parameters around the year 2000. This rupture aligns with broader regional climate changes observed across Central and Southeastern Europe, including rising temperatures, shifts in precipitation timing, and altered atmospheric circulation patterns. The increasing predictive power of temperature for both discharge and runoff coefficients in recent decades suggests that hydrological systems in the region may be transitioning into a new, climate-driven regime.
To address the associated risks, integrated planning and the adoption of evidence-based adaptation strategies are essential. These efforts should prioritize preservation of ecosystem services and biodiversity while ensuring the sustainability of water resources for local communities. The approach used in this study, combining long-term discharge and climate data with statistical modeling, provides a transferable framework for detecting hydrological change and informing future water management strategies.
Beyond its scientific contribution in quantifying the effects of climate variables on hydrological responses, this study also provides practical insights. The findings can inform the development of locally adapted water management plans and early warning systems for drought. Furthermore, the study highlights the need to expand environmental monitoring networks to include water temperature and land use changes. Strengthening these systems is essential to support timely and effective adaptation to the rapidly evolving hydrological conditions brought on by climate change.

5. Concluding Remarks

The study of two neighboring but environmentally distinct basins provides several important insights into hydrological responses to climate variability and change:
  • Since 2000, both catchments have experienced a significant decline in mean annual discharge, coinciding with a marked increase in mean annual air temperatures beginning around 1992.
  • In recent decades, air temperature has emerged as a more dominant driver than precipitation, exerting a strong negative influence on both streamflow and runoff coefficients. However, a direct comparison of the relative impacts of temperature and precipitation requires further investigation using standardized predictors.
  • Runoff coefficients remain closely linked to precipitation and discharge, yet they are also shaped by local geomorphological, pedological, and land-use characteristics.
  • The Krapina basin, characterized by permeable soils and gentler slopes, shows lower runoff coefficient values and higher infiltration losses.
  • The Sutla basin, with steeper slopes and shorter concentration times, exhibits higher runoff coefficients and more intense surface runoff.
  • Regression analyses using both MLR and MLLR approaches yielded consistent results, highlighting the increasingly nonlinear and basin-specific impacts of climate change on runoff.
  • The declining sensitivity of runoff coefficients to precipitation and temperature, compared to discharge, underscores the need to incorporate additional local variables, particularly land-use, into future hydrological modeling.
These findings emphasize the importance of climate-aware, basin-specific approaches in future hydrological assessments and water resource planning. The omission of evaporation in this study is a limitation. Future modelling efforts should incorporate evapotranspiration to better account for all components of the water cycle and to understand the causes of observed hydrological changes.

Author Contributions

Conceptualization, O.B.; methodology, O.B. and T.R.-B.; software, O.B. and A.Ž.-Ć.; validation, A.Ž.-Ć. and T.R.-B.; formal analysis, O.B. and T.R.-B.; investigation, O.B. and A.Ž.-Ć.; data curation, O.B. and A.Ž.-Ć.; writing—original draft preparation, O.B.; writing—review and editing, A.Ž.-Ć.; visualization, O.B. and A.Ž.-Ć.; supervision, T.R.-B.; project administration, T.R.-B. All authors have read and agreed to the published version of the manuscript.

Funding

This research received no external funding.

Data Availability Statement

The data presented in this study are available on request from the corresponding author.

Acknowledgments

This research was partially funded by the project KK.01.1.1.02.0027, co-financed by the Government of Croatia and the European Union through the European Regional Development Fund—the Competitiveness and Cohesion Operational Programme.

Conflicts of Interest

The authors declare no conflicts of interest.

References

  1. Lehner, F.; Wood, A.W.; Vano, J.A.; Lawrence, D.M.; Clark, M.P.; Mankine, J.S. The potential to reduce uncertainty in regional runoff projections from climate models. Nat. Clim. Change 2019, 9, 926–933. [Google Scholar] [CrossRef]
  2. Bosmans, J.; Wanders, N.; Bierkens, M.F.; Huijbregts, M.A.; Schipper, A.M.; Barbarossa, V. FutureStreams, a global dataset of future streamflow and water temperature. Sci. Data 2022, 9, 307. [Google Scholar] [CrossRef]
  3. Guven, A.; Pala, A.; Sheikhvaisi, M. Investigation of impact of climate change on small catchments using different climate models and statistical approaches. Water Supply 2022, 22, 3540–3552. [Google Scholar] [CrossRef]
  4. Barnett, T.P.; Adam, J.C.; Lettenmaier, D.P. Potential impacts of a warming climate on water availability in snow-dominated regions. Nature 2005, 438, 303–309. [Google Scholar] [CrossRef] [PubMed]
  5. Alcamo, J.; Flörke, M.; Märker, M. Future Long-Term Changes in Global Water Resources Driven by Socio-Economic and Climatic Changes. Hydrol. Sci. J. 2007, 52, 247–275. [Google Scholar] [CrossRef]
  6. Gardner, L.R. Assessing the effect of climate change on mean annual runoff. J. Hydrol. 2009, 379, 351–359. [Google Scholar] [CrossRef]
  7. Alkama, R.; Decharme, B.; Douville, H.; Ribes, A. Trends in global and basin-scale runoff over the late twentieth century: Methodological issues and sources of uncertainty. J. Clim. 2011, 24, 3000–3014. [Google Scholar] [CrossRef]
  8. Schneider, C.; Laizé, C.L.R.; Acreman, M.C.; Flörke, M. How Will Climate Change Modify River Flow Regimes in Europe? Hydrol. Earth Syst. Sci. 2013, 17, 325–339. [Google Scholar] [CrossRef]
  9. Sohoulande Djebou, D.C.; Singh, V.P. Impact of Climate Change on the Hydrologic Cycle and Implications for Society. Environ. Soc. Psychol. 2016, 1, 36–49. [Google Scholar] [CrossRef]
  10. Chaturvedi, A.; Pandey, B.; Yadav, A.K.; Saroj, S. An Overview of the Potential Impacts of Global Climate Change on Water Resources. In Water Conservation in the Era of Global Climate Change; Elsevier: Amsterdam, The Netherlands, 2021; pp. 99–120. ISBN 978-0-12-820200-5. [Google Scholar]
  11. Bonacci, O.; Žaknić-Čatović, A.; Roje-Bonacci, T. Comparative hydrological analysis at two stations on the boundary river Sotla/Sutla (Slovenia-Croatia). Acta Hydrotech. 2025, 38, 15–27. [Google Scholar] [CrossRef]
  12. Grosser, P.F.; Schmalz, B. Assessing the Impacts of Climate Change on Hydrological Processes in a German Low Mountain Range Basin: Modelling Future Water Availability, Low Flows and Water Temperatures Using SWAT+. Environments 2025, 12, 151. [Google Scholar] [CrossRef]
  13. Eckhardt, K.; Ulbrich, U. Potential impacts of climate change on groundwater recharge and streamflow in a central European low mountain range. J. Hydrol. 2003, 284, 244–252. [Google Scholar] [CrossRef]
  14. Manuel, R.-M.V.; Gunter, K.T. Parsimonious Model of Groundwater Recharge Potential as Seen Related with Two Topographic Indices and the Leaf Area Index. Hydrology 2025, 12, 127. [Google Scholar] [CrossRef]
  15. Milly, P.C.; Dunne, K.A. Colorado River flow dwindles as warming-driven loss of reflective snow energizes evaporation. Science 2020, 367, 1252–1255. [Google Scholar] [CrossRef]
  16. Yu, J.; Fu, G.; Cai, W.; Cowan, T. Impacts of precipitation and temperature changes on annual streamflow in the Murray–Darling Basin. Water Int. 2010, 35, 313–323. [Google Scholar] [CrossRef]
  17. Fan, M.; Xu, J.; Chen, Y.; Fan, M.; Yu, W.; Li, W. Temperature Contributes More than Precipitation to Runoff in the High Mountains of Northwest China. Remote Sens. 2022, 14, 4015. [Google Scholar] [CrossRef]
  18. Han, H.; Hou, J.; Huang, M.; Li, Z.; Xu, K.; Zhang, D.; Bai, G.; Wang, C. Impact of soil and water conservation measures and precipitation on streamflow in the middle and lower reaches of the Hulu River Basin, China. Catena 2020, 195, 104792. [Google Scholar] [CrossRef]
  19. Yeste, P.; Josa-Cánovas, J.-J.; Romero-Jiménez, E.; Ojeda, M.G.-V.; Gámiz-Fortis, S.R.; Castro-Díez, Y.; Esteban-Parra, M.J. Projected hydrologic changes over the north of the Iberian Peninsula using a Euro-CORDEX multi-model ensemble. Sci. Total Environ. 2021, 777, 146126. [Google Scholar] [CrossRef]
  20. Tsegaw, A.T.; Pontoppidan, M.; Kristvik, E.; Alfredsen, K.; Muthanna, T.M. Hydrological impacts of climate change on small ungauged catchments—Results from a global climate model–regional climate model–hydrologic model chain. Nat. Hazards Earth Clim. Sci. 2020, 20, 2133–2155. [Google Scholar] [CrossRef]
  21. Alvarenga, L.A.; de Mello, C.R.; Colombo, A.; Chou, S.C.; Cuartas, L.A.; Viola, M.R. Impacts of Climate Change on the Hydrology of a Small Brazilian Headwater Catchment Using the Distributed Hydrology-SoilVegetation Model. Am. J. Clim. Change 2018, 7, 355–366. [Google Scholar] [CrossRef]
  22. Visessri, S.; McIntyre, N. Regionalisation of hydrological responses under land-use change and variable data quality. Hydrol. Sci. J. 2016, 61, 302–320. [Google Scholar] [CrossRef]
  23. Paredes, J.M.; Romero, F.E.O.; Ocampo, S.M. Interplay of climate change and human activities on the hydrological dynamics and environmental degradation of the Senguerr River Basin, Argentina. J. S. Am. Earth Sci. 2025, 162, 105608. [Google Scholar] [CrossRef]
  24. Blaskey, D.; Cheng, Y.; Newman, A.J.; Koch, J.C.; Gooseff, M.N.; Musselman, K.N. Alaskan Hydrology in Transition: Changing Precipitation and Evapotranspiration Patterns Are Projected to Reshape Seasonal Streamflow and Water Temperature by Midcentury (2035–64). J. Hydrometeorol. 2025, 26, 613–626. [Google Scholar] [CrossRef]
  25. Van Vliet, M.T.; Franssen, W.H.; Yearsley, J.R.; Ludwig, F.; Haddeland, I.; Lettenmaier, D.P.; Kabat, P. Global river discharge and water temperature under climate change. Glob. Environ. Change 2013, 23, 450–464. [Google Scholar] [CrossRef]
  26. Michel, A.; Schaefli, B.; Wever, N.; Zekollari, H.; Lehning, M.; Huwald, H. Future water temperature of rivers in Switzerland under climate change investigated with physics-based models. Hydrol. Earth Syst. Sci. 2022, 26, 1063–1087. [Google Scholar] [CrossRef]
  27. McBean, E.; Bhatti, M.; Singh, A.; Mattern, L.; Murison, L.; Delaney, P. Temperature modeling, a key to assessing impact on rivers due to urbanization and climate change. Water 2022, 14, 1994. [Google Scholar] [CrossRef]
  28. Ficklin, D.L.; Hannah, D.M.; Wanders, N.; Dugdale, S.J.; England, J.; Klaus, J.; Kelleher, C.; Khamis, K.; Charlton, M.B. Rethinking river water temperature in a changing, human-dominated world. Nat. Water 2023, 1, 125–128. [Google Scholar] [CrossRef]
  29. White, J.C.; Khamis, K.; Dugdale, S.; Jackson, F.L.; Malcolm, I.A.; Krause, S.; Hannah, D.M. Drought impacts on river water temperature: A process-based understanding from temperate climates. Hydrol. Process. 2023, 37, e14958. [Google Scholar] [CrossRef]
  30. Zhang, Y.; Chiew, F.H.S.; Li, M.; Post, D. Predicting runoff signatures using regression and hydrological modeling approaches. Water Resour. Res. 2018, 54, 7859–7878. [Google Scholar] [CrossRef]
  31. Zaninović, K.; Gajić-Čapka, M. Changes in Components of the Water Balance in the Croatian Lowlands. Theor. Appl. Climatol. 2000, 65, 111–117. [Google Scholar] [CrossRef]
  32. Köppen, W.; Geiger, R. Handbuch der Klimatologie: Das geographische System der Klimate. In Handbook of Climatology: The Geographical System of Climates; Verlag von Gebrüder Borntraeger: Berlin, Germany, 1936; p. 44. [Google Scholar]
  33. Čanjevac, I.; Pavlek, K.; Orešić, D. River lengths in Croatia determined from a topographic map at a scale of 1:25,000. Hrvat. Geogr. Glas. 2022, 84, 5–30. [Google Scholar] [CrossRef]
  34. Žiger, Z.; Bognar, A. Geomorfološka obilježja gornjeg toka rijeke Sutle [Geomorphological characteristics of the upper course of the Sutla River]. Hrvat. Geogr. Glas. 2007, 69, 25–39. [Google Scholar] [CrossRef]
  35. FRISCO Project. Porečja—Sotla. 2017. Available online: https://frisco-project.eu/en/river-basins/sotla/ (accessed on 26 February 2025).
  36. Stojilković, B.; Brečko Grubar, V. Discharge regimes of Slovenian rivers: 1991–2020. Acta Geogr. Slov. 2024, 64, 7–31. [Google Scholar] [CrossRef]
  37. Čosić-Flajsig, G.; Karleuša, B.; Glavan, M. Integrated water quality management model for the rural transboundary river basin—A case study of the Sutla/Sotla River. Water 2021, 13, 2569. [Google Scholar] [CrossRef]
  38. Bonacci, O.; Žaknić-Čatović, A.; Roje-Bonacci, T.; Bonacci, D. Assessing the Effects of Climate Change on the Hydrology of a Small Catchment: The Krapina River near Kupljenovo. Water 2025, 17, 1403. [Google Scholar] [CrossRef]
  39. Orešić, D.; Filipčić, A. Promjene protočnih režima najvećih Savskih i Dravskih pritoka u Hrvatskom Zagorju i gornjoj Podravini 1961–2020. [Changes in discharge regimes of the largest Sava and Drava tributaries in Hrvatsko Zagorje and upper Podravina regions (northwestern Croatia) in 1961–2020 Period]. Podravina 2024, 23, 33–52. [Google Scholar]
  40. Orešić, D. Morfografski pokazatelji porječja Krapine [Morphographic indicators of the Krapina river basin]. Acta Geogr. Croat. 1995, 30, 29–38. [Google Scholar]
  41. Ivezić, V.; Bekić, D.; Horvat, B. Modelling of basin wide daily evapotranspiration with a partial integration of remote sensing data. Atmosphere 2018, 9, 120. [Google Scholar] [CrossRef]
  42. Slovenian Environment Agency. Archive of Time Series [Web Page]. Ministry of the Environment, Climate and Energy. 2025. Available online: https://meteo.arso.gov.si/met/en/climate/current/time-series-archive/ (accessed on 26 February 2025).
  43. Papić, M. Primijenjena statistika u MS Excelu [Applied statistics in MS Excel]; Zoro: Zagreb, Croatia, 2005; p. 259. [Google Scholar]
  44. Shu, C.; Ouarda, T. Improved methods for daily streamflow estimates at ungauged sites. Water Resour. Res. 2012, 48, W02523. [Google Scholar] [CrossRef]
  45. Garbrecht, J.; Fernandez, G.P. Visualization of trends and fluctuations in climatic records. Water Res. Bull. 1994, 30, 297–306. [Google Scholar] [CrossRef]
  46. Bonacci, O.; Bonacci, D.; Roje-Bonacci, T.; Vrsalović, A. Proposal of a new method for drought analysis. J. Hydrol. Hydromech. 2023, 71, 100–110. [Google Scholar] [CrossRef]
  47. McGhee, J.W. Introductory Statistics; West Publishing Company: St Paul, MN, USA; New York, NY, USA, 1985; p. 650. [Google Scholar]
  48. Şen, Z.; Altunkaynak, A. A comparative fuzzy logic approach to runoff coefficient and runoff estimation. Hydrol. Process. 2006, 20, 1993–2009. [Google Scholar] [CrossRef]
  49. Machado, R.E.; Cardoso, T.; Mortene, M. Determination of the Runoff Coefficient (C) in catchments based on analysis of precipitation and flow events. Int. Soil Water Conserv. Res. 2021, 10, 208–216. [Google Scholar] [CrossRef]
  50. Che, D.; Liang, A.; Li, X.; Ma, B. Remote Sensing Assessment of Safety Risk of Iron Tailings Pond Based on Runoff Coefficient. Sensors 2018, 18, 4373. [Google Scholar] [CrossRef]
  51. Lallam, F.; Megnounif, A.; Ghenim, A.N. Estimating the runoff coefficient using the analytic hierarchy process. J. Water Land Dev. 2018, 38, 67–74. [Google Scholar] [CrossRef]
  52. Merz, R.; Blöschl, G.; Parajka, J. Spatio-temporal variability of event runoff coefficients. J. Hydrol. 2006, 331, 591–604. [Google Scholar] [CrossRef]
  53. Bonacci, O.; Trninić, D.; Roje-Bonacci, T. Analysis of the water temperature regime of the Danube and its tributaries in Croatia. Hydrol. Process. 2008, 22, 1014–1021. [Google Scholar] [CrossRef]
  54. Bonacci, O.; Đurin, B.; Roje-Bonacci, T.; Bonacci, D. The influence of reservoirs on water temperature in the downstream part of an open watercourse: A case study at Botovo Station on the Drava River. Water 2022, 14, 3534. [Google Scholar] [CrossRef]
  55. Hadzima-Nyarko, M.; Rabi, A.; Šperac, M. Implementation of artificial neural networks in modeling the water-air temperature relationship of the River Drava. Water Res. Manag. 2014, 28, 1379–1394. [Google Scholar] [CrossRef]
  56. Rabi, A.; Hadzima-Nyarko, M.; Šperac, M. Modelling river temperature from air temperature: Case of the River Drava (Croatia). Hydrol. Sci. J. 2015, 60, 1490–1507. [Google Scholar] [CrossRef]
  57. Bonacci, O. Analiza trendova porasta temperature vode duž toka rijeke Drave u Hrvatskoj [Analysis of water temperature increase trends along the Drava River in Croatia]. Hrvat. Vode 2024, 32, 291–301. [Google Scholar]
  58. Tadić, L.; Tamás, E.A.; Mihaljević, M.; Janjić, J. Potential climate impacts of hydrological alterations and discharge variabilities of the Mura, Drava, and Danube Rivers on the Natural Resources of the MDD UNESCO Biosphere Reserve. Climate 2022, 10, 139. [Google Scholar] [CrossRef]
  59. Bonacci, O.; Žaknić-Ćatović, A.; Roje-Bonacci, T. Significant Rise in Sava River Water Temperature in the City of Zagreb Identified across Various Time Scales. Water 2024, 16, 2337. [Google Scholar] [CrossRef]
Disclaimer/Publisher’s Note: The statements, opinions and data contained in all publications are solely those of the individual author(s) and contributor(s) and not of MDPI and/or the editor(s). MDPI and/or the editor(s) disclaim responsibility for any injury to people or property resulting from any ideas, methods, instructions or products referred to in the content.

Article Metrics

Citations

Article Access Statistics

Multiple requests from the same IP address are counted as one view.