Abstract
The intensification of global climate change has led to an increased frequency of extreme rainfall and temperature events, posing severe threats to China’s ecosystems and socio-economic systems. This study, based on multi-year daily precipitation, monthly surface air temperature, and daily near-surface temperature datasets, employs multi-year averaging, EOF mode analysis, Mann–Kendall testing, and R/S analysis. By selecting heavy-rain days, rainfall amount, rainfall intensity, and drought indices, it explores the spatiotemporal evolution and driving mechanisms of extreme rainfall, drought, and compound events across China. The analysis of extreme rainfall reveals that precipitation in China shows a “more in the southeast, less in the northwest; abundant in the southeast, sparse in the northwest” pattern. EOF analysis identifies two spatial modes for rainfall parameters, the “Eastern Coordination Mode” and the “North–South Antiphase Mode,” corresponding to heavy rainfall days, rainfall amount, and rainfall intensity. The Mann–Kendall test shows that some regions in the eastern monsoon zone have experienced a significant increase in heavy rainfall parameters, while certain areas in the northeast, southern China, and northwest have also undergone significant changes. By contrast, parts of the southwest have seen a decrease. R/S analysis reveals that the Hurst index is high in the eastern monsoon region, indicating a strong likelihood of continued upward trends in the future, while regions in the western arid and semi-arid zones and parts of the Tibetan Plateau exhibit stronger randomness in trends, leading to more alternating drought and flood events. The analysis of the drought index (SPI-3) reveals synchronized drought patterns in the central-eastern and northern regions, with “synergistic consistency,” “Northwest–Northeast Antiphase,” and “Northern–Central-South Antiphase” characteristics. The Mann–Kendall test indicates a “north-wet, south-dry” differentiation, with significant wetting in the northern regions and parts of the Tibetan Plateau, and significant drying in the central-eastern and southwestern regions. R/S analysis shows high Hurst indices across most of the northwest and northern regions, indicating stronger drought persistence, while coastal areas in the east are more prone to dry–wet transitions. In terms of compound events, high-temperature and heavy rainfall events have increased from northwest to southeast over the past 40 years, with southern China experiencing more than 200 days of such events. Significant changes have been observed in the eastern and southern coastal regions, with high Hurst indices and strong persistence in the eastern coastal areas. Low-temperature and heavy rainfall events are more frequent in the eastern coast and southwestern regions, with higher Hurst indices in the eastern and central regions, indicating strong persistence.
1. Introduction
1.1. Research Background and Significance
In December 2023, the Ministry of Ecology and Environment of the People’s Republic of China released the Fourth National Communication on Climate Change of the People’s Republic of China [], which pointed out that global climate change is becoming increasingly severe and urgent. In the future, extreme high-temperature events in China will increase, extreme low-temperature events will decrease, and extreme heavy rainfall events are likely to become more frequent and intense in most regions. Against this backdrop, the Chinese government released the 2024 Report on China’s Policies and Actions for Addressing Climate Change [], emphasizing the importance of strengthening the assessment of trends and risks associated with extreme climate events. In recent years, the frequency and intensity of extreme weather events associated with climate change have significantly increased, posing serious threats to natural ecosystems, socio-economic activities, and daily life. This has led to widespread research into the trends and influencing factors of these events []. In response to national policy requirements for addressing climate change and based on the current reality of frequent extreme weather events, this study conducts a nationwide analysis of the trends in extreme precipitation and its compound events with extreme temperatures. By utilizing long-term precipitation and temperature data, the study identifies trends in extreme rainfall and temperatures in China, explores the risks associated with extreme weather events, and provides scientific evidence for the development of effective adaptation and mitigation strategies. This will enhance China’s capacity to respond to climate change and ensure the sustainable development of its economy and society.
1.2. Domestic and International Research Progress
In terms of heavy rainfall events, Kong Feng et al. [] found that rainfall and the number of rainy days for different intensities of rainfall in China show an increasing trend, with a spatial pattern of “high in the southeast—low in the northwest.” Extreme heavy rainfall events exhibit a “first increase—then decrease—and again increase” pattern, indicating a trend toward the intensification of heavy rainfall events. Li Hongmei et al. [] pointed out that there are significant regional differences in summer precipitation in eastern China, with increased precipitation and extreme precipitation indicators in the Yangtze River Basin, while decreases are observed in North China. They also found that heavy rainfall contributes the most to the variance in total precipitation changes.
Regarding drought, Song Liang et al. [] and Zhang Xuyu et al. [], based on SPEI analysis, showed that drought has worsened in central and southeastern regions, while some areas in the northwest have become wetter. The persistence of drought in the western regions is stronger than in the southeastern coastal areas. They also noted that the SPEI better reflects the impact of human activities on autumn drought. Gu Ziye et al. [] found that from 2002 to 2021, China’s terrestrial water storage generally declined, with the northwest and the Yangtze River Basin being hotspots for drought. They also highlighted the significant influence of sea surface temperature indices in the western Pacific and Indian Ocean.
On compound events, Velpuri et al. [] and Zscheischler et al. [] define compound extremes as the synergistic action of multiple extreme events, i.e., they emphasize spatio-temporal compounding. Using coincident heatwave–drought (C1) and coincident heatwave–extreme precipitation (C2) as examples, they highlight that the combined impact of these events is far greater than that of any single event, and they map the global distribution of such compound extremes, showing an upward trend in the co-occurrence of extreme precipitation and extreme temperature worldwide. Therefore, this study adopts the same definition of event co-occurrence for compound events. According to the World Meteorological Organization, disasters related to these events caused heavy losses globally between 1970 and 2019 []. Zhou et al. [] found that temperature and SPEI are significantly negatively correlated in the Pearl River Basin; hot–humid events have increased while cold–dry events have decreased, with distinct regional patterns [].
To better analyze climate trends under global warming conditions, Huang et al. [] innovatively integrated the EOF analysis method to predict summer precipitation in East China and found that this approach effectively extracts spatial patterns and combines them with statistical prediction models, demonstrating significant application value in forecasting seasonal and inter-annual variability trends. Orpita U. Laz et al. [] used a combination of Mann–Kendall test and Sen’s slope estimation method to analyze the trend of heatwave events. Lu et al. [] and Li et al. [] applied the Mann–Kendall non-parametric test for trend detection, which does not require data to follow a specific distribution and is insensitive to outliers, making it suitable for analyzing trends in hydrometeorological variables. They studied the temporal variation trends of annual precipitation, the monthly precipitation concentration index (PCI), and the daily precipitation concentration index (CI) for China and its sub-regions from 1961 to 2017, achieving results with practical significance. Bunde et al. [] employed R/S analysis to reveal the long-range correlations in global temperature and precipitation series, and to evaluate the ability of climate models to reproduce such long-term memory.
Leveraging the distinctive strengths and complementarity of these methods, this study innovatively combines four techniques—multi-year averaging, Empirical Orthogonal Function (EOF) mode analysis, the Mann–Kendall rank test, and R/S analysis—at the national scale to investigate trends in extreme precipitation and temperature. From the threefold perspectives of spatial mode decomposition, trend-significance testing, and long-memory analysis, the study provides a comprehensive portrayal of extreme precipitation and temperature variability, overcoming the limitations inherent in any single approach. EOF mode analysis spatially pinpoints key regions and zones of marked difference; the Mann–Kendall test temporally verifies trend significance and detects change points, quantifying the statistical robustness of observed trends; and R/S analysis anticipates future change directions. Together, these methods establish a seamless chain of “pattern recognition–trend verification–risk projection.”
1.3. Research Objectives and Methodology
1.3.1. Research Objectives
This study aims to reveal the spatiotemporal evolution patterns of extreme precipitation and its relationship with compound extreme-temperature events in China. By analyzing multi-source data such as precipitation and temperature, and employing methods like multi-year averaging, EOF mode analysis, the Mann–Kendall rank test, and R/S analysis, this research examines the spatiotemporal variation characteristics of precipitation and temperature. For extreme precipitation events, the study analyzes the spatiotemporal trends of rainfall indices (rainy days, rainfall amount, and rainfall intensity) and drought indices (Standardized Precipitation Index), identifying the variation patterns of heavy rainfall and drought in different regions and their future directions. For compound events, the study quantifies the extremity of high and low temperatures to reflect the intensity of temperature extremes and further investigates the influencing factors and physical mechanisms of compound extreme-precipitation and -temperature events.
1.3.2. Methodology
This study adopts a multi-method collaborative approach, integrating various data sources to investigate extreme rainfall and temperature events from different perspectives. The specific methodology is as follows:
- (1)
- Data Collection and Preprocessing: Perform quality control and preprocessing of the data, including data cleaning, filling missing values, and format conversion, to ensure the accuracy and usability of the data.
- (2)
- Analysis of Extreme Precipitation Events: Combine four methods—multi-year averaging, EOF mode analysis, the Mann–Kendall rank test, and R/S analysis—to comprehensively reveal the spatial patterns, trend significance, and long-term memory characteristics of extreme precipitation and temperature events. This analysis addresses three dimensions: spatial mode decomposition, trend significance testing, and long-term persistence analysis.
- (3)
- Compound Event Analysis: Define compound extreme events, including high- and low-temperature heavy rainfall events, and extract the corresponding event data. Conduct multi-year frequency statistical analysis to investigate the spatial distribution characteristics of these compound events. Use the Mann–Kendall trend test and R/S analysis to study the variation trends and persistence of compound events.
2. Materials and Methods
2.1. Data Sources
In this study, we select the precipitation data from the China Mainland 0.25° daily precipitation dataset (1961–2022) [], which covers the entire country, except for Taiwan and the South China Sea, and includes daily precipitation amounts. We use the temperature data from the China surface temperature monthly dataset at a 0.5° × 0.5° grid resolution (1961–2012) [] and the China 0.1° near-surface daily temperature dataset (1979–2018) []. To ensure data homogeneity, all precipitation and temperature datasets were bilinearly re-gridded to a common 0.25° spatial resolution and archived in NetCDF format. Subsequent analyses were tailored to the specific objectives: long-term climatological trend analysis was based on the overlapping period of the 1961–2012 daily precipitation dataset and the 1961–2012 monthly mean temperature dataset, whereas the high-resolution compound-event assessment employed the coincident 1979–2018 daily precipitation and daily near-surface temperature datasets. This dual-period strategy preserves the integrity of the long-term trend analysis while simultaneously satisfying the stringent temporal and spatial resolution requirements of compound-event detection, thereby guaranteeing the scientific rigor and accuracy of the results.
To ensure spatial completeness, long-term consistency, and methodological compatibility, this study employs gridded datasets for all analyses of extreme precipitation and temperature events. To confirm the reliability of these gridded products, we conducted systematic validations and performed quantitative comparisons with independent, high-quality station observations within the study region:
- (1)
- CHM_PRE daily precipitation: validated against 45,992 independent automatic weather stations for 2015–2019, yielding a correlation coefficient (CC) of 0.78, root mean square error (RMSE) of 8.8 mm d−1, and Kling–Gupta efficiency (KGE) of 0.69 (median).
- (2)
- HRLT daily air temperature: assessed using 699 national reference stations for 1961–2019. For daily maximum temperature, mean absolute error (MAE) = 1.07 °C, RMSE = 1.62 °C, Pearson r = 0.99, and Nash–Sutcliffe efficiency (NSE) = 0.98; for daily minimum temperature, MAE = 1.08 °C, RMSE = 1.53 °C, Pearson r = 0.99, and NSE = 0.99.
- (3)
- Reanalysis-corrected temperature (1979–2018): cross-validated against the same 699 stations. Daily maximum temperature: RMSE 0.86–1.78 °C, R2 = 0.96–0.99; daily minimum temperature: RMSE = 0.78–2.09 °C, R2 = 0.95–0.99; daily mean temperature: RMSE = 0.35–1.00 °C, R2 = 0.99–1.00.
All error metrics for the above gridded datasets meet or exceed the accuracy levels of comparable international products, providing a robust and reliable foundation for the climate variables used in this study.
2.2. Definition of Extreme Indices
2.2.1. Heavy Rainfall Index
According to the precipitation intensity classification standard issued by the National Meteorological Administration, 24 h total precipitation exceeding 50 mm is taken as the threshold for heavy rainfall. This study calculates three heavy rainfall indices on a monthly basis from 1961 to 2022: heavy rainfall rainy days, heavy rainfall amount, and heavy rainfall intensity. Their definitions are shown in Table 1.

Table 1.
Definition of heavy rainfall index.
2.2.2. Drought Index
According to national standard GB/T 20481-2017 “Meteorological Drought Classification” [], the Standardized Precipitation Index (SPI) is selected as the indicator for drought monitoring and evaluation.
This index is obtained by normalizing the precipitation over a specific time period, assuming that precipitation follows a probability distribution. The index is suitable for monitoring and evaluating drought conditions in different regions and on different time scales. The classification of drought levels based on the SPI is shown in Table 2.

Table 2.
SPI drought classification table.
This study employs the 3-month Standardized Precipitation Index (SPI-3), recommended by the World Meteorological Organization (WMO) as the preferred indicator for monitoring agricultural drought. It is widely used for seasonal climate assessment and disaster early warning.
2.2.3. Definition of Compound Extreme-Rainfall–Temperature Events
For the definition of compound extreme-rainfall–temperature events, this study refers to the criteria for single heavy rainfall and extreme temperature events. A daily precipitation of 50 mm or more is set as the threshold for heavy rainfall []. Following the ETCCDI (Expert Team on Climate Change Detection and Indices) standard definitions, we calculated the extreme-temperature indices using Warm Day Frequency (TX90p) and Cold Night Frequency (TN10p) for each grid cell over 1979–2018. The resulting percentile values provided fixed high and low thresholds for extreme temperatures. The compound events are defined as shown in Table 3.

Table 3.
Compound extreme-rainfall–temperature events.
2.3. Analysis Methods
In this study, multiple methods, including multi-year averaging, EOF modal analysis, the Mann–Kendall rank test, and R/S analysis, are employed to investigate the trends of extreme precipitation and compound events with extreme temperatures across the country. By analyzing the data from three perspectives—spatial mode decomposition, trend significance testing, and long-term memory analysis—the study aims to reveal the characteristics of extreme precipitation and temperature changes, addressing the limitations of single-method approaches. EOF analysis identifies key regions and differentiation zones, the Mann–Kendall test investigates the significance of temporal trends and change points, and R/S analysis predicts future directions. Together, these methods collaboratively build a comprehensive chain of “pattern recognition–trend validation–risk prediction.”
2.3.1. Multi-Year Averaging Method
The multi-year averaging method describes the average level of the data. For a sample of data spanning n years, the multi-year average can be calculated using the following formula:
where the multi-year average represents the average value of the data over n years, n is the number of years in the data sample, and represents the data value for the i-th year.
2.3.2. Empirical Orthogonal Function (EOF) Analysis
Empirical Orthogonal Function (EOF) analysis is a technique used to analyze the structural characteristics of matrix data and extract the main features of the data.
The EOF can reduce the dimensionality of spatiotemporal precipitation and temperature data, decomposing the data into spatial modes (EOF) and corresponding time coefficients (PC) []:
where X represents the original dataset, m is the number of stations, and n is the number of years.
2.3.3. Mann–Kendall Rank Test
The Mann–Kendall trend test [] was first proposed by Mann [] in 1945 and later improved by Kendall [], becoming a widely used non-parametric statistical method for trend analysis, as recommended by the World Meteorological Organization [,,].
Assuming the hydrometeorological variable sequence is , where n is the sample size and the data points are independent and identically distributed, the MK test statistic S is calculated, and a standard normal distribution statistic Z is constructed. The formulas are as follows:
where represents the data of the i-th year in the hydrometeorological element series. When n > 10, the statistic S approximately follows a normal distribution.
The statistic Z follows a Gaussian distribution. If , the target data exhibits an upward trend; if , the target data shows a downward trend. Given a significance level , if , the sample passes the significance test, and the null hypothesis is accepted, indicating that the trend of the data series is statistically significant. Conversely, if the opposite is true, the null hypothesis is rejected, meaning the trend is not statistically significant. In this study, we use a significance level of 0.05, corresponding to a two-tailed value of 1.96.
2.3.4. R/S Analysis Method
R/S analysis, also known as Rescaled Range Analysis, is a time series statistical method proposed by British hydrologist Hurst based on extensive empirical research. This method has demonstrated good applicability and effectiveness in the analysis of persistence in hydrological sequences [].
Assume that the hydrometeorological variable sequence is , and that the sequence is divided into a sub-sequences, each of length l, with the relationship between a and l being . For each subsequence , , let the elements of the subsequence be denoted as , , . Based on extensive empirical research, Hurst demonstrated the following relationship between R and S:
where c is a constant; H is the Hurst exponent; and H varies with the length of the sub-sequence l.
Taking the logarithm of both sides of Equations (2)–(4) yields
A scatter plot of the independent and dependent variables is made, where H is the slope of the fitted curve between the two variables. To quantitatively describe the strength of the trend in both the future and past based on the Hurst exponent, a Hurst index classification table [,] is introduced. The relationship between the range of Hurst values and their corresponding levels is shown in Table 4.

Table 4.
Hurst index classification table.
3. Extreme Rainfall Trend Analysis
3.1. Trend of Heavy Rainfall Events
3.1.1. Temporal and Spatial Evolution of Heavy Rainfall Days
- (1)
- EOF Analysis
EOF analysis was performed on the data of monthly heavy rainfall days extracted from the daily precipitation dataset for China from 1961 to 2022, as shown in Figure 1.
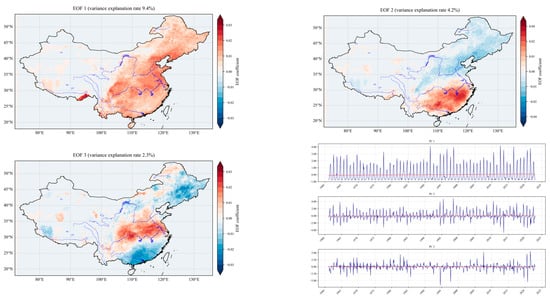
Figure 1.
EOF modes of annual heavy rainfall days from 1961 to 2022.
On the annual scale, EOF 1 (9.4%) is dominated by the “Eastern Coordinated Type,” with positive coefficients in the eastern monsoon region and near-zero or negative coefficients in the northwest and Tibetan Plateau. This reflects a consistent heavy rainfall response in the eastern region. PC 1 shows frequent fluctuations, with significant changes in the 1990s and around 2010, corresponding to periods of heavy rainfall such as the 1998 Yangtze River flood. EOF 2 (4.2%) represents the “North–South Antiphase Type,” where PC 2 alternates between positive and negative, reflecting the trend of more rainfall in the south and less in the north, with an increasing trend in the northern region. EOF 3 (2.3%) represents the “Central and North–South Difference Type,” where PC 3 shows large fluctuations, with extreme values corresponding to excessive rainfall in the middle reaches of the Yangtze River.
As indicated by the low cumulative variance contribution of the leading modes, the spatial pattern of heavy-rain days in China exhibits marked complexity and locality. Its variability is governed by multiple spatial scales rather than being dominated by a few large-scale modes, a result consistent with China’s vast territory, complex topography, and the diverse mechanisms underlying heavy-rainfall generation.
The EOF analysis results for summer heavy rainfall days, based on China’s rainfall characteristics, are shown in Figure 2.

Figure 2.
EOF modes of summer heavy-rainfall days from 1961 to 2022.
In summer, dominated by atmospheric circulation, EOF 1 (5.8%) exhibits a “positive in the north, negative in the south” pattern, reflecting the northward movement of the rain belt. EOF 2 (3.4%) is influenced by the subtropical high, with negative values in the Yangtze River Basin and positive values in parts of South China. EOF 3 (2.7%) differs regionally from the annual pattern. PC 1 corresponds to the advance and retreat of the monsoon, PC 2 focuses on rain belt adjustments, and PC 3 is significantly affected by factors such as typhoons.
- (2)
- Mann–Kendall Trend Test
Using the Mann–Kendall trend test mentioned earlier, the trend significance of the extracted heavy rainfall days was analyzed, as shown in Figure 3. The number of heavy rainfall days in the eastern monsoon region (North China, East China, and the middle and lower reaches of the Yangtze River) shows an increasing trend, with significant increases in the Northeast Plain and coastal areas of South China (p < 0.05). By contrast, the southwest region (southeastern edge of the Tibetan Plateau and Yunnan) shows a significant decrease. The northwest and Tibetan Plateau regions, due to their continental climate, exhibit lower trend significance.
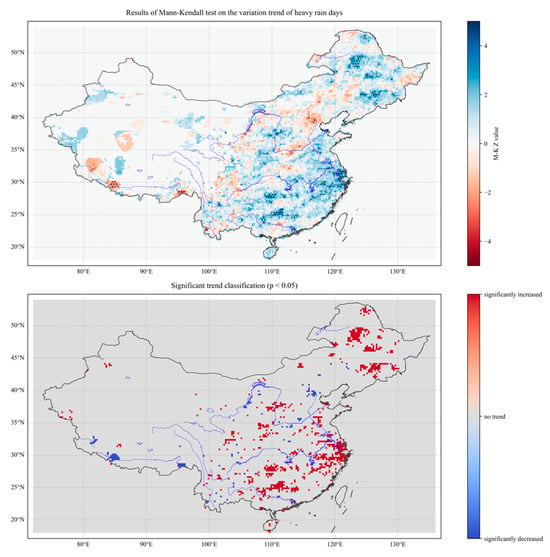
Figure 3.
Results from Mann–Kendall trend test for annual heavy-rainfall days from 1961 to 2022.
Next, the Mann–Kendall trend test was applied to summer heavy-rainfall days, as shown in Figure 4. Significant increases in heavy-rainfall days are observed in East China, the middle and lower reaches of the Yangtze River, and parts of North China, which correspond to the active period of the Meiyu front. By contrast, decreases are seen in parts of the southwest and northwest regions. In summer, the northwest shows sporadic trend signals due to the northward shift in the westerlies, but no significant changes are observed on an annual scale.
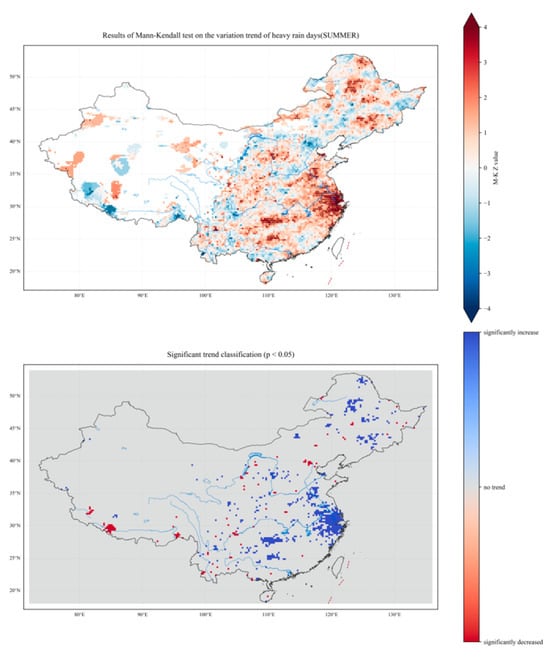
Figure 4.
Results from Mann–Kendall trend test for summer heavy-rainfall days from 1961 to 2022.
- (3)
- R/S Analysis
The Hurst index distribution of heavy rainfall days in China was extracted using R/S analysis to study the future trend, as shown in Figure 5.
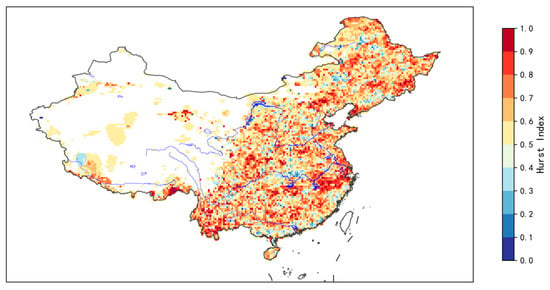
Figure 5.
Hurst index heatmap for annual heavy-rainfall days from 1961 to 2022.
On the annual scale, the Hurst index shows a “high in the east, low in the west” pattern. The eastern monsoon regions (North China, East China, and South China) have indices ranging from 0.6 to 0.8+, indicating strong persistence and a high probability of continued increasing trends in the future. Most of the northwest region shows values between 0.4 and 0.6, indicating strong randomness. Local high-value clusters are observed in the middle and lower reaches of the Yangtze River, with significant internal differences.
Results from R/S analysis of summer heavy-rainfall days are shown in Figure 6.
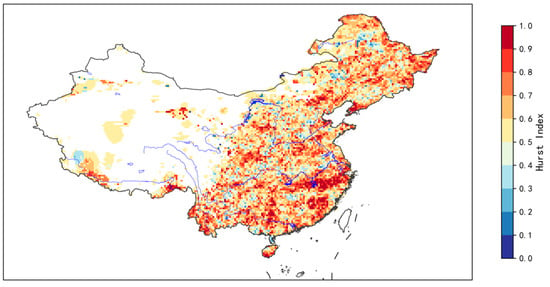
Figure 6.
Hurst index heatmap for summer heavy-rainfall days from 1961 to 2022.
It follows the same pattern as that on the annual scale, with the seasonal characteristics being more pronounced: the eastern region has indices ranging from 0.6 to 0.8+ (with some areas in East China nearing 0.9), and the middle and lower reaches of the Yangtze River show even more concentrated high values (above 0.8). The high-value area along the South China coast expands due to typhoon influence, while local high values appear around the Sichuan Basin.
Overall, the eastern monsoon region (Hurst > 0.6) exhibits strong trend persistence, dominated by the monsoon, while the northwest and Tibetan Plateau regions (Hurst < 0.6) show significant randomness, reflecting the low sensitivity of arid climates.
Integrated analysis of annual and summer heavy-rain days reveals three dominant spatial modes: “East-coherent mode”, where North and East China plus the Yangtze River basin share uniformly positive loadings; “North–South out-of-phase mode”, with the seasonal advance/retreat of the East Asian summer monsoon creating opposing signals between South and North China; and “Central differential mode”, in which the central region, influenced jointly by mid-latitude circulation and topographic forcing, exhibits complex variability.
During summer, the monsoon shift sharpens these patterns: a pronounced “north-positive/south-negative” dipole contrasts markedly with the overall east-coherent mode, highlighting the north–south opposition as the monsoon pushes northward. Principal component time series further expose inter-decadal oscillations, inter-annual anomalies, and localized extremes in heavy-rain days.
These key regional characteristics are corroborated by trend tests. In the eastern monsoon zone—North China, East China, and middle-lower Yangtze—the number of heavy-rain days shows a significant upward trend (p < 0.05), consistent with an intensified monsoon and anomalous moisture transport. Northeast China and the South China coast also exhibit widespread significant increases. Conversely, parts of Southwestern China—especially Yunnan—display a significant decrease, linked to topographic blocking and local climate variability. Seasonal tests for summer reveal that the significant increases in East China and the Yangtze basin coincide with the active Meiyu period, while sporadic increases in northern Xinjiang are associated with the northward shift in the summer westerlies. Thus, the eastern monsoon zone, as the core region of heavy rain, is clearly dominated by the monsoon system, whereas weak or decreasing trends in Northwestern China and the Qinghai–Tibet Plateau reflect the low sensitivity of arid climates.
Long-range persistence complements these findings. The eastern monsoon zone exhibits Hurst indices generally above 0.6, with parts of North China reaching 0.8, indicating strong trend persistence and a high probability of continuation. In contrast, most of the northwest shows Hurst indices below 0.6, underscoring the pronounced randomness of future trends.
3.1.2. Temporal and Spatial Evolution of Heavy-Rainfall Amount
- (1)
- EOF Analysis
EOF mode analysis of the extracted heavy-rainfall amounts shows similar modal types to the rainfall days, primarily characterized by “eastern coordination” and “north–south opposite” patterns. However, rainfall amounts are more sensitive to monsoon responses, as shown in Figure 7.
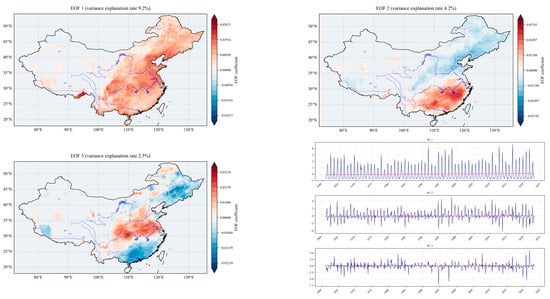
Figure 7.
EOF modes of annual heavy-rainfall amount from 1961 to 2022.
On the annual scale, EOF 1 (9.2%) is “eastern coordination,” and EOF 2 (4.2%) is “north–south opposite,” with the spatial distributions matching those of the rainfall days. The oscillations of PC 1 are more closely aligned with the eastern wet periods, such as the rainfall extremes in 1998 and 2020.
Results from EOF analysis of summer heavy rainfall amounts are shown in Figure 8.
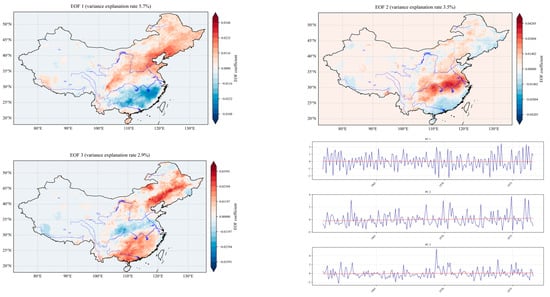
Figure 8.
EOF modes of summer heavy-rainfall amount from 1961 to 2022.
EOF 1 (5.7%) follows the “north positive, south negative” pattern due to the northward movement of the rain belt, with the key rainfall areas in the north becoming more prominent. EOF 2 (3.5%) is more closely related to the intensity of the plum rain period, and the oscillations of PC 2 directly reflect changes in rainfall during the plum rain season.
- (2)
- Mann–Kendall Trend Test
Mann–Kendall analysis of the extracted annual heavy-rainfall amounts shows a similar trend distribution to the number of rainy days, but the increase in rainfall is more significant in the northeast and the southeastern coastal areas of South China, as shown in Figure 9.
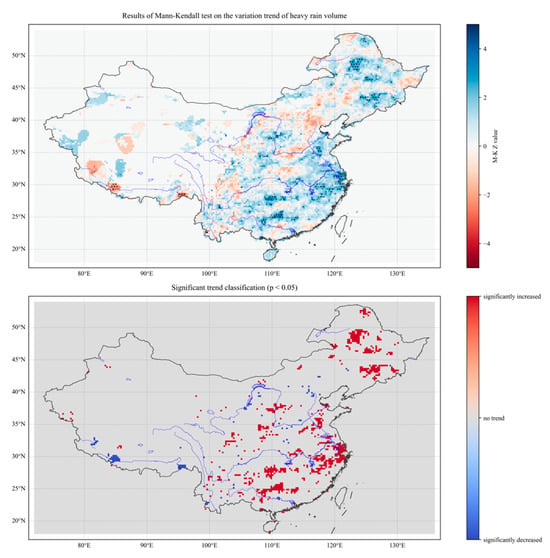
Figure 9.
Maps of the results from the 1961–2022 annual heavy-rainfall Mann–Kendall trend.
The Northeast Plain, eastern North China, and coastal areas of South China show a significant increase (p < 0.05), consistent with the trend of rainy days. However, in some areas of the Yangtze River Basin, there is a more noticeable decrease in rainfall.
As shown in Figure 10, significant increases in rainfall are observed in parts of East China, the middle and lower reaches of the Yangtze River, and South China. By contrast, some regions in the northwest show an increasing trend due to enhanced westerly wind belt activity (a feature not observed in rainfall days), reflecting the more sensitive response of rainfall to seasonal circulation.

Figure 10.
Maps of the results from the Mann–Kendall trend test of 1961–2022 summer heavy rainfall.
- (3)
- R/S Analysis
The Hurst index distribution of national and summer heavy rainfall from 1961 to 2022 is similar to that of rainfall days (“higher in the east, lower in the west”), but the intensity of high-rainfall areas is stronger.
As shown in Figure 11, the indices in the eastern monsoon region range from 0.6 to 0.8+, with parts of the North China Plain approaching 0.8, and localized areas in the middle and lower reaches of the Yangtze River (around Dongting Lake and Poyang Lake) exceeding 0.8. The index in the coastal areas of southern China is higher and more significant due to the influence of typhoons.
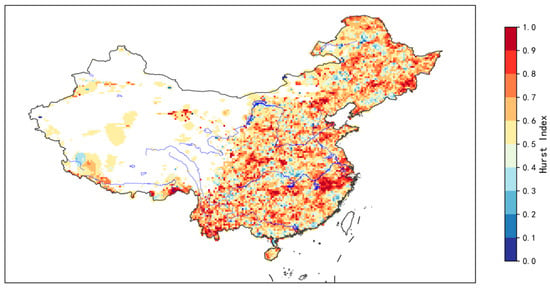
Figure 11.
Hurst index heatmap of annual heavy-rainfall amount from 1961 to 2022.
The results from R/S analysis of summer heavy rainfall are shown in Figure 12.

Figure 12.
Hurst index heatmap of summer heavy-rainfall amount from 1961 to 2022.
The high-value areas in the coastal regions of southern China are further expanded in range and intensity due to concentrated typhoon activity, with longer memory than the rainfall days.
Taken together, the EOF modes pinpoint three key spatial patterns—an East-coherent pattern, a North–South out-of-phase pattern, and a Central-differential pattern. Mann–Kendall tests reveal a significant upward trend in heavy-rainfall amounts over the eastern monsoon zone (p < 0.05) that aligns closely with the EOF-identified coherent region. Contiguous significant increases across the Northeast Plain and the South China coast corroborate the influence of an intensified monsoon and anomalous moisture transport, whereas the significant decreases in parts of the southwest are complemented by low Hurst indices (<0.6) from R/S analysis, underscoring the stochastic nature of trend evolution.
The East-coherent EOF mode reflects the East Asian monsoon’s systematic modulation of moisture transport; inter-decadal oscillations in its PC time series, such as pronounced fluctuations in the 1990s and after 2010, are closely linked to enhanced monsoon instability under global warming. Significant upward trends in the northeast, South China, and parts of the northwest identified by Mann–Kendall tests, together with high Hurst indices (0.6–0.8) from R/S analysis, reveal region-specific responses of the climate system to long-term trends. For example, the significant increase over the Northeast Plain (p < 0.05) combined with a high Hurst index points to sustained growth in heavy-rainfall amounts, likely driven by the northward shift in the summer monsoon and intensified extratropical cyclone activity. Notably, the seasonal adjustment of the EOF pattern in summer—characterized by a “North-positive, South-negative” distribution—together with the opposing trends of significant increases in the northeast and decreases in East China revealed by Mann–Kendall tests, illustrates the dynamic response mechanism of the monsoon system.
3.1.3. Temporal and Spatial Evolution of Rainfall Intensity
- (1)
- EOF Analysis
The monthly rainfall intensity data was extracted from the precipitation data, and EOF mode analysis was conducted. The EOF modes of rainfall intensity are similar to those of rainfall days and rainfall amounts, as shown in Figure 13.
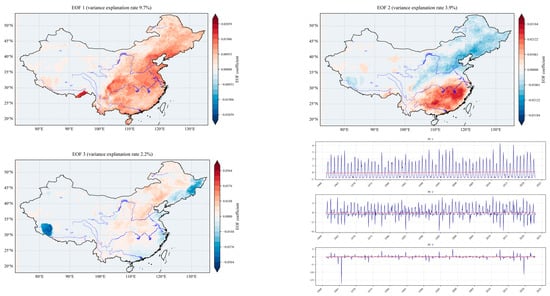
Figure 13.
EOF modes of annual heavy-rainfall intensity from 1961 to 2022.
On the annual scale, EOF 1 (9.7%) represents the “Eastern Coordinated Pattern,” with positive coefficients in the eastern monsoon region and near-zero or negative coefficients in the northwest. PC 1 fluctuates frequently and shows an overall increasing trend, indicating an enhanced eastern coordinated mode. EOF 2 (3.9%) is characterized as “North Positive, South Negative,” related to the summer monsoon and rain belt migration. EOF 3 (2.2%) shows complex regional differentiation, reflecting the joint effect of medium-small-scale and large-scale circulation.
The results from EOF mode analysis of summer heavy-rainfall intensity are shown in Figure 14.
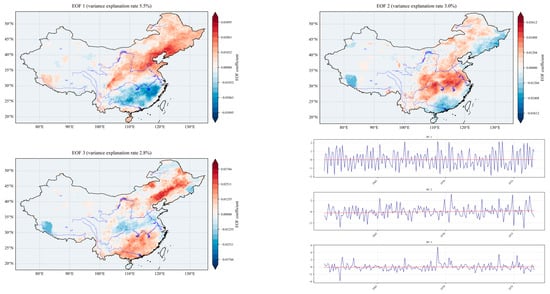
Figure 14.
EOF modes of summer heavy rainfall intensity from 1961 to 2022.
EOF 1 (5.5%) follows the “North Positive, South Negative” pattern, with the northern region becoming a key area due to the northward movement of the rain belt. EOF 2 (3.0%) represents a north–south opposite pattern, which is associated with the intensity of the plum rain. EOF 3 (2.8%) is influenced by local systems such as northern cold vortices.
- (2)
- Mann–Kendall Trend Test
From the results of the Mann–Kendall trend test of annual heavy rainfall intensity shown in Figure 15, it is evident that this trend exhibits regional differentiation. In regions such as North China, East China, and the middle and lower reaches of the Yangtze River, there is a decrease, while areas such as the northeast and the southeastern coast of South China show a significant increase (p < 0.05). The increase in the northwest and Tibetan Plateau is related to enhanced inland convection under global warming.
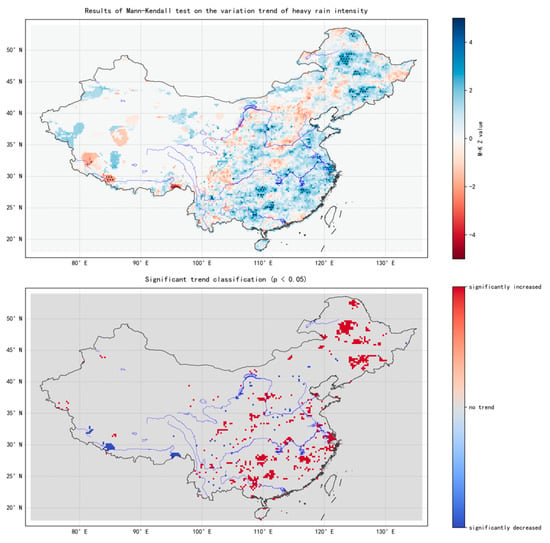
Figure 15.
Maps of the results from the Mann–Kendall trend test of 1961–2022 annual heavy-rainfall intensity.
For the summer season, as shown in Figure 16, a decrease is observed in parts of North China and the middle and lower reaches of the Yangtze River, while increases are seen in the northeast, South China, and parts of East and South China, with significant increases in some areas.

Figure 16.
Maps of the results from the Mann–Kendall trend test of 1961–2022 summer heavy-rainfall intensity.
- (3)
- R/S Analysis
The Hurst index of annual heavy-rainfall intensity shows a “high in the east, low in the west” pattern, as shown in Figure 17. The eastern monsoon region has an index ranging from 0.6 to 0.8+, indicating strong persistence, while most of the northwest region has an index between 0.4 and 0.6, indicating weak persistence.
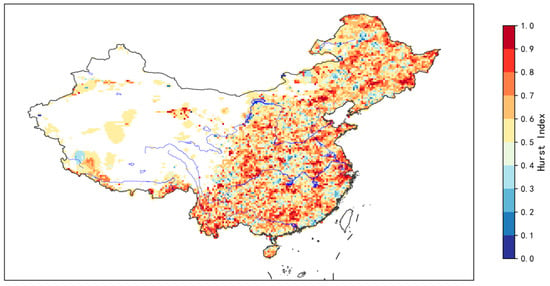
Figure 17.
Hurst index heatmap of annual heavy rainfall intensity from 1961 to 2022.
In the summer season, as shown in Figure 18, the index in the eastern region ranges from 0.6 to 0.8+, with more significant high values along the coast of South China and in the middle and lower reaches of the Yangtze River. Local high values also appear around the Sichuan Basin.
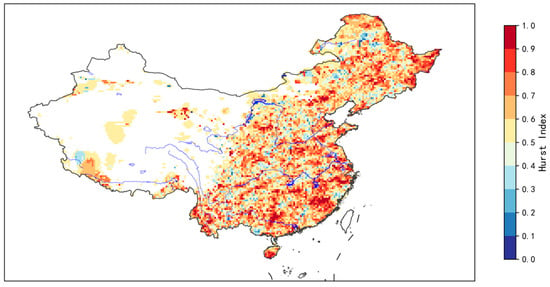
Figure 18.
Hurst index heatmap of summer heavy-rainfall intensity from 1961 to 2022.
Similarly to the previous analyses of heavy rainfall days and amounts, the rainfall intensity modes are consistent with those of rainfall days and amounts. The eastern monsoon region shows strong persistence in its changes, while the increases in the northeast and South China confirm the influence of the monsoon and typhoons.
Consistent with the earlier analyses of heavy-rain days and rainfall totals, EOF analysis extracts three dominant spatial patterns for annual and summer heavy-rain intensity: an East-coherent mode, a North–South out-of-phase mode, and localized regional differences. The East-coherent mode highlights the overarching control of the East Asian monsoon system on extreme rainfall, while the North–South out-of-phase mode mirrors the seasonal advance and retreat of the monsoon rain belt. The summer-specific “North-positive, South-negative” mode further sharpens this signal. Mann–Kendall tests reveal a significant decrease in heavy-rain intensity over the eastern monsoon zone—especially North China, East China, and the middle-lower Yangtze basin (p < 0.05)—closely matching the EOF-identified coherent region. In contrast, significant increases over the Northeast Plain and the South China coast corroborate the influence of an intensified monsoon and enhanced typhoon activity. R/S analysis shows Hurst indices >0.6 across the east, indicating strong long-term persistence and complementing the above findings.
3.2. Summary of Extreme Rainfall Trend Analysis
This section systematically reveals the spatiotemporal evolution patterns and trend changes in extreme rainfall events in China from 1961 to 2022, under the influence of global climate warming, through the analysis of annual average rainfall and the distribution and trends of extreme rainfall indices such as heavy-rainfall days, rainfall amounts, and rainfall intensity. The conclusions drawn from the analysis are as follows:
- (1)
- The EOF of heavy-rainfall days on an annual scale shows an “Eastern Coordinated Type” (9.4%), “North–South Antiphase Type” (4.2%), and “Central Differentiation Type” (2.3%). In summer, it adjusts to “North Positive, South Negative” (5.8%), highlighting the northward shift in the rain belt. The Mann–Kendall test indicates a significant increase in the eastern monsoon region (Northeast Plain, South China coast) and a significant decrease in parts of the southwest (Hengduan Mountain Range). R/S analysis reveals a high Hurst index in the eastern region (middle and lower reaches of the Yangtze River), indicating persistent trends and the need to focus on flood risk management.
- (2)
- The spatial mode of heavy-rainfall amounts is similar to that of rainfall days, emphasizing the reinforcement of the rain belt’s northward shift in North China and Northeast China. The Mann–Kendall test shows a significant increase in the Northeast Plain and the South China coast, with a decrease in parts of East China and the middle and lower reaches of the Yangtze River. R/S analysis points out that regions with high Hurst indices in the eastern part (such as North China) need to be prepared for sustained flooding, while regions with low Hurst indices in the west (such as the Tibetan Plateau) may experience occasional extreme rainfall or flash floods.
- (3)
- Heavy-rainfall intensity shows a pattern of “weakening in the east, local strengthening.” The Mann–Kendall test indicates a significant increase in the Northeast Plain and the South China coast (consistent with the northward shift in the summer monsoon and enhanced typhoons), with a decrease in parts of the middle and lower reaches of the Yangtze River. R/S analysis points out that regions with high Hurst indices in the east (such as Northeast China) need to improve drainage standards, while regions with low Hurst indices in the west (such as the northwest desert) should be prepared for occasional extreme-rainfall-related ecological disasters.
Overall, the eastern monsoon region is controlled by the monsoon, with strong persistence in the extreme rainfall indices. By contrast, the northwest and Tibetan Plateau are dominated by local climate factors, exhibiting significant randomness. The eastern region should strengthen long-term flood prevention efforts, while the western region should establish a sensitive emergency response system.
4. Drought Trend Analysis
4.1. Spatial Distribution Characteristics of Drought Index
4.1.1. Trend Analysis of Annual Standardized Precipitation Index
- (1)
- EOF Analysis
The results from EOF analysis of SPI-3 are shown in Figure 19. EOF 1 (13.4%) displays a nationwide consistent change, with positive coefficients in the northern and central-eastern regions, and negative coefficients in the west and parts of the Tibetan Plateau, reflecting the “synergistic consistency” of drought in the central-eastern and northern regions. EOF 2 (8.1%) shows a “Northwest–Northeast Antiphase” pattern, which is related to differences in atmospheric circulation and precipitation distribution. EOF 3 (6.5%) presents a “Northern–Central-South Antiphase” pattern, influenced by local circulation. In terms of time, PC 1 fluctuates without a unidirectional trend, PC 2 has a 10–20-year cycle related to the monsoon, and PC 3 exhibits large fluctuations, reflecting randomness.


Figure 19.
EOF modes of annual Standardized Precipitation Index from 1961 to 2022.
- (2)
- Mann–Kendall Trend Test
In the results from SPI-3 analysis shown in Figure 20, parts of the northern region and the Tibetan Plateau show a positive trend (blue), indicating a reduction in drought risk and an increase in wetness. The central-eastern to southwestern regions show a negative trend (red-orange), indicating an increased risk of drought. Significant increases are observed in the northeast and northwest (continuous red areas), while the southwest and the middle and lower reaches of the Yangtze River show scattered decreases. The wetting in the northern region is associated with an enhancement in moisture from the westerly wind belt, while the drying in the central-eastern region is linked to anomalies in the summer monsoon.

Figure 20.
Maps of the results from the Mann–Kendall trend test of the 1961–2022 annual Standardized Precipitation Index.
- (3)
- R/S Analysis
The spatial distribution of the Hurst index for SPI-3, as shown in Figure 21, exhibits a “generally high, with significant regional differences” pattern. Most of the country falls within the range of 0.6–0.8, with parts of the northwest, southwest, and northern regions reaching 0.8–1.0. The eastern coastal areas and South China show slightly lower values (still > 0.4). High-value areas cover most of the northwest, Tibetan Plateau, and northern regions, indicating a high probability of continued drought in the future. By contrast, the low-value areas along the eastern coast suggest a higher likelihood of dry–wet transitions.

Figure 21.
Hurst index heatmap of annual Standardized Precipitation Index from 1961 to 2022.
4.1.2. Trend Analysis of Autumn Standardized Precipitation Index
- (1)
- EOF Analysis
The results from EOF analysis of the autumn (September–November) SPI-3 are shown in Figure 22. EOF 1 (11.6%) exhibits a positive coefficient in the northwest and a low coefficient in the northeast, reflecting the dominant drought mode in these regions. EOF 2 (9.4%) shows a positive coefficient in the northeast and a negative coefficient in the northwest, indicating an opposite pattern. EOF 3 (8.0%) has a complex spatial distribution, reflecting local variations.
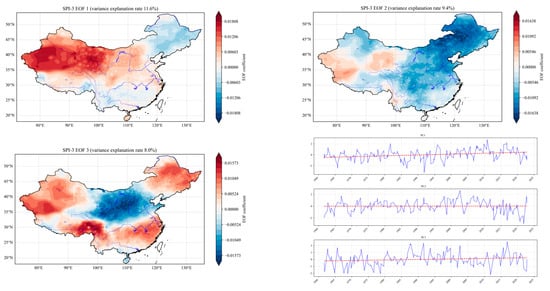
Figure 22.
EOF modes of autumn Standardized Precipitation Index from 1961 to 2022.
In terms of time, PC 1 fluctuates without a unidirectional trend, dominated by large-scale circulation. The fluctuations of PC 2 are related to autumn circulation and moisture. PC 3 exhibits large fluctuations and extreme values, reflecting randomness.
- (2)
- Mann–Kendall Trend Test
The Mann–Kendall test results for the trend of autumn SPI-3 variations are shown in Figure 23. In the northern and Tibetan Plateau regions, SPI-3 shows a positive trend (indicated by blue), suggesting a reduction in drought risk. By contrast, the central-eastern to southwestern regions show a negative trend (indicated by red-orange), indicating an increase in drought risk. Significant increases are observed in parts of the northwest and northeast (continuous red areas), indicating long-term wetting. In scattered regions of the southwest and the middle and lower reaches of the Yangtze River, there is a significant decrease, indicating long-term drying.
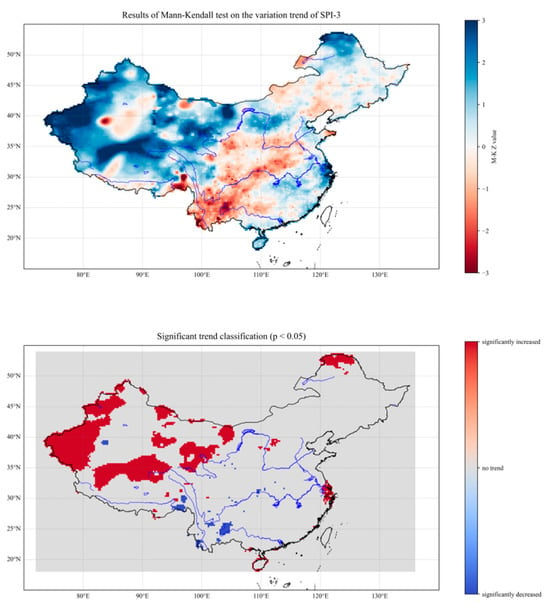
Figure 23.
Maps of results from the Mann–Kendall trend test of the 1961–2022 autumn Standardized Precipitation Index.
Climatically, the wetting in the northern regions is associated with the enhancement in moisture from the westerly wind belt, while the drying in the central-eastern regions is related to anomalies in the autumn monsoon.
- (3)
- R/S Analysis
The spatial distribution of the Hurst index for autumn (September–November) SPI-3 in China, as shown in Figure 24, reveals that most of the country is within the 0.6–0.8 range, with high-value patches exceeding 0.8 in the northeast, North China, northwest, and parts of the south. There is no simple “high in the east, low in the west” differentiation. Instead, high-value areas are widely distributed, reflecting the strong persistence of drought characteristics in autumn SPI-3. Once the trend is formed, it is difficult to reverse quickly, which is different from the “high in the east, low in the west” differentiation observed in the summer heavy-rainfall index.
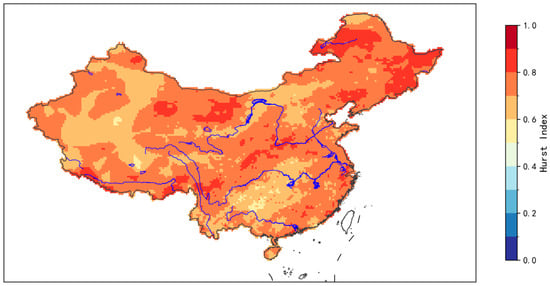
Figure 24.
Hurst index heatmap of autumn Standardized Precipitation Index from 1961 to 2022.
4.2. Summary of Drought Trend Analysis
Trend analysis of the 3-month Standardized Precipitation Index (SPI-3) reveals that EOF patterns exhibit “synchronous coherence” between North and east-central China, with these regions simultaneously shifting toward drier or wetter anomalies. A “Northwest–Northeast out-of-phase” pattern further indicates opposing drought variations between the two sub-regions. Mann–Kendall tests highlight a “wet-north, dry-south” spatial divergence: significant wetting trends occur in the north and northwest, while pronounced drying is evident in east-central and Southwestern China—patterns closely linked to circulation adjustments and topographic influences. R/S analysis shows that the Hurst index is generally high (>0.6) across most of the northwest and north, implying strong drought persistence, whereas lower values (0.4–0.6) scattered along the eastern coast suggest a higher likelihood of wet–dry transitions. Although natural circulation and topography remain the primary drivers of interannual-to-decadal drought variability, human activities—via water-use intensity, land-use change, and aerosol emissions—have significantly modulated both the spatial differentiation and the persistence characteristics of drought. Future scenario projections should therefore incorporate coupled anthropogenic emission scenarios to better disentangle the relative contributions of natural variability and human impacts.
5. Compound Extreme-Rainfall–Temperature Events
Global climate change has led to an increased frequency of extreme weather events, and compound events of extreme rainfall and temperature cause more severe impacts through nonlinear accumulation effects []. This study, based on daily precipitation and temperature data, extracts two types of compound events—high-temperature heavy rainfall and low-temperature heavy rainfall—and analyzes their spatiotemporal evolution patterns.
5.1. Trend Analysis of Compound Extreme-Rainfall–Temperature Events
5.1.1. Trend Analysis of Compound High-Temperature–Heavy-Rainfall Events
After extracting the corresponding compound high-temperature–heavy-rainfall events, trend analysis is conducted following the framework outlined in Section 2.2.3.
- (1)
- Multi-Year Frequency Statistics of Compound High-Temperature–Heavy-Rainfall Events
The distribution of compound high-temperature–heavy-rainfall event frequencies from 1979 to 2018 is shown in Figure 25.
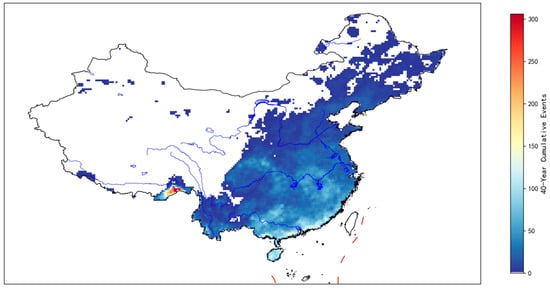
Figure 25.
Frequency distribution map of compound high-temperature–heavy-rainfall events from 1979 to 2018.
The northwest desert, Inner Mongolia grassland, and Tibetan Plateau are “sparse zones,” while the humid tropical regions of South China are high-frequency areas. Some regions in Guangdong and Hainan have accumulated more than 200 days of such events over 40 years, posing a continuous challenge to the local socio-economic systems and ecosystems.
- (2)
- Mann–Kendall Trend Test
The Mann–Kendall trend test was applied to the changes in compound high-temperature–heavy-rainfall events in China from 1979 to 2018, as shown in Figure 26.
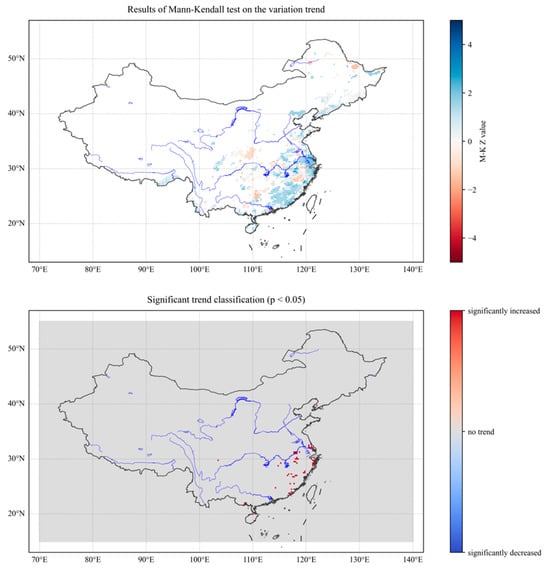
Figure 26.
Results from the Mann–Kendall trend test for compound high-temperature–heavy-rainfall events from 1979 to 2018.
In the southern region—especially the middle and lower reaches of the Yangtze River and parts of the southeastern coast—the alternating blue and orange-red patches indicate marked spatial heterogeneity in the trend of compound hot-day/heavy-rain events. Orange-red zones denote increasing trends, whereas blue zones signal decreases. For example, several orange-red clusters around the Yangtze Delta reveal an upward tendency in compound events during the study period, while adjacent blue areas imply a downward tendency.
In northern China, particularly the northeast and North China Plain, light blue and light orange dominate, indicating relatively weak trends (small absolute Z-values) in compound events; although slight increases or decreases exist, they are not statistically significant. Over the inland northwest, most areas appear nearly white, corresponding to Z-values close to zero, signifying stable compound hot-day/heavy-rain conditions with no discernible trend during the study interval.
- (3)
- R/S Analysis
As shown in Figure 27, over the eastern coastal regions—East and South China provinces—the Hurst index is generally high (0.6–0.8 or above), indicating strong persistence of compound hot-day/heavy-rain events: where such events have occurred frequently in the past, they are very likely to remain frequent in the near future. In contrast, most of Western China (Xinjiang, Qinghai, Tibet) exhibits low Hurst values (0.2–0.4), implying weak persistence; past frequencies provide little guidance for future occurrences. In central provinces such as Henan, Hubei, and Hunan, the Hurst index is spatially heterogeneous: some areas show strong persistence while others are characterized by weak persistence.

Figure 27.
Hurst index heatmap of compound high-temperature–heavy-rainfall events from 1979 to 2018.
5.1.2. Trend Analysis of Compound Low-Temperature–Heavy-Rainfall Events
After extracting the corresponding compound low-temperature–heavy-rainfall events, trend analysis is conducted following the framework outlined in Section 2.2.
- (1)
- Multi-Year Frequency Statistics of Compound Low-Temperature–Heavy-Rainfall Events
The frequency distribution of compound low-temperature–heavy-rainfall events from 1979 to 2018 is shown in Figure 28.
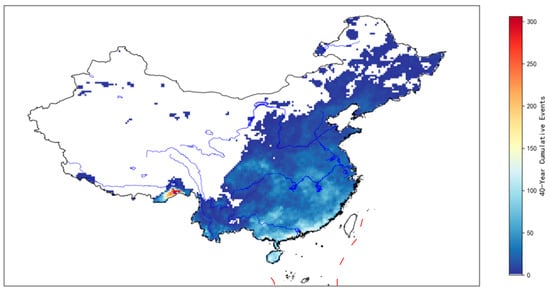
Figure 28.
Frequency distribution map of compound low-temperature–heavy-rainfall events from 1979 to 2018.
From 1979 to 2018, the overall frequency of compound low-temperature–heavy-rainfall events is low, with cumulative frequencies ranging from 0 to 20 over the years, and most stations did not experience such events. These events are primarily distributed along the eastern coast (affected by land–sea thermal differences and monsoon influences) and parts of the northeast and coastal North China, and they are locally concentrated near the southwestern Hengduan Mountains. By contrast, the northwest desert, Inner Mongolia grasslands, and Tibetan Plateau show near-zero frequencies due to arid conditions, lack of moisture, or the dominance of cold air.
- (2)
- Mann–Kendall Trend Test
Results from the Mann–Kendall trend test for compound low-temperature–heavy-rainfall events are shown in Figure 29.
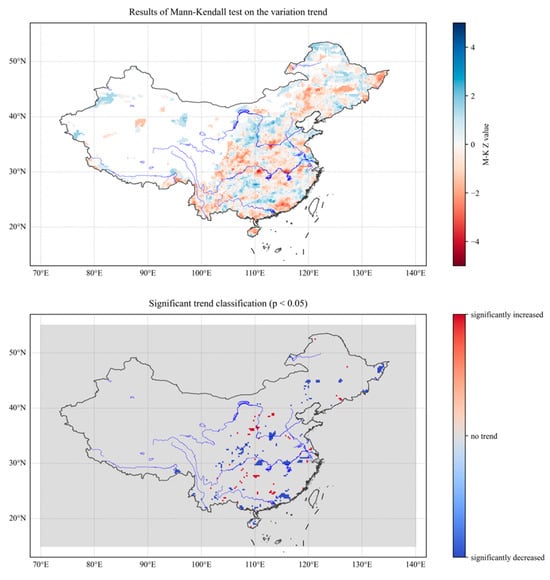
Figure 29.
Results from Mann–Kendall trend test for compound low-temperature–heavy-rainfall events from 1979 to 2018.
Overall, Northeast China exhibits extensive intermingling of blue and orange-red patches: areas dominated by blue indicate increasing trends of cold-day–heavy-rain compound events, whereas orange-red zones denote decreases. North China displays a similar mosaic, but orange-red covers a slightly larger fraction, implying a general decline in such compound events.
South of the Yangtze River, blue prevails in parts of the middle Yangtze basin, signaling an upward tendency, while orange-red is more common along the South China coast, reflecting a downward trend. In western regions—especially portions of Xinjiang—light orange or light blue hues prevail, corresponding to weak trends that are not statistically significant.
The significance-classification map further reveals scattered red and blue pixels along the eastern seaboard: blue on the Shandong Peninsula indicates a significant decrease, whereas small red pockets along the Zhejiang coast denote significant increases. Inland South China (Hunan, Jiangxi) hosts both colors, highlighting local opposing trends. Central provinces such as Henan and Hubei are largely gray (no significant change), interspersed with isolated red or blue spots. Most of western China appears gray, with only tiny red or blue patches, underscoring an overall non-significant trend but acknowledging localized significant changes.
- (3)
- R/S Analysis
As shown in Figure 30, across most of the east and center—including the northeast, North China, Central China and parts of East China—the Hurst index is high (0.6–0.9), indicating strong persistence of cold-day/heavy-rain compound events; frequent occurrence in the recent past implies a high likelihood that this pattern will continue. By contrast, western regions (most of Xinjiang, Qinghai, Tibet, and western Inner Mongolia) show low Hurst values (0.2–0.4 or even lower), revealing weak persistence and little predictive value of past event frequencies for the future.

Figure 30.
Hurst index heat map of 1979–2018 compound low-temperature and heavy-rainfall events.
5.2. Summary of Compound Extreme-Rainfall–Temperature Events
Compound events are far more destructive than single extreme events. In this section, two types of events—high-temperature heavy rainfall and low-temperature heavy rainfall—were defined. Using the multi-year average method, EOF decomposition, the Mann–Kendall trend test, and R/S analysis, the spatial distribution and temporal trends of compound events in China were comprehensively analyzed. The main conclusions are as follows:
- (1)
- Compound high-temperature–heavy-rainfall events: The frequency shows a northwest-to-southeast increase, with South China as the most affected region (Guangdong and Hainan exceeding 200 days in total). The eastern coastal area (from Zhejiang to Guangdong) shows a significant increase, while most of Central and Western China shows no clear trend. The Hurst index is high (0.6–0.8+) in the eastern coastal region, indicating strong persistence; low (0.2–0.4) in the west, indicating weak persistence; and spatially complex in the central region.
- (2)
- Compound low-temperature–heavy-rainfall events: The overall frequency is low, with the eastern coastal region being relatively more frequent. In Northeast China, increases and decreases are interlaced; North China shows an overall decrease; and trends in the south are complex. The Hurst index is high (0.6–0.9) in eastern and Central China, indicating strong persistence, and low (0.2–0.4) in the west, indicating weak persistence.
6. Conclusions
This study, based on a 0.25° daily precipitation dataset, a 0.5°×0.5° gridded temperature dataset, and a 0.1° near-surface temperature dataset for mainland China, applied the multi-year average method, Empirical Orthogonal Function (EOF) decomposition, the Mann–Kendall trend test, and Rescaled Range (R/S) Analysis to investigate the trends and influencing factors of extreme precipitation, compound events, and other extreme climate events in China.
- (1)
- Extreme precipitation: EOF analysis identified two dominant modes: the “Eastern Coherent” pattern and the “North–South Out-of-Phase” pattern. The eastern heavy-rainfall indices (rainy days, rainfall amount, and rainfall intensity) showed a coherent increase, with the middle and lower reaches of the Yangtze River and the South China coast experiencing significant rainfall increases due to monsoon and typhoon influences, while the Hengduan Mountain region in Southwestern China saw a decrease in rainfall due to topographic barriers. Mann–Kendall results revealed a significant increase in rainfall intensity over the Northeast Plain and parts of North China, and a staged increase in rainfall amount in localized areas of the arid northwest (e.g., northern Xinjiang). R/S analysis indicated that Hurst indices in the eastern monsoon region are generally >0.7 (0.8–0.9 in parts of middle and lower Yangtze River), reflecting strong trend persistence, while the arid western region and the Qinghai–Tibet Plateau mostly have Hurst indices <0.5, indicating high randomness in extreme precipitation and an elevated risk of alternating drought and flood conditions.
- (2)
- Drought events: SPI-3 analysis revealed features of “Central-East and Northern Coherence,” “Northwest–Northeast Out-of-Phase,” and “Northern–Central-Southern Out-of-Phase” patterns. The Mann–Kendall test indicated a “Wetter North, Drier South” pattern: SPI-3 significantly increased (wetter conditions) in northern China and parts of the Qinghai–Tibet Plateau, while it significantly decreased (drier conditions) in central-eastern and Southwestern China. R/S analysis showed that the Hurst index is generally high nationwide, with marked spatial variability; Northwestern China and most of the north are high-value areas (strong persistence), while the eastern coastal area is a low-value zone (high likelihood of wet–dry transitions).
- (3)
- Compound extreme-rainfall–temperature events: High-temperature–heavy-rainfall events displayed a “northwest–southeast stepwise increase” pattern, with South China as the high-incidence center (in parts of Guangdong and Hainan, totals exceeded 200 days during 1979–2018). Events increased significantly along the eastern coast (from Zhejiang to Guangdong) but decreased in parts of the middle Yangtze River. R/S analysis showed that Hurst indices along the eastern coast are mostly >0.8 (indicating persistent risk), while those in Central and Western China are <0.4 (weak trend indication). Low-temperature–heavy-rainfall events occurred infrequently, mainly along the eastern coast and around the Hengduan Mountains in Southwestern China (40-year totals <20 days); localized increases were observed on the Shandong Peninsula and Zhejiang coast, while decreases were notable along the South China coast.
Although this study integrates multiple high-resolution gridded datasets and applies a multi-method diagnosis of extreme precipitation and compound events across China, several limitations remain, including low EOF variance-explained ratios, inconsistent data-period lengths, and gridded-data uncertainties. The first three EOF modes together account for <35% of the total variance in heavy-rain days and intensity, indicating that the spatial pattern of extreme precipitation over China is highly complex and localized; large-scale patterns alone cannot capture the full variability. Future work could therefore incorporate cluster analysis or machine-learning algorithms to identify additional regional regimes.
Extreme-precipitation analyses are based on daily data from 1961–2022, whereas the daily temperature data used for compound events only span 1979–2018, shortening the calculation window by 24 years and potentially underestimating the frequency and trends of early-period compound extremes. Longer, higher-resolution near-surface temperature grids are thus needed to create a consistent temporal window.
Although the three gridded datasets have been independently validated against stations (e.g., CC ≈ 0.78, RMSE ≈ 8.8 mm d−1 for precipitation), interpolation errors in the sparsely gauged west—especially the Tibetan Plateau and northern Xinjiang—remain markedly higher than in the east, possibly biasing drought and compound-event thresholds. Future efforts should therefore merge high-density regional stations and radar-/satellite-blended products for further bias correction.
Finally, this paper focuses on statistical diagnostics; dynamical interpretations of key circulation factors such as the monsoon system, blocking highs, and sea-surface-temperature anomalies are still preliminary. Follow-up studies will combine reanalysis circulation fields, wave-activity fluxes, and numerical sensitivity experiments to explore the physical mechanisms behind the inter-decadal oscillations of extreme events.
In summary, we present the first systematic characterization of the spatiotemporal evolution of extreme precipitation and compound events in China from the perspectives of “spatial modes—trend significance—long-term memory.” These findings provide a reference for regional climate-risk assessment and adaptation planning. Nevertheless, owing to limited variance explanation, data-period inconsistencies, and incomplete mechanistic analysis, further improvements are needed using higher-resolution datasets, longer time series, and multi-factor attribution approaches.
Author Contributions
Conceptualization, S.Y. and J.G.; methodology, S.Y.; software, S.Y.; validation, S.Y., X.C., and X.W.; formal analysis, S.Y.; investigation, S.Y. and S.J.; resources, Z.L.; data curation, J.Z.; writing—original draft preparation, S.Y.; writing—review and editing, S.Y.; visualization, S.Y. and X.C.; supervision, J.G.; project administration, J.G.; funding acquisition, J.G. All authors have read and agreed to the published version of the manuscript.
Funding
This work was supported by the National Key Research and Development Program of China (No. 2023YFC3209104), Open Research Fund Project of Jiangxi Provincial Institute of Water Sciences (No. 2023SKSH06), Jiangxi Provincial “Science and Technology + Water Conservancy” Joint Plan Project (2023KSG01007), and the Fundamental Research Funds for the Central Universities (HUST: 2024JYCXJJ020).
Data Availability Statement
The original contributions presented in this study are included in the article. Further inquiries can be directed to the corresponding author.
Acknowledgments
My sincere thanks go to my advisor, Jun Guo, for his profound knowledge, rigorous academic attitude, and wholehearted dedication to research. From topic selection to experimental design, and from data analysis to manuscript revision, his meticulous guidance and warm mentorship have been invaluable to both my academic growth and personal development. Special thanks are extended to Xinyu Chang for his generous guidance throughout my thesis work—from outlining the research framework and technical route to debugging experiments and refining the manuscript’s logic. To all who have touched my life, thank you for helping me become who I am today. Life is finite, but learning is boundless, and I will continue to move forward with determination and optimism.
Conflicts of Interest
The authors declare no conflicts of interest.
References
- The People’s Republic of China. Fourth National Communication on Climate Change; Ministry of Ecology and Environment of People’s Republic of China: Beijing, China, 2023.
- The People’s Republic of China. China’s Policies and Actions for Addressing Climate Change—Annual Report 2024; Ministry of Ecology and Environment of People’s Republic of China: Beijing, China, 2024.
- Ji, D.; Yuan, Y.; Han, J. Spatio-temporal variation and trend prediction of extreme precipitation events in China. China Rural Water Hydropower 2022, 10, 74–80. [Google Scholar]
- Kong, F.; Lü, L.; Fang, J.; Zhang, L.; Wang, Z. Interdecadal spatio-temporal evolution characteristics of rainstorms of different intensities in China (1951–2010). J. Cap. Norm. Univ. (Nat. Sci. Ed.) 2017, 38, 75–85. [Google Scholar]
- Li, H.; Zhou, T.; Yu, R. Analysis of changes in midsummer daily precipitation characteristics over eastern China in recent forty years. Chin. J. Atmos. Sci. 2008, 2, 358–370. [Google Scholar]
- Song, L. Trend analysis of meteorological drought in China over the past 30 years based on SPEI. J. Water Sci. Cold Reg. Eng. 2025, 8, 88–91. [Google Scholar]
- Zhang, X. Detection and Attribution of Autumn Drought in China Based on SPI and SPEI. Master’s Thesis, Nanjing University of Information Science and Technology, Nanjing, China, 2022. [Google Scholar]
- Gu, Z.; Gu, L.; Yin, J.; Fang, W.; Xiong, L.; Guo, J.; Zeng, Z.; Xia, Y. Atmospheric circulation mechanisms and drought propagation characteristics of land drought in China. Sci. China Earth Sci. 2024, 54, 2674–2689. [Google Scholar]
- Velpuri, M.; Das, J.; Umamahesh, N.V. Spatio-temporal compounding of connected extreme events: Projection and hotspot identification. Environ. Res. 2023, 235, 116615. [Google Scholar] [CrossRef] [PubMed]
- Zscheischler, J.; Westra, S.; van den Hurk, B.J.J.M.; Seneviratne, S.I.; Ward, P.J.; Pitman, A.; AghaKouchak, A.; Bresch, D.N.; Leonard, M.; Wahl, T.; et al. Future climate risk from compound events. Nat. Clim. Change 2018, 8, 469–477. [Google Scholar] [CrossRef]
- Qian, C.; Ye, Y.; Bevacqua, E.; Zscheischler, J. Human influences on spatially compounding flooding and heatwave events in China and future increasing risks. Weather Clim. Extrem. 2023, 42, 100616. [Google Scholar] [CrossRef]
- Zhou, B.; Wen, S.; Jiang, F.; Wang, C. Spatio-temporal evolution characteristics of compound extreme temperature and precipitation events in the Pearl River Basin from 1961 to 2020. Water Resour. Hydropower Technol. (Chin. Engl.) 2025, 56, 1–23. [Google Scholar]
- Hao, Z.; Hao, F.; Singh, V.P.; Ouyang, W.; Zhang, X.; Zhang, S. A joint extreme index for compound droughts and hot extremes. Theor. Appl. Climatol. 2020, 142, 321–328. [Google Scholar] [CrossRef]
- Huang, Y.; Wang, H.; Zhang, P. A skillful method for precipitation prediction over eastern China. Atmos. Ocean. Sci. Lett. 2022, 15, 100133. [Google Scholar] [CrossRef]
- Laz, O.U.; Rahman, A.; Ouarda, T.B.M.J. Trend and teleconnection analysis of temperature extremes in New South Wales, Australia. Nat. Hazards 2025, 121, 4559–4584. [Google Scholar] [CrossRef]
- Lu, Y.; Jiang, S.; Ren, L.; Zhang, L.; Wang, M.; Liu, R.; Wei, L. Spatial and Temporal Variability in Precipitation Concentration over Mainland China, 1961–2017. Water 2019, 11, 881. [Google Scholar] [CrossRef]
- Li, L.; Zou, Y.; Li, Y.; Lin, H.; Liu, D.L.; Wang, B.; Yao, N.; Song, S. Trends, change points and spatial variability in extreme precipitation events from 1961 to 2017 in China. Hydrol. Res. 2020, 51, 484–504. [Google Scholar] [CrossRef]
- Bunde, A.; Havlin, S.; Koscielny-Bunde, E.; Schellnhuber, H.-J. Long term persistence in the atmosphere: Global laws and tests of climate models. Phys. A Stat. Mech. Its Appl. 2001, 302, 255–267. [Google Scholar] [CrossRef]
- Han, J.; Miao, C.; Gou, J.; Zheng, H.; Zhang, Q.; Guo, X. A new daily gridded precipitation dataset for the Chinese mainland based on gauge observations. Earth Syst. Sci. Data 2023, 15, 3147–3161. [Google Scholar] [CrossRef]
- Qin, R.; Zhao, Z.; Xu, J.; Ye, J.-S.; Li, F.-M.; Zhang, F. HRLT: A high-resolution (1 d, 1 km) and long-term (1961–2019) gridded dataset for surface temperature and precipitation across China. Earth Syst. Sci. Data 2022, 14, 4793–4810. [Google Scholar] [CrossRef]
- Fang, S.; Mao, K.; Xia, X.; Wang, P.; Shi, J.; Bateni, S.M.; Xu, T.; Cao, M.; Heggy, E.; Qin, Z. Dataset of daily near-surface air temperature in China from 1979 to 2018. Earth Syst. Sci. Data 2022, 14, 1413–1432. [Google Scholar] [CrossRef]
- GB/T 20481-2017; Grades of Meteorological Drought. China Meteorological Administration: Beijing, China, 2017.
- Zhou, Y. Spatio-temporal distribution characteristics of multi-year rainfall and temperature in Jiangsu Province based on EOF. Water Resour. Plan. Des. 2024, 3, 50–54. [Google Scholar]
- Chang, X. Study on Hydrometeorological Characteristics and Runoff Forecasting in the Yalong River Basin. Master’s Thesis, Huazhong University of Science and Technology, Wuhan, China, 2022. [Google Scholar]
- Mann, H.B. Nonparametric tests against trend. Econometrica 1945, 13, 245–259. [Google Scholar] [CrossRef]
- Kendall, M.G. Rank correlation methods. Br. J. Psychol. 1990, 25, 86–91. [Google Scholar] [CrossRef]
- Chebana, F.; Ouarda, T.B.M.J.; Duong, T.C. Testing for multivariate trends in hydrologic frequency analysis. J. Hydrol. 2013, 486, 519–530. [Google Scholar] [CrossRef]
- Chai, S.; Kan, B.; Guo, H. Analysis of precipitation change in Xining based on the Mann-Kendall method. Qinghai Sci. Technol. 2023, 30, 148–151. [Google Scholar]
- Lin, S.; Gao, Z.; Wang, Q.; Hu, Y.; Yang, S. Study on precipitation variation characteristics in Nanchang based on Mann-Kendall test and wavelet analysis. Sci. Technol. Wind 2021, 7, 125–126. [Google Scholar]
- Li, C.; Zheng, Y.; Huang, Q.; Huang, G. Analysis of trend and abrupt change in flood season precipitation in Shaoguan based on Mann-Kendall test. J. Shaoguan Univ. 2021, 42, 42–47. [Google Scholar]
- Wang, X.; Hu, B.; Xia, J. R/S analysis method for hydrological time series trend and change points. J. Wuhan Univ. (Eng. Ed.) 2002, 2, 10–12. [Google Scholar]
- Zhao, J. Spatio-Temporal Characteristics, Abrupt Changes, and Future Trend Analysis of Climate Change in China from 1960 to 2013. Master’s Thesis, Fujian Agriculture and Forestry University, Fuzhou, China, 2017. [Google Scholar]
- Wang, Y. Evolution Law of Runoff in the Nenjiang River Basin and its Attribution Analysis. Master’s Thesis, Jilin University, Changchun, China, 2012. [Google Scholar]
Disclaimer/Publisher’s Note: The statements, opinions and data contained in all publications are solely those of the individual author(s) and contributor(s) and not of MDPI and/or the editor(s). MDPI and/or the editor(s) disclaim responsibility for any injury to people or property resulting from any ideas, methods, instructions or products referred to in the content. |
© 2025 by the authors. Licensee MDPI, Basel, Switzerland. This article is an open access article distributed under the terms and conditions of the Creative Commons Attribution (CC BY) license (https://creativecommons.org/licenses/by/4.0/).