Article

Evaluation of Water Resource Carrying Capacity and Analysis of Driving Factors in the Dadu River Basin Based on the Entropy Weight Method and CRITIC Comprehensive Evaluation Method

by
Li Han
1,2,
Yi Wang
2,
Shaoda Li
1,*,
Wei Li
1 and
Xiaojie Chen
2
1
College of Earth and Planetary Sciences, Chengdu University of Technology, Chengdu 610059, China
2
School of Surveying and Geo-Informatics, Sichuan Water Conservancy Vocational College, Chengdu 611200, China
*
Author to whom correspondence should be addressed.
Water 2025, 17(16), 2360; https://doi.org/10.3390/w17162360
Submission received: 9 July 2025 / Revised: 3 August 2025 / Accepted: 6 August 2025 / Published: 8 August 2025
(This article belongs to the Section Water Resources Management, Policy and Governance)

Abstract

Water Resource Carrying Capacity (WRCC) serves as a critical indicator for assessing the supportive capacity of water resource systems. This study selects 28 districts and counties within the Dadu River Basin as case studies, constructs a WRCC evaluation framework based on the four-dimensional collaborative perspective of “water resources–society–economy–ecology,” proposes a combined weighting method integrating the CRITIC and entropy weight approaches to optimize index weight calculation, and applies the obstacle degree model to investigate the spatio-temporal heterogeneity of regional WRCC and its underlying driving mechanisms. The results show the following: (1) From 2011 to 2020, the WRCC in the Dadu River Basin increased by 17% as a whole. All districts and counties showed an upward trend. (2) The spatial differentiation of WRCC is significant. The downstream regions are approaching the fourth-level threshold, driven by the adoption of water-saving technologies and the agglomeration effects of economic activities. In contrast, the upstream regions face inherent constraints arising from the conflict between ecological conservation and resource exploitation, leading to a relatively slower growth rate. (3) The driving mechanism of WRCC shows the transformation characteristics of “shifting from being dominated by the social economy to the synergy of the economy and ecology”. Based on this analysis, a strategy of “zonal regulation–structural optimization–management upgrade” is proposed.

1. Introduction

Water resources represent one of the most fundamental and indispensable natural resources that sustain human life, support socio-economic development, and maintain ecosystem stability [1]. Currently, water scarcity has emerged as a critical challenge to global development and is projected to intensify over the next five decades [2,3]. Since the beginning of the 21st century, China’s rapid urbanization and socio-economic growth have exacerbated water resource challenges, increasingly constraining the sustainability of its economic and social systems [4].
Water Resource Carrying Capacity (WRCC) refers to the maximum level of water resources that can be sustainably utilized within a given region to support continued social and economic development under specific social, economic, and technological conditions [5,6,7]. It not only precisely reflects the coordination among water resources, social economy, and ecological environment, but also serves as a key threshold for measuring the constraints of water resources on regional economic and social development. Based on this, there is a widespread consensus in the academic and industrial circles that the intensity and scale of a region’s social and economic development should be anchored within the range of the region’s WRCC. Furthermore, a systematic and in-depth exploration of the regional WRCC can guide the efficient and sustainable use of regional water resources, which has theoretical exploration value and practical guiding significance.
In recent years, various researchers have conducted extensive studies on WRCC and achieved significant advancements [8,9,10]. The concept of WRCC was first introduced by the Soft Science Research Group of Water Resources in Xinjiang, China, in 1989. It is defined as the volume of water that can be sustainably utilized under the constraints imposed by fundamental natural and socio-economic conditions.
Since its proposal, the theoretical connotation of WRCC has been extensively studied and continuously enriched. In particular, several related concepts have emerged, such as the carrying capacity of river basins, water resource shortages, and sustainable water use. These studies align with the research framework of WRCC [11,12,13]. Currently, the understanding of WRCC can be broadly categorized into two perspectives. First, some scholars define WRCC as the maximum scale of water resources that can support the sustainable development of the socio-economy [14,15,16]. Meanwhile, another group emphasizes WRCC as the overall state of the coupled relationship between water resources and the socio-economic and ecological environment systems [17,18]. Both perspectives agree that WRCC is determined by multiple interrelated factors, including water resources, society, economy, and the ecological environment. The core objective of WRCC research should be to effectively reconcile the conflicts between regional socio-economic development and water resource management, thereby achieving coordinated and sustainable development.
In the realm of bearing capacity research, it is typically essential to establish a diversified evaluation index system, followed by the calculation of WRCC through various mathematical methods [19,20]. Generally speaking, the indicator system is grounded in a theoretical framework. Due to differing scholarly interpretations regarding the influence indicators of WRCC, various theoretical frameworks have been developed, such as load and carrier [21], support and pressure [22], water supply and demand [23], as well as utilizing Pressure-State-Response (PSR) models and their improved versions [24]. Additionally, there are frameworks that couple water resources with societal, economic, ecological, and environmental factors [25]. Based on the completion of the index system construction, researchers have developed a large number of evaluation methods to carry out WRCC evaluation, including the Analytic Hierarchy Process (AHP) [26], Ideal Solution Similarity Ranking Preference Technique (TOPSIS) [27], ecological footprint model [28], fuzzy comprehensive evaluation method [29], System Dynamics model (SD) approach [1], improved fuzzy and TOPSIS model [30], RAGA-PP model [31], triangular fuzzy numbers [32], among others.
In conclusion, the series of studies currently conducted by the academic community on WRCC has significantly expanded and enriched the theoretical framework of this field, thereby establishing a solid foundation for subsequent in-depth research endeavors. However, upon in-depth analysis of the existing research, there are still several key issues that need to be explored in depth. Firstly, current research primarily focuses on the comprehensive analysis of the natural entity level of water resources, their natural conditions, and social factors—such as groundwater extraction technologies, water supply, and sanitation infrastructure—while in-depth exploration of the interactions among these factors remains insufficient. Additionally, there is a lack of detailed research differentiating the impacts of various indicators, including social management levels and water resource utilization efficiency. Secondly, from the perspective of the time dimension, most of the current literature focuses on the investigation or prediction of individual years of regional WRCC contexts. This approach tends to overlook the dynamic influence of time-related factors. This is extremely unfavorable for the prediction of future development trends and makes it difficult to meet the needs of in-depth research. Thirdly, the single models or comprehensive evaluation methods commonly employed in existing studies frequently neglect potential overlaps in information among indicators. This oversight often leads to a complex construction of indicator systems and extended computational processes. Consequently, there is an urgent need to develop a scientifically sound, reliable, and holistic assessment approach that effectively integrates the strengths of multiple methodologies. Fourthly, thoroughly elucidating the intrinsic connections and underlying driving mechanisms among the various elements within the system and their relationship to changes in WRCC is crucial for the precise implementation of policies and the enhancement of WRCC. Currently, research on the facilitating and inhibiting factors that influence the improvement of WRCC remains insufficiently comprehensive and in-depth.
For a long time, the Dadu River Basin has caused many ecological and environmental challenges in the process of resource development and utilization. However, to date, there has been a lack of systematic research on the WRCC and the driving mechanisms within the Dadu River Basin in China. In light of these issues, this study aims to address a critical research question: How can we scientifically evaluate WRCC while thoroughly analyzing the driving mechanisms behind its development? Consequently, the primary objectives and contributions of this study are outlined as follows:
Based on the concept of ecological civilization, this study developed a WRCC evaluation index system through systematic screening and optimization. The system integrates four core dimensions: water resources, society, economy, and the ecological environment. To more accurately reflect the supporting capacity and risk resistance of the regional water resource system, key socio-economic indicators—such as the level of ecological environment management and economic water use efficiency—were incorporated into the subsystems. A WRCC evaluation methodology combining the CRITIC method with the entropy weight method was proposed to enable both qualitative and quantitative analysis, thereby providing a scientific basis for understanding the regional driving mechanisms. As illustrated in Figure 1, the research framework outlines the workflow of the proposed approach. This study established a target layer consisting of four subsystems: economy, population, water resource demand, and water environment. By introducing restrictive factors, the actual state of the WRCC system across districts and counties in the Dadu River Basin from 2010 to 2020 was reconstructed as accurately as possible, offering valuable reference for promoting sustainable development of water-related ecological civilization in the region.
This study aims to complement previous research findings and provide certain guidance for water resource management in the Dadu River Basin. The research scope and data sources are described in Section 2, following the introduction. Subsequently, the research methods and models employed are detailed in Section 3. Section 4 presents a discussion on the WRCC of each district and county within the Dadu River Basin for the period 2011–2020. Finally, the conclusions derived from the study are summarized at the end of the paper.

2. Research Area and Data

2.1. Research Area

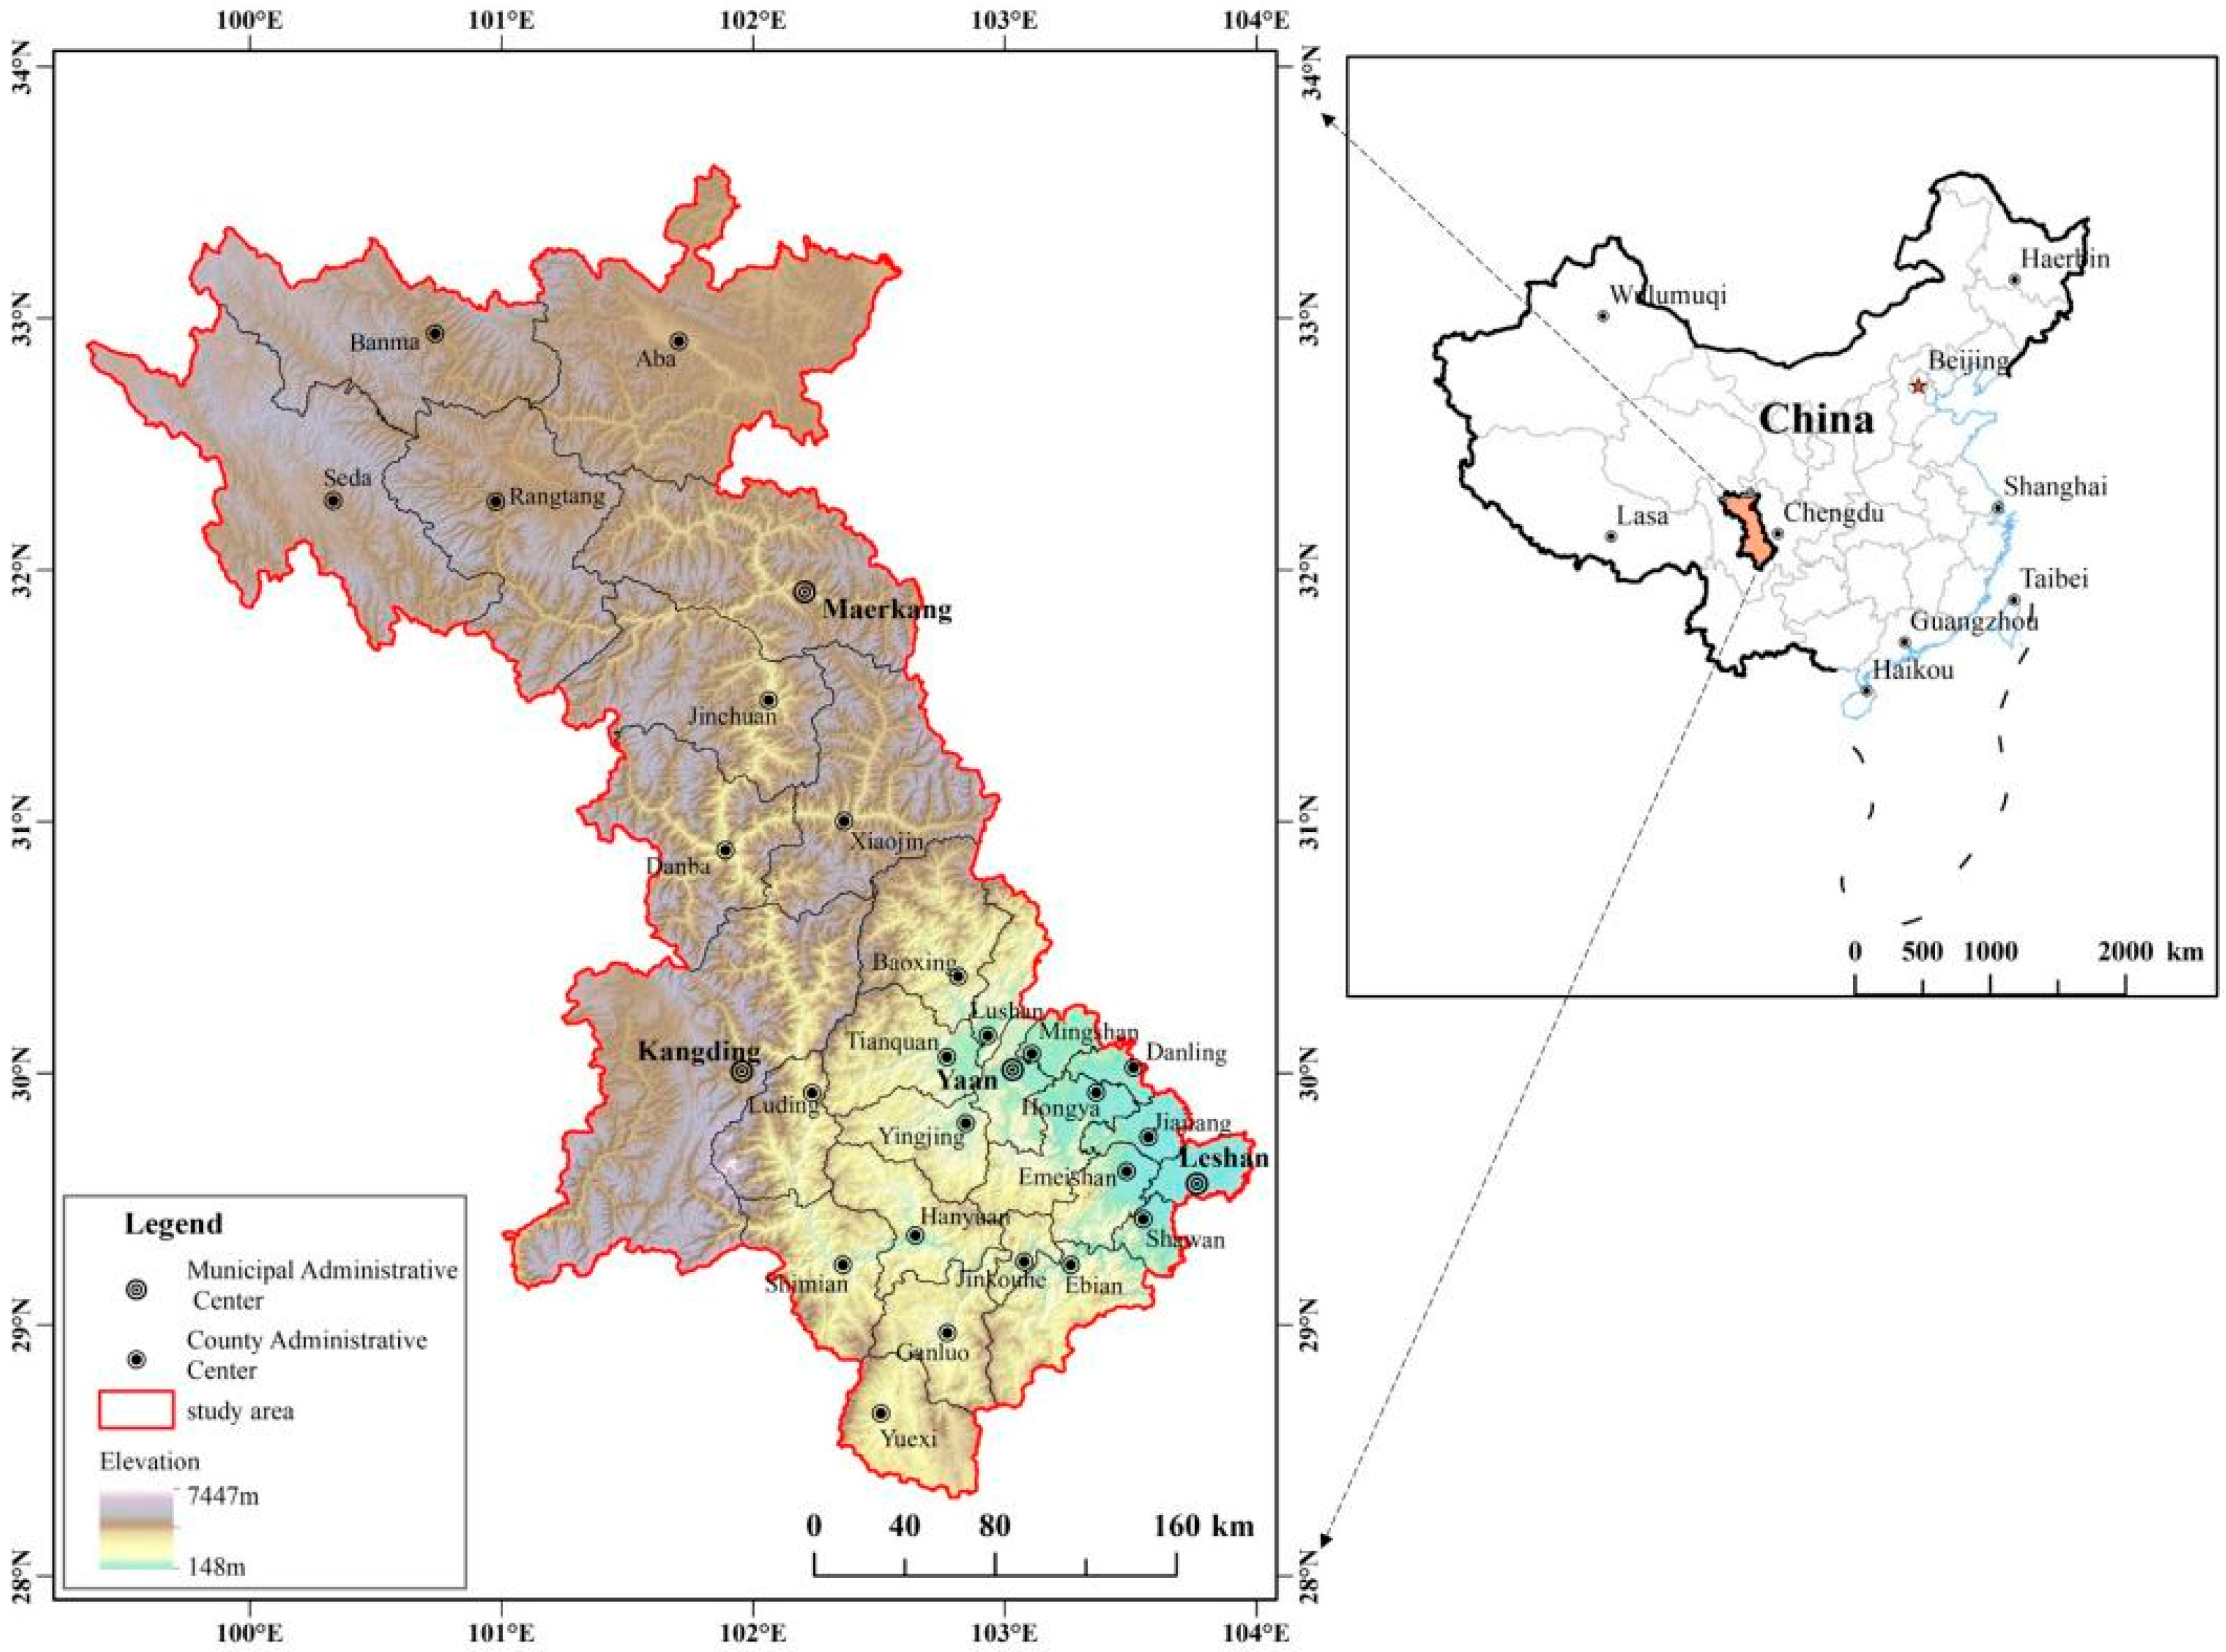
The Dadu River is a secondary tributary of the upper reaches of the Yangtze River and the largest tributary of the Minjiang River. It originates in Yushu Tibetan Autonomous Prefecture, Qinghai Province, flows southward through Jinchuan County and Danba County, and is named the Dadu River after accepting the small Jinchuan River to the east of Danba County. Then, it turns eastward through Luding County and Shimian County, passing through Hanyuan County and Ebian Yi Autonomous County, and empties into the Minjiang River south of Leshan City. The total length of the river is 1062 km. The Dadu River has an annual runoff ranging from 33 to 38.6 billion cubic meters, which accounts for over 40% of the total volume within the Minjiang River system. It is the basic guarantee for agricultural irrigation, urban, and industrial water supply in the Sichuan Basin. Furthermore, its upper reaches encompass forested areas, alpine meadows, and wetland ecosystems that constitute vital water sources for the Yangtze River. These ecosystems contribute significantly to maintaining water resource balance in both the middle and lower reaches of the Yangtze by promoting soil stabilization and facilitating water storage.
The Dadu River Basin is situated in the southwestern region of China, at the southeastern edge of the Qinghai-Tibet Plateau. It extends from 25.5° to 33.8° latitude and from 95.8° to 102.5° longitude, encompassing a drainage area of approximately 90,096 square kilometers. The basin includes six prefectures and cities, such as Leshan and Ya’an, along with 28 counties (Figure 2). Except for certain areas in the upper reaches that fall within Qinghai Province, approximately 91.5% of the drainage area lies within Sichuan Province. The total population residing within this basin currently stands at approximately 4.4016 million.
The terrain throughout the basin is characterized by its complexity, featuring significant elevation differences and considerable climatic variations that span two major climate types. The upper reaches are classified under the plateau climate zone found in western Sichuan, which is noted for being cold and dry; here, the annual average temperature remains below 6 °C with an annual rainfall averaging around 700 mm. In contrast, both middle and lower reaches belong to the subtropical humid climate zone typical of the Sichuan Basin; these regions generally experience an annual average temperature ranging between 13 °C to 18 °C alongside an annual rainfall typically around 1000 mm. In the western and southern mountainous areas of the middle reaches, the rainfall can reach 1400 to 1700 mm.
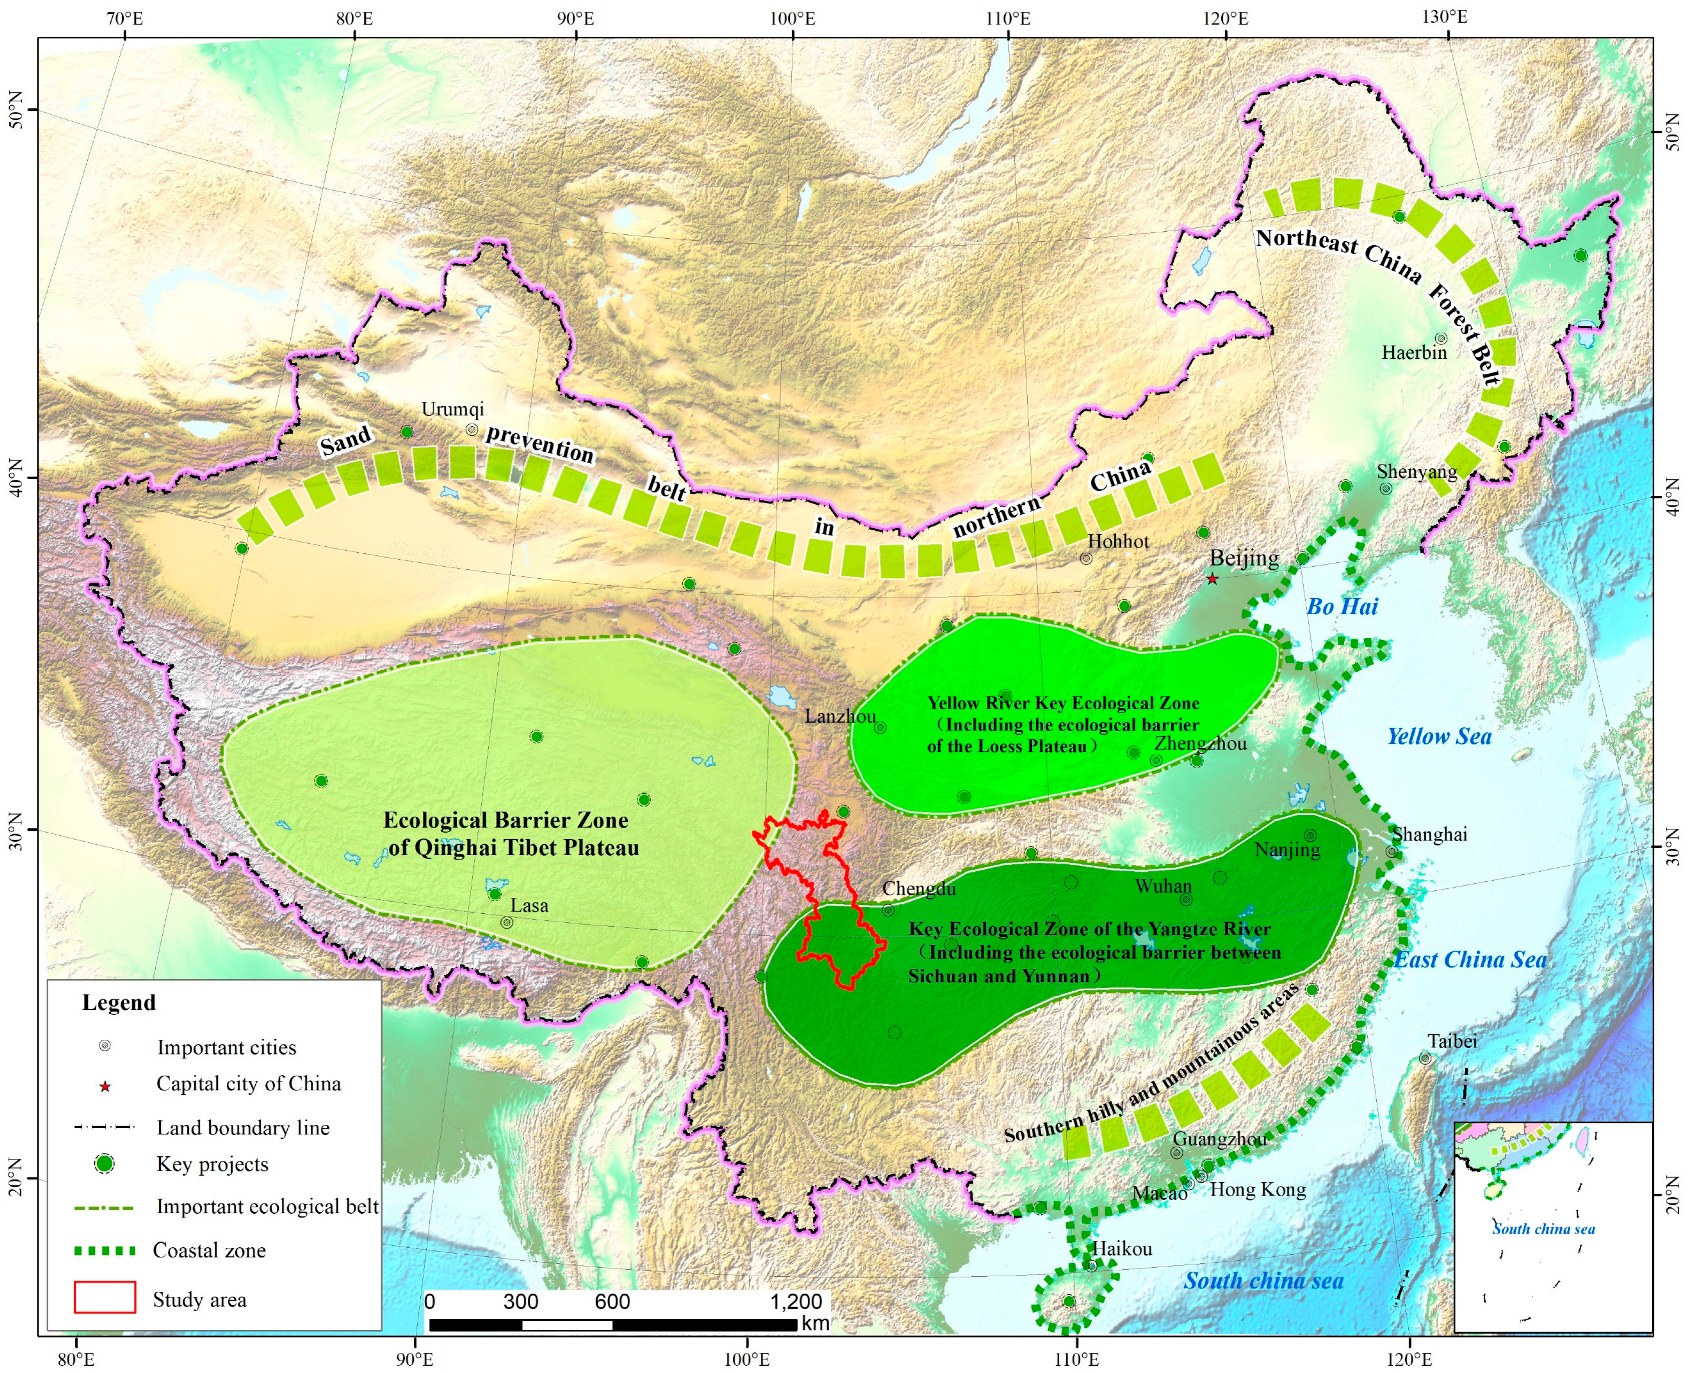
The substantial elevation drop combined with abundant water flow through narrow river valleys has resulted in rich hydropower resources within the Dadu River Basin that are ripe for development. The theoretical reserve capacity for hydropower resources across this entire basin amounts to approximately 31.32 million kilowatts; among these reserves, about 30.12 million kilowatts are located within Sichuan Province alone, accounting for roughly 20.6% of all hydropower resources available from rivers throughout Sichuan Province overall. Among the hydropower resources of the Dadu River, there are 23.37 million kilowatts available for development and utilization within Sichuan Province, of which 20.4 million kilowatts are in the main stream. Compared to the major rivers in the country, it ranks fourth and is recognized as one of the top ten hydropower resource bases nationwide. As displayed in Figure 3, the Dadu River Basin is situated within the ecological barrier region of the Qinghai-Tibet Plateau and serves as a key ecological area for the Yangtze River, which includes the ecological barrier between Sichuan and Yunnan. Its significance is thus self-evident.

2.2. Data Sources

The research area encompasses 28 districts and counties within the Dadu River Basin, with the study period spanning from 2011 to 2020. The annual data on economic, social, and ecological environment indicators are obtained from various sources, including the “Water Resources Bulletin,” “Statistical Yearbook,” “Statistical Bulletin on National Economic and Social Development,” and “Environmental Statistical Bulletin” for each district (city) and county.

3. Research Methods

3.1. Establishment of the WRCC Evaluation Index System

3.1.1. Evaluation Index System

The construction of ecological civilization is grounded in the principle of respecting and rationally utilizing nature, with the ultimate goal of achieving harmonious coexistence between humans and the natural environment. Therefore, within the theoretical framework of sustainable development, the establishment of an indicator system should comprehensively incorporate the requirements of China’s strictest water resource management policy and carefully select representative evaluation indicators. To effectively illustrate the interrelationships among participants within the WRCC system, this study identifies indicators from four key perspectives: water resources, economy, society, and ecological environment. Drawing upon relevant literature [14,17,22,33], as well as expert opinions and data collected from the study area, we have selected indicators that adequately represent both water resources and subsystems encompassing economy, society, and ecological environment based on the WRCC framework. Meanwhile, since the WRCC is the result of the interaction among the economy, population, water pollution, and water resources, development factors such as industrial output value and irrigated area, as well as limiting factors such as water pollution, affect the development trend of the WRCC. Accordingly, index layers corresponding to each subsystem are established. The process of constructing the WRCC indicator system primarily involves three steps: initial establishment of the indicator system, screening of indicators, and final determination.
Based on the literature [34,35], combined with the principles of basin coordination, representativeness, and operability, we selected 25 influencing factors as the evaluation indicators of WRCC, among which there were 11 positive indicators and 14 negative indicators, as shown in Table 1.

3.1.2. Dimensional Processing of the Index System

Given the diverse nature of each indicator in the evaluations that influence the WRCC of a region, it is essential to reverse the process of certain negative indicators. The formula for usage is as follows: Negative Indicator:
x i = x i m a x x i   x   i m a x x i m i n ,
In the formula, i represents the evaluation unit, x i denotes the initial value of the unit i , x i   m a x and x i   m i n indicate the maximum and minimum values of the evaluation unit, respectively.
Moreover, due to the inherent differences in nature among various indicators—along with inconsistencies in units and dimensions—they cannot be utilized directly. Consequently, it is essential to normalize data obtained from diverse sources. The usage formula is as follows:
All indicators:
S i = S i S i   m i n S i   m a x S i   m i n ,
In the formula, i denotes the evaluation unit, S i signifies the initial value of the unit i , and S i m a x and S i m i n represent the maximum and minimum values of the evaluation unit, respectively.

3.2. Development of the Combined Weight Model

3.2.1. The CRITIC Method

The CRITIC weighting method is an objective approach to determining weights for indicators. This method focuses on two key components: contrast intensity and conflict indicator. The contrast intensity is represented by the standard deviation. If the standard deviation of the data is larger, it indicates a greater fluctuation and a higher weight. Conflict is represented by the correlation coefficient. If the correlation value between indicators is larger, it indicates that the conflict is smaller, and thus its weight is lower. In calculating the weights, contrast intensity is multiplied by the conflict index and subsequently normalized to derive the final weight. The calculation procedure is outlined as follows:
Step 1: Calculate the standard deviation xj and conflict Sj for each index.
x j = 1 m i = 1 m x i j s j = i = 1 m x i j x j 2 m 1 ,
R j = j = 1 n ( 1 r j j ) ( j j ) ,
In the formula, xj and Sj denote the mean and standard deviation of the j-th indicator, respectively, while rjj represents the correlation coefficient between the j-th indicator and itself.
Step 2: Computational Information Volume (CIV)
C j = S j × R j ,
Step 3: Calculation of the Weight
W j C = C j j = 1 n C j ,

3.2.2. Entropy Weight Method

The entropy weight method is an objective approach for determining the weights of indicators. It assigns corresponding weights based on the amount of information contained in the observed values of each indicator. The theoretical foundation of this method is predicated on the notion that when sample values for a particular indicator exhibit significant variability, it suggests that the indicator conveys more information and occupies a more critical role in the performance evaluation process. Consequently, it should be assigned a higher weight value [36]. This method offers the advantage of objectively deriving index weight values. The implementation of the entropy weight method to determine weights involves the following steps:
(1)
The sub-indicators are standardized using Equations (3)–(8) and Equations (3)–(9). Building upon this standardization, a new discriminant matrix is constructed B = ( b i j ) m × n .
(2)
The proportion of the i -th evaluation object for the j -th indicator is determined using the following formula:
  f i j =   1 + b i j i = 1 m ( 1 + b i j ) ,
(3)
If we denote the entropy value of the j -th evaluation index as H j , its calculation can be expressed by the following formula:
H j = 1 ln m j = 1 n ( f i j ln f i j ) ,
(4)
The entropy weight corresponding to each evaluation index can be expressed using the following mathematical expression:
β j =   1 H j j = 1 n ( 1 H j ) ,

3.2.3. CRITIC–Entropy Weight Method Combined Weight Method

The determination of the weights of evaluation indicators is of vital importance for the calculation of WRCC. If only one weighting method is adopted to calculate the weights, certain errors will occur in the results.
As illustrated in Table 2, the result weight distribution of the CRITIC method is relatively even, and it is difficult to reflect the influence of different indicators on WRCC, while the result of the entropy weight method shows that the weights of some indicators are relatively large. By conducting linear combination calculations on the two results, the combined weights will not show a phenomenon where the weights of some indicators are significantly too large or the weights of all indicators are very evenly distributed, thereby enhancing the rationality of the evaluation results.
The composite weight for each sub-index can be derived by aggregating the factor weights obtained from both the CRITIC method and those from the entropy weight method. The specific calculation procedure is outlined as follows:
ω i = r × α i + ( 1 r ) × β i ,
In the formula, ω i represents the composite weight, α i denotes the weight of each sub-index derived from the CRITIC weighting method, and β i signifies the weight coefficient of the sub-index obtained through the entropy weighting method.
This approach considers a balanced superposition of both the CRITIC and entropy weighting methods to calculate the composite weight, where r is defined as the combination coefficient with constraints 0 < r < 1. The value of can be determined based on the decision-maker’s perceived significance of each method [37]. When 0 ≤ r ≤ 0.5, it indicates that the decision-maker prioritizes the entropy weight method over others. In this study, we set r = 0.7. The final weights corresponding to each sub-indicator are presented in Table 2.

3.2.4. Classification of WRCC Evaluation Results

This research is based on the current situation of water resource development in the Dadu River Basin and the current situation of water resource development in each district and county of the basin. The evaluation criteria for water resources are based on previous studies [38,39]. We categorize evaluation indices into five levels: Level One represents a severe overload state, Level Two indicates an overload state, Level Three denotes a critical state, Level Four signifies a weakly bearable state, and Level Five reflects a bearable state. Utilizing the classification method for regional WRCC status, we assign comprehensive score indices to assess WRCC across five distinct levels. This approach facilitates both quantitative and qualitative analyses of the WRCC in the Dadu River Basin. The specific classification criteria are detailed in Table 3.

3.3. Obstacle Degree Model of WRCC

When evaluating WRCC, it is not only essential to assess the regional WRCC but also to comprehend the factors hindering WRCC in different counties and districts. Typically, following a comprehensive evaluation—such as calculating the respective weights of both the criterion layer and indicator layer after constructing an indicator weight system—the identification of ‘major obstacle factors’ can be achieved. At this stage, the ‘obstacle degree model’ may be employed for further analysis in order to compare different levels of obstruction (i.e., degrees of influence). This approach facilitates a driving factor analysis of WRCC for each county and district. The obstacle degree model is frequently utilized to identify the obstacle factors affecting the development of an object, involving three measurement factors: (1) factor contribution, (2) indicator deviation, and (3) obstacle degree. The main obstacles affecting the improvement of regional WRCC can be diagnosed based on the size of the obstacle degree [40]. Consequently, we have integrated the obstacle degree model into our analysis of WRCC to investigate key obstructive factors influencing WRCC within the Dadu River Basin. The steps involved in calculating the obstacle degree are outlined as follows [10]:
Step 1: Calculating the weights of the indicator layer factors, which represent the contribution degree of each factor to the overall objective. These weights are denoted as wj for each corresponding index and are derived using Equations (1) through (10).
Step 2: Calculate the standardized value ( x i ) by applying Equation (2).
Step 3: Determine the I value based on the calculated standardized value (xi), I = 1 x i .
Step 4: Computing the obstacle degree Oj, which reflects the extent to which a specific indicator or criterion-level factor hinders the achievement of the WRCC goal. The calculation formula is presented below:
o j = F × I j = 1 m F × I .
Step 5: Compute the U value at the criterion layer level. The corresponding formula is provided as follows:
U = O j , j .

4. Analysis of WRCC Results and Driving Factors in the Dadu River Basin

4.1. Temporal Variation Characteristics of WRCC

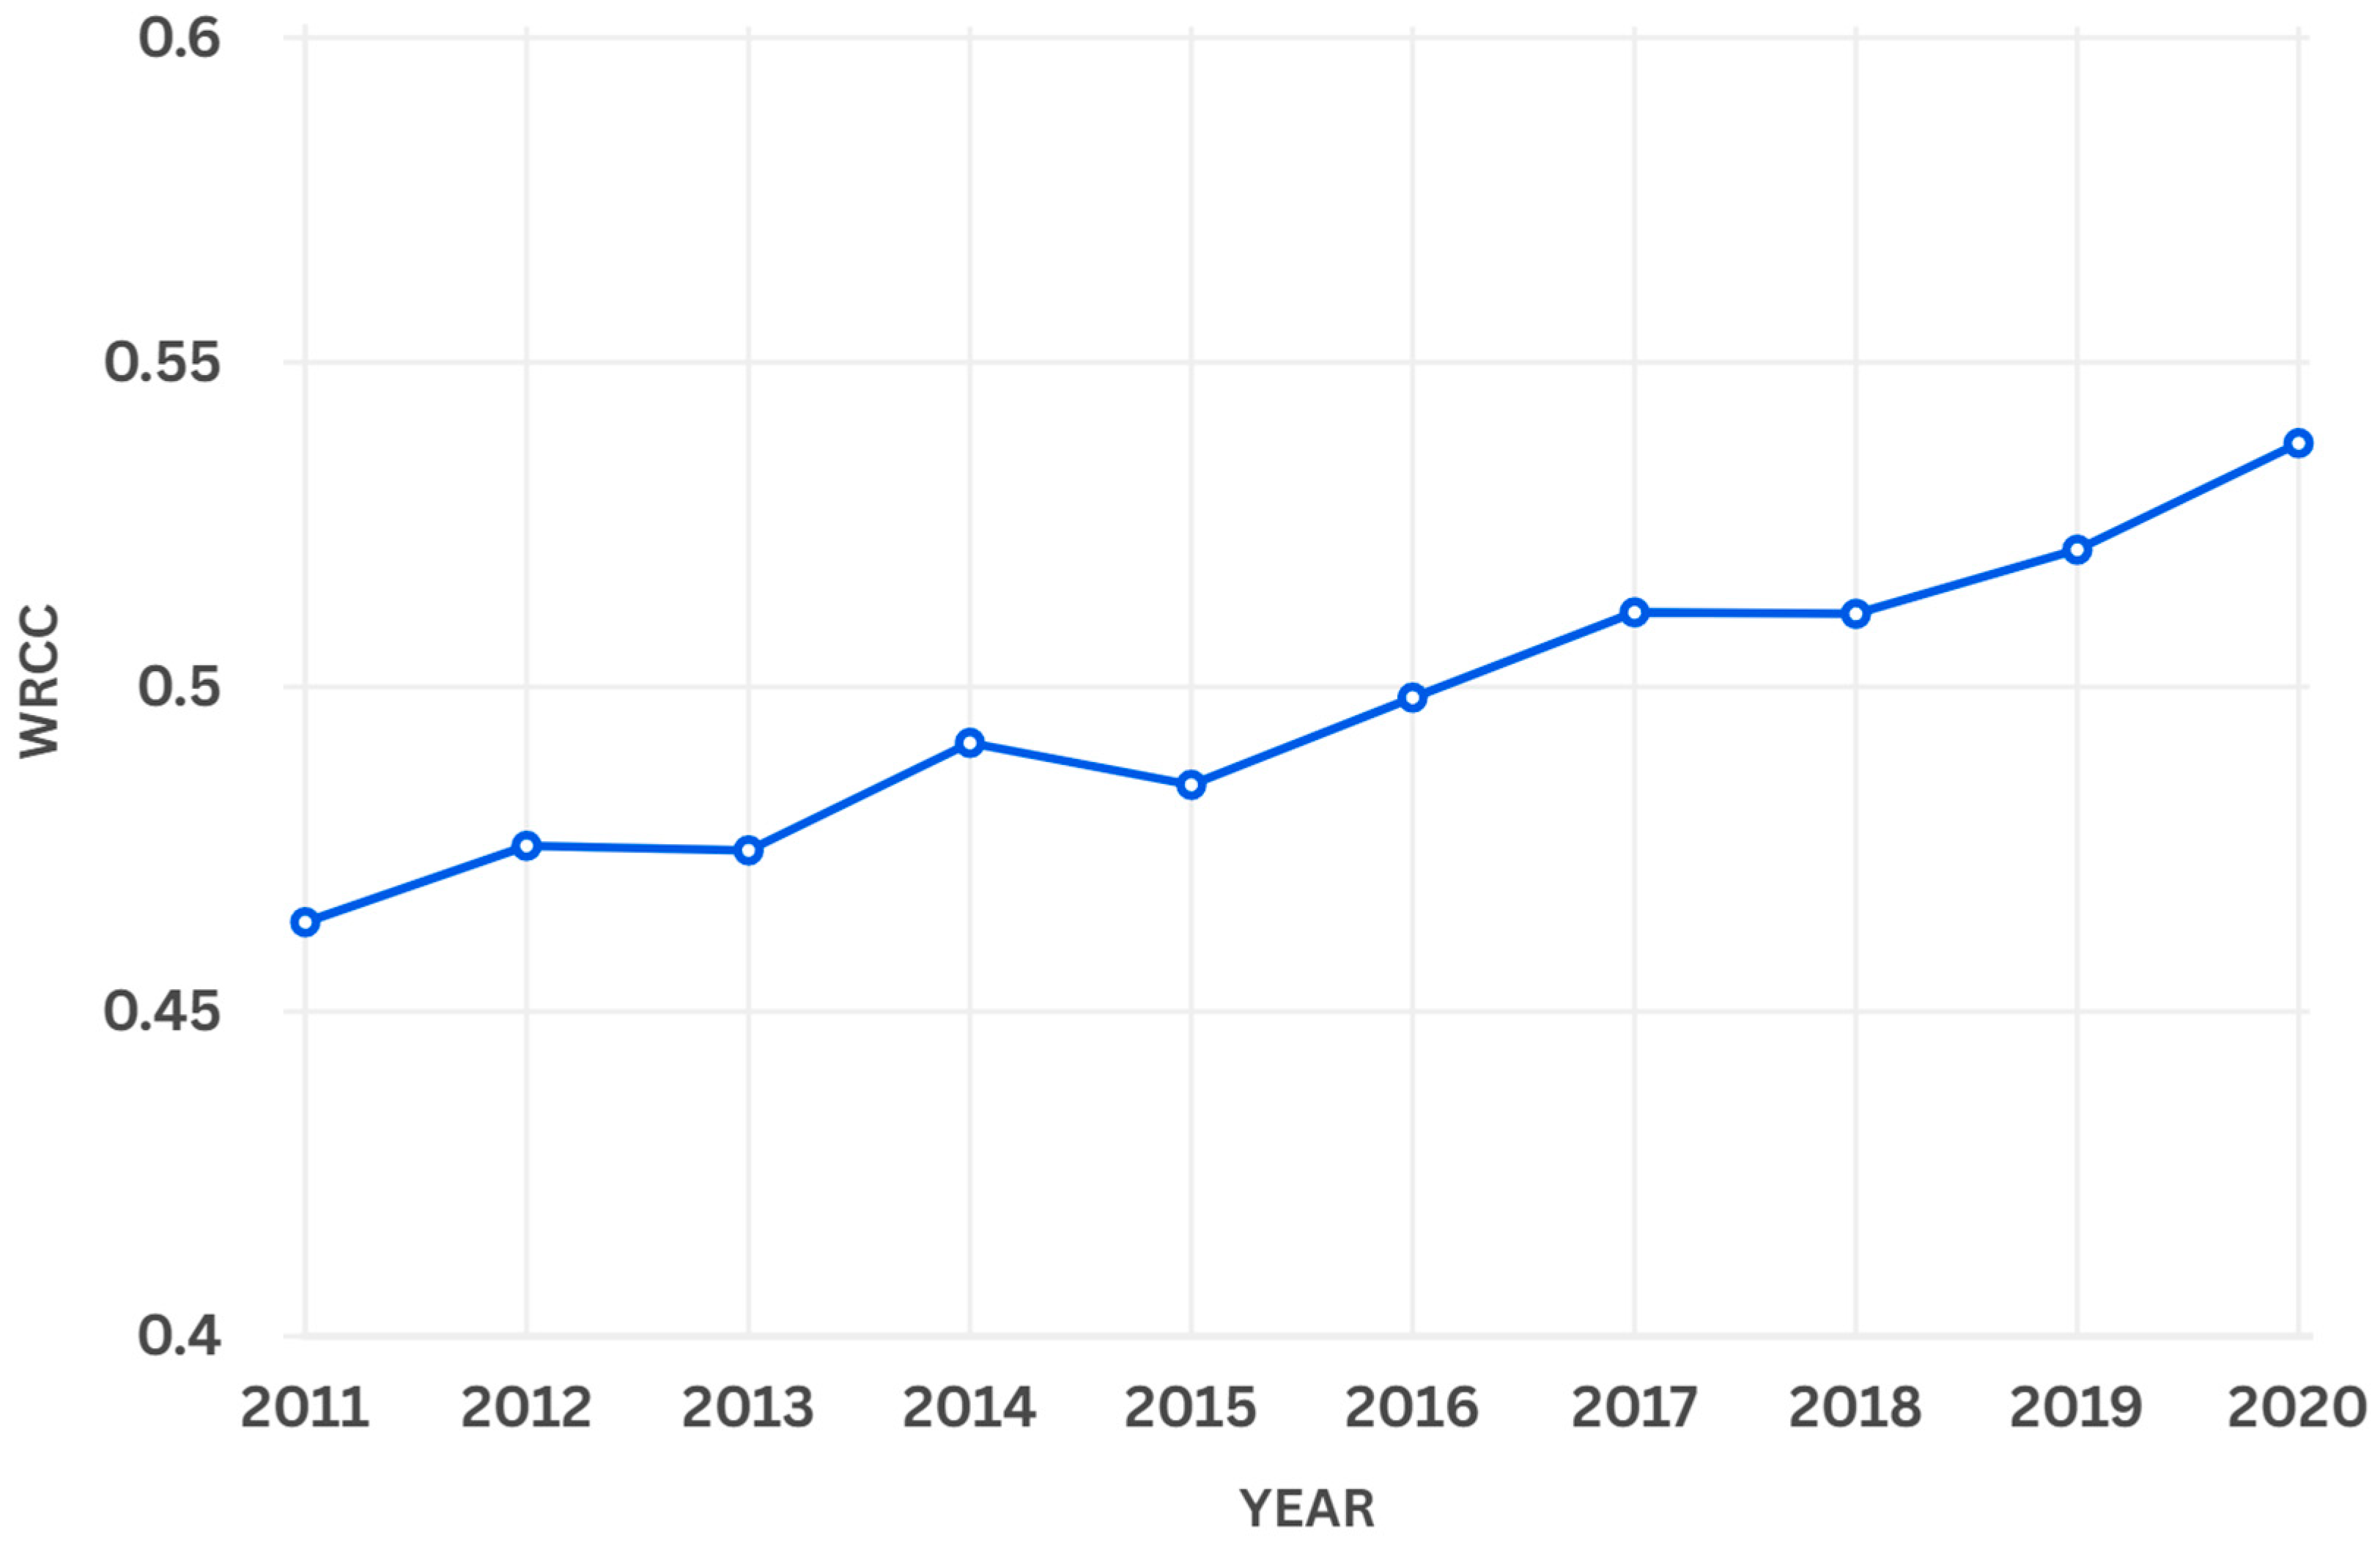
Figure 4 illustrates the variations in WRCC across 28 districts and counties within the Dadu River Basin from 2011 to 2020. In this study, we propose utilizing the multi-year average WRCC for each district and county to facilitate a visual comparison of overall WRCC performance among different regions. Notably, the WRCC for the entire Dadu River Basin increased from 0.46 in 2011 to 0.54 in 2020, indicating a growth of approximately 17%.
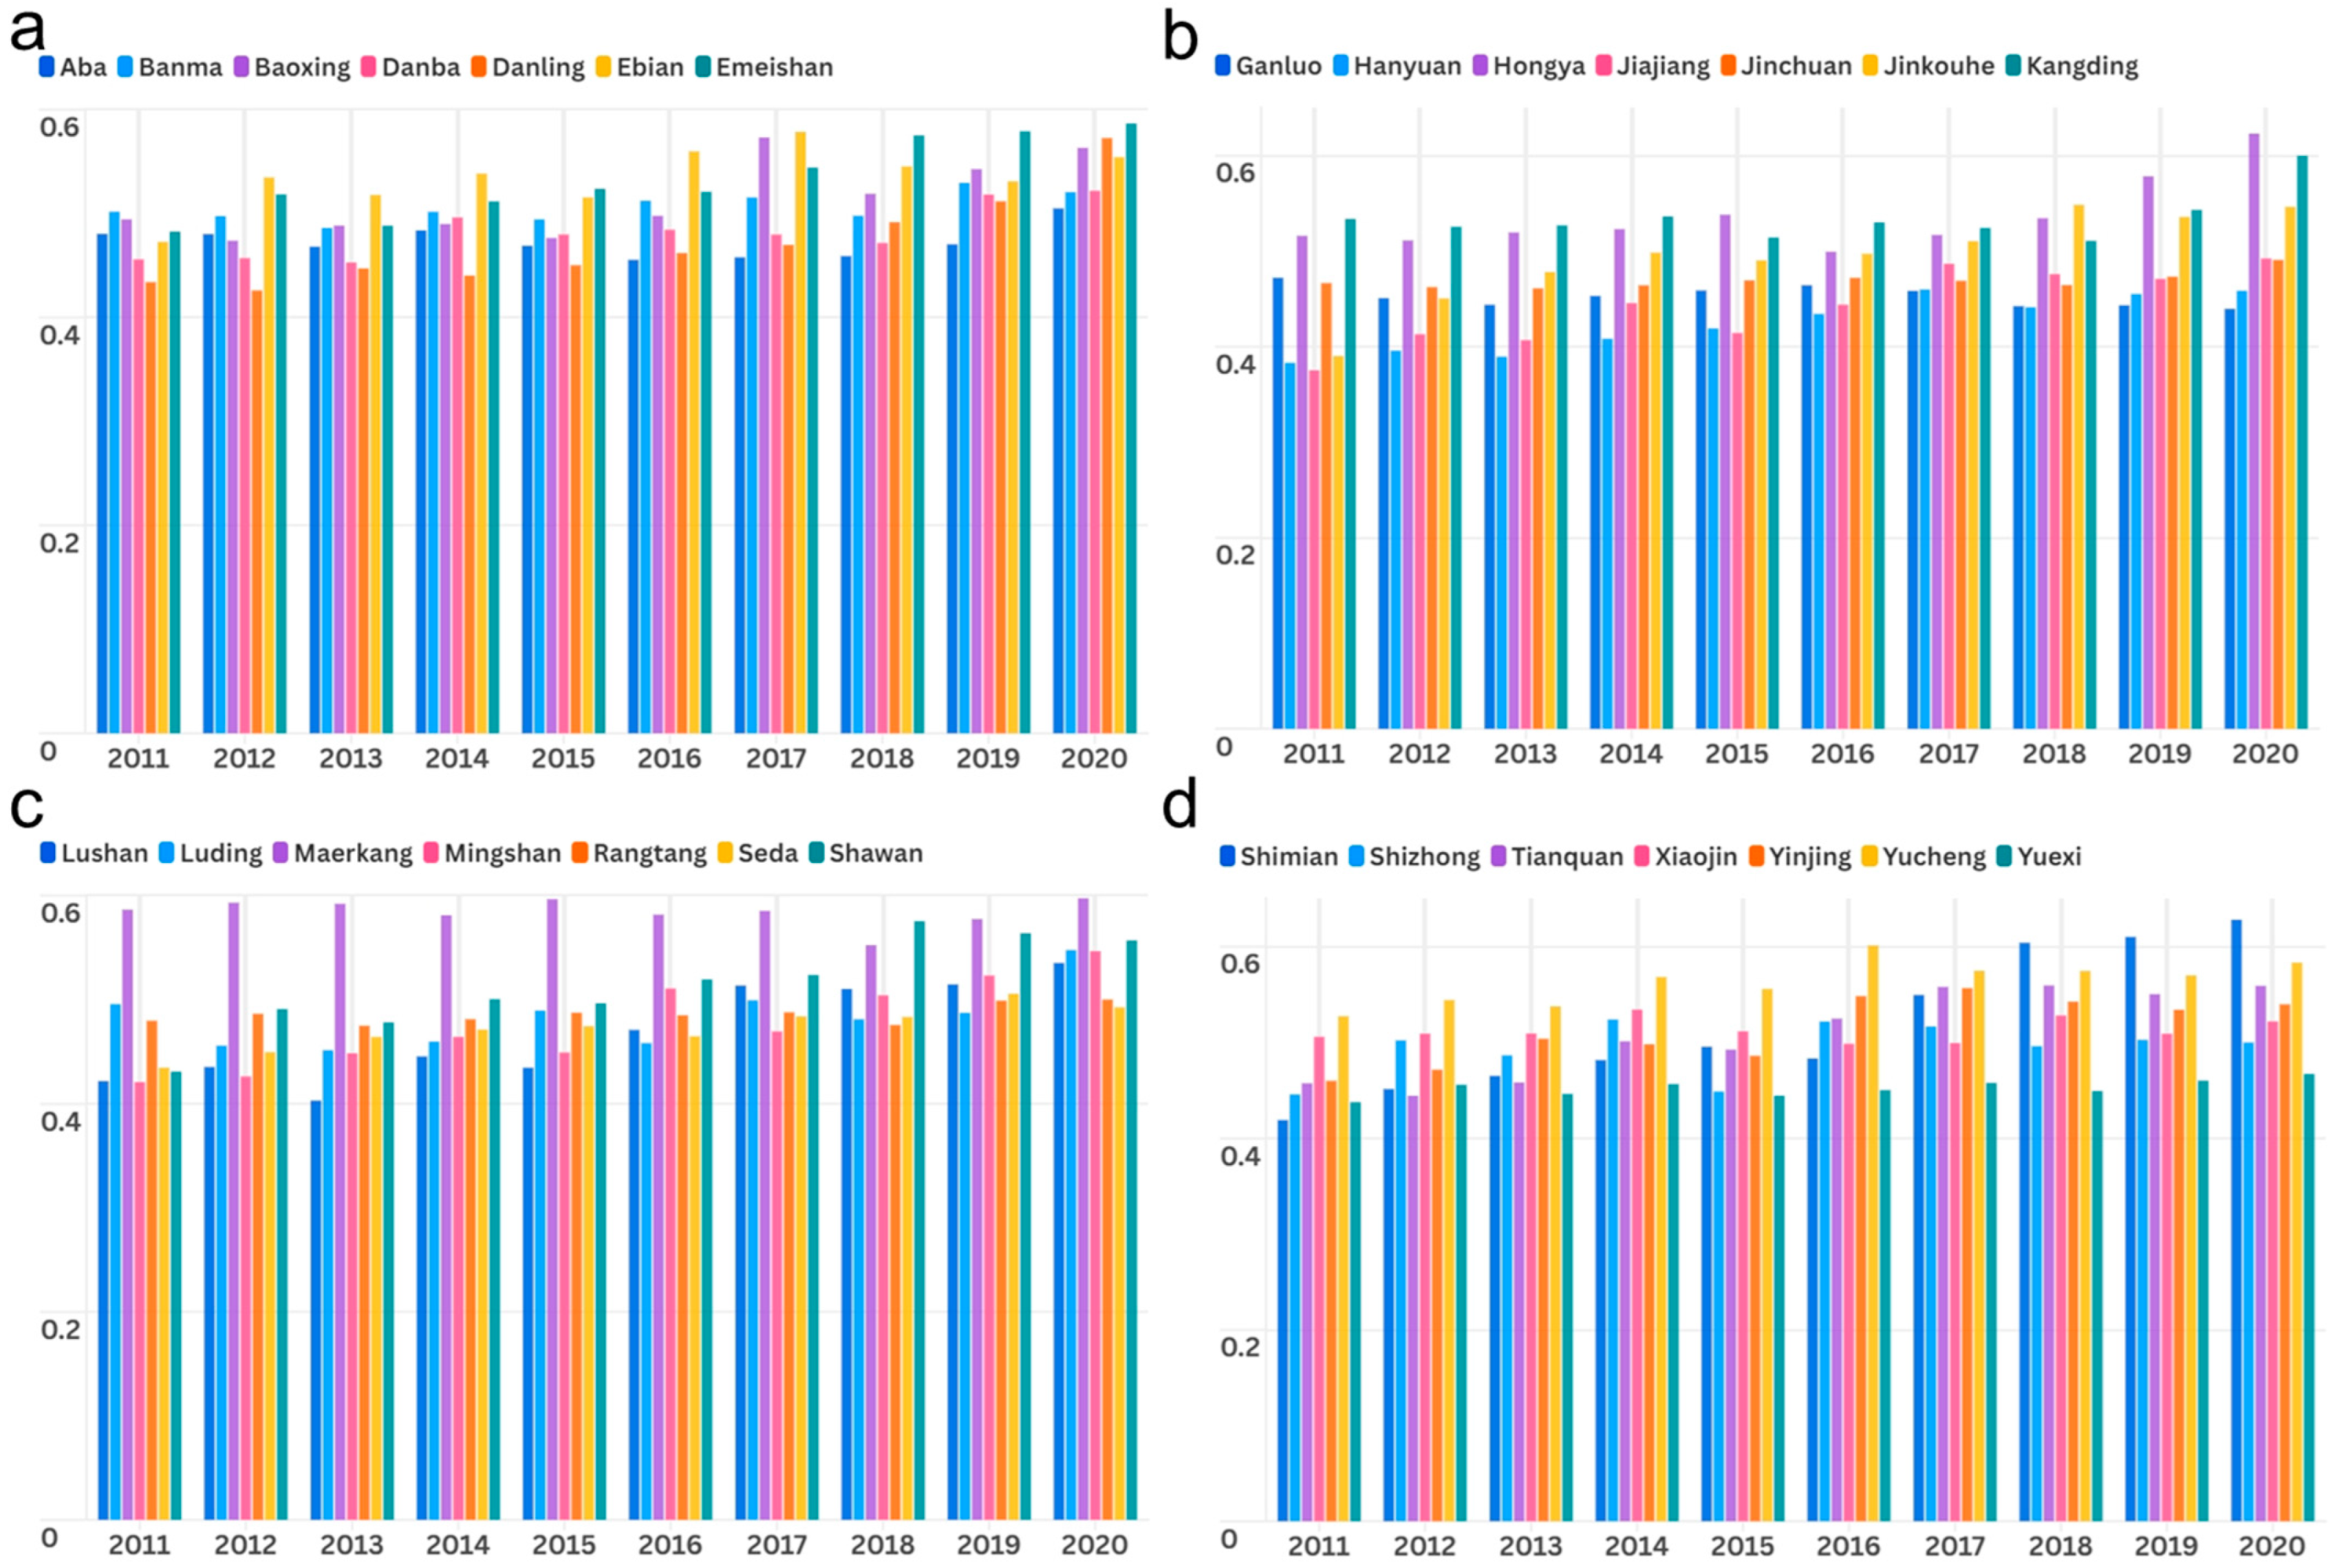
As illustrated in Figure 5, the WRCC values for 28 districts and counties from 2011 to 2020 generally exhibited a fluctuating upward trend. This trend suggests that under environmental protection initiatives such as the safeguarding of the ecological barrier in the upper reaches of the Yangtze River, these cities have made significant strides in both the conservation and utilization of water resources. In terms of growth rates, Shimian, Jinkouhe, and Danling experienced the most rapid increases in WRCC over the past decade, with growth rates of 51.2%, 40%, and 32.5% respectively. Conversely, Ganluo, Aba, and Banma counties recorded the slowest growth during this period. Additionally, while Hongya, Kangding, and Maerkang also demonstrated relatively modest growth rates, these regions have maintained a consistently high level over an extended duration.

4.2. Spatial Characteristics of WRCC

The upper reaches of the Dadu River encompass the Duke River, the Maerke River, and the Suomo River. These tributaries converge at Kerin, forming what is referred to as the Dajin River. Following the incorporation of Danba into Xiaojin, this section was designated as the Dadu River, which also represents its upper reaches. The segment extending from Danba to Hanyuan constitutes the middle reaches, with Hanyuan subsequently flowing into Leshan and merging with the Minjiang River. To gain a deeper understanding of the regional characteristics of WRCC, this study employed a method that involved delineating river sections within the basin for spatial analysis. The WRCC values for each reach—upper, middle, and lower—were derived by calculating average WRCC values across all districts and counties situated within these river segments.
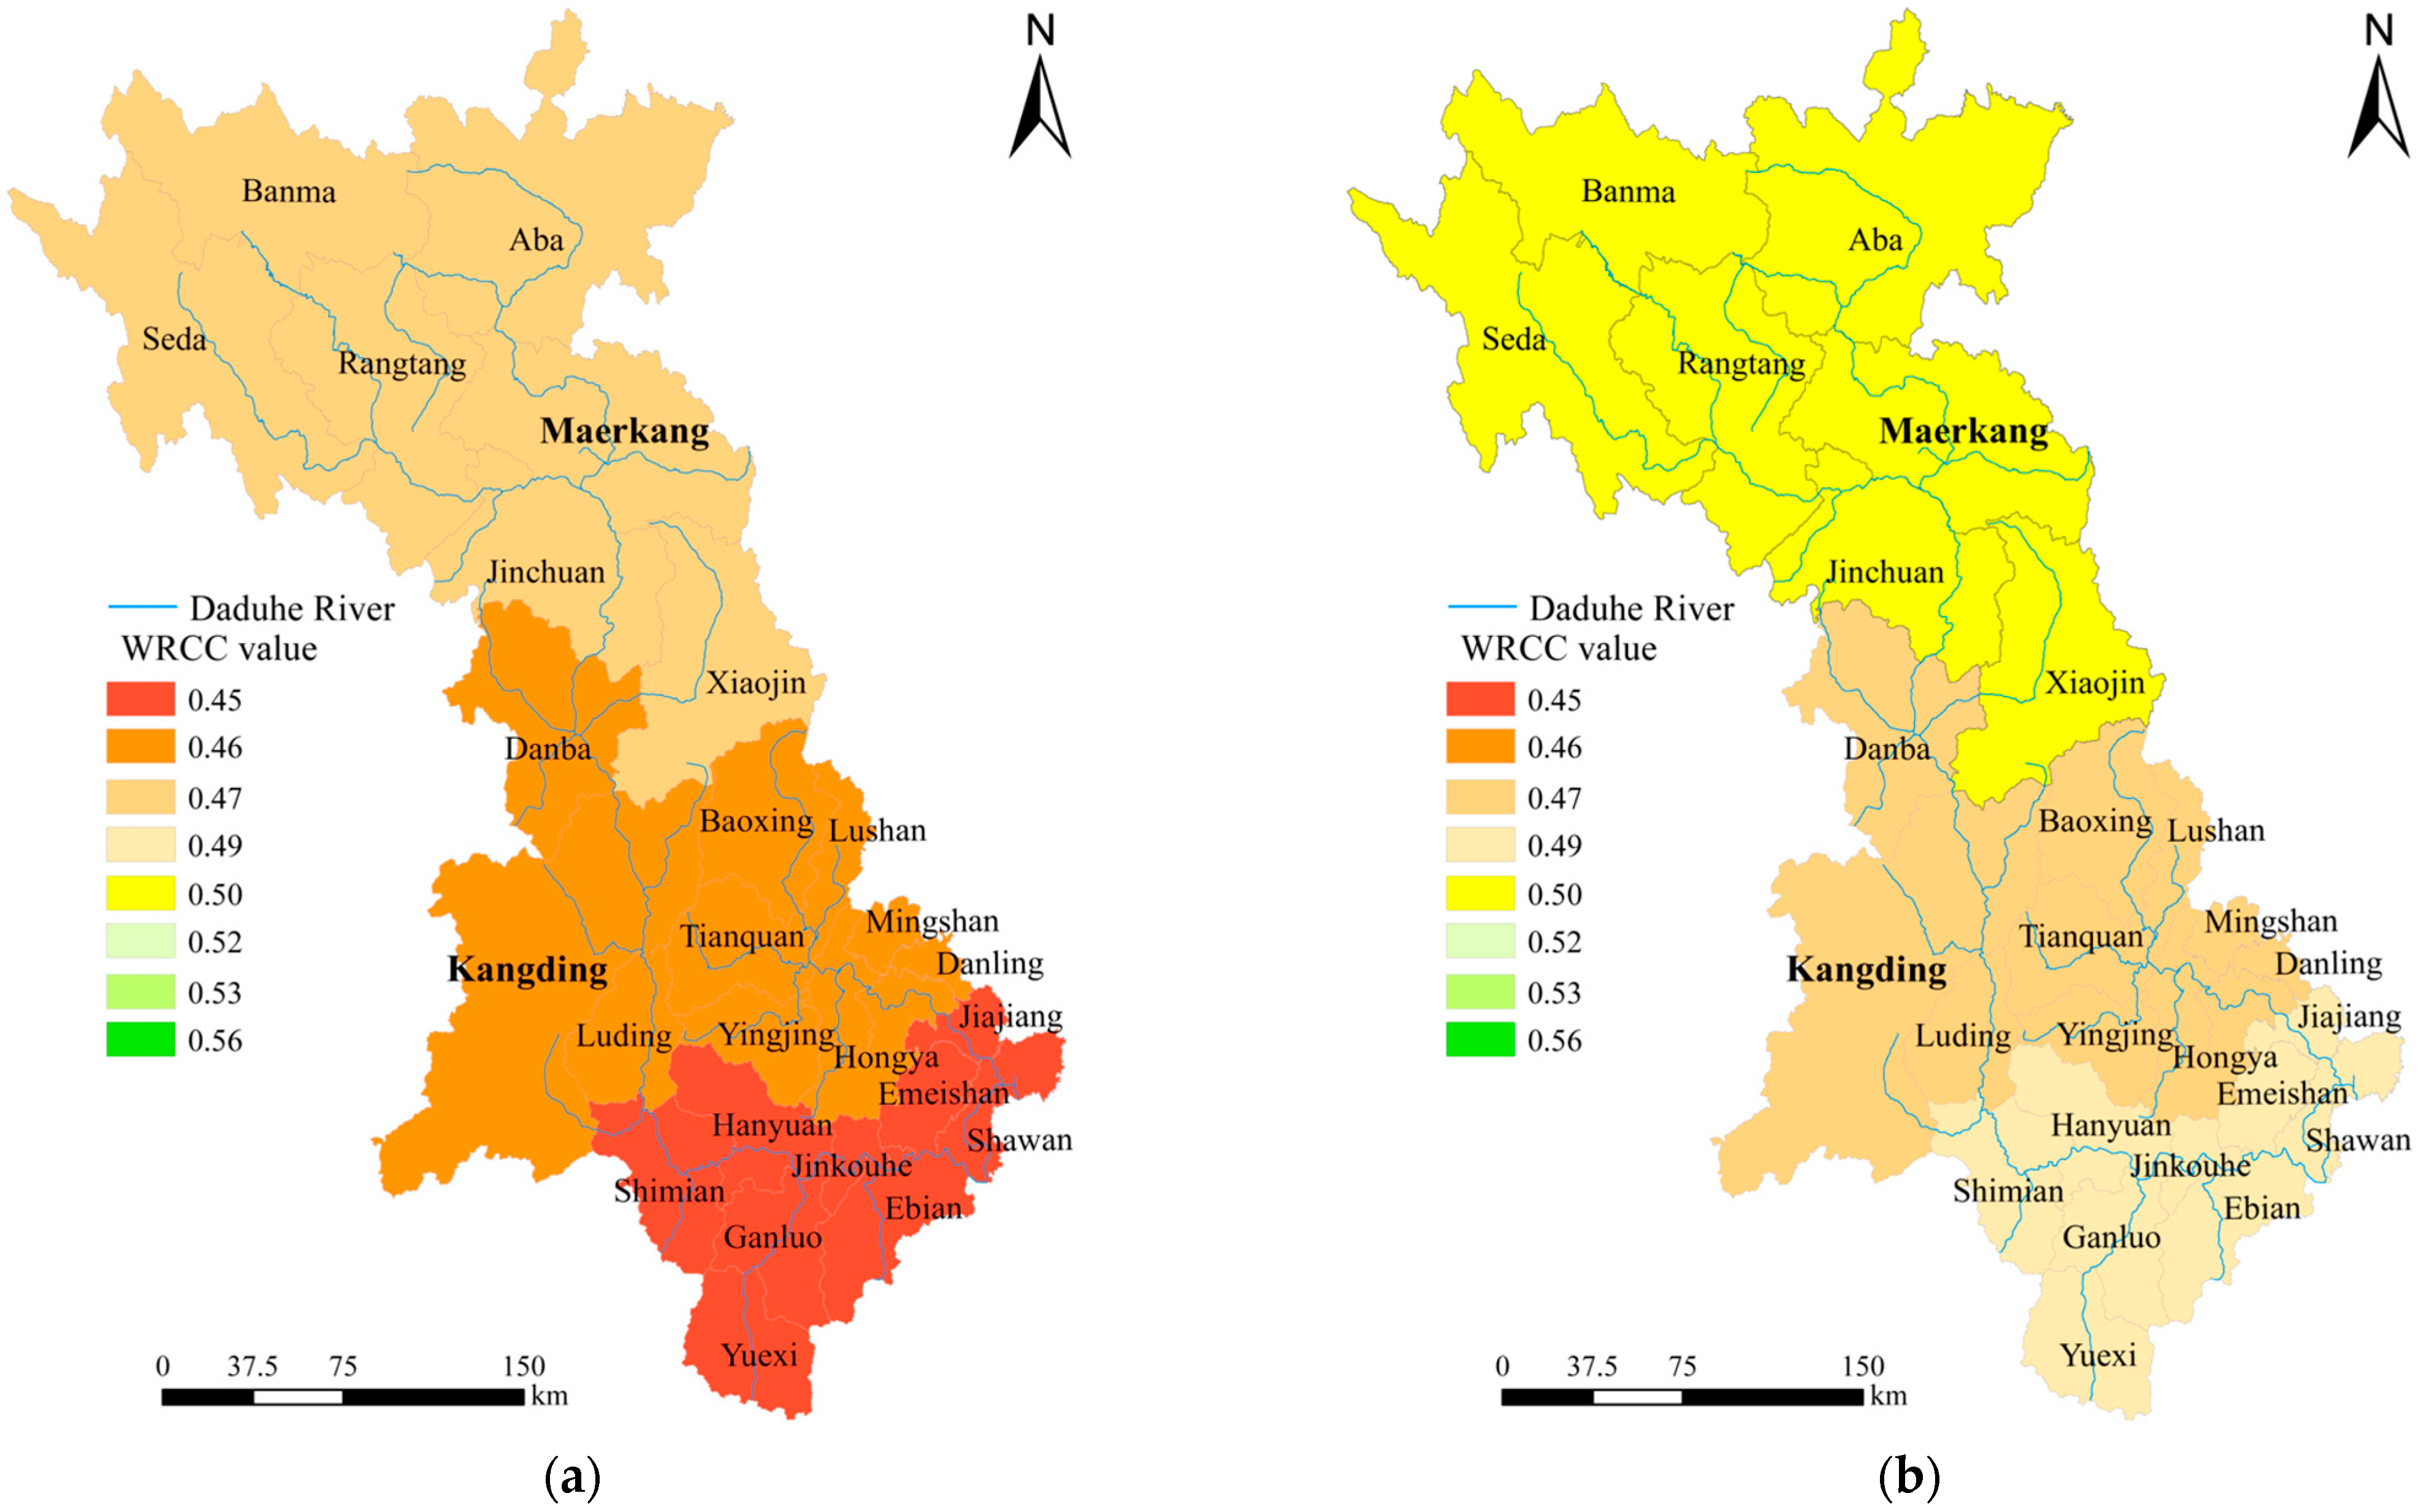
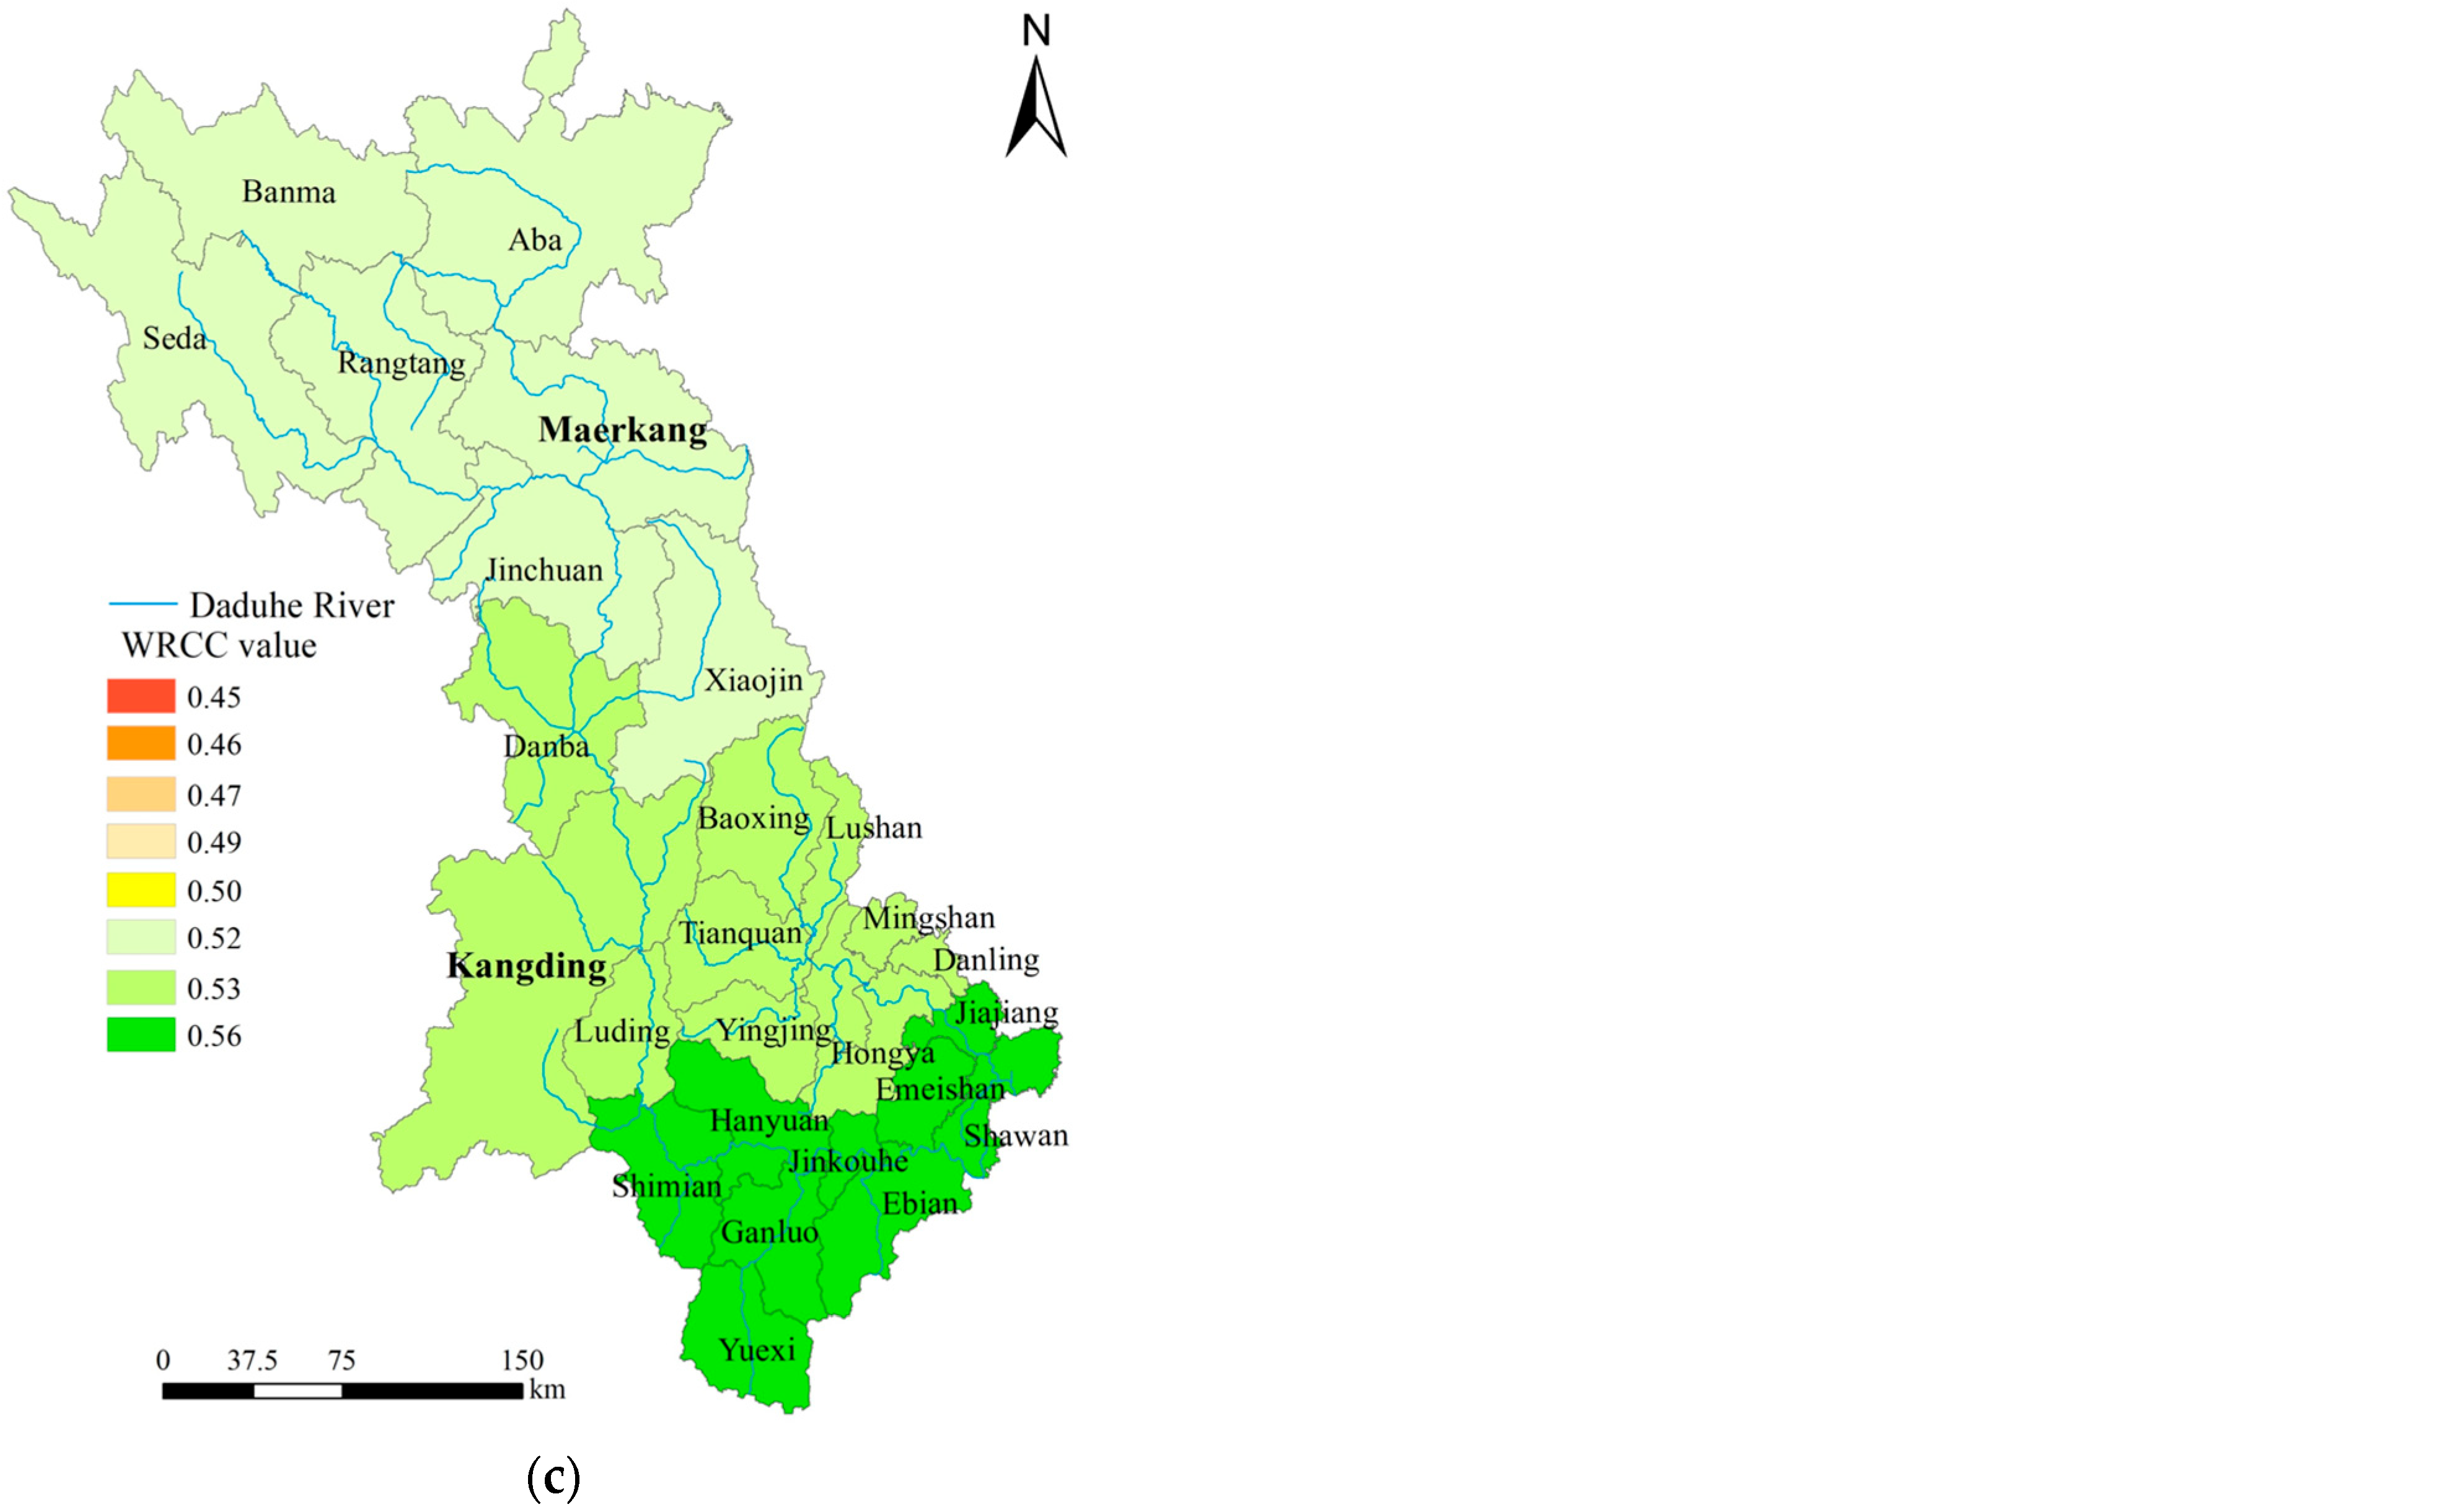
Through statistics, it was found that the WRCC levels in the upper, middle, and lower reaches of the Dadu River Basin are relatively weak. The average annual WRCC level has been increasing year by year, but none of them have reached Grade V, as shown in Figure 6. Firstly, from the perspective of long-term spatial distribution development, Figure 6a illustrates that in 2011, the WRCC levels in the upper reaches of the Dadu River Basin were recorded at 0.49, while those in the middle and lower reaches were 0.46 and 0.45, respectively, all classified as grade III. The upper reaches exhibited significantly better conditions compared to both the middle and lower reaches. Figure 6b indicates that by 2015, WRCC levels across upstream, midstream, and downstream regions remained at grade III with values of 0.50 for upstream, 0.47 for midstream, and 0.49 for downstream areas, respectively. When compared to data from 2011, there was an overall improvement in WRCC levels; furthermore, disparities in spatial distribution began to diminish. In 2020, as depicted in Figure 6c, WRCC values for upstream, midstream, and downstream regions reached figures of 0.52, 0.53, and 0.56, respectively. However, it is noteworthy that both midstream and downstream areas entered a critical state during this period; consequently a gap started to emerge between these regions when contrasted with their upstream counterparts.
From the perspective of spatial distribution, advancements in both economy and technology have led to a continuous increase in the economic growth rate and technological level across various regions. This trend is particularly pronounced in densely populated urban areas located in the lower reaches of river basins, where regional economic development has accelerated significantly. Concurrently, with the implementation of enhanced water-saving measures and progress in scientific research and technology, there has been a consistent decline in water consumption per CNY 10,000 of GDP as well as per CNY 10,000 of industrial added value. Additionally, the urban sewage treatment rate has improved year by year; water conservation initiatives have become increasingly effective; and public awareness regarding water conservation has deepened annually. These factors collectively contribute to the growth of WRCC. Notably, in regions characterized by high urbanization rates, efforts to promote awareness about water conservation have intensified. This shift is also evident through significant changes observed in WRCC metrics. Over the past decade, substantial improvements have been recorded for WRCC specifically within downstream areas.

4.3. The Primary Driving Forces Behind the Development of WRCC

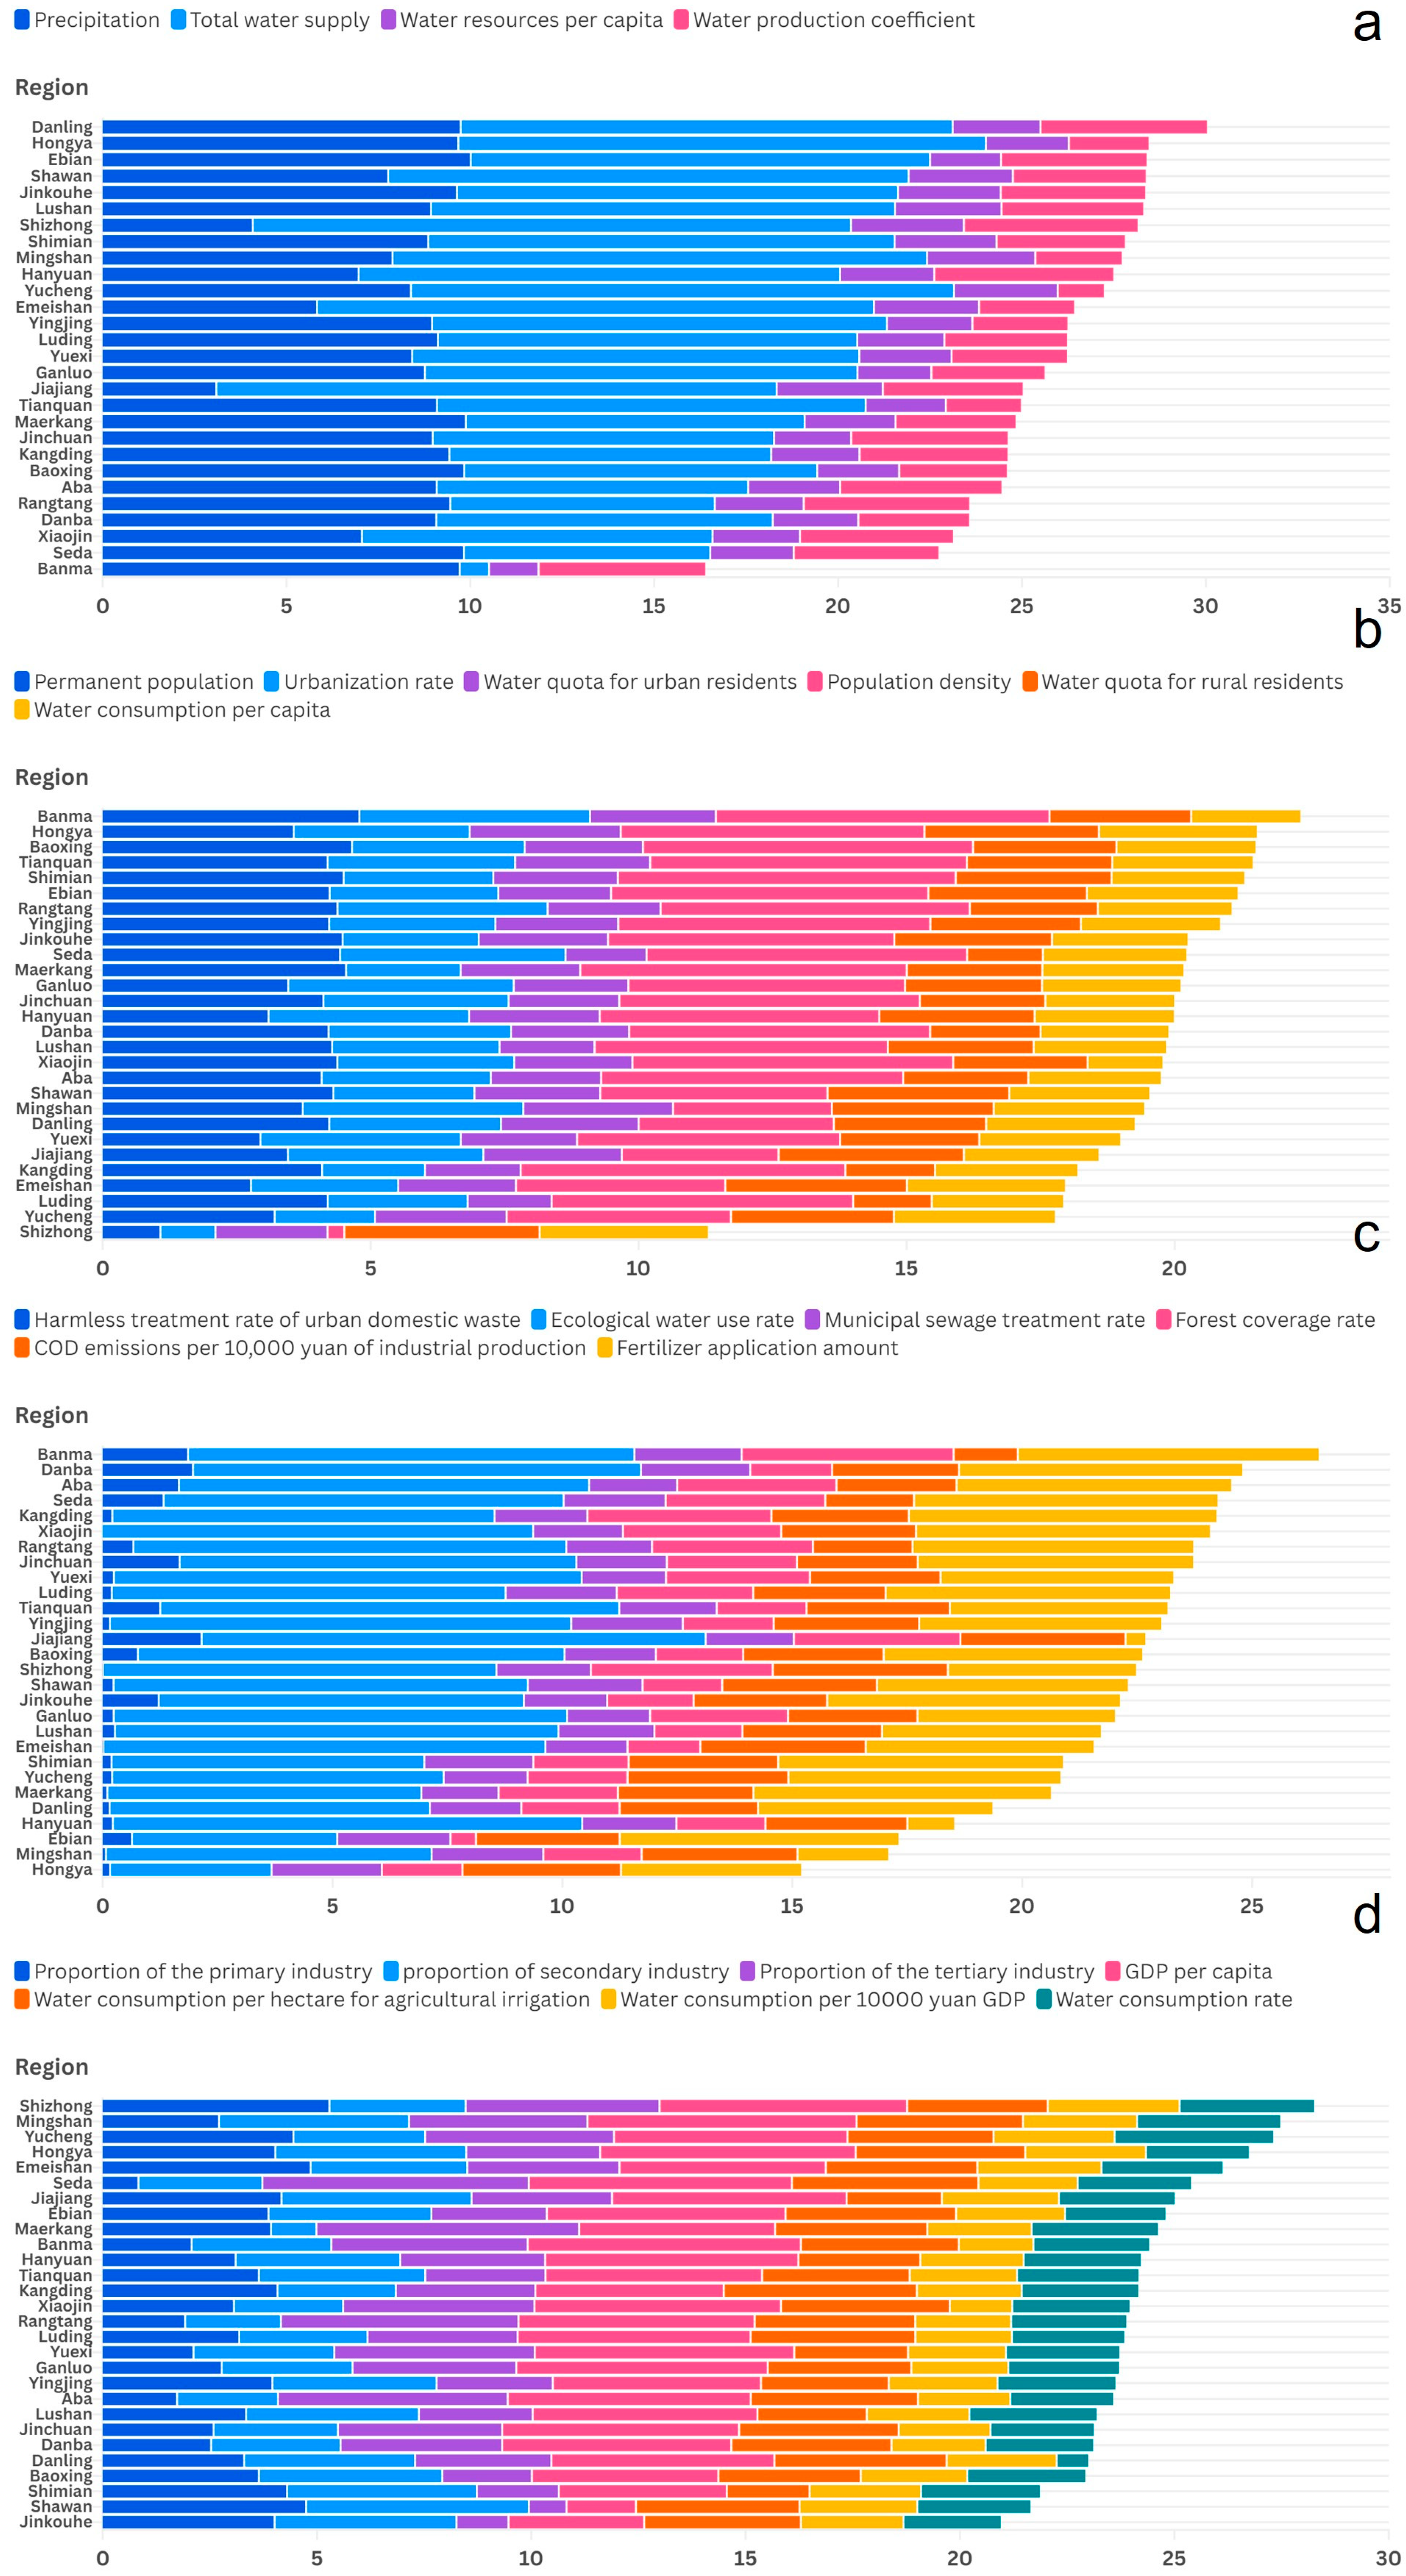
The evolution of various driving forces—specifically, the subsystems related to water resources, society, economy, and ecological environment—in the Dadu River Basin is illustrated in Figure 7. Analyzing the temporal trends from 2011 to 2020 reveals a general decline in the driving intensity of both social and ecological subsystems. In contrast, there has been a slight increase in the pulling intensity associated with water resources and economic subsystems. Additionally, it is noteworthy that the total obstacle degree for each indicator within the water resources subsystem consistently exceeds 30% annually.
From the perspective of spatial differences in the obstacle degree of subsystems, the obstacle degree of the water resource subsystem in the Dadu River Basin generally shows an increasing trend from the upper reaches to the lower reaches of the basin. The total obstacle degree of 19 districts and counties is greater than 30%, among which Danling, Hanyuan, and Shizhong District are more affected, and the obstacle degree of the water resource subsystem is close to 35%. In terms of the social subsystem, the total degree of obstacles in each district and county is similar, among which Banma County has the largest degree (22.3%), and Shizhong District has the smallest degree (11.3%). From the perspective of the economic subsystem, the total degree of obstacles in the lower reaches of the basin is significantly higher than that in the upper reaches. Among them, Mingshan District has the largest degree (31.2%), and Jinkouhe District has the smallest degree (24.2%). The total degree of obstacles in the ecological environment subsystem and the social subsystem of each district and county is similar. Over time, uncertainty associated with water resources has diminished, indicating that its influence on WRCC for each city has begun to stabilize. This stabilization can be attributed primarily to advancements in water usage efficiency and conservation technologies; consequently, natural variability in water resources exerts an increasingly reduced impact on WRCC. For both social and ecological subsystems, uncertainty also appears to gradually decrease—albeit at a lesser rate than observed within the water resource subsystem—suggesting that their driving forces are likewise becoming more concentrated.
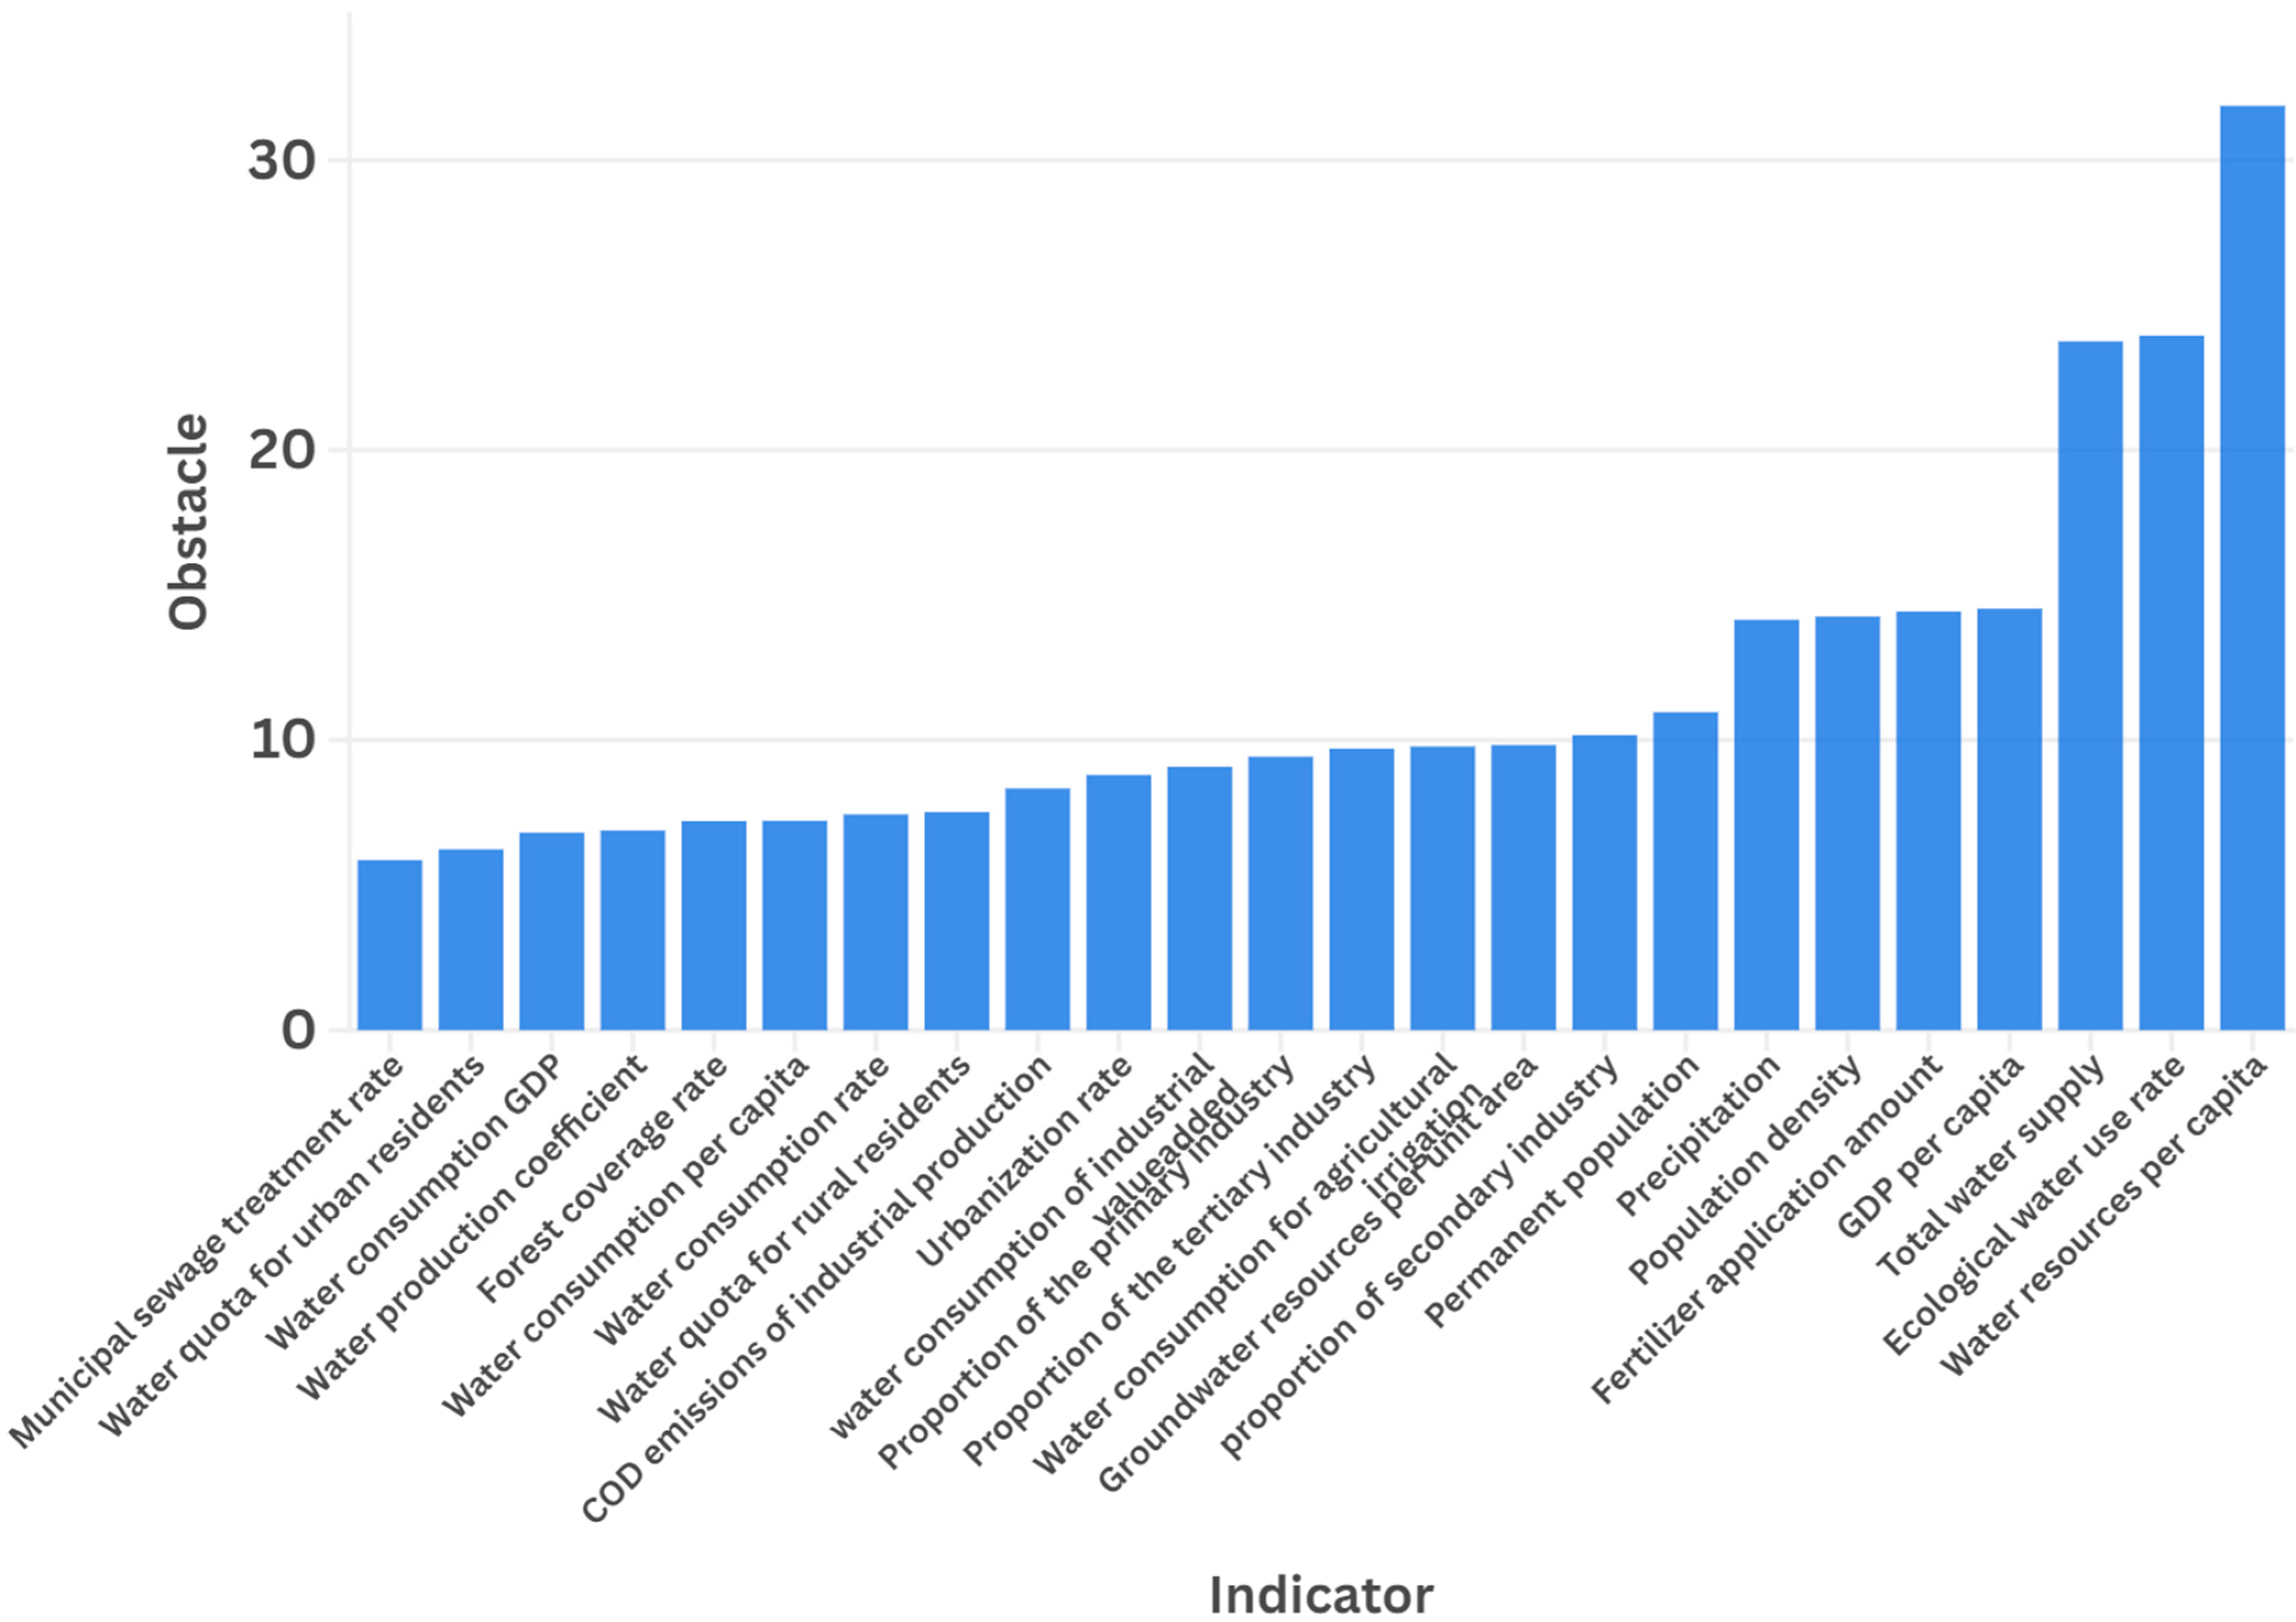
Meanwhile, utilizing Equations (11) and (12), we assessed the obstacle degrees of each index of the WRCC in the Dadu River Basin from 2011 to 2020. From a total of 25 indicators, we identified 7 indicators with relatively high obstacle degrees as the primary obstacles.
Figure 8 illustrates that the primary obstacles to the comprehensive utilization of water resources in the Dadu River Basin from 2011 to 2020 are represented by seven key indicators: (1) per capita water resources, (2) ecological environment water consumption rate, (3) volume of water supply, (4) per capita GDP, (5) fertilizer application volume, (6) population density, and (7) rainfall. Overall, the water resource system has emerged as the most significant indicator layer influencing the enhancement of Water Resource Carrying Capacity in the Dadu River Basin. This underscores the necessity for further optimization in both the development and effective utilization of water resources within this region.

5. Discussion

This study addresses the limitations inherent in traditional research on WRCC, such as the separation of natural and social elements, subjective weight assignment, and a lack of dynamic analysis. It innovatively constructs an index system that integrates the four-dimensional synergy of “water resources–society–economy–ecology” from the perspective of ecological civilization. By incorporating key indicators like the management level of the ecological environment (e.g., urban sewage treatment rate) and water efficiency in economic development (e.g., water consumption per CNY 10,000 of industrial added value), this research rectifies previous oversights regarding management effectiveness and the role of economic intensification. Furthermore, we propose a combined weighting method utilizing CRITIC–entropy weights, which significantly enhances the objectivity of weight calculation. For instance, a sudden drop in rainfall during 2015 resulted in an immediate increase in obstacle degree within the water resources subsystem (Figure 3). This observation validates our model’s sensitivity to extreme climate events and provides methodological support for dynamic early warning systems related to WRCC.

5.1. Discussion on the Development Differences of WRCC Among Counties in the River Basin

The ecological environment protection and green development policies implemented in Sichuan Province during the 12th and 13th Five-Year Plans (2011–2020) have significantly influenced the evolution of WRCC. However, regional responses to these policies exhibit notable disparities. Analysis indicates that intra-regional differences, with a contribution rate exceeding 65%, are primarily responsible for the imbalance observed in WRCC across different areas. The economic heterogeneity present in the lower reaches of the Dadu River Basin starkly contrasts with the ecological advantages found in its upper reaches (Figure 6). This suggests that significant imbalances exist in WRCC development among various regions, particularly pronounced in the lower basin.
In downstream urban agglomerations such as Leshan, where Shizhong District and Wutongqiao District are located, and Ya’an, where Mingshan and Yucheng District are located, during the “13th Five-Year Plan” period (2016–2020), through industrial structure upgrading (the proportion of the tertiary industry increased to 58%) and the improvement of sewage treatment rate (65%→92%), the WRCC approached the threshold of level IV (0.56). However, under high development intensity, the risk of ecological flow encroachment is prominent, and it is necessary to balance the contradiction between supply and demand through the “water-based production” strategy. In contrast, in the upstream ecological barrier areas such as Aba County and Ganluo County, which are constrained by ecological red lines, the growth rate of WRCC is the slowest (0.52). However, the high forest coverage rate (>60%) endows them with the potential of a “green water bank”, and the development levels among the cities in the upstream of the basin are relatively balanced.

5.2. Analysis of the Driving Mechanism for the Development of WRCC

Although the WRCC in the Dadu River Basin increased by 17% (from 0.46 to 0.54) over the past decade, it has remained at a critical Level III state (0.4–0.6), with the core constraint rooted in the imbalance among multiple subsystems. Based on data analysis, the key driving factors for WRCC development in Sichuan Province include the urban sewage treatment rate, the proportion of the tertiary industry, and per capita GDP. Moreover, regional disparities exist in the development levels of individual subsystems. Specifically, regarding the water resources subsystem, both per capita water availability (with an obstacle degree >30%) and the ecological environment water use ratio are low, reflecting the dual pressures of insufficient total water resources and the encroachment upon ecological base flows. This situation is particularly evident in economically developed downstream areas such as Leshan and Ya’an, where water-saving technologies have reduced industrial water consumption. However, rapid urbanization has caused a significant rise in domestic water demand (annual growth rate of 3.2%), which partially offsets the benefits of water conservation. From the perspective of the ecological environment subsystem, fertilizer application exhibits an obstacle degree exceeding 25%, highlighting the latent threat of agricultural non-point source pollution to water quality. Regarding the socio-economic subsystem, economic growth and population concentration—reflected in a 12% obstacle degree for permanent resident density—indirectly intensify system vulnerability through rising water demand and pollutant emissions. These findings suggest that technological optimization alone cannot overcome the constraints imposed by limited resource availability.

5.3. Analysis of Driving Force Transformation

Research has found that the main driving force for the development of WRCC in the Dadu River Basin has shifted from social and economic development to economic and ecological environment development, which also reflects the transformation of people’s material demands for a better life to cultural and spiritual demands. The transformation process can be understood as follows: In the early stage, social and economic development relied more on the consumption of resources and ecological occupation. Subsequently, the further development of the economy continues to drive social and technological progress. Its positive role can effectively promote the rational utilization of resources and the protection of the ecological environment, thereby enhancing the comprehensive level of WRCC. This evolution is indicative of the achievements realized through industrial structural transformations and ecological policies implemented during Sichuan Province’s “12th Five-Year Plan” and “13th Five-Year Plan” periods. Underpinned by robust economic advancement, there has been a consistent improvement in ecological carrying capacity, with an increasingly prominent impetus for ecological development emerging. Currently, economic and ecological development have emerged as the primary drivers for the enhancement of WRCC.

5.4. Policy Recommendations

The research findings indicate that the WRCC in the Dadu River Basin exhibits distinct spatio-temporal distribution patterns. Accordingly, each region should closely integrate its unique economic development features with its natural resource endowments to effectively address current shortcomings. Specifically, in the upstream areas with dense populations and high pollutant emissions, efforts should be made to enhance water conservation awareness, take into account water resources and environmental protection, incorporate ecological flow into the rigid constraints of urban planning, and promote the coordinated development of the economy and ecology. Secondly, it is necessary to enhance remote cooperation among regions with different social and economic conditions and water resource endowments, establish a collaborative governance framework of “agricultural non-point source chain governance” (precise fertilization–organic substitution–carbon sink trading) and “water rights trading market”, and form a complementary and coordinated development trend. Thirdly, an ecological protection barrier should be established to strengthen ecosystem conservation in the Dadu River Basin. In the downstream region, a zonal management system should be implemented based on the classification of “red, yellow, and green” zones. In the upstream area, a comprehensive development model integrating national parks, ecological compensation mechanisms, and green industries should be explored. The “Dadu River Green Corridor” should be constructed to promote coordinated ecological protection of key water sources, and the development of ecological function zones focusing on biodiversity conservation should be advanced, ultimately achieving green, coordinated, and sustainable development.
Through research, it is observed that the weight results calculated using the CRITIC–entropy combined weighting method do not exhibit the issue of certain indicators having disproportionately high weights or all indicators having excessively uniform weights. This approach effectively addresses the problem of overlapping indicator information and enhances the rationality and reliability of the evaluation outcomes. Furthermore, through driving factor analysis, specific indicators influencing the WRCC in the Dadu River Basin were identified. The subsequent research will be conducted from two perspectives. The first aspect involves a deeper investigation into the critical mutation mechanism of WRCC within the 0.58–0.62 interval, aiming to explore the triggering conditions and regulatory strategies associated with threshold transitions. The second aspect focuses on integrating the combined effects of climate change (specifically, extreme drought) and carbon neutrality goals (such as hydropower development) to enhance both the dynamic prediction capabilities and adaptability of the model.

6. Conclusions

This study establishes a comprehensive evaluation index system comprising four key dimensions: water resources, societal factors, economic development, and the ecological environment. The entropy weight–CRITIC combined weighting method was employed to assess the WRCC of 28 districts and counties within the basin. Furthermore, the obstacle degree model is applied to identify the primary factors influencing WRCC. Based on the findings, targeted recommendations are proposed to enhance the WRCC of the Dadu River Basin. The main conclusions are summarized as follows:
(1)
From a temporal perspective, the WRCC in the Dadu River Basin exhibited a generally fluctuating upward trend from 2011 to 2020. While interannual variations remained relatively stable, disparities among districts and counties began to widen over time.
(2)
From a spatial perspective, the disparities in WRCC among districts and counties become increasingly pronounced from the upstream to the downstream regions. The downstream area (0.56) approaches level IV due to economic agglomeration and technological advancements; conversely, upstream areas (0.52) face constraints stemming from conflicts between ecological protection and resource development, resulting in a dual pattern characterized by “catching up–lagging.”
(3)
In terms of specific indicators, per capita water resources, ecological environmental water consumption rate, total water supply volume, per capita GDP, fertilizer application volume, and rainfall emerge as primary obstacles affecting WRCC within the Dadu River Basin. Analyzing subsystems reveals that water resources constitute the principal constraint on advancing WRCC in this region.
(4)
Based on the research findings, formulate actionable policy recommendations. Firstly, the upstream area explores a comprehensive regional development model, while the downstream area implements a zonal management system. At the same time, enhance the water conservation awareness of residents within the basin. Secondly, based on the differences in economic conditions and water resource endowments, strengthen remote cooperation among regions to form a complementary and coordinated development model. Thirdly, we should strengthen the protection of the ecosystem in the Dadu River Basin to achieve green, coordinated, and sustainable development.
This study provides a scientific foundation for implementing the “ecological priority” strategy in the Yangtze River Economic Belt, and presents a Chinese approach to addressing the globally prevalent “protection versus development” dilemma in resource river basins.

Author Contributions

L.H. and S.L.; software, L.H. and Y.W.; validation, Y.W., W.L. and X.C.; formal analysis, L.H. and Y.W.; investigation, L.H., Y.W. and X.C.; resources, L.H.; data curation, L.H. and Y.W.; writing—original draft preparation, L.H.; writing—review and editing, L.H., S.L. and W.L.; visualization, L.H. and X.C.; supervision, W.L.; project administration, L.H., S.L. and W.L.; funding acquisition, L.H., S.L. and W.L. All authors have read and agreed to the published version of the manuscript.

Funding

This research was funded by Southwest Mountain Natural Resources Remote Sensing Monitoring Engineering Technology Innovation Center open project Fund of Ministry of Natural Resources, grant number RSMNRSCM-2024-007.

Data Availability Statement

Data derived from public domain resources.

Conflicts of Interest

The authors declare no conflicts of interest.

Abbreviations

The following abbreviations are used in this manuscript:
WRCCWater Resource Carrying Capacity

References

  1. Vairavamoorthy, K.; Gorantiwar, S.D.; Pathirana, A. Managing urban water supplies in developing countries—Climate change and water scarcity scenarios. Phys. Chem. Earth 2008, 33, 330–339. [Google Scholar] [CrossRef]
  2. Dong, H.J.; Geng, Y.; Fujita, T. Uncovering regional disparity of China’s water footprint and inter-provincial virtual water flows. Sci. Total Environ. 2014, 500–501, 120–130. [Google Scholar] [CrossRef] [PubMed]
  3. Li, J.W.; Liu, Z.F.; He, C.Y. Water shortages raised a legitimate concern over the sustainable development of the drylands of northern China: Evidence from the water stress index. Sci. Total Environ. 2017, 590–591, 739–750. [Google Scholar] [CrossRef] [PubMed]
  4. Ma, T.; Sun, S.; Fu, G.T. Pollution exacerbates China’s water scarcity and its regional inequality. Nat. Commut. 2020, 11, 650. [Google Scholar] [CrossRef] [PubMed]
  5. Ostad-Ali-Askari, K. Developing an optimal design model of furrow irrigation based on the minimum cost and maximum irrigation efficiency. Appl. Water. Sci. 2022, 12, 144. [Google Scholar] [CrossRef]
  6. Ostad-Ali-Askari, K. Investigation of meteorological variables on runoff archetypal using SWAT: Basic concepts and fundamentals. Appl. Water. Sci. 2022, 12, 177. [Google Scholar] [CrossRef]
  7. Ostad-Ali-Askari, K. Management of risks substances and sustainable development. Appl. Water. Sci 2022, 12, 65. [Google Scholar] [CrossRef]
  8. Khorsandi, M.; Homayouni, S.; van Oel, P. The edge of the petri dish for a nation: Water resources carrying capacity assessment for Iran. Sci. Total Environ. 2022, 817, 153038. [Google Scholar] [CrossRef]
  9. Magri, A.; Berezowska-Azzag, E. New tool for assessing urban water carrying capacity (WCC) in the planning of development programs in the region of Oran, Algeria. Sustain. Cities Soc. 2019, 48, 101316. [Google Scholar] [CrossRef]
  10. Yang, H.Y.; Tan, Y.A.; Sun, X.B.; Cheng, X.W.; Liu, G.Q.; Zhou, G.Y. Comprehensive evaluation of water resources carrying capacity and analysis of obstacle factors in Weifang City based on hierarchical cluster analysis-VIKOR method. Environ. Sci Pollut. Res. 2021, 28, 50388–50404. [Google Scholar] [CrossRef]
  11. Costa Freitas, M.B.; Xavier, A.; Fragoso, R. A composite indicator to measure sustainable water use in Portugal: A compromise programming approach. J. Environ. Manag. 2022, 311, 114791. [Google Scholar] [CrossRef] [PubMed]
  12. Dehghani, S.; Massah Bavani, A.R.; Roozbahani, A. Towards an integrated system modeling of water scarcity with projected changes in climate and socioeconomic conditions. Sustain. Prod. Consum. 2022, 33, 543–556. [Google Scholar] [CrossRef]
  13. Naimi-Ait-Aoudiaa, M.; Berezowska-Azzaga, E. Algiers carrying capacity with respect to per capita domestic water use. Sustain. Cities Soc. 2014, 13, 1–11. [Google Scholar] [CrossRef]
  14. Peng, T.; Deng, H.W. Comprehensive evaluation on water resource carrying capacity based on DPESBR framework: A case study in Guiyang, southwest China. J. Clean. Prod. 2020, 268, 122235. [Google Scholar] [CrossRef]
  15. Yang, Z.Y.; Song, J.X.; Cheng, D.D. Comprehensive evaluation and scenario simulation for the water resources carrying capacity in Xi’an city, China. Environ. Manag. 2019, 230, 221–233. [Google Scholar] [CrossRef]
  16. Zhao, Y.; Wang, Y.Y.; Wang, Y. Comprehensive evaluation and influencing factors of urban agglomeration water resources carrying capacity. Clean. Prod. 2021, 288, 125097. [Google Scholar] [CrossRef]
  17. Peng, T.; Deng, H.W.; Lin, Y. Assessment on water resources carrying capacity in karst areas by using an innovative DPESBRM concept model and cloud model. Sci. Total Environ. 2021, 767, 144353. [Google Scholar] [CrossRef]
  18. Wang, T.Z.; Jian, S.Q.; Wang, J.Y. Dynamic interaction of water–economic–social–ecological environment complex system under the framework of water resources carrying capacity. Clean. Prod. 2022, 368, 133132. [Google Scholar] [CrossRef]
  19. Chen, Y.; Chen, A.T.; Zhang, D.N. Evaluation of resources and environmental carrying capacity and its spatial-temporal dynamic evolution: A case study in Shandong Province, China. Sustain. Cities Soc. 2022, 82, 103916. [Google Scholar] [CrossRef]
  20. Zhang, Z.; Hu, B.; Qiu, H. Comprehensive evaluation of resource and environmental carrying capacity based on SDGs perspective and Three-dimensional Balance Model. Ecol. Indic. 2022, 138, 108788. [Google Scholar] [CrossRef]
  21. Shen, L.Y.; Shu, T.H.; Liao, X. A new method to evaluate urban resources environment carrying capacity from the load-and-carrier perspective. Resour. Conserv. Recycl. 2020, 154, 104616. [Google Scholar] [CrossRef]
  22. Zhang, F.; Wang, Y.; Ma, X.J.; Wang, Y.; Yang, G.; Zhu, L. Evaluation of resources and environmental carrying capacity of 36 large cities in China based on a support-pressure coupling mechanism. Sci. Total Environ. 2019, 688, 838–854. [Google Scholar] [CrossRef] [PubMed]
  23. Naimi-Ait-Aoudia, M.; Berezowska-Azzag, E. Water resources carrying capacity assessment: The case of Algeria’s capital city. Habitat Int. 2016, 58, 51–58. [Google Scholar] [CrossRef]
  24. Fu, J.Y.; Zang, C.F.; Zhang, J.M. Economic and resource and environmental carrying capacity trade-off analysis in the Haihe River basin in China. J. Clean. Prod. 2020, 270, 122271. [Google Scholar] [CrossRef]
  25. Wang, X.Y.; Liu, L.; Zhang, S.L. Dynamic simulation and comprehensive evaluation of the water resources carrying capacity in Guangzhou city, China. Ecol. Indicat. 2022, 135, 108528. [Google Scholar] [CrossRef]
  26. Zhang, Z.; Lu, W.X.; Zhao, Y.; Song, W.B. Development tendency analysis and evaluation of the water ecological carrying capacity in the Siping area of Jilin Province in China based on system dynamics and analytic hierarchy process. Ecol. Model. 2014, 275, 9–21. [Google Scholar] [CrossRef]
  27. Zhang, J.T.; Dong, Z.C. Assessment of coupling coordination degree and water resources carrying capacity of Hebei Province (China) based on WRESP2D2P framework and GTWR approach. Sustain. Cities Soc. 2022, 82, 103862. [Google Scholar] [CrossRef]
  28. Peng, B.H.; Li, Y.; Elahi, E. Dynamic evolution of ecological carrying capacity based on the ecological footprint theory: A case study of Jiangsu province. Ecol. Indicat. 2019, 99, 19–26. [Google Scholar] [CrossRef]
  29. Wu, X.L.; Hu, F. Analysis of ecological carrying capacity using a fuzzy comprehensive evaluation method. Ecol. Indicat. 2020, 113, 106243. [Google Scholar] [CrossRef]
  30. Shen, J.; Nie, Y.; Huang, X.; Ma, M. Comprehensive assessment of water resource carrying capacity based on improved matter–element extension modeling. Water 2025, 17, 1197. [Google Scholar] [CrossRef]
  31. Su, Y.; Xu, X.; Dai, M. A Comprehensive Evaluation of Water Resource Carrying Capacity Based on the Optimized Projection Pursuit Regression Model: A Case Study from China. Water 2024, 16, 2650. [Google Scholar] [CrossRef]
  32. Lan, Y.; Zheng, W.; He, L.; Wang, D.; Wang, J.; Wu, C.; Wu, X. Study on the Spatiotemporal Evolution and Driving Factors of Water Resource Carrying Capacity in Typical Arid Regions. Water 2024, 16, 2142. [Google Scholar] [CrossRef]
  33. Wu, C.; Zhou, L.; Jin, J.; Ning, S.; Zhang, Z.; Bai, L. Regional water resource carrying capacity evaluation based on multi-dimensional precondition cloud and risk matrix coupling model. Sci. Total Environ. 2020, 710, 136324. [Google Scholar] [CrossRef]
  34. Zhang, M.; Liu, Y.M.; Wu, J.; Wang, T.T. Index system of urban resource and environment carrying capacity based on ecological civilization. Environ. Impact Assess. Rev. 2018, 68, 90–97. [Google Scholar] [CrossRef]
  35. Wang, Y.; Yang, G.C.; Dong, Q.L.; Cheng, L.; Shang, P.P. The scale, structure and influencing factors of total carbon emissions from households in 30 provinces of China-based on the extended STIRPAT model. Energies 2018, 11, 1125. [Google Scholar] [CrossRef]
  36. Cui, Y.; Feng, P.; Jin, J. Water Resources Carrying Capacity Evaluation and Diagnosis Based on Set Pair Analysis and Improved the Entropy Weight Method. Entropy 2018, 20, 359. [Google Scholar] [CrossRef]
  37. Su, M.; Li, C.; Xue, Y.; Wang, P.; Cheng, K.; Liu, Y. Engineering application of fuzzy evaluation based on comprehensive weight in the selection of geophysical prospecting methods. Earth Sci. Inf. 2022, 15, 105–123. [Google Scholar] [CrossRef]
  38. Wang, L.Y.; Huang, X.; Li, H.M. Research on the evaluation of water resources carrying capacity of nine provinces in the Yellow River Basin based on CW-FSPA. China Rural. Water Hydropower 2021, 9, 67–75. [Google Scholar]
  39. Zhang, L.J.; Kang, Y.; Su, X.L. Evaluation of water resources carrying capacity in the Yellow River Basin based on normal cloud model. Water Saving Irrig. 2019, 1, 76–83. [Google Scholar]
  40. Zhou, K. Comprehensive evaluation on water resources carrying capacity based on improved AGA-AHP method. Appl. Water Sci. 2022, 12, 103. [Google Scholar] [CrossRef]
Figure 1. Research framework.
Water 17 02360 g001
Figure 2. Locations of twenty-eight counties in the Dadu River Basin in China.
Water 17 02360 g002
Figure 3. The ecological status of the study area.
Water 17 02360 g003
Figure 4. The overall changes in the WRCC of the Dadu River Basin from 2011 to 2020.
Water 17 02360 g004
Figure 5. WRCC changes of Dadu River Basin’s 28 counties from 2011 to 2020. (ad) each show the WRCC of 7 counties.
Water 17 02360 g005
Figure 6. Spatial distribution of the WRCC evaluation in the Dadu River Basin’s 28 counties. (a) WRCC in 28 counties of the Dadu River Basin in 2011; (b) WRCC in 28 counties of the Dadu River Basin in 2015; (c) WRCC in 28 counties of the Dadu River Basin in 2020.
Water 17 02360 g006aWater 17 02360 g006b
Figure 7. Driving intensity of driving factors on WRCG development in DDRB’s 28 counties from 2011 to 2020. (a) Water resource subsystem; (b) social subsystem; (c) ecological environment subsystem; (d) economic subsystem.
Water 17 02360 g007
Figure 8. The main obstacle indicators for WRCC in the Dadu River Basin from 2011 to 2020.
Water 17 02360 g008
Table 1. Evaluation index system of WRCC.
Target LayerCriterion LayerIndicator LayerUnitAttribute
Water resourceWater resource endowmentPrecipitationmm+
Water resources per capitam3/person+
Groundwater resources per unit area10,000 m3/km2+
Water production capacityWater production coefficient +
Total water supplym3+
SocialPopulation compositionPopulation densityperson/km2
Urbanization rate%+
Permanent population 104 person
Domestic water levelWater quota for urban residentsL/person/day
Water quota for rural residents L/person/day
Water consumption per capitam3
EconomicScale of economic developmentProportion of the primary industry%
Proportion of secondary industry%
Proportion of the tertiary industry%+
GDP per capita10,000 CNY/person +
Water efficiency for economic developmentWater consumption per hectare for agricultural irrigation m3/hm2
Water consumption per CNY 10,000 GDPm3/104 CNY
Water consumption rate%
Water consumption of CNY 10,000 industrial value-addedm3
Ecological
environment
Current situation of the ecological environmentEcological water use rate%+
Forest coverage rate %+
Ecological environment management levelMunicipal sewage treatment rate %+
Harmless treatment rate of urban domestic waste%+
Ecological environmental pressureFertilizer application amountt
COD emissions per CNY 10,000 of industrial productiont
Table 2. CRITIC method–entropy weighting method combined weight.
Criterion LayerIndicator LayerCRITIC MethodEntropy Weighting MethodCombined Weight
Water resource endowmentPermanent population 4.43%1.08%3.43%
Population density5.55%1.86%4.44%
Fertilizer application amount5.88%2.60%4.90%
Water production capacityProportion of the primary industry3.92%1.43%3.17%
proportion of secondary industry5.50%3.77%4.98%
Population compositionCOD emissions per CNY 10,000 of industrial production2.89%0.52%2.18%
Water consumption per capita2.75%0.51%2.08%
Water consumption per CNY 10,000 GDP2.43%0.38%1.82%
Domestic water levelWater consumption per hectare for agricultural irrigation 4.21%1.32%3.34%
Water consumption rate3.95%1.82%3.31%
Water quota for urban residents3.09%0.91%2.44%
Scale of economic developmentWater quota for rural residents 3.23%0.78%2.50%
water consumption of CNY 10,000 industrial value-added3.26%0.64%2.47%
Urbanization rate3.74%3.73%3.74%
Proportion of the tertiary industry4.00%3.82%3.95%
Water efficiency for economic developmentGDP per capita3.56%7.74%4.81%
Precipitation4.27%7.28%5.17%
Forest coverage rate 4.51%2.68%3.96%
Municipal sewage treatment rate 3.07%1.94%2.73%
Current situation of the ecological environmentWater production coefficient 2.78%1.98%2.54%
Total water supply4.84%13.55%7.45%
Ecological environment management levelWater resources per capita4.97%19.32%9.28%
Groundwater resources per unit area3.96%4.18%4.03%
Ecological environmental pressureEcological water use rate4.70%14.64%7.68%
Harmless treatment rate of urban domestic waste4.50%1.51%3.60%
Table 3. Classification standard for WRCC evaluation grades.
Evaluation Index RangeEvaluation GradeWater Resource Carrying Capacity Grade
[0–0.2)ISevere Overload
[0.2–0.4)IIOverload
[0.4–0.6)IIICritical
[0.6–0.8)IVWeakly Bearable
[0.8–1.0)VBearable
Disclaimer/Publisher’s Note: The statements, opinions and data contained in all publications are solely those of the individual author(s) and contributor(s) and not of MDPI and/or the editor(s). MDPI and/or the editor(s) disclaim responsibility for any injury to people or property resulting from any ideas, methods, instructions or products referred to in the content.