Abstract
In China’s Loess Plateau, sustainable agricultural end products are affected by an insufficiency of water resources. Rising crop water use efficiency (WUE) through field management pattern improvement is a crucial plan of action to address this issue. However, there is no agreement among researchers on the most appropriate field management practices regarding WUE, which requires further integrated quantitative analysis. We conducted a meta-analysis by quantifying the effect of agricultural practices surrounding nitrogen (N) fertilizer management. The two experimental cultivars were Yunhan–20410 and Yunhan–618. The subplots included nitrogen 0 kg·ha−1 (N0), 90 kg·ha−1 (N90), 180 kg·ha−1 (N180), 210 kg·ha−1 (N210), and 240 kg·ha−1 (N240). Our results show that higher N rates (up to N210) enhanced water consumption during the node-flowering and flowering-maturity time periods. YH–618 showed higher water use during the sowing–greening and node-flowering periods but decreased use during the greening-node and flowering-maturity periods compared to YH–20410. The N210 treatment under YH–618 maximized water use efficiency (WUE). Increased N rates (N180–N210) decreased covering temperatures (Tmax, Tmin, Taver) during flowering, increasing the level of grain filling. Spike numbers rose with N application, with an off-peak at N210 for strong-gluten wheat. The 1000-grain weight was at first enhanced but decreased at the far end of N180–N210. YH–618 with N210 achieved a harvest index (HI) similar to that of YH–20410 with N180, while excessive N (N240) or water reduced the HI. Dry matter accumulation increased up to N210, resulting in earlier stabilization. Soil water consumption from wintering to jointing was strongly correlated with pre-flowering dry matter biological process and yield, while jointing–flowering water use was linked to post-flowering dry matter and spike numbers. Post-flowering dry matter accumulation was critical for yield, whereas spike numbers positively impacted yield but negatively affected 1000-grain weight. In conclusion, our results provide evidence for determining suitable integrated agricultural establishment strategies to ensure efficient water use and sustainable production in the Loess Plateau region.
1. Introduction
About 3800 years ago, wheat (Triticum aestivum L.) was introduced from the West Asia Corridor to China and gradually spread to the Guanzhong Plain, evolving into winter wheat to adapt to the local cultivation system. In China, wheat is the second largest food crop after rice, and increasing its yield is conducive to ensuring national food security []. China’s wheat yield has also increased rapidly under the optimization of breeding and cultivation systems. In addition to the requirements for the nutritional and processing qualities of wheat grains, higher demands have also been placed on the cooking and eating qualities in the second stage of processing []. China has rich wheat germplasm resources and high nutritional and eating quality. Therefore, screening wheat varieties with better cooking and eating quality and optimizing the cultivation measures of these varieties are of great significance []. The ecological adaptability and stability of the yield and quality vary between different wheat varieties. Nitrogen fertilizer, as an important cultivation measure in wheat production, plays a crucial role in the formation of wheat yield and quality [,]. However, excessive and unreasonable application of N can lead to a decrease in nitrogen fertilizer utilization efficiency and cause a series of environmental problems [,]. Shanxi Province is a major wheat production area, with dryland wheat accounting for 46% of the total wheat area in the province. How to tap the potential of dryland wheat yield and quality in this region is of vital importance to solving the food security problem of crops in China [,]. Therefore, exploring the optimal cultivation measures is of crucial importance for improving wheat yield and quality in Shanxi, ensuring food security in Shanxi and the whole country. Dryland winter wheat, which relies solely on natural precipitation for production and lacks irrigation conditions, is resistant to water shortages, low precipitation, and uneven precipitation distribution. Therefore, the goal of dryland wheat cultivation is to minimize water usage, enhance agricultural productivity, and reduce economic costs in arid regions [,]. In China, dryland accounts for approximately one-third of the total cultivated land area, and its output constitutes 50% of the total wheat production [,]. The soil in dryland areas is poor, with poor structure, poor water retention capacity, and weak self-regulation ability [,]. The economic foundation of the planting area is poor, the agricultural structure is relatively simple, the rural economy is relatively poor, the agricultural mechanization level is relatively low, and the variety layout is relatively unreasonable [,]. Therefore, the yield of dryland wheat not only directly affects the overall agricultural production level and the overall situation of wheat production in the province but also affects the lives of farmers in arid regions. The yield of wheat is not only affected by varieties, soil conditions, and climatic conditions but also closely related to cultivation measures [,]. Therefore, screening high-yield varieties suitable for dryland wheat cultivation areas and optimizing corresponding cultivation measures have guiding significance for increasing wheat yield. The first processing quality refers to the flouring quality of wheat, including the flouring rate, ash content, and color of wheat. The second processing quality refers to the processing quality of food, which is divided into baking quality and cooking quality according to the differences in the final requirements of processed products []. N fertilizer is one of the important influencing factors affecting the growth and development of wheat. When the N application amount is insufficient, it will reduce the wheat yield []. Due to the promotion of N application for modern high-yield wheat varieties, the influence of nitrogen fertilizer on wheat growth and yield has become increasingly significant, and it has been widely used in wheat field production []. The “green revolution” of wheat varieties has reduced the plant height while improving the utilization efficiency of nitrogen fertilizer by wheat, increasing the yield and the ability to resist lodging. Therefore, farmers will increase the application of nitrogen fertilizer to improve the wheat yield []. However, the relationship between nitrogen fertilizer application amount and wheat yield is parabolic, indicating that there is an optimal level of N fertilizer at which the wheat yield is the highest [,]. By increasing the leaf area index of wheat during the booting and filling stages, the accumulation of dry matter is promoted after flowering, thereby increasing the number of wheat ears and yield [,]. N180 dry matter accumulation after flowering increased, the dry matter accumulation of wheat grains during the maturity stage and its proportion in the total dry matter accumulation increased, and the yield reached N240 []. Some scholars have conducted research on the optimal N for wheat yield formation in dryland [] and found that a nitrogen application rate of N240 could significantly increase nitrogen accumulation and its proportion during the booting and flowering stages of wheat in Shanxi Province and increase the yield by 10.1% []. In Shanxi, Yangling, Shaanxi Province, it was found that nitrogen application rates of N180 and N240 could increase water consumption during dryland wheat, promote dry matter accumulation, promote the conversion of assimilates to grains, and increase the yield by 17.8%. Moreover, different precipitation years required different nitrogen fertilizer amounts for dryland wheat to reach the maximum yield []. By setting different N levels, the responses of different flavor quality wheat varieties to N were investigated, and the regulatory mechanism of nitrogen fertilizer on the formation of wheat processing quality was clarified, in order to provide a theoretical basis for the integration of high-quality cultivation technologies for winter wheat in dryland areas of Shanxi (Figure 1). The key objectives for studying the nutrition and entire leaf N content are to investigate the differences in water utilization, dry matter, N accumulation, transportation, and quality among different clusters. Furthermore, we studied the effects of water utilization, material accumulation and transportation yield, and quality under N levels, which affect the accumulation and transportation of nutrients, the formation of yield, and the water use efficiency.
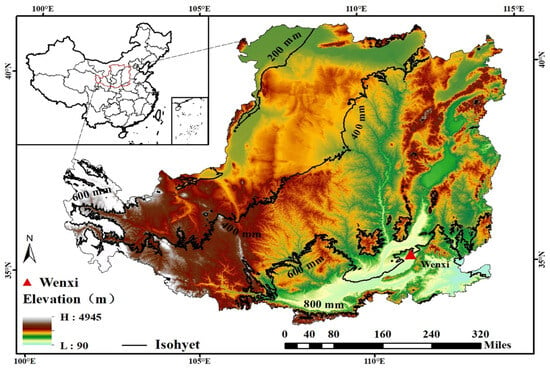
Figure 1.
Location and general situation of the test area elevation and isohyet on the Loess Plateau in China.
2. Materials and Methods
This experiment was conducted from 2021 to 2024 at the wheat experimental demonstration base in Wenxi, Shanxi Province (35°24′ N, 111°26′ E), a typical arid area. The average annual temperature is 13.72 °C, the average annual sunshine duration is 2461 h, the average annual evaporation from the water surface is 1838.9 mm, and the average annual precipitation is 61.08% of the annual precipitation during the fallow period. The cropping system is one crop per year. According to the Chinese National Standard GB/T 21986-2008 (2008) [] the precipitation in 2022–2024 was 46.7% higher than the average annual precipitation (501.58 mm), which was a normal wet year (Figure 2).
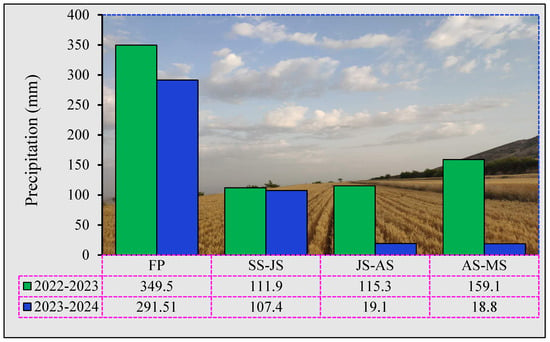
Figure 2.
Precipitation and perennial average at different growth stages in the experiment site, Wenxi, Shanxi Province, from 2022 to 2024. Note: SS–JS: Sowing stage to jointing stage; JS–AS: Jointing stage to anthesis stage; AS–MS: Anthesis stage to maturity, FP: Fallow period.
2.1. Experimental Design
The experiment used a split–split-plot design, and the two cultivars were Yunhan–20410 and Yunhan–618. A two-factor split-plot design was used, with sowing methods used for the main plots and nitrogen application rates for the subplots. The subplots included nitrogen 0 kg·ha−1 (N0), 90 kg·ha−1 (N90), 180 kg·ha−1 (N180), 210 kg·ha−1 (N210), and 240 kg·ha−1 (N240). There were a total of 8 treatments with 3 replicates, and each plot was 23 m2. Nitrogen fertilizer (urea, 46%) was applied as a base fertilizer before sowing, along with phosphorus fertilizer (superphosphate, 16% P2O5) and potassium fertilizer (potassium oxide, 52% K2O) at 150 kg·ha−1 (Table 1). The sowing dates were 28 September 2021 and 11 October 2023, and the harvest dates were 10 June 2023 and 1 June 2024. No irrigation or additional fertilization was applied during the growth period. Weed control and pest management were carried out per conventional practices.

Table 1.
Soil fertility of 0–20 cm soil layer before sowing in the Wenxi field experiment.
2.2. Soil Moisture
Before sowing, before wintering, during the jointing stage, during the flowering stage, and during the maturity stage, the portable soil moisture meter Trimer Pico 64 (TDR, Dortmund, Germany) was used to measure the volumetric soil moisture content in 0–200 cm depths at intervals of 20 cm. The calculation formula for soil water storage consumption and evaporation in the wheat field is as follows:
∆S = ∑ (θt1 − θt2)
In the formula, ∆S represents the consumption of soil water storage, and θt1 and θt2 are the soil moisture content (%) at the beginning and end of the calculation period, respectively.
ET = P + I − D − Wg − R + ∆S
ET represents evapotranspiration (in millimeters); P is the precipitation during the growing period (in millimeters); I is the irrigation volume (in millimeters); D is the soil drainage volume (in millimeters); Wg is the water volume generated by the upward movement of crops through the capillary of groundwater (in millimeters); R is the surface runoff (in millimeters); ∆S is the change in soil water storage in a 200 cm soil layer during a given period (the consumption of soil water storage). In this study, micro-sprinkler irrigation was adopted, with no surface water accumulation, so R can be ignored. In this study, the irrigation system was controlled by a water meter, with a low irrigation volume, so drainage D can be neglected [].
2.3. Grain Filling Dynamics and Post-Flowering Dry Matter Mass
In the flowering stage, 400 spikes with uniform growth and flowering on the same day were marked in each plot. Samples were taken every 5 days, 10 plants each time, as well as three replicates. They were divided into leaves, stems, sheaths, and spikes. The stems were divided into internodes below the spike, penultimate internodes, and other internodes accordingly. The fresh samples were stored in a −20 °C refrigerator for the subsequent determination of carbon active enzymes, and the dry samples were killed at 105 °C for 30 min and then dried at 75 °C to a constant weight and weighed and recorded (grains were directly dried at 75 °C to a constant weight). The grain filling characteristics were fitted with a logistic equation, which was W = A/(1 + Be − Ct), where W (g) is the 1000-grain weight at time t, A (g) is the theoretical maximum 1000-grain weight, t (d) is the time after flowering, and B and C are the coefficients determined by regression.
2.4. Plant Carbohydrates
Dry samples of plants at each growth stage were ground through a 0.15 mm sieve; sucrose content was determined by the resorcinol method; soluble sugar content of plants was determined by the sulfuric acid-anthrone method [].
2.5. Computing Method
The total water consumption throughout the entire growth period is calculated as follows:
In the formula, ΔS represents the reduction in soil water storage (mm) at each growth stage, P represents the effective precipitation (mm), and G represents the groundwater recharge (mm). In this experiment, the groundwater depth was below 10 m, so the G value can be ignored.
Water use efficiency (WUE) (kg∙ha−1∙mm−1) = Grain yield (kg∙ha−1)/Water consumption during the growth period (mm)
Soluble carbohydrate content = Soluble sugar content
Accumulation of soluble carbohydrates = Soluble carbohydrate content × Dry matter weight
Dry matter translocation from stem and sheath before flowering = Dry matter weight of stem and sheath at flowering − Dry matter weight of stem and sheath at maturity
2.6. Investigation of Basic Seedlings and Total Stem Numbers of the Population
When wheat begins to produce lateral shoots, three areas of 2 rows of wheat each, each 1 m long, are designated for each experimental plot. During the wintering period, booting stage, jointing stage, flowering stage, and maturity stage, the number of stems and shoots in the population is surveyed at fixed points. The number of stems and shoots in the booting stage is the highest during the wheat growth period. The highest resulting number is the difference between the highest number of each and the basic seedlings. The formulas for calculating the percentage of full-grain yield and the proportion of the full-grain yield are as follows:
Percentage of full-grain yield (%) = Number of grains/Highest number
Percentage to full-grain yield (%) = (Number of grains − Basic seedlings)
(Highest number − Basic seedlings)
Proportion of full-grain (%) = (Number of grains − Basic seedlings)/Number of grains
2.7. Yield and Its Components
At maturity, 0.667 m2 of wheat with uniform growth was selected in each plot to determine the number of spikes. A total of 20 spikes were randomly selected from each plot and dried; the average number of grains per spike was calculated; and the 1000-grain weight was determined, with three replicates. Then, 20 m2 was randomly harvested to determine the yield. The grain moisture content was determined using a grain moisture meter, and the actual yield was calculated based on the national grain storage standard moisture content of 13%.
2.8. Statistical Analyses
Data processing and graphing were performed using Origin 2020 software, Digital Photo Studio (DPS), and SAS 9.0 software. Data for each trait were analyzed with ANOVA using SPSS 21.0 (SPSS Inc., Chicago, IL, USA). Treatment means were compared using Duncan’s multiple-range tests at p < 0.05. Correlation was assessed by Pearson correlation analysis. Figures were prepared using Microsoft Excel 2013 (Microsoft Corporation, Redmond, WA, USA).
3. Results
3.1. Sources of Soil–Water Interaction and Management
Compared with 2020–2021 and 2021–2022, the total water consumption and the proportion of precipitation increased in 2022–2023, while the soil water storage consumption and its proportion decreased, as shown in Table 2. Under YH–20410 and YH–618 conditions, the total water consumption was 417.9–476.6 mm and 371.8–439.2 mm, respectively, and the soil water storage consumption was 96.0–196.7 mm and 131.5–234.0 mm, respectively. Compared with YH–20410, the total water consumption under YH–618 decreased by 9.5%, while the soil water storage consumption increased by 20.5%. In the range of N210, soil water storage consumption increased with the increase in nitrogen application. For N210, there was no significant change in soil water storage consumption. Compared with the N0 treatment, under YH–20410, the total water consumption of N90, N180, and N210 treatments increased by 1.9%, 4.7%, and 5.7%, respectively, and the soil water storage consumption increased by 5.6%, 14.0%, and 16.8%, respectively; under YH–618, the total water consumption N90, N180, and N210 treatments increased by 1.2%, 4.7%, and 8.0%, respectively, and the soil water storage consumption increased by 2.7%, 10.4%, and 17.5%, respectively. Further analysis of the proportion of each water consumption source to the total water consumption showed that compared with YH–20410, the proportion of water under YH–618 decreased by 20.5%, while the proportion of soil water storage consumption and precipitation increased by 33.1% and 10.3%, respectively. For N210, with an increase in nitrogen application, the proportion of water and precipitation generally showed a gradual decrease trend, while the proportion of soil water storage consumption showed a gradual increase trend. For N210, there was no significant change in the proportion of each water consumption source to the total water consumption.

Table 2.
Effects of cultivar consumption and sources of water consumption on strong gluten wheat.
3.2. Water Consumption in Stage
The average water consumption during the sowing–greening stage of the three wheat seasons was 105.5 mm, 131.9 mm, and 90.8 mm, respectively (Figure 3). Under YH–20410 and YH–618, the water consumption during the greening-node period was 72.0–96.5 mm and 53.2–77.7 mm, respectively; during the node-flowering stage, it was 95.2–116.8 mm and 110.2–135.7 mm, respectively; and during the flowering-maturity period, it was 107.5–181.8 mm and 72.3–144.1 mm, respectively. Compared with YH–20410 and YH–618, it showed reduced water consumption during the greening-node stage and flowering-maturity stage by 21.9% and 25.2%, respectively, while it increased water consumption during the node-flowering stage by 12.9%. Within the range of N210, the water consumption during the node-flowering period and flowering-maturity stage increased with the increase in N application rate. The proportion of water consumption during the sowing-greening stage under YH–20410 and YH–618 was 19.4–30.8% and 20.4–35.0%, respectively (Figure 4). During the greening-node period, it was 14.3–20.1%, and 16.8–22.8%, respectively; during the node-flowering period, it was 22.5–24.7% and 28.9–31.5%, respectively; and during the flowering-maturity period, it was 25.7%, 38.2% and 19.4%, 34.3%, respectively. Compared with YH–20410 and YH–618, the proportion of water consumption increased during the sowing-greening period and node-flowering period by 9.7% and 24.6%, respectively, while the proportion of water consumption decreased during the greening-node period and flowering-maturity stage by 13.7% and 17.6%, respectively. The N application rate had a relatively small impact on the proportion of water consumption during each stage. Among them, the proportion of water consumption during the node-maturity stage under YH–20410, N90 treatment and YH–618, N210 treatment was 56.8% and 57.2%, which significantly increased the water consumption during the node-flowering stage by 25.4% and significantly decreased the water consumption during the flowering-maturity period by 17.9%.
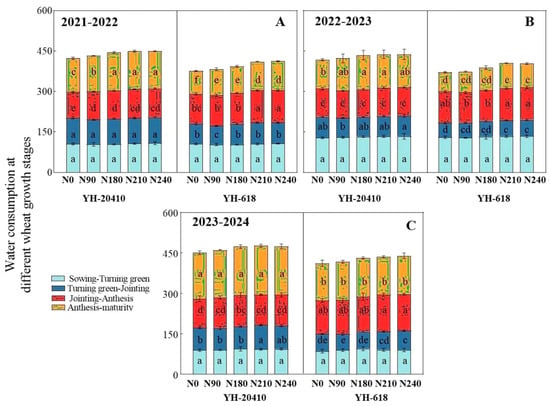
Figure 3.
Effects of nitrogen application rates on water consumption of strong gluten, (A). 2021–2022, (B). 2022–2023, and (C). 2023–2024, wheat during different wheat growth stages. Note: Different letters indicate that means within a column are significantly different.
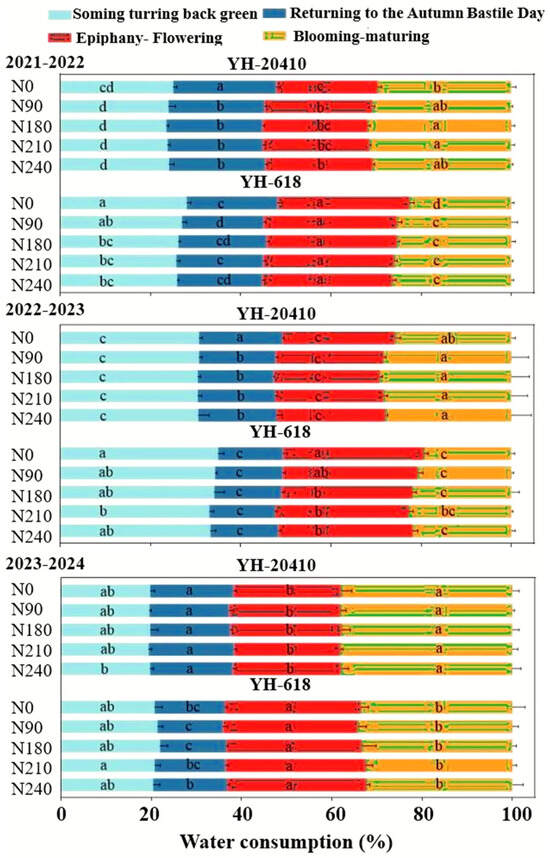
Figure 4.
Effects of cultivars and nitrogen application rates on water consumption ratio of strong gluten wheat during different wheat growth stages. Note: Different letters indicate that means within a column are significantly different.
3.3. Effects of Cultivars and Nitrogen Treatments on Water Use Efficiency
The year, N application, and their interactions significantly affect the water use efficiency (WUE) of strong-flour wheat (Table 3). The WUE of the three wheat seasons was 17.3 kg·ha−1·mm−1, 18.1 kg·ha−1·mm−1, and 17.0 kg·ha−1·mm−1, while the WUE was 71.5 kg·ha−1·mm−1, 73.4 kg·ha−1·mm−1, and 75.6 kg·ha−1·mm−1 (Figure 5). Compared with the YH–20410, the WUE under YH–618 increased by 3.5%, with N210 and N240 treatments significantly increasing by 8.0% and 7.0%, respectively; under YH–YH–618, WUE significantly increased by 78.4%, 82.2%, 79.3%, 98.3%, and 97.6% in N0, N90, N180, N210, and N240 treatments, respectively. WUE showed a trend of increasing first and then decreasing with the increase in nitrogen application and reached the maximum in N180 and N210 treatments under YH–20410 and YH–618, respectively. The relationship between the WUE under different nitrogen application levels (Figure 6) and the WUE of winter wheat was highly correlated with the nitrogen application amount (R2 ≥ 0.8035), indicating that both too-low and too-high nitrogen application were not conducive to the improvement in both. Overall, under YH–618, the N210 treatment produced the highest water use efficiency (WUE) and water utilization efficiency (WUE) of 20.3 and 113.1 kg·ha−1·mm−1, respectively, compared with the N180 treatment under YH–20410, which increased by 9.7% and 103.2%, respectively.

Table 3.
Significance analysis of year, nitrogen application, and interaction effect on water consumption-related indexes of strong gluten wheat.
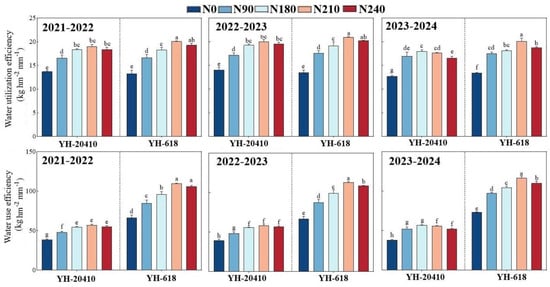
Figure 5.
Effects of cultivars and nitrogen treatments on water use efficiency and water utilization efficiency of strong gluten wheat. Note: Different letters indicate that means within a column are significantly different.
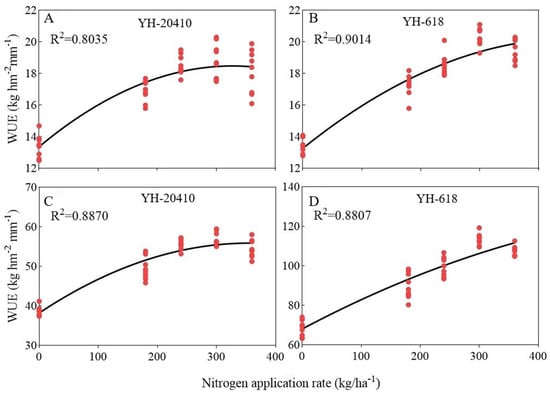
Figure 6.
Relationship between nitrogen application and water use efficiency and water utilization efficiency under different nitrogen application conditions. (A,B) Water use efficiency (WUE); (C,D) water utilization efficiency (WUE).
3.4. Effects of Cultivars and Nitrogen Treatments on Temperature Characteristics
A numerical analysis was conducted on the thermal radiation images of the wheat canopy (Figure 7), clarifying the temperature distribution of the wheat canopy (Figure 8) and accurately calculating the average temperature (Taver), maximum temperature (Tmax), and minimum temperature (Tmin) of the wheat canopy. During the flowering period, the Tmax under YH–20410 and YH–618 was 21.9–25.7 °C and 23.1–24.5 °C, respectively, while Tmin was 14.7–16.8 °C and 15.2–18.3 °C, respectively, and Taver was 18.1–20.9 °C and 19.3–21.3 °C, respectively. Compared with YH–20410, the Taver of N0, N90, N180, N210, and N240 treatments under YH–618 increased by 0.4 °C, 1.2 °C, and 1.3 °C, respectively. Increasing the nitrogen application rate can effectively reduce Tmax, Tmin, and Taver during the flowering period. Compared with the N0 treatment, YH–20410 under N90, N180, N210, and N240 treatments reduced Tmax by 8.9%, 12.5%, and 14.8%, respectively, Tmin by 7.1% and 12.3%, respectively, and Taver by 8.6%, 11.5%, 13.4%, and 12.4%, respectively. YH–20410 under N90, N180, N210, and N240 treatments reduced Tmax by 2.0%, 2.9%, and 5.7%, respectively; Tmin by 15.3%, 13.1%, 11.5%, and 9.7%, respectively; and Taver by 4.2%, 8.0%, and 9.4%, respectively. The trend of canopy temperature changes during the filling period was similar to that during the flowering period. YH–20410 and YH–618 under Tmax were 27.9–32.4 °C and 28.4–33.7 °C, respectively, while Tmin was 21.8–25.0 °C and 21.9–24.8 °C, respectively, and Taver was 24.8–27.5 °C and 25.4–28.0 °C, respectively. Compared with YH–20410, the Taver of N0, N90, N180, N210, and N240 treatments under YH–618 increased by 0.5 °C, 0.8 °C, 1.4 °C, 0.1 °C, and 0.6 °C, respectively. Compared with the N0 treatment, YH–20410 under N90, N180, N210, and N240 treatments reduced Tmax by 8.6%, 12.7%, and 13.9%, respectively; Tmin by 6.8%, 10.8%, and 12.8%, respectively; and Taver by 5.5%, 9.1%, 8.7%, and 9.8%, respectively. YH–618 under N90, N180, N210, and N240 treatments reduced Tmax by 11.6%, 12.2%, 14.5%, and 15.7%, respectively; Tmin by 8.9%, 5.2%, 11.7%, and 9.7%, respectively; and Taver by 4.3%, 5.7%, and 10.0%, respectively. Compared with the YH–20410 treatment, N90, N180, and N210 treatments had Taver increases of 6.0% and 4.3%, respectively, during the flowering period, and Taver increases of 0.8% and 5.6%, respectively, during the filling period. This indicates that under YH–618, increasing N180 and N210 can effectively reduce canopy temperature, reaching the same canopy temperature level as YH–618 during the filling period. This helps to improve the growth environment of the crops, delay the aging of the leaves, and ensure the normal process of grain filling.
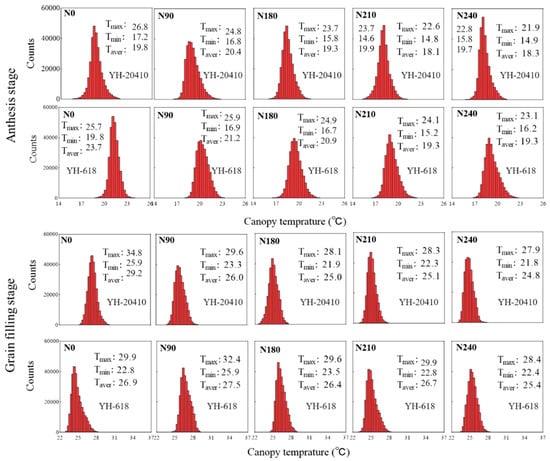
Figure 7.
Interval distribution of canopy temperature of strong gluten wheat under different nitrogen application treatments.
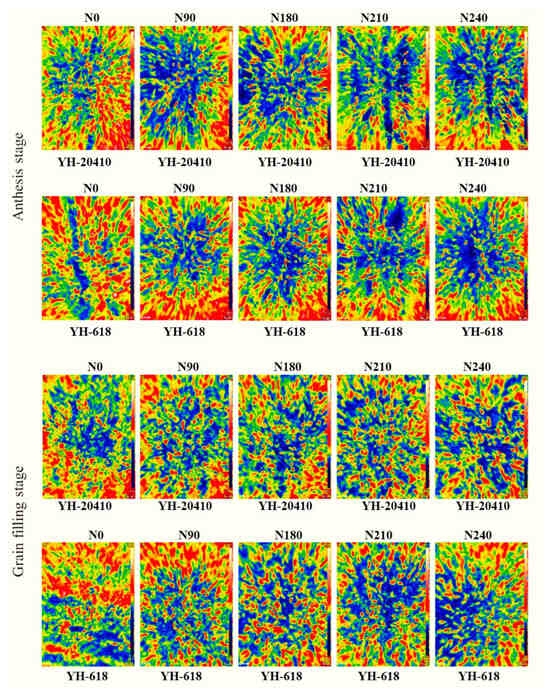
Figure 8.
Canopy temperature of strong gluten wheat under different nitrogen application treatments. A color scale representing temperature typically uses a gradient of colors, often ranging from blue for colder temperatures to red for warmer temperatures.
3.5. Yield and Components
The number of spikes was significantly affected by year and nitrogen application (Table 4). The number of spikes in the three wheat growing seasons was 807.4 kg·ha−1, 773.9 kg·ha−1, and 687.5 kg·ha−1, respectively. Compared with the N0 treatment, the number of spikes under YH–20410 increased by 23.1%, 41.0% and 50.2% in N90, N180, and N210 treatments, respectively. Under YH–618, the number of spikes in N90, N180, and N210 treatments increased by 27.9%, 44.3%, and 59.3%, respectively. The number of spikes under YH–20410 and YH–618 in N210 treatments was 867.5 × 10⁴·ha−1 and 867.1 × 10⁴·ha−1, respectively, which were significantly increased by 6.5% compared with N180 treatment under YH–20410. This indicates that a nitrogen application rate of N210 can ensure a high number of spikes in strong-gluten wheat. The number of grains per spike in the three wheat growing seasons was 33.7 and 34.2, respectively. The number of grains per spike was relatively close under the N conditions, being 34.2 and 33.9, respectively. The 1000-grain weight in the three wheat growing seasons was 33.7 g and 34.2 g, respectively. The 1000-grain weight under YH–20410 and YH–618 was 35.2 g and 33.8 g, respectively. Compared with YH–20410, the 1000-grain weight under YH–618 decreased by 3.8%, with a decrease of 3.1%, 5.7%, and 6.3% in N0, N90, N180, N210, and N240 treatments, respectively. With the increase in nitrogen application rate, the 1000-grain weight first increased and then decreased, reaching the maximum at N180 and N210 treatments under YH–20410 and YH–618, respectively, at 34.7 g and 36.2 g. The harvest index (HI) in the three wheat growing seasons was 0.438, 0.446, and 0.465, respectively. Compared with YH–20410, the HI under YH–618 decreased by 3.2% and 3.9% in 2020–2021 and 2021–2022, respectively, and increased by 1.7% in 2022–2023. With the increase in nitrogen application rate, the HI first increased and then decreased, reaching the maximum at N180 and N210 treatments under YH–20410 and YH–618, respectively. Compared with YH–20410, N180 treatment, there was no significant difference in HI between N210 treatments under YH–20410 and YH–618 in 2020–2021 and 2021–2022, and they were significantly higher than the other treatments; in 2022–2023, there was no significant difference in HI among N90, N180, N210, and N240 treatments under YH–20410 and YH–618, and they were significantly higher than the other treatments. The results indicated that N210 treatment under YH–618 could achieve an HI comparable to that of N180 treatment under YH–20410 in different years. Excessive water supply (water and precipitation) or an overly high nitrogen application rate of N240 could both lead to a reduction in HI.

Table 4.
Effects of nitrogen at different leaf ages on yield and its components of strong gluten wheat.
3.6. Dry Matter Accumulation and Transport
The dry matter accumulation at the blooming stage and the maturity stage was significantly affected by year, and the nitrogen application rates are shown in Figure 9. The dry matter accumulation values in the maturity stage for the three wheat growing seasons were 13,401.3 kg·ha−1 and 11,949.4 kg·ha−1, respectively. The average dry matter accumulation values at the blooming stage and maturity stage were 16,502.3 kg·ha−1, 16,661.9 kg·ha−1, and 16,296.2 kg·ha−1. The dry matter accumulation at the blooming stage and the maturity stage in 2022–2023 were significantly lower than those in 2020–2021 and 2021–2022. Compared with the YH–20410, the dry matter accumulation values at the blooming stage under YH–618 decreased by 3.7% and 4.4%, respectively. The dry matter accumulation values at the blooming stage decreased by 1.3%, 2.0%, 3.1%, and 6.0%; the dry matter accumulation values at the maturity stage decreased by 1.6%, 1.4%, 8.6%, and 7.1%, respectively. The increase in N240 in both the dry matter accumulation values at the blooming stage and the maturity stage showed a trend of first increasing and then stabilizing. For N240 treatment under YH–20410, the dry matter accumulation values at the blooming stage and the maturity stage in the three wheat seasons were significantly increased in the N10, N240, N210, and N240 treatments under YH–20410, and the dry matter accumulation blooming stage was significantly increased in 2020–2021. The dry matter accumulation values at the blooming stage and the maturity stage in the remaining N240 treatments were significantly decreased.
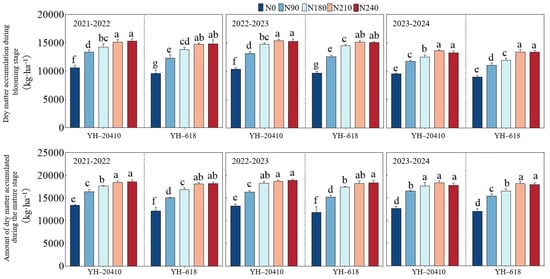
Figure 9.
Effects of N application on dry matter transfer before anthesis, dry matter accumulation after anthesis, and contribution rate to grain of strong gluten wheat. Different letters indicate that means within a column are significantly different.
3.7. Correlation Between Soil Moisture Changes, Dry Matter Before and After Flowering, Yield, and Its Components
The soil water storage during the overwintering and jointing stages has a significant or extremely significant impact on post-flowering dry matter accumulation, yield, and 1000-grain weight, as shown in Figure 10. Soil water consumption from the overwintering to jointing stage has a significant or extremely significant positive correlation with pre-flowering dry matter translocation, post-flowering dry matter accumulation, and yield. Soil water consumption from jointing to flowering has a significant or extremely significant positive correlation with post-flowering dry matter accumulation, spike number, and yield. Soil water consumption from flowering to maturity has an extremely significant correlation with post-flowering dry matter accumulation and yield. Post-flowering dry matter accumulation has a significant or extremely significant correlation with spike number and yield. Pre-flowering dry matter translocation has a significant impact on 1000–grain weight. Spike number has a significant positive correlation with yield but a significant negative correlation with 1000-grain weight.
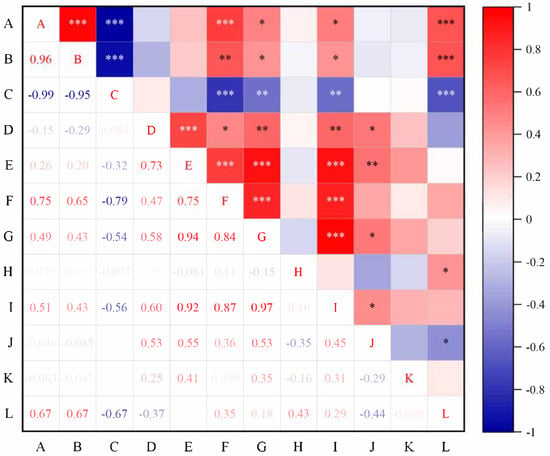
Figure 10.
Correlation coefficients between grain yield, soil water storage, dry matter accumulation, and water consumption from sowing to wintering (SW), wintering to jointing (WJ), jointing to anthesis (JA), and anthesis to maturity (AM) of wheat. Note: Soil water storage at wintering, soil water storage at jointing, grain yield, water consumption from sowing to wintering, wintering to jointing (WJ), jointing to anthesis (JA), dry matter assimilation after anthesis, dry matter translocation before anthesis, yield, pike number, grain per spike, and 1000-grain weight. Different letters indicate that means within a column are significantly different. ***—Highly significant (p < 0.01), **—Significant (p < 0.05), and *—Not significant (p ≥ 0.05).
4. Discussion
In wheat grains, the protein content, sedimentation value, dry–wet gluten content, and dough stability time, as well as dough tensile force and other quality indicators, increase with the increase in N application amount, and the best combination for high yield and high quality is obtained at the N application amount of N240 []. Others have observed that the elasticity of dough increases with the increase in N fertilizer application, and the formation time and stability time of dough increase with the increase in N fertilizer application []. However, there are relatively few studies on the effect of nitrogen levels on the particle size distribution of protein components []. The particle size distribution of protein components is less affected by N, but N has an impact on the particle size distribution of protein components.
N is an indispensable cultivation measure in the efficient production of wheat. By appropriately increasing N fertilizer application, the nutritional and processing qualities of wheat grains can be effectively improved. However, there are few reports on the research of N fertilizer on the flavor quality of wheat. Therefore, how to achieve sustainable high-quality development of wheat while improving the water and N utilization efficiency of wheat has important research significance. Drought is not only a significant problem in global food production but also a worldwide challenge. According to statistics, dryland accounts for over 70% of the total cultivated land area worldwide, while its grain production constitutes approximately 60–65% of the world’s total grain output [,]. Changwu, Shaanxi Province, and Shanxi Province found that within the range of N180 and N240 of the nitrogen application rate, the response of water use efficiency to the N application rate was not significantly different in deficient water years, but in abundant water years and normal water years. It increased significantly with the increase in N application rate, and in deficient water years, normal water years, and abundant water years, at the N application rate of N240, it promoted the growth of deep roots and water utilization and increased the yield and water use efficiency of dryland wheat []. The factors influencing the quality of wheat grains include genes, the environment, and their interactions. Among them, genetic factors are the basis for affecting the quality of wheat grains [], but cultivation measures and environmental conditions also play an important role in the formation of wheat grain quality. Although high-quality varieties have the potential for high-quality production, to achieve final high-quality and high-yield production, the N fertilizer, as one of the important cultivation measures, plays a decisive role in crop production and significantly affects the quality of grains []. In the field, N fertilizer management can be regulated by controlling the action mode of sources and sinks, such as during the differentiation stage of young spikes, and the N fertilizer can significantly increase the quality of crops by regulating the number of spikes []. During the filling period, the N stored during the flowering stage determines the total amount of re-translated N, so an adequate supply of exogenous N can promote the accumulation of proteins and the quality of grains by delaying senescence and increasing N reserves [].
The N fertilizer can promote the assimilation of carbon in wheat after flowering, but it is not conducive to the redistribution of assimilates from vegetative organs to grains []. Through different N application experiments found that the range of N240 increases in the N fertilizer can increase the total starch content and the content of each component of grains and reduce the direct branch ratio, but the N0 differences between treatments were not significant []. In the early stage of wheat growth, fertilization can increase the accumulation of starch in grains, but the effect of fertilization on starch content at the grain maturity stage is not significant. Under high-fertilization conditions, there is a tendency for protein content to decrease. With the increase in N application amount, the total starch content slightly increased, but the difference was not significant, and the changes in the ratio of direct to branched starch did not reach a significant level, indicating that the N fertilizer cannot significantly regulate the viscosity characteristics of flour []. The N fertilizer affects the formation of wheat quality traits, and increasing N fertilizer application can effectively regulate the nutritional quality and processing quality of wheat grains, as well as the nutritional quality and processing quality of flour. However, different N application levels and application periods have differences in wheat grain quality. Generally, protein content and various essential amino acids increase with the increase in N application amount. High-yield and high-protein varieties generally have strong photosynthetic capacity, which can increase yield and protein content by generating more photosynthetic products. High-protein wheat has a strong nitrogen absorption capacity and N utilization efficiency, so the nutritional quality improves with the increase in N amount.
5. Conclusions
The experiment aimed to quantify the effect of agricultural practices, particularly nitrogen (N) fertilizer management; the experimental two cultivars were Yunhan–20410 and Yunhan–618, and the field management practices significantly increased the crop WUE, where N fertilizer management had positive effects on soil available nitrogen distribution, content, nitrogen surplus, yield stability and sustainability. Higher N rates of N210 enhanced water consumption during the node-flowering and flowering-maturity time period. YH–618 displays higher water use during sowing–greening and node-flowering, but lower compared to YH–20410. The N210 treatment under YH–618 maximized the water use efficiency (WUE). We consider our findings to provide a novel visual perception that may assist the improvement in coordinated agricultural management practices for efficient crop water use and sustainable production in the Loess Plateau region. The valuable insights for precision agriculture in semi-arid regions help optimize N and water use for sustainable wheat production. However, further improvement in N levels, such as through coated compound fertilizers and the integration of the water fertilizer method, is required to achieve both soil sustainability and environmental safety.
Author Contributions
Conceptualization, Z.G. and F.N.; methodology, M.F.S.; software, M.A.; validation, H.N., F.N. and M.F.S.; formal analysis, F.N.; investigation, Z.G.; resources, H.N.; data curation, H.N.; writing—original draft preparation, H.N.; writing—review and editing, H.N.; visualization, M.A.; supervision, H.N.; project administration, H.N.; funding acquisition, H.N. All authors have read and agreed to the published version of the manuscript.
Funding
The authors acknowledge the ongoing Research Funding Program (ORF–2025–751), King Saud University, Riyadh, Saudi Arabia, in supporting the current study.
Data Availability Statement
The original contributions presented in this study are included in the article. Further inquiries can be directed to the corresponding author(s).
Conflicts of Interest
The authors declare no conflicts of interest.
References
- Duan, J.; Shao, Y.; He, L.; Li, X.; Hou, G.; Li, S.; Feng, W.; Zhu, Y.; Wang, Y.; Xie, Y. Optimizing nitrogen management to achieve high yield, high nitrogen efficiency and low nitrogen emission in winter wheat. Sci. Total Environ. 2019, 697, 134088. [Google Scholar] [CrossRef]
- Biradar, C.; Thenkabail, P.; Noojipady, P.; Li, Y.; Dheeravath, V.; Turral, H.; Velpuri, M.; Gumma, M.K.; Gangalakunta, O.R.P.; Cai, X.L.; et al. A global map of rainfed cropland areas (GMRCA) at the end of last millennium using remote sensing. Int. J. Appl. Earth Obs. 2009, 11, 114–129. [Google Scholar] [CrossRef]
- Wang, J.; Hussain, S.; Sun, X.; Zhang, P.; Chen, X. Effects of Nitrogen Application Rate Under Straw Incorporation on Photosynthesis, Productivity and Nitrogen Use Efficiency in Winter Wheat. Front. Plant Sci. 2022, 13, 862088. [Google Scholar] [CrossRef]
- Groos, C.; Robert, N.; Bervas, E.; Charmet, G. Genetic analysis of grain protein-content, grain yield and thousand-kernel weight in bread wheat. Theor. Appl. Genet. 2003, 106, 1032–1040. [Google Scholar] [CrossRef] [PubMed]
- Noor, H.; Shah, A.A.; Ding, P.; Ren, A.; Sun, M.; Gao, Z. Long-term nutrient cycle inimproved grain yield of dryland winter wheat (Triticum aestivum L.) under hydrological process of plant ecosystem distribution in the loess plateau of China. Plants 2023, 12, 2369. [Google Scholar] [CrossRef] [PubMed]
- Liu, J.; Shen, Y.; Zeng, C.; Zhang, J.; Shi, S.; Xue, L.; Jia, Y.; Li, J.; Liang, X. Effects of Sowing Time on Yield and Quality of Winter and Spring Wheat Varieties. Sustainability 2025, 17, 2479. [Google Scholar] [CrossRef]
- Tosi, P.; Parker, M.; Gritsch, C.; Carzaniga, R.; Martin, B.; Shewry, P.R. Trafficking of storage proteins in developing grain of wheat. Exp. Bot. 2009, 60, 979–991. [Google Scholar] [CrossRef] [PubMed]
- Kuipers, A.; Jacobsen, E.; Visser, R. Formation and deposition of amylose in the potato tuber affected by the reduction of granule- bound starch synthase gene expression. Plant Cell 1994, 6, 43–52. [Google Scholar] [CrossRef] [PubMed][Green Version]
- Wang, X.; Liu, F. Effect of elevated CO2 and heat on wheat grain quality. Plants 2021, 10, 1027. [Google Scholar] [CrossRef] [PubMed]
- Wang, D.; Li, F.; Cao, S.; Zhang, K. Genomic and functional genomics analyses of gluten proteins and prospect for simultaneous improvement of end-use and health-related traits in wheat. Theor. Appl. Genet. 2020, 133, 1521–1539. [Google Scholar] [CrossRef]
- Noor, H.; Sun, M.; Gao, Z. Effects of Nitrogen Fertilizer on Photosynthetic Characteristics and Yield. Agronomy 2023, 13, 1550. [Google Scholar] [CrossRef]
- Govindasamy, P.; Muthusamy, S.K.; Bagavathiannan, M.; Tiwari, G. Nitrogen use efficiency—A key to enhance crop productivity under a changing climate. Front. Plant Sci. 2023, 14, 1121073. [Google Scholar] [CrossRef] [PubMed]
- Yu, F.; Noor, H.; Noor, F. Effects of different winter wheat (Triticum aestivum L.) varieties addressing the agriculture climate interactions in temperature regions of yield. Atmosphere 2025, 16, 189. [Google Scholar] [CrossRef]
- Lee, M.; Swanson, B.; Bailk, B. Influence of anylise content on properties of wheat starch and bread making quality of starch and gluten blends. Cereal Chem. 2001, 78, 701–706. [Google Scholar] [CrossRef]
- Li, R.; Hou, X.; Jia, Z.; Han, Q.; Ren, X. Effects on soil temperature, moisture, and maize yield of cultivation with ridge and furrow mulching in the rainfed area of the Loess Plateau, China. Agric. Water Manag. 2013, 116, 101–109. [Google Scholar] [CrossRef]
- Morita, N.; Maeda, T.; Miyazaki, M. Dough and baking properties of high-anylose and waxy wheat flours. Cereal Chem. 2002, 79, 491–495. [Google Scholar] [CrossRef]
- Amalia, Z.; Jeroen, L.; Stijn, S. Electronic nose systems to study shelf life and cultivar effect on tomato aroma profile. Sensor. Actuators B-Chem. 2004, 97, 324–333. [Google Scholar]
- Vlasov, Y.; Legin, A.; Rudnitskaya, A.; Di Natale, C.; D’AMico, A. Nonspecific sensor arrays (electronic tongue) for chemical analysis of liquids (IUPAC Technical Report). Pure Appl. Chem. 2005, 77, 1965–1983. [Google Scholar] [CrossRef]
- Sliwinska, M.; Wisniewska, P.; Dymerski, T.; Namieśnik, J.; Wardencki, W. Food analysis using artificial senses. J. Agric. Food Chem. 2014, 62, 1423–1448. [Google Scholar] [CrossRef] [PubMed]
- Garrido-Delgado, R.; Mercader-Trejo, F.; Sielemann, S.; de Bruyn, W.; Arce, L.; Valcárcel, M. Direct classification of olive oils by using two types of ion mobility spectrometers. Anal. Chim. Acta 2011, 696, 108–115. [Google Scholar] [CrossRef]
- Garrido-Delgado, R.; Dobao-Prieto, M.; Arce, L.; Aguilar, J.; Cumplido, J.L.; Valcárcel, M. Ion mobility spectrometry versus classical physic-chemical analysis for assessing the shelf life of extra virgin olive oil according to container type and storage conditions. J. Agric. Food Chem. 2015, 63, 2179–2188. [Google Scholar] [CrossRef]
- Arroyo-Manzanares, N.; Martin-Gomez, A.; Juradocampos, N.; Garrido-Delgado, R.; Arce, C.; Arce, L. Target vs. spectral fingerprint data analysis of Iberian ham samples for avoiding labeling fraud using headspace-gas chromatography-ion mobility spectrometry. Food Chem. 2018, 246, 65–73. [Google Scholar] [CrossRef] [PubMed]
- Noor, H.; Yan, Z.; Sun, P.; Zhang, L.; Ding, P.; Li, L.; Ren, A.; Sun, M.; Gao, Z. Effects of Nitrogen on Photosynthetic Productivity and Yield Quality of Wheat (Triticum aestivum L.). Agronomy 2023, 13, 1448. [Google Scholar] [CrossRef]
- Xi, J.; Zha, Q.; Xu, D.; Jin, Y.; Wu, F.; Jin, Z.; Xu, X. Volatile compounds in Chinese steamed bread influenced by fermentation time, yeast level and steaming time. LWT 2021, 141, 110861. [Google Scholar] [CrossRef]
- Riccardo, D.; Giampiero, S.; Dino, M. Wheat classification according to its origin by an implemented volatile organic compounds analysis. Food Chem. 2021, 341, 128217. [Google Scholar] [CrossRef]
- Senapati, N.; Semenov, M. Large genetic yield potential and genetic yield gap estimated for wheat in Europe. Glob. Food Secur. 2020, 24, 100340. [Google Scholar] [CrossRef] [PubMed]
- Noor, H.; Sun, M.; Lin, W.; Gao, Z. Effect of different sowing methods on water use efficiency and grain yield of wheat in the Loess Plateau, China. Water 2022, 14, 577. [Google Scholar] [CrossRef]
- GB/T 21986-2008; Assessment of Agroclimate Impact: Classfication Method of Annual Crop Climate Types. Standardization Administration of China (SAC): Beijing, China, 2008.
- Mbuthia, L.W.; Acoata-martinez, V.; Debruyn, J.; Schaeffer, S.; Tyler a, D.; Odoi, E.; Mpheshea, M.; Walker, F.; Eash, N. Long term tillage, cover crop, and fertilization Effect on microbial community structure, activity: Implications for soil quality. Soil Biol. Biochem. 2015, 89, 24–34. [Google Scholar] [CrossRef]
- Qi, Y.; Ossowicki, A.; Yang, X.; Lwanga, E.H.; Dini-Andreote, F.; Geissen, V.; Garbeva, P. Effect of plastic mulch film residues on wheat rhizosphere and soil properties. J. Hazard. Mater. 2020, 387, 121711. [Google Scholar] [CrossRef]
- Rasmussen, I.; Thorup-Kristensen, K. Does earlier sowing of winter wheat improve root growth and N uptake. Field Crops Res. 2016, 196, 10–21. [Google Scholar] [CrossRef]
- Cetin, O.; Akinci, C. Effects of drought on optimizing nitrogen use of winter wheat in a semi-arid region. Agric. For. 2015, 61, 287–293. [Google Scholar] [CrossRef]
- Cao, H.; Wang, Z.; He, G.; Dai, J. Tailoring NPK Fertilizer Rates to Precipitation for Dryland Winter Wheat in the Loess Plateau. Field Crops Res. 2017, 209, 88–95. [Google Scholar] [CrossRef]
- Ehdaie, B.; Waines, J.G. Sowing date and nitrogen rate Effect on dry matter and nitrogen partitioning in bread and durum wheat. Field Crops Res. 2001, 73, 47–61. [Google Scholar] [CrossRef]
- Hirel, B.; Le Gouis, J.; Ney, B.; Gallais, A. The challenge of improving nitrogen use efficiency in crop plants: Towards a more central role for genetic variability and quantitative genetics within integrated approaches. J. Exp. Bot. 2007, 58, 2369–2387. [Google Scholar] [CrossRef] [PubMed]
- Wang, Y.; Huang, S.; Liu, R.; Jin, J. Effect of nitrogen application on flavor compounds of cherry tomato fruits. J. Soil Sci. Plant Nut. 2007, 170, 461–468. [Google Scholar] [CrossRef]
- Tian, Z.; Wang, F.; Dai, T.; Jin, J. Characteristics of dry matter accumulation and translocation during the wheat genetic improvement and their relationship to grain yield. Sci. Agric. Sin. 2012, 45, 801–808. [Google Scholar]
- Luo, C.; Zhang, X.; Duan, H.; Mburu, D.M.; Kavagi, L.; Naseer, M.; Dai, R.-Z.; Nyende, A.B.; Batool, A.; Xiong, Y.-C. Allometricrelation ship and yield formation in response to planting density under ridge-furrow plastic mulching in rainfed wheat. Field Crops Res. 2020, 251, 107785. [Google Scholar] [CrossRef]
- Yu, S.; Chen, Y.; Yu, S.; Dong, Q.Y.; Zhou, X.B.; Li, Q.Q.; Wu, W.; Sun, N.N. Study on Dynamic Changes of Soil Water in Winter Wheat Field of Furrow Planting and Bed Planting. J. Soil Water Conserv. 2005, 19, 133–137. [Google Scholar]
- Hu, G.-P.; Zou, J.G.; Zheng, W.; Zhu, Z.W.; Gao, C.B. Effect of planting methods on the growth and yield of wheat in rice-wheat rotation. Hubei Agric. Sci. 2014, 53, 4814–4816. [Google Scholar]
- Han, J.; Jia, Z.; Wu, W.; Li, C.; Han, Q.; Zhang, J. Modeling impacts of film mulching on rainfed crop yield in Northern China with DNDC. Field Crops Res. 2014, 155, 202–212. [Google Scholar] [CrossRef]
- Chen, Y.; Liu, T.; Tian, X.; Wang, X.; Li, M.; Wang, S.; Wang, Z. Effect of plastic film combined with straw mulch on grain yield and water use efficiency of winter wheat in Loess Plateau. Field Crops Res. 2015, 172, 53–58. [Google Scholar] [CrossRef]
Disclaimer/Publisher’s Note: The statements, opinions and data contained in all publications are solely those of the individual author(s) and contributor(s) and not of MDPI and/or the editor(s). MDPI and/or the editor(s) disclaim responsibility for any injury to people or property resulting from any ideas, methods, instructions or products referred to in the content. |
© 2025 by the authors. Licensee MDPI, Basel, Switzerland. This article is an open access article distributed under the terms and conditions of the Creative Commons Attribution (CC BY) license (https://creativecommons.org/licenses/by/4.0/).