Abstract
Groundwater in the Qingshui River Plain of southern Ningxia is one of the main water sources for local domestic and agricultural use. However, due to the geological background of the area, 33.94% of the groundwater samples had fluoride concentrations that exceeded the WHO drinking water standards. To examine the spatial patterns and formation processes of fluoride in groundwater, researchers gathered 79 rock samples, 2618 soil samples, 21 sediment samples, 138 groundwater samples, and 82 surface water samples across the southern Qingshui River Plain. The collected data were analyzed using statistical approaches and hydrogeochemical diagrams. The findings reveal that fluoride levels in groundwater exhibit a gradual increase from the eastern, western, and southern peripheral sloping plains toward the central valley plain. Vertically, higher fluoride concentrations are found within 100 m of depth. Over a ten-year period, fluoride concentrations have shown minimal variation. Fluoride-rich rocks, unconsolidated sediments, and soils are the primary sources of fluoride in groundwater. The primary mechanisms governing high-fluoride groundwater formation are rock weathering and evaporative concentration, whereas cation exchange adsorption promotes fluoride (F−) mobilization into the aquifer. Additional sources of fluoride ions include leaching of fluoride-rich sediments during atmospheric precipitation infiltration and recharge from fluoride-rich surface water.
1. Introduction
Fluoride is a trace element commonly found in groundwater and is also an essential micronutrient for the human body. Both insufficient and excessive intake of fluoride can lead to health issues. Insufficient fluoride intake is associated with dental caries, while excessive intake can result in chronic systemic poisoning, manifested as dental fluorosis and skeletal fluorosis [1,2,3,4]. According to health department statistics, approximately 87.28 million people in China are threatened by high-fluoride groundwater. The genesis of high-fluoride groundwater can generally be classified into four types: evaporation–concentration, leaching–enrichment, seawater intrusion, and geothermal springs [5]. However, in specific regions, multiple influencing factors and dominant mechanisms often coexist, or groundwater fluoride can be categorized into different types depending on the hydrogeological conditions.
Chronic consumption of high-fluoride groundwater can cause fluorosis, a condition reported in many low-income regions globally, including India, China, Tanzania, Mexico, Argentina, and South Africa [6,7]. In China, fluorosis linked to drinking water is prevalent in 29 provinces and autonomous regions, particularly in the northern, northeastern, and northwestern areas [8]. High-fluoride groundwater is commonly found in shallow aquifers (<50 m) in arid and semi-arid regions of China, such as the central-west Songnen Plain, western Songliao Plain, eastern Inner Mongolia, Hulunbuir Highland, Junggar Basin, Tarim Basin, Qaidam Basin, Hexi Corridor, Guanzhong Basin, Datong Basin, Taiyuan Basin, Yuncheng Basin, Hohhot Basin, Hetao Plain, and the Yellow River Delta [9]. Factors like arid and semi-arid climates, strong evaporation, ion exchange, and slow groundwater flow contribute to fluoride accumulation in these shallow groundwater sources. Fluorine is ubiquitous in the environment, and fluoride pollution in groundwater is mainly caused by natural processes and human factors. Natural sources include geological environment, water–rock interactions, seawater intrusion, bedrock weathering, and soil erosion [10,11]. Fluoride is present in many diagenetic minerals, which are considered the largest natural source of fluoride in natural water bodies [12]. The most common fluorine-containing minerals include fluorite (CaF2), mica, apatite (Ca5[PO4]3) (F, Cl, OH), cryolite (Na3[AIF6]), and amphibole [13,14,15], which release F− through weathering, dissolution, and ion exchange reactions [16,17,18]. In addition, human activities may lead to further input of fluoride into groundwater, such as fertilization, coal combustion, and subsequent rainfall and managed aquifer recharge [19,20,21].
The Qingshui River Plain’s groundwater supports socio-economic development, yet locally exceeds drinking standards (F− > 1 mg/L), endangering public health. Current studies focus on water quality [22], neglecting integrated rock–soil–water analyses. Based on hydrogeological and geochemical surveys, this work examines fluoride distribution, sources, and genesis in the southern plain to inform drinking water safety and regional applications.
2. Materials and Methods
2.1. Study Area
Qingshui River is located in the inland warm temperate semi-arid zone and is the largest river in Ningxia. It originates from the Liupan Mountains and flows northward into the Yellow River; the water systems on its left and right banks are asymmetrically distributed, with the drainage area on the right bank being larger than that on the left. On the upper reaches, tributaries such as the Dongzhi River and Zhonghe River flow into the left bank, while larger branches such as the Yangdazi Gully enter from the right bank, and key reservoirs such as the Shangdianzi, Dongzhi River, and Shenjia River reservoirs have been built. The multi-year average rainfall is 444.7 mm, and the evaporation is 1515.8 mm. The Qingshui River Plain is a major population-concentrated area in southern Ningxia and forms a semi-enclosed hydrogeological basin unit opening to the north under the control of regional tectonics, composed of the bedrock mountainous areas in the west and south and the loess hills in the east. The Quaternary sediments in the basin reach a maximum thickness of 500 m, and the area north of Sanying, where the Quaternary basement rises somewhat, serves as the northern boundary of this study area (Figure 1).
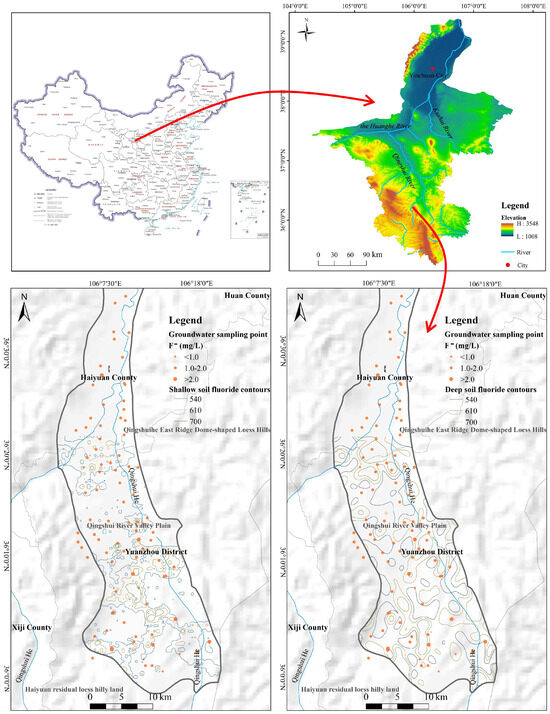
Figure 1.
Spatial distribution of fluoride concentration in groundwater and deep (left) and shallow (right) soil in the southern section of the Qingshui River Plain.
The eastern, western, and southern parts of the study area are inclined plains, while the central part is a river valley plain, containing relatively abundant pore water within Quaternary loose rock formations. The aquifer lithology is mainly composed of gravel layers from the Pleistocene and Holocene alluvial and proluvial deposits, as well as alluvial sand and sandy gravel layers. Vertically, the aquifers can be roughly divided into unconfined water and confined water at a depth of approximately 100–120 m. Groundwater recharge mainly comes from vertical infiltration of surface water in the gullies of the mountain-front alluvial fans in the south and southwest, lateral runoff of fissure water from the bedrock in the mountainous areas, and infiltration of atmospheric precipitation. Groundwater flows from the recharge zones at the mountain front toward the inclined plains and river valley plain, from both the east and west sides toward the center, and from south to north, with the groundwater flow gradually slowing down. The Qingshui River receives recharge from both surface water and groundwater from the surrounding hilly areas and, in its northward flow, becomes a runoff and discharge channel for both groundwater and surface water, forming a groundwater runoff–discharge area. Strong evaporation causes phreatic evaporation to become an important discharge method, in addition to downstream runoff and extraction by mechanical wells. Due to the mixed exploitation of groundwater in the area and the close hydraulic connection between different aquifers, most of the confined water samples collected in this study are mixed water samples.
2.2. Sampling and Analysis
A total of 2081 topsoil samples (66 tested) were collected from the Guyuan area in the Qingshui River Basin, with a sampling depth of 0–20 cm; 537 deep soil samples (16 tested) were collected at depths of 1.2–2.0 m; 21 river, lake, and pond sediment samples were collected at depths of 0–20 cm; 79 outcrop bedrock samples of different lithologies and 82 groups of surface water samples were also collected. In July 2023 and May 2024, a total of 102 groups of groundwater samples and 36 groups of hydrogen and oxygen isotope samples were collected from the southern section of the Qingshui River Plain, with groundwater samples obtained from local motor-pumped and household wells.
The collected soil samples were prepared according to relevant specifications and sent to the Laboratory of the Geophysical Prospecting Institute of China Metallurgical Geology Bureau for testing. All samples were tested solely for fluoride content. The testing method was the ion-selective electrode method (Metrohm 6.0502.150, Shanghai Wanjie Technology Co., Ltd., Shanghai, China), with a detection limit of 100 μg/g. Water samples were stored in sealed polyethylene plastic bottles and sent to the laboratory for analysis. The main testing items included pH, total hardness, total dissolved solids (TDSs), F−, Cl−, NO3−, SO42−, HCO3−, Na+, Ca2+, Mg2+, K+, δD, and δ18O. The testing methods were as follows: pH was measured using a glass electrode method; TDS by gravimetric method; fluoride ion by an ion-selective electrode method; Cl−, NO3−, and SO42− by ion chromatography; HCO3− by a titration method; Na+, K+, Ca2+, and Mg2+ by flame atomic absorption spectrometry. Isotope samples were tested using a Picano mass spectrometer (Beijing Pulitai Technology Instrument Co., Ltd., Beijing, China), with δD and δ18O precisely measured to 0.1‰ and 0.025‰, respectively, and the results are expressed in the VSMOW standard [23].
To verify the accuracy of the data, the charge balance error (%CBE) was calculated for all hydrochemical testing results. Over 95% of the samples exhibited %CBE values within the acceptable range of ±5%, confirming the reliability of the dataset for the study area.
3. Results and Discussion
3.1. Fluoride Content and Distribution Characteristics in Soil, Sediment, Surface Water, and Rock
According to the Geochemical Assessment Standard for Land Quality (DD2014) [24], soil with fluoride content between 540 and 610 mg/kg is classified as high-fluoride soil, and that with content greater than 610 mg/kg is considered fluoride-excess soil. Among the 2015 surface soil samples, fluoride content ranges from 297 to 1786 mg/kg, with both the mean and median values exceeding the national background level. There were 449 high-fluoride soil samples and 287 fluoride-excess soil samples (Figure 2), accounting for 22.3% and 14.2% of the total, respectively, and 36.5% combined. These high-fluoride and fluoride-excess soils are mainly distributed in Kaicheng Township in the south, forming a near north–south trending belt along the flanks of the mountains; and in the central-western region, from Zhonghe Township through Pengpu Town to Touying Town, forming an irregular northeast–east trending strip in the central valley plain, with a relatively large area of fluoride anomalies. Among the 521 deep soil samples, fluoride content ranges from 394 to 1606 mg/kg, with both the mean and median values also higher than the national background level; 192 samples were classified as high-fluoride soil and 233 as fluoride-excess soil (Figure 2), accounting for 36.9% and 44.7% of the total, respectively, or 81.6% combined. The fluoride content in deep soil generally meets the high-fluoride area standard, indicating a high background anomaly in deep soils across the study area.

Figure 2.
Statistical summary of fluoride content in soil and sediment in the southern section of the Qingshui River Plain.
The coefficient of variation for fluoride content is low (18–23%), indicating a relatively uniform spatial distribution. However, in the horizontal plane, surface soil fluoride content in the southern mountainous area is higher than that in the central valley plain and the eastern loess hilly region, with the valley plain having higher content than the eastern loess hills. Within the 0–2 m depth range of the surface, fluoride content increases with soil depth, with deep soil showing higher fluoride levels than surface soil. This may be attributed to the leaching of water-soluble fluoride from surface soil through surface runoff or its downward migration and enrichment due to leaching and infiltration.
Based on the surface water sampling, a total of 21 sediment samples were collected simultaneously. The total fluoride content in the sediments ranged from 536 to 1035 mg/kg, with an arithmetic mean of 684 mg/kg, which is higher than the national average for sedimentary rocks (420 mg/kg). Eight samples reached the fluoride surplus level, with the maximum value reaching 1035 mg/kg. The corresponding surface water sample had a fluoride concentration of 4.33 mg/L, and other samples showed similar correspondence. Overall, the fluoride content in sediments and surface water exhibited approximately synchronous fluctuations, indicating mutual influence between fluoride ion concentrations in sediments and surface water.
The Daying River, a tributary of the Qingshui River located in the southwestern part of the study area (Figure 3), has fluoride ion concentrations ranging from 0.8 to 1.93 mg/L, with an average of 1.27 mg/L. The Dongzhi River, situated in the central–southwestern area, shows fluoride concentrations between 0.91 and 2.01 mg/L, averaging 1.46 mg/L. Choushuigou, a tributary of the Dongzhi River, has a perennial trickle with extremely high salinity, which infiltrates the ground at the outlet; its fluoride content ranges from 3.94 to 4.33 mg/L, indicating generally elevated levels. The Zhonghe River, located in the northern part of the study area, exhibits fluoride concentrations between 1.27 and 1.34 mg/L, with an average of 1.30 mg/L, and flows into the Qingshui River. Along the main course of the Qingshui River, fluoride concentrations increase from 0.72 mg/L upstream of the Shenjiahe Reservoir to 1.38 mg/L downstream of the Duzhuang Reservoir, which is likely related to the inflow of tributaries with high fluoride content.

Figure 3.
Statistical chart of fluoride ion concentrations in river water in the southern section of the Qingshui River Plain.
Fluoride content varies significantly among the different rock types in the study area. As shown in Figure 4, the order of average fluoride content is as follows: calcareous mudstone > silty mudstone > claystone > shale > sandstone, with values ranging from 638 to 1490 mg/kg. These levels are 1.5 to 3.5 times higher than the national average fluoride content in rocks (420 mg/kg), indicating that the study area has a high-fluoride geological background. Moreover, the high-fluoride rocks are mainly concentrated in the southwestern region, a pattern that corresponds closely to the observed anomalies in soil samples.

Figure 4.
Distribution of fluoride content in rocks from the southern section of the Qingshui River Plain.
3.2. Groundwater Fluoride Content Distribution and Hydrochemical Characteristics
3.2.1. Groundwater Fluoride Content Distribution
High-fluoride groundwater exhibits a certain degree of spatial zonation. Vertically (Figure 5), groundwater samples at depths greater than 100 m generally have fluoride concentrations between 1 and 2 mg/L. For samples from depths shallower than 100 m, most also fall within the 1–2 mg/L range, but some exceed 2 mg/L, with a maximum value of 5.30 mg/L. Considering the confined aquifer roof depth at approximately 100–120 m, it is generally observed that the fluoride concentration in shallow unconfined water is higher than that in confined groundwater. Horizontally, from the sloping plains on the east, west, and south sides to the central river valley plain, groundwater fluoride concentrations tend to increase (Figure 5). In terms of temporal variation, a comparison was made with some data from the same sampling locations collected a decade earlier. The results show that F− concentrations only exhibited slight fluctuations, with no significant differences.
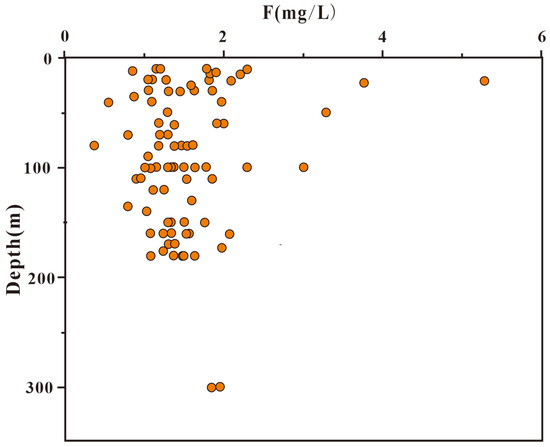
Figure 5.
Distribution of fluoride concentrations at different depths.
3.2.2. Hydrochemical Characteristics of Groundwater
The basic hydrochemical characteristics of groundwater can reflect its conditions and provide a basis for studying its overall evolution and formation processes [25]. In the study area, groundwater pH values range from 7.24 to 8.46 (averaging at 7.90), indicating weak alkalinity. The quantities of total dissolved solids (TDSs) range from 132.00 to 18,950.00 mg/L (averaging at 2647.07 mg/L), suggesting slightly brackish to brackish water in some areas. F− concentrations range from 0.25 to 5.30 mg/L (average 1.47 mg/L).
In groundwater, major anions are present in the order SO42− > Cl− > HCO3−, with SO42− comprising 57% of the total anions. For cations, the order is Na+ > Mg2+ > Ca2+ > K+, with Na+ comprising 68% of the total cations (Table 1). The hydrochemical type transitions from bicarbonate and bicarbonate–sulfate types in the south to sulfate–chloride types in the north.

Table 1.
Statistical analysis of groundwater hydrochemistry in the study area.
The Piper trilinear diagram illustrates variations in major ion composition and the hydrochemical characteristics of groundwater, and is used to classify hydrochemical types [26]. According to Figure 6, the groundwater in the study area can be divided into four hydrochemical types: SO4·Cl-Ca·Mg type (Region 1), HCO3-Na type (Region 2), HCO3-Ca·Mg type (Region 3), and SO4·Cl-Na type (Region 4). Most groundwater samples fall within Region 4 (SO4·Cl-Na type), followed by Region 1 (SO4·Cl-Ca·Mg type) and Region 3 (HCO3-Ca·Mg type). Only three samples (2.75%) are classified as HCO3-Na type. Furthermore, the Piper diagram shows that high-fluoride groundwater samples (F− > 2.0 mg/L) are mainly of the SO4·Cl-Na type, suggesting a correlation between fluoride concentrations and SO42−, Cl−, and Na+ concentrations.
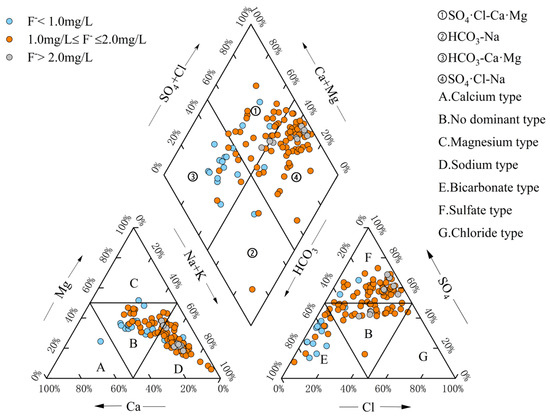
Figure 6.
Piper trilinear diagram of groundwater.
3.2.3. Relationship Between Fluoride and Other Hydrochemical Parameters
Based on the scatter plots of fluoride and related hydrochemical indicators (Figure 7), it can be observed that the fluoride concentration in groundwater tends to decrease with increasing concentrations of Ca2+ and Mg2+, indicating a negative correlation between these cations and fluoride. In contrast, HCO3− and pH show a clear positive correlation with fluoride concentration, suggesting that the presence of HCO3− and higher pH values may promote the release of fluoride into groundwater, where R equals 0.50 and 0.44, respectively. Additionally, TDS and Na+ exhibit a positive correlation with fluoride concentration within certain concentration ranges.

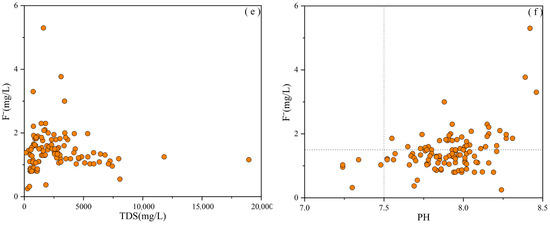
Figure 7.
Correlation between fluoride concentration and other ionic components in groundwater (a) Ca2+/F−; (b) Mg2+/F−; (c) Na+/F−; (d) HCO3−/F−; (e) TDS/F−; (f) pH/F−.
Groundwater pH positively correlates with fluoride (F−) concentration; as the pH rises, F− levels tend to increase. In the study area, groundwater pH ranges from 7.24 to 8.46, indicating a weakly alkaline environment. High-fluoride groundwater (F− > 1.5 mg/L) is predominantly found in samples with pH values above 7.5. In alkaline conditions, mineral surfaces typically carry neutral or negative charges, reducing their capacity to adsorb F−. Additionally, as the OH− concentration in groundwater increases, competitive adsorption occurs between OH− and F− due to their similar ionic radii. OH− can displace F− from fluorine-bearing minerals, releasing F− into groundwater and increasing its concentration [1,27,28,29]. HCO3− also correlates positively with F− concentration. HCO3− can undergo hydrolysis (Equation (1)), producing OH−, which in turn promotes the release of F−. Additionally, HCO3−, being negatively charged, competes with F− for adsorption sites on mineral surfaces, thereby inhibiting F− adsorption and increasing its concentration in groundwater [14].
HCO3− + H2O = CO2 ↑ + OH−
3.3. Sources of Fluoride in Groundwater
In the southern section of the Qingshui River Plain, the average fluoride content in bedrock types—such as calcareous mudstone, silt-bearing mudstone, claystone, shale, and sandstone—ranges from 638 to 1490 mg/kg, which is approximately 1.5 to 3.5 times higher than the national average fluoride content of sedimentary rocks in China (420 mg/kg). The average and median fluoride content in both shallow and deep soil layers also exceed the national soil average, with fluoride-excessive samples accounting for 36.5% in shallow soils and up to 81.6% in deep soils. Additionally, the fluoride content in riverbed sediments is 1.28 to 2.46 times higher than the national average for sedimentary rocks.
Sediments obtained from boreholes in the study area can be categorized into five lithologic types: clay, silty clay, silt, fine sand, and coarse sand. According to mineralogical analysis, the major mineral components of the Quaternary sediments include quartz, feldspar, mica, calcite, kaolinite, chlorite, and amphibole. Among these, the mica content ranges from 8% to 15%, while the amphibole content in silts and sands is between 3% and 7%. Notably, minerals such as muscovite (KAl2AlSi3O102), biotite (KMg3AlSi3O102), and amphibole (A0–1×2–3Y5Z8O222) all contain fluorine.
These fluorine-rich rocks and their weathered products—fluorine-enriched unconsolidated sediments and soils—provide the material basis for the formation of high-fluoride groundwater. Among these, mica is considered the primary source of fluoride in the groundwater of this region.
3.3.1. Influence of Water–Rock Interaction and Evaporation
The ionic composition of groundwater is governed by multiple factors, including lithology, atmospheric precipitation, temperature, and regional hydrogeological conditions [30,31]. The Gibbs diagram is a useful tool for revealing mechanisms of hydrochemical evolution [32,33]. As shown in the Gibbs diagram based on statistical analysis (Figure 8), the enrichment of ions in groundwater is primarily controlled by evaporation concentration and rock weathering, and precipitation is also a minor influencing factor.

Figure 8.
Gibbs diagram of groundwater (a) Cl−/(Cl−+HCO3−); (b) Na+/(Na++Ca2+).
Most groundwater sampling points in the study area are in rock weathering and evaporation zones with TDSs > 200 mg/L. In the TDS–Cl−/(Cl− + HCO3−) diagram, high-fluoride samples (F− > 1.0 mg/L) are mainly found in the rock-weathering zone and at its boundary with the evaporation zone. This suggests that fluoride enrichment in groundwater is primarily driven by rock weathering and evaporation concentration.
In the TDS–Na+/(Na+ + Ca2+) diagram, most high-fluoride samples fall in the rock weathering and evaporation zones where Na+/(Na+ + Ca2+) > 0.5. A few points lie outside the defined zones but close to the value of 1, indicating that besides weathering and evaporation, cation exchange and other hydrogeological processes also play a role in forming high-fluoride groundwater.
To explore the impact of rock weathering and dissolution on groundwater chemistry, the molar ratios of Ca2+/Na+, Mg2+/Na+, and HCO3−/Na+ were examined. As depicted in Figure 9, most groundwater samples cluster near the silicate weathering end-member, suggesting that the groundwater chemistry is mainly influenced by the weathering and dissolution of silicate minerals (e.g., feldspar, mica, kaolinite, chlorite, and amphibole).
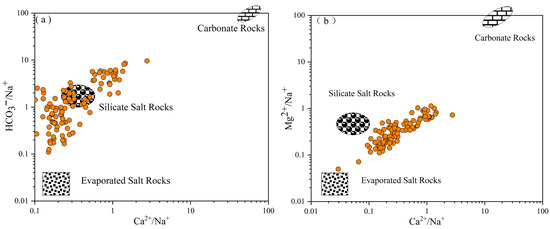
Figure 9.
Relationships between HCO3−/Na+, Mg2+/Na+, and Ca2+/Na+ in groundwater (a) (Ca2+/Na+)/(HCO3−/Na+); (b) (Ca2+/Na+)/(Mg2+/Na+).
3.3.2. Cation Exchange Processes
The direction and intensity of the cation exchange were analyzed using the Chloro-Alkaline Indices (CAIs), specifically CAI-1 \[N(Cl− − Na+ − K+)/N(Cl−)] and CAI-2 \[N(Cl− − Na+ − K+)/N(SO42− + HCO3− + CO32− + NO3−)]. A CAI less than zero indicates forward cation exchange, where Ca2+ in groundwater replaces Na+ in the aquifer matrix (Equation (2)). Conversely, a CAI greater than zero indicates reverse cation exchange, where Na+ in groundwater replaces Ca2+ in the aquifer matrix (Equation (3)). Moreover, the absolute value of CAI is positively correlated with the intensity of ion exchange—greater absolute values suggest stronger ion exchange reactions [1,34,35].
As shown in Figure 10, all CAI values for groundwater samples in the Qingshui River Plain fall below zero, indicating that forward cation exchange is dominant in the region. This suggests that Ca2+ in groundwater replaces Na+ in the aquifer matrix, resulting in decreased Ca2+ and increased Na+ concentrations in groundwater, thereby promoting the release of F− from aquifer materials. The reaction process is as follows:
Ca2+ + 2 NaX → CaX2 + 2 Na+
Na+ + CaX2 → Ca2+ + 2 NaX

Figure 10.
Chloro-alkaline indices diagram of groundwater.
3.3.3. Analysis of Groundwater Recharge Sources
Hydrogen and oxygen isotopes are effective indicators of water recharge sources [36,37]. Table 2 presents the isotopic characteristics of groundwater and surface water in the study area. Groundwater δ18O values range from −11.16‰ to −6.34‰ (average −9.07‰), and δD values range from −81.64‰ to −48.68‰ (average −66.6‰). Surface water δ18O values range from −10.31‰ to −7.78‰ (average −8.64‰), and δD values range from −77.39‰ to −60.69‰ (average −67.72‰). Groundwater samples exhibit higher enrichment of heavy isotopes compared to surface water.
Table 2.
Statistical characteristics of hydrogen and oxygen isotopes in groundwater and surface water.
The local meteoric water line (LMWL) for Yinchuan, previously established as δD = 7.21δ18O + 5.44 [38], has a lower slope than the global meteoric water line (GMWL: δD = 8δ18O + 10), reflecting evaporation during precipitation, consistent with the semi-arid climate. Isotope values of water samples in the study area lie near the GMWL and LMWL but mostly below the LMWL (Figure 11), indicating that groundwater is primarily recharged by precipitation but influenced by evaporation during the hydrological cycle. The δD–δ18O slopes for groundwater and surface water are 6.32 and 5.94, respectively, suggesting stronger evaporation in surface water. Similar isotopic characteristics between groundwater and surface water imply a close hydraulic connection.
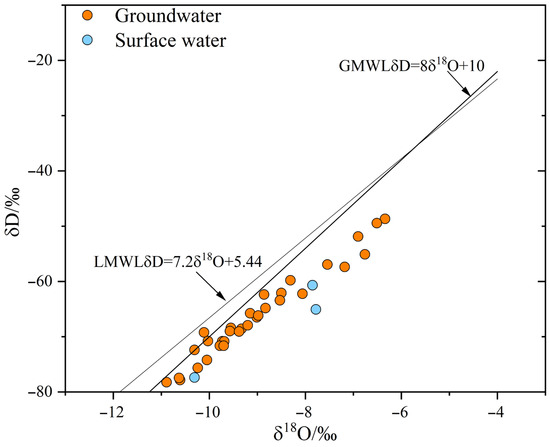
Figure 11.
δD–δ18O composition of groundwater and surface water.
During vertical infiltration, precipitation percolates through fluoride-rich soils and sediments, dissolving and transporting F− into groundwater. Fluoride concentrations in Qingshui River surface water samples, from both main and tributary channels, mostly exceed 1.0 mg/L, with a maximum of 4.33 mg/L, corresponding to fluoride levels in sediments. Whether it is due to sediment influencing river water or vice versa, fluoride-rich surface water is also a source of F− in groundwater.
3.4. Human Health Risk Assessment
A non-carcinogenic risk assessment was conducted on F− in the groundwater of the Qingshuihe Plain, and the corresponding non-carcinogenic risk index was calculated. Based on the established evaluation indicators and exposure pathways, the characteristics of the obtained non-carcinogenic risk index were statistically analyzed. The specific results are shown in Table 3 and Table 4.
Table 3.
Statistics of health risk and hazard index.
Table 4.
Health risk assessment results.
In the non-carcinogenic health risk assessment for adults, the HI value is 1.44, with 79.82% of water sample points in the range of 1 ≤ HI < 3. For children, the HI value in the non-carcinogenic health risk assessment is 1.36, with 71.56% of water sample points in the range of 1 ≤ HI < 3.
The results indicate that the non-carcinogenic health risks in the adult population are slightly higher than those in the child population. This difference is mainly due to the longer lifespan of adults and their significantly higher bone fluoride accumulation compared to that of children. It is worth noting that the risk value generated by the oral intake route is three orders of magnitude higher than that of the skin contact route, and as such, the total non-carcinogenic risk index is mainly determined by the oral intake route. This indicates that oral intake is the main exposure route for non-carcinogenic health risks in the population in this region.
3.5. Recommendations for the Sustainable Development and Management of Groundwater
The horizontal distribution of F− content in the study area increases from the inclined plains in the east, west, and south to the central river valley plains, while the vertical distribution shows that fluoride-rich aquifers are mainly concentrated in shallow layers (<100 m). Over a ten-year time scale, there has been no significant change in F− content. Fluoride content is negatively correlated with Ca2+ and Mg2+ and positively correlated with HCO3−, pH, TDS, and Na+ within a certain concentration range. This study provides scientific guidance for drinking water safety by analyzing fluoride distribution and genesis in the southern Qingshui River Plain, drawing the follow conclusions: a. Fluoride increases from peripheral tilted plains to the central valley (Figure 1), with shallow phreatic water (<100 m; ≤5.30 mg/L) exceeding deep confined aquifers (>100 m; 1–2 mg/L). This supports well siting in peripheral zones and layered extraction targeting deep aquifers. b. Fluoride–pH/HCO3− correlation (r = 0.82) and anti-correlation with Ca2+/Mg2+ (r = −0.76) justify pretreatment (pH adjustment/Ca2+ addition) and terminal removal (ion-exchange/reverse osmosis) for dominant Cl·SO4-Na water (23.53%). c. It is recommended to limit shallow extraction in high-evaporation zones (Figure 5). One should remediate sediments (1035 mg/kg) and intercept high-fluoride tributaries. Cation exchange (Figure 7) informs artificial recharge strategies. d. It is recommended to prioritize pH, HCO3−, Na+, and TDS and implement alerts for high-fluoride deep soils (excess: 81.6%) and surface water.
4. Conclusions
- The horizontal distribution of F− content in the study area increases from the inclined plains in the east, west, and south to the central river valley plains, while the vertical distribution shows that fluoride-rich aquifers are mainly concentrated in shallow layers, with about 74% less than 100 m. Over a ten-year time scale, there has been no significant change in F− content. Fluoride content is negatively correlated with Ca2+ and Mg2+, and positively correlated with HCO3−, pH, TDS, and Na+ within a certain concentration range.
- The average fluoride content in the bedrock, loose layer sediments, and soils of the study area is higher than the national average. Fluoride-rich rocks, loose sediments, and soils are the main sources of fluoride in groundwater.
- Rock weathering and evaporation concentration are the main drivers of high-fluoride groundwater formation, with positive ca tion exchange also facilitating F− release in aquifers. The leaching of fluoride-rich sediments and high-fluoride surface water from atmospheric precipitation also contributes to the fluoride content in groundwater. The health risk results show that oral intake is the main pathway for non-carcinogenic health risks.
- This study identifies critical fluoride distribution patterns in southern Qingshuihe Plain groundwater systems. Shallow aquifers exhibit higher fluoride concentrations than deep confined aquifers, and thus, we recommend prioritizing extraction from deeper horizons. Strong fluoride–pH/HCO3− correlations indicate acidification and calcium addition as effective pretreatment options that improve the safety of drinking water.
Author Contributions
M.Z.: Conceptualization, methodology, writing—original draft. J.W.: Formal analysis, investigation, methodology, writing—draft. T.M.: Investigation, supervision, writing—review and editing. X.W.: Resources. F.L.: Resources. J.L.: Supervision, resources. Z.G.: Supervision, resources. All authors have read and agreed to the published version of the manuscript.
Funding
The study involved in this paper was supported by the Joint Open Fund of Provincial and Ministerial Scientific Research Platforms at the School of Environmental Studies, China University of Geosciences (Wuhan), for the project titled “Study on the Genetic Mechanism of High-Fluoride Groundwater in the Qingshuihe Plain, Ningxia” (no, SES-UF-23-01). We thank the editors and anonymous reviewers for their valuable suggestions regarding the manuscript.
Data Availability Statement
The datasets used and analyzed during the current study are available from the corresponding author on reasonable request.
Acknowledgments
We would like to express our sincere thanks to the editors and reviewers for their very helpful comments on the paper.
Conflicts of Interest
The authors declare no competing interests.
References
- Su, C.; Wang, M.; Xie, X.; Han, Z.; Jiang, J.; Wang, Z.; Xiao, D. Natural and anthropogenic factors regulating fluoride enrichment in groundwater of the Nansi Lake Basin, Northern China. Sci. Total Environ. 2023, 904, 166699. [Google Scholar] [CrossRef]
- Rao, N.S.; Dinakar, A.; Kumari, B.K. Appraisal of vulnerable zones of non-cancercausing health risks associated with exposure of nitrate and fluoride in groundwater from a rural part of India. Environ. Res. 2021, 202, 111674. [Google Scholar] [CrossRef]
- Rao, N.S.; Ravindra, B.; Wu, J. Geochemical and health risk evaluation of fluoride rich groundwater in Sattenapalle region, Guntur district, Andhra Pradesh, India. Hum. Ecol. Risk Assess. Int. J. 2020, 26, 2316–2348. [Google Scholar]
- Liu, C.; Wang, W.; Yang, L.; Zhu, H.; Guo, Y.; Ma, Y.; Guo, J.; Liu, B. Driving mechanisms of fluorine enrichment characteristics in groundwater, Shandong Province. Acta Geol. Sin. 2021, 95, 1962–1972. [Google Scholar]
- Yang, Y.; Zhang, Z.; Wang, Z.; Liu, H.; Sun, Z. Formation of high fluoride groundwater and associated health risks in the Cangzhou area of the North China Plain. Environ. Earth Sci. 2025, 84, 111. [Google Scholar] [CrossRef]
- Wen, D.; Zhang, F.; Zhang, E.; Wang, C.; Han, S.; Zheng, Y. Arsenic, fluoride and iodine in groundwater of China. J. Geochem. Explor. 2013, 135, 1–21. [Google Scholar] [CrossRef]
- Li, P.; Wu, J.; Qian, H.; Zhang, Y.; Yang, N.; Jing, L.; Yu, P. Hydrogeochemical characterization of groundwater in and around a wastewater irrigated forest in the southeastern edge of the Tengger Desert, Northwest China. Expo. Health 2016, 8, 331–348. [Google Scholar] [CrossRef]
- Boyde, C.D.; Cerklewski, F.L. Influence of type and level of dietary protein on fluoride bioavailability in the rat. J. Nutr. 1987, 117, 2086–2090. [Google Scholar] [CrossRef]
- Li, J.; Wang, Y.; Zhu, C.; Xue, X.; Qian, K.; Xie, X.; Wang, Y. Hydrogeochemical processes controlling the mobilization and enrichment of fluoride in groundwater of the North China Plain. Sci. Total Environ. 2020, 730, 138877. [Google Scholar] [CrossRef]
- Pujari, P.R.; Deshpande, V. Source apportionment of groundwater pollution around landfill site in Nagpur, India. Environ. Monit. Assess. 2005, 111, 43–54. [Google Scholar] [CrossRef]
- Farooqi, A.; Masuda, H.; Firdous, N. Toxic fluoride and arsenic contaminated groundwater in the Lahore and Kasur districts, Punjab, Pakistan and possible contaminant sources. Environ. Pollut. 2007, 145, 839–849. [Google Scholar] [CrossRef]
- Carrillo-Rivera, J.; Cardona, A.; Edmunds, W.M. Use of abstraction regime and knowledge of hydrogeological conditions to control high-fluoride concentration in abstracted groundwater: San Luis Potosı basin, Mexico. J. Hydrol. 2002, 261, 24–47. [Google Scholar] [CrossRef]
- Brindha, K.; Rajesh, R.; Murugan, R.; Elango, L. Fluoride contamination in groundwater in parts of Nalgonda District, Andhra Pradesh, India. Environ. Monit. Assess. 2011, 172, 481–492. [Google Scholar] [CrossRef]
- Singh, C.K.; Kumari, R.; Singh, N.; Mallick, J.; Mukherjee, S. Fluoride enrichment in aquifers of the Thar Desert: Controlling factors and its geochemical modelling. Hydrol. Process. 2012, 27, 2462–2474. [Google Scholar] [CrossRef]
- Teiber, H.; Marks, M.A.W.; Wenzel, T.; Siebel, W.; Altherr, R.; Markl, G. The distribution of halogens (F, Cl, Br) in granitoid rocks. Chem. Geol. 2014, 374, 92–109. [Google Scholar] [CrossRef]
- Berger, T.; Mathurin, F.A.; Drake, H.; Åström, M.E. Fluoride abundance and controls in fresh groundwater in Quaternary deposits and bedrock fractures in an area with fluorine-rich granitoid rocks. Sci. Total Environ. 2016, 569–570, 948–960. [Google Scholar] [CrossRef] [PubMed]
- Su, C.; Wang, Y.; Xie, X.; Zhu, Y. An isotope hydrochemical approach to understand fluoride release into groundwaters of the Datong Basin, Northern China. Environ. Sci. Process. Impacts 2015, 17, 791–801. [Google Scholar] [CrossRef]
- Li, J.; Zhou, H.; Qian, K.; Xie, X.; Xue, X.; Yang, Y.; Wang, Y. Fluoride and iodine enrichment in groundwater of North China Plain: Evidences from speciation analysis and geochemical modeling. Sci. Total Environ. 2017, 598, 239–248. [Google Scholar] [CrossRef]
- Podgorski, J.; Berg, M. Global analysis and prediction of fluoride in groundwater. Nat. Commun. 2022, 13, 4232. [Google Scholar] [CrossRef]
- Brindha, K.; Elango, L. Fluoride in groundwater: Causes, implications and mitigation measures. Fluoride Prop. Appl. Environ. Manag. 2011, 1, 111–136. [Google Scholar]
- Han, D.; Currell, M.J. Review of drivers and threats to coastal groundwater quality in China. Sci. Total Environ. 2022, 806, 150913. [Google Scholar] [CrossRef]
- Wang, Y.; Cheng, X. Spatial variation and genesis of groundwater fluoride inconfined aquifer from the upper Qingshui river basin. J. Arid Land Resour. Environ. 2015, 29, 170–176. [Google Scholar]
- Vienna Standard Mean Ocean Water (VSMOW); International Atomic Energy Agency (IAEA): Vienna, Austria, 1968.
- Geochemical Assessment Standard for Land Quality; Ministry of Land and Resources of the People’s Republic of China: Beijing, China, 2014.
- Yadav, S.; Singh, K.N.; Maanju, S.K. Hydrochemistry of High Fluoride Groundwater Terrain of Phagi Block, Jaipur District, Rajasthan, India with Special Emphasis on Fluoride Correlation with Different Ions and other Parameters. J. Geol. Soc. India 2023, 99, 820–826. [Google Scholar] [CrossRef]
- Piper, A.M. A graphic procedure in the geochemical interpre-tation of water-analyses. EOS Trans. Am. Geophys. Union 1944, 25, 27–29. [Google Scholar]
- Huang, L.; Sun, Z.; Zhou, A.; Bi, J.; Liu, Y. Source and enrichment mechanism of fluoride in groundwater of the Hotan oasis within the Tarim Basin, Northwestern China. Environ. Pollut. 2022, 300, 118962. [Google Scholar] [CrossRef]
- Jing, X.Y.; Li, X.Z.; Wang, W.J.; Zhang, W.Y.; Dong, Q.F. Distribution Characteristics and Health Risk Assessment of Fluorine in Groundwater in Yinchuan Plain. Environ. Sci. Technol. 2022, 45, 174–181. [Google Scholar]
- Dong, Y.; Wang, Z.; Wang, D.; Zhao, K.; Hu, B. Occurrence and Formation Mechanisms of High-Fluoride Groundwater in Xiong’an New Area, Northern China. Water 2024, 16, 17. [Google Scholar] [CrossRef]
- Gao, Z.; Li, Q.; Liu, J.; Su, Q.; Tan, M.; Wang, Y. Assessment of Groundwater Hydrogeochemistry, Controlling Factors, Water Quality, and Nitrate-Related Health Risks in the Longkou Bay, North China. Water Air Soil Pollut. 2024, 235, 392. [Google Scholar] [CrossRef]
- Fan, B.; Zhao, Z.; Tao, F.; Liu, B.; Tao, Z.; Gao, S.; Zhang, L. Characteristics of carbonate, evaporite and silicate weathering in Huanghe River basin: A comparison among the upstream, midstream and downstream. J. Asian Earth Sci. 2014, 96, 17–26. [Google Scholar] [CrossRef]
- Liu, J.; Gao, Z.; Feng, J.; Wang, M. Identification of the hydrochemical features, genesis, water quality and potential health hazards of groundwater in Dawen River Basin, North China. Ecol. Indic. 2023, 149, 110175. [Google Scholar] [CrossRef]
- Wang, Z.; Tian, X.; Wu, X. Hydrochemical characteristics and quality assessment of shallow groundwater and CBM coproduced. water in the Shizhuangnan block, Qinshui basin, China. Environ. Earth Sci. 2018, 77, 57–76. [Google Scholar] [CrossRef]
- Zhang, J.; Liang, X.; Jin, M.; Ma, T.; Deng, D.; Ma, B. Identifying the groundwater flow systems in a condensed river-network interfluve between the Han River and Yangtze River (China) using hydrogeochemical indicators. Hydrogeol. J. 2019, 27, 2415–2430. [Google Scholar] [CrossRef]
- Gao, Y.; Qian, H.; Ren, W.; Wang, H.; Liu, F.; Yang, F. Hydrogeochemical characterization and quality assessment of groundwater based on integrated-weight water quality index in a concentrated urban area. J. Clean. Prod. 2020, 260, 121006. [Google Scholar] [CrossRef]
- Zhou, Y.; Ma, T.; Yuan, L.; Li, F.; Han, S.; Zhou, J.; Li, Y. Hydrochemistry−isotope characteristics and quality assessment of groundwater in the Beiluo River Basin, Shaanxi Province. Geol. China 2024, 51, 663–675. [Google Scholar]
- Xing, L.; Jingwei, Z.; Kun, L.; Shuai, S.; Teng, M. Hydrochemical characteristics of groundwater and analysis of groundwater flow systems in Jianghan Plain. Bull. Geol. Sci. Technol. 2020, 39, 21–33. [Google Scholar]
- Lin, Z.; Zongyu, C.; Zhenlong, N.; Fuliang, L.; Yankun, J.; Xiangyang, Z. Correlation between δ18O in precipitation and surface air temperature on different time-scale in China. Nucl. Tech. 2008, 31, 715–720. [Google Scholar]
Disclaimer/Publisher’s Note: The statements, opinions and data contained in all publications are solely those of the individual author(s) and contributor(s) and not of MDPI and/or the editor(s). MDPI and/or the editor(s) disclaim responsibility for any injury to people or property resulting from any ideas, methods, instructions or products referred to in the content. |
© 2025 by the authors. Licensee MDPI, Basel, Switzerland. This article is an open access article distributed under the terms and conditions of the Creative Commons Attribution (CC BY) license (https://creativecommons.org/licenses/by/4.0/).