Article

Effects of Drainage Control on Non-Point Source Pollutant Loads in the Discharges from Rice Paddy Fields

1
Department of Civil Engineering, Kyung Hee University, 1732, Deakyungdaero, Yongin-si 17104, Republic of Korea
2
Department of Environmental Engineering, Sunchon National University, 255 Jungang-ro, Suncheon 57922, Republic of Korea
*
Authors to whom correspondence should be addressed.
Water 2025, 17(11), 1650; https://doi.org/10.3390/w17111650
Submission received: 11 April 2025 / Revised: 12 May 2025 / Accepted: 26 May 2025 / Published: 29 May 2025
(This article belongs to the Special Issue Basin Non-Point Source Pollution)

Abstract

:
Non-point source (NPS) pollution from agriculture accounts for more than 20% of the total pollution load in the Republic of Korea, with the highest nutrient balance among OECD countries. Rice paddy fields are among the most important NPSs because of their large area, intensive fertilizer use, intensive use of irrigation water, and subsequent drainage. Therefore, the use of controlled drainage in paddy fields (Test) was evaluated for reduction in the discharged volumes and pollutant loads in drainage and stormwater runoff in comparison to plots using traditional drainages (Control). The results show that the loads were highly variable and that the reductions in the annual load of biochemical oxygen demand (BOD), suspended solid (SS), total nitrogen (T-N), total phosphorus (T-P), and total organic carbon (TOC) in the Test compared to that of the Control were 31.0 ± 28.9%, 83.5 ± 11.8%, 65.4 ± 12.2%, 69.1 ± 21.7%, and 64.9 ± 12.9%, respectively. It was shown that discharge in the post-harrowing and transplanting drainage (HD) was predominantly responsible for the total loads; therefore, the load reduction in HD was evaluated further at additional sites. The reduction at all studied sites was highly variable and as follows: 30.0 ± 33.6%, 70.9 ± 24.6%, 32.2 ± 45.5%, 45.7 ± 37.0%, and 27.0 ± 71.5%, for BOD, SS, T-N, T-P, and TOC, respectively. It was also demonstrated that controlled drainage contributed significantly to reducing the loads and volume of stormwater runoff from paddy fields. Correlations between paddy field conditions and multiple regression showed that the loads were significantly related to paddy water quality. The results of this study strongly suggest that controlled drainage is an excellent alternative for reducing the discharge of NPS pollutants from paddy fields. It is also suggested that the best discharge control would be achieved by combinations of various discharge mitigation alternatives, such as the management of irrigation, drainage, and fertilization, as well as drainage treatment, supported by more field tests, identification of the fates of pollutants, effects of rainfall, and climate changes.

1. Introduction

Rice is among the most important foods for more than 50% of the world [1]. Worldwide rice production in the year of 2024/2025 was 522.1 million metric tons (MT) of milled rice, mostly from India and China [2]. Approximately 72% of world’s water was consumed in agricultural irrigation, and 50% of was used in rice cultivation [3,4]. In addition, 21~25% of nitrogen fertilizers are consumed worldwide in rice paddy fields [2,3]. Moreover, fertilizers are generally applied excessively to paddy fields [5], and irrigation water is alternately flooded and discharged several times [4]. Rice fields consume a great amount of irrigation water, which is sometimes an important source of groundwater recharge. It was reported that up to 88% of the surficial aquifer recharge was responsible for the flood irrigation in rice fields (1500 to 3000 mm depth) in lower Ticino basin in the Po Plain, Italy [6]. Therefore, rice paddy fields contribute significantly to the non-point source pollutant load in surrounding water systems via both surface and subsurface fluxes [7,8]. In particular, non-point source pollution from agriculture accounts for more than 20% of the total pollution load in the Republic of Korea (ROK) [9]. And, as of 2020, the national nutrient balance of ROK ranked highest among OECD countries for N (229.91 kg/ha) and P (45.9 kg/ha) [10]. Further, rice paddy fields are one of the important sources and sinks of emerging contaminants concern from non-point sources. It was shown in a study performed in Catalonia, Spain, that caffeine, bisphenol A, lorazepam, and pesticides, such as atrazine, bentazone, and oxadiazone, were detected up to 21,318 ng/L, in the irrigation water from a nearby river, the rice field drainage, and the effluent of the constructed wetland, receiving the drainage [11].
However, the extensive use of irrigation water in paddy fields may provide opportunities to reduce pollutant discharge by controlling irrigation and drainage [12]. Therefore, most of the challenges for the sustainable rice agriculture focuses on saving irrigation water. Water-saving irrigation has been widely applied, and it includes frequent and shallow irrigation, controlled irrigation, rain-gathering irrigation, intermittent irrigation, soil water potential, non-flooded mulching cultivation, aerobic rice system, efficient irrigation regime, saturated soil culture, field water level, intermittent drainage, leaching and flushing, and, the most popular, alternate wetting and drying [13,14,15,16]. Han et al. [15] reported that nitrogen in drainage could be reduced by 1.8~16.5% using alternate wetting and drying irrigation, compared to conventional flooding irrigation. The volume of drainage and nutrients in the drainage were decreased by recycling irrigation [17,18]. In addition, dry seeding saved irrigation water without a loss of rice yield, while a delay in paddy field flooding decreased greenhouse gas emissions, when compared to conventional continuous flooding [19]. It seems clear that water-saving irrigation can reduce the amount of water required. However, the reduction in discharged pollutants remains debatable. It has also been shown that the total nitrogen (T-N) discharge was increased slightly by water-saving irrigation, compared to paddy fields with common flood irrigation [20]
The drainage from paddy fields is the only pathway to transport accumulated N and P to nearby waters [21]. Therefore, drainage control offers a significant opportunity to reduce pollution discharge from paddy fields. In this regard, controlled drainage aims to reduce surface drainage and non-point source pollutant discharge. For example, P in the drainage from paddy fields was reduced by water management using irrigation–drainage units by extending the retention of paddy water, as well as P in the water, thereby promoting the settling and uptake of P by soil and crops [22]. Similarly, increasing the retention time of irrigation water in paddy fields by partial recycling decreases nutrient loads during discharge [17,18]. Discharged P was also reduced by increasing the paddy water depth by limiting solid discharge [23]. Moreover, the volume and load of T-N, NH4+-N, and NO3-N in stormwater runoff were reduced by extending the retention of paddy water using controlled drainage units [24]. The retention of discharge in separate buffering zones, such as wetlands and ponds, also reduced the loads transported to nearby rivers, though the discharged loads from paddy fields could not be reduced [23,25]. However, it should be elaborated further for controlled drainage to be confirmed as a substantial method to reduce the discharged pollutants from paddy fields.
Unfortunately, drainage has been conducted without control in most rice paddy fields in the ROK. Generally, earth dikes are installed around plots and simple and short pipes are buried in some of them. Farmers break a part of the dikes with a shovel or open the pipes instantaneously and manually three (3) times a year after vegetative, reproductive, and ripening stages of rice growth [21]. They are May, June to July, and September, respectively, in the ROK. Therefore, a large amount of paddy water is drained within a short period of time, that is, traditional drainage. Neither the water level nor flow rate is controlled, resulting in significant soil erosion and loss as well as pollutant discharge [26].
Considering the current status of the ROK and the possibility of controlled drainage, as demonstrated in previous studies, this study investigated and compared the quality and quantity of agricultural drainage and stormwater runoff from paddy fields in the Miho River sub-basin, the ROK, where either traditional drainage or controlled drainage was used. The major objective of this study is to investigate the feasibility of and the quantitation of the reduction in the loads by using controlled drainage units through field experiments. For this, the flowrates of the agricultural discharge were measured and samples of the discharge were taken at predetermined time intervals, at each plot. The samples were analyzed for biochemical oxygen demand (BOD), total organic carbon (TOC), suspended solids (SS), T-N, and total phosphorus (T-P). The discharged loads of them were calculated separately for the plots with traditional drainage units (Control) and those with controlled units (Test).
Different from a limited number of studies using controlled drainage units, where the units were used to control paddy water depth and to prolong the retention of the water [22,23,24], the units in this study mainly aimed at drainage flow control. This study also demonstrated by the changes in the discharged loads of organics (BOD and TOC), and the SS by controlled drainage, which have rarely been investigated in previous studies, along with those of T-N and T-P, which have been investigated in most publications to date [12,15,17,18,23,24,27,28,29].

2. Materials and Methods
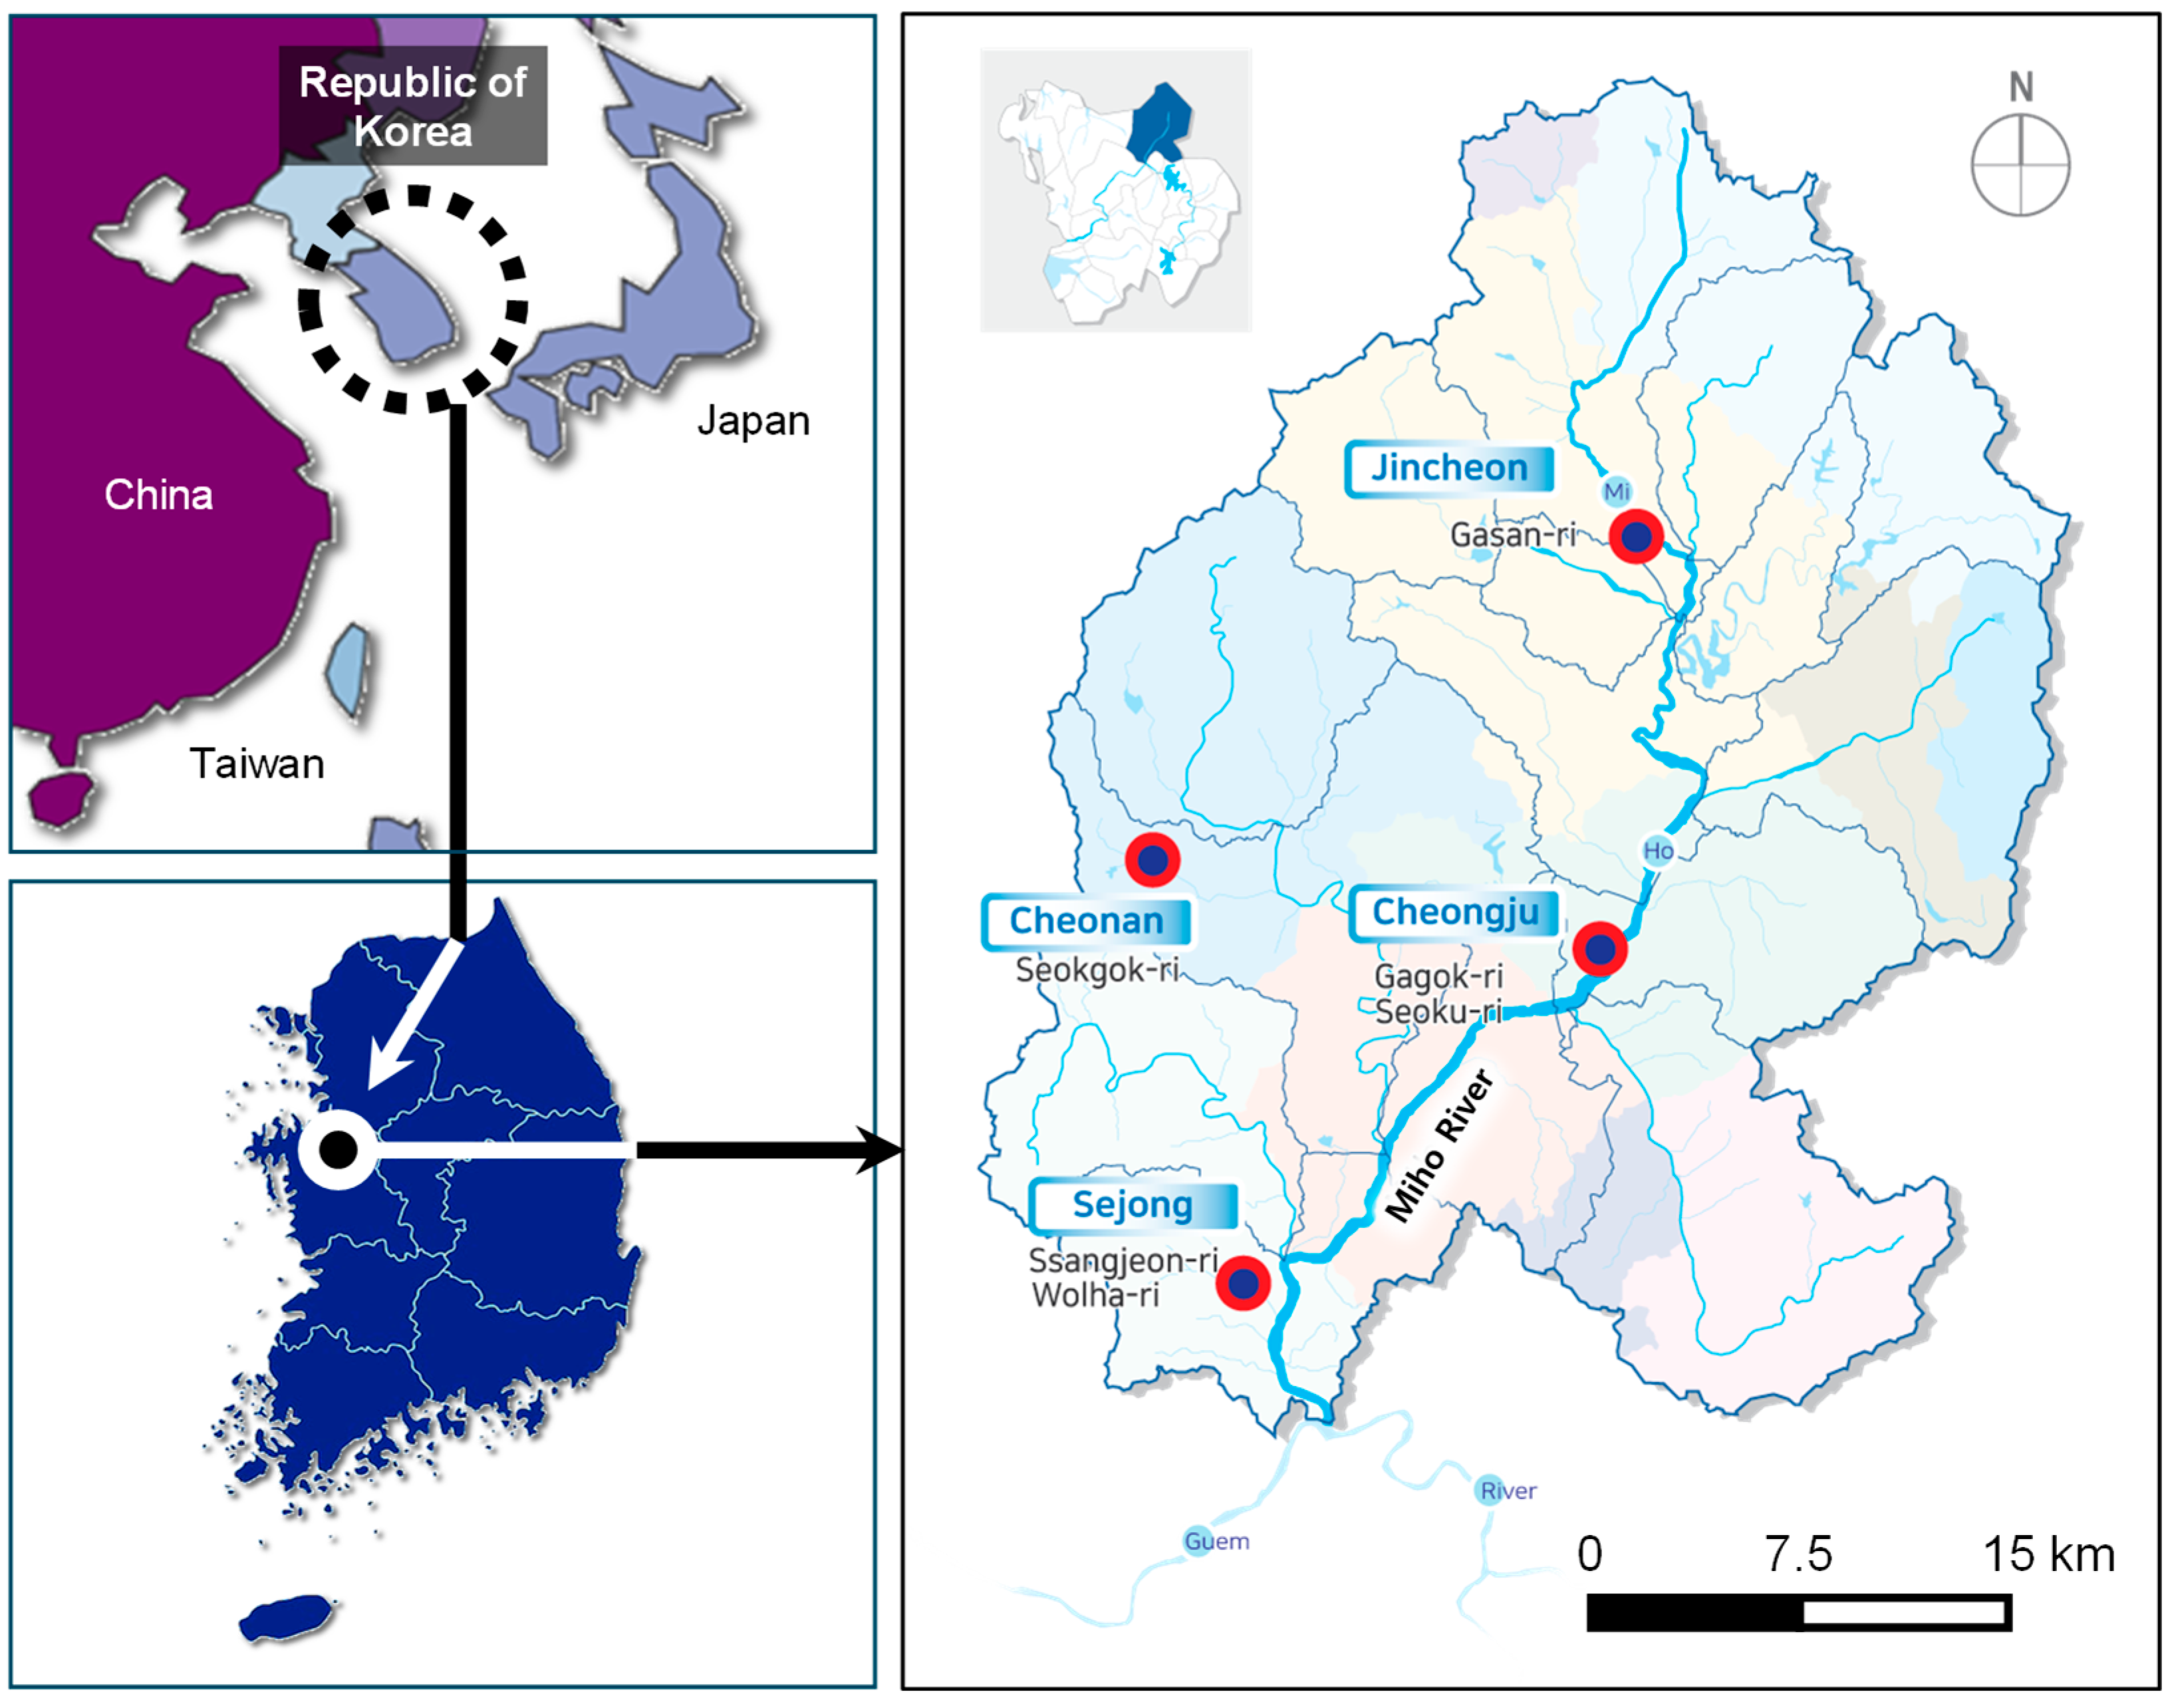
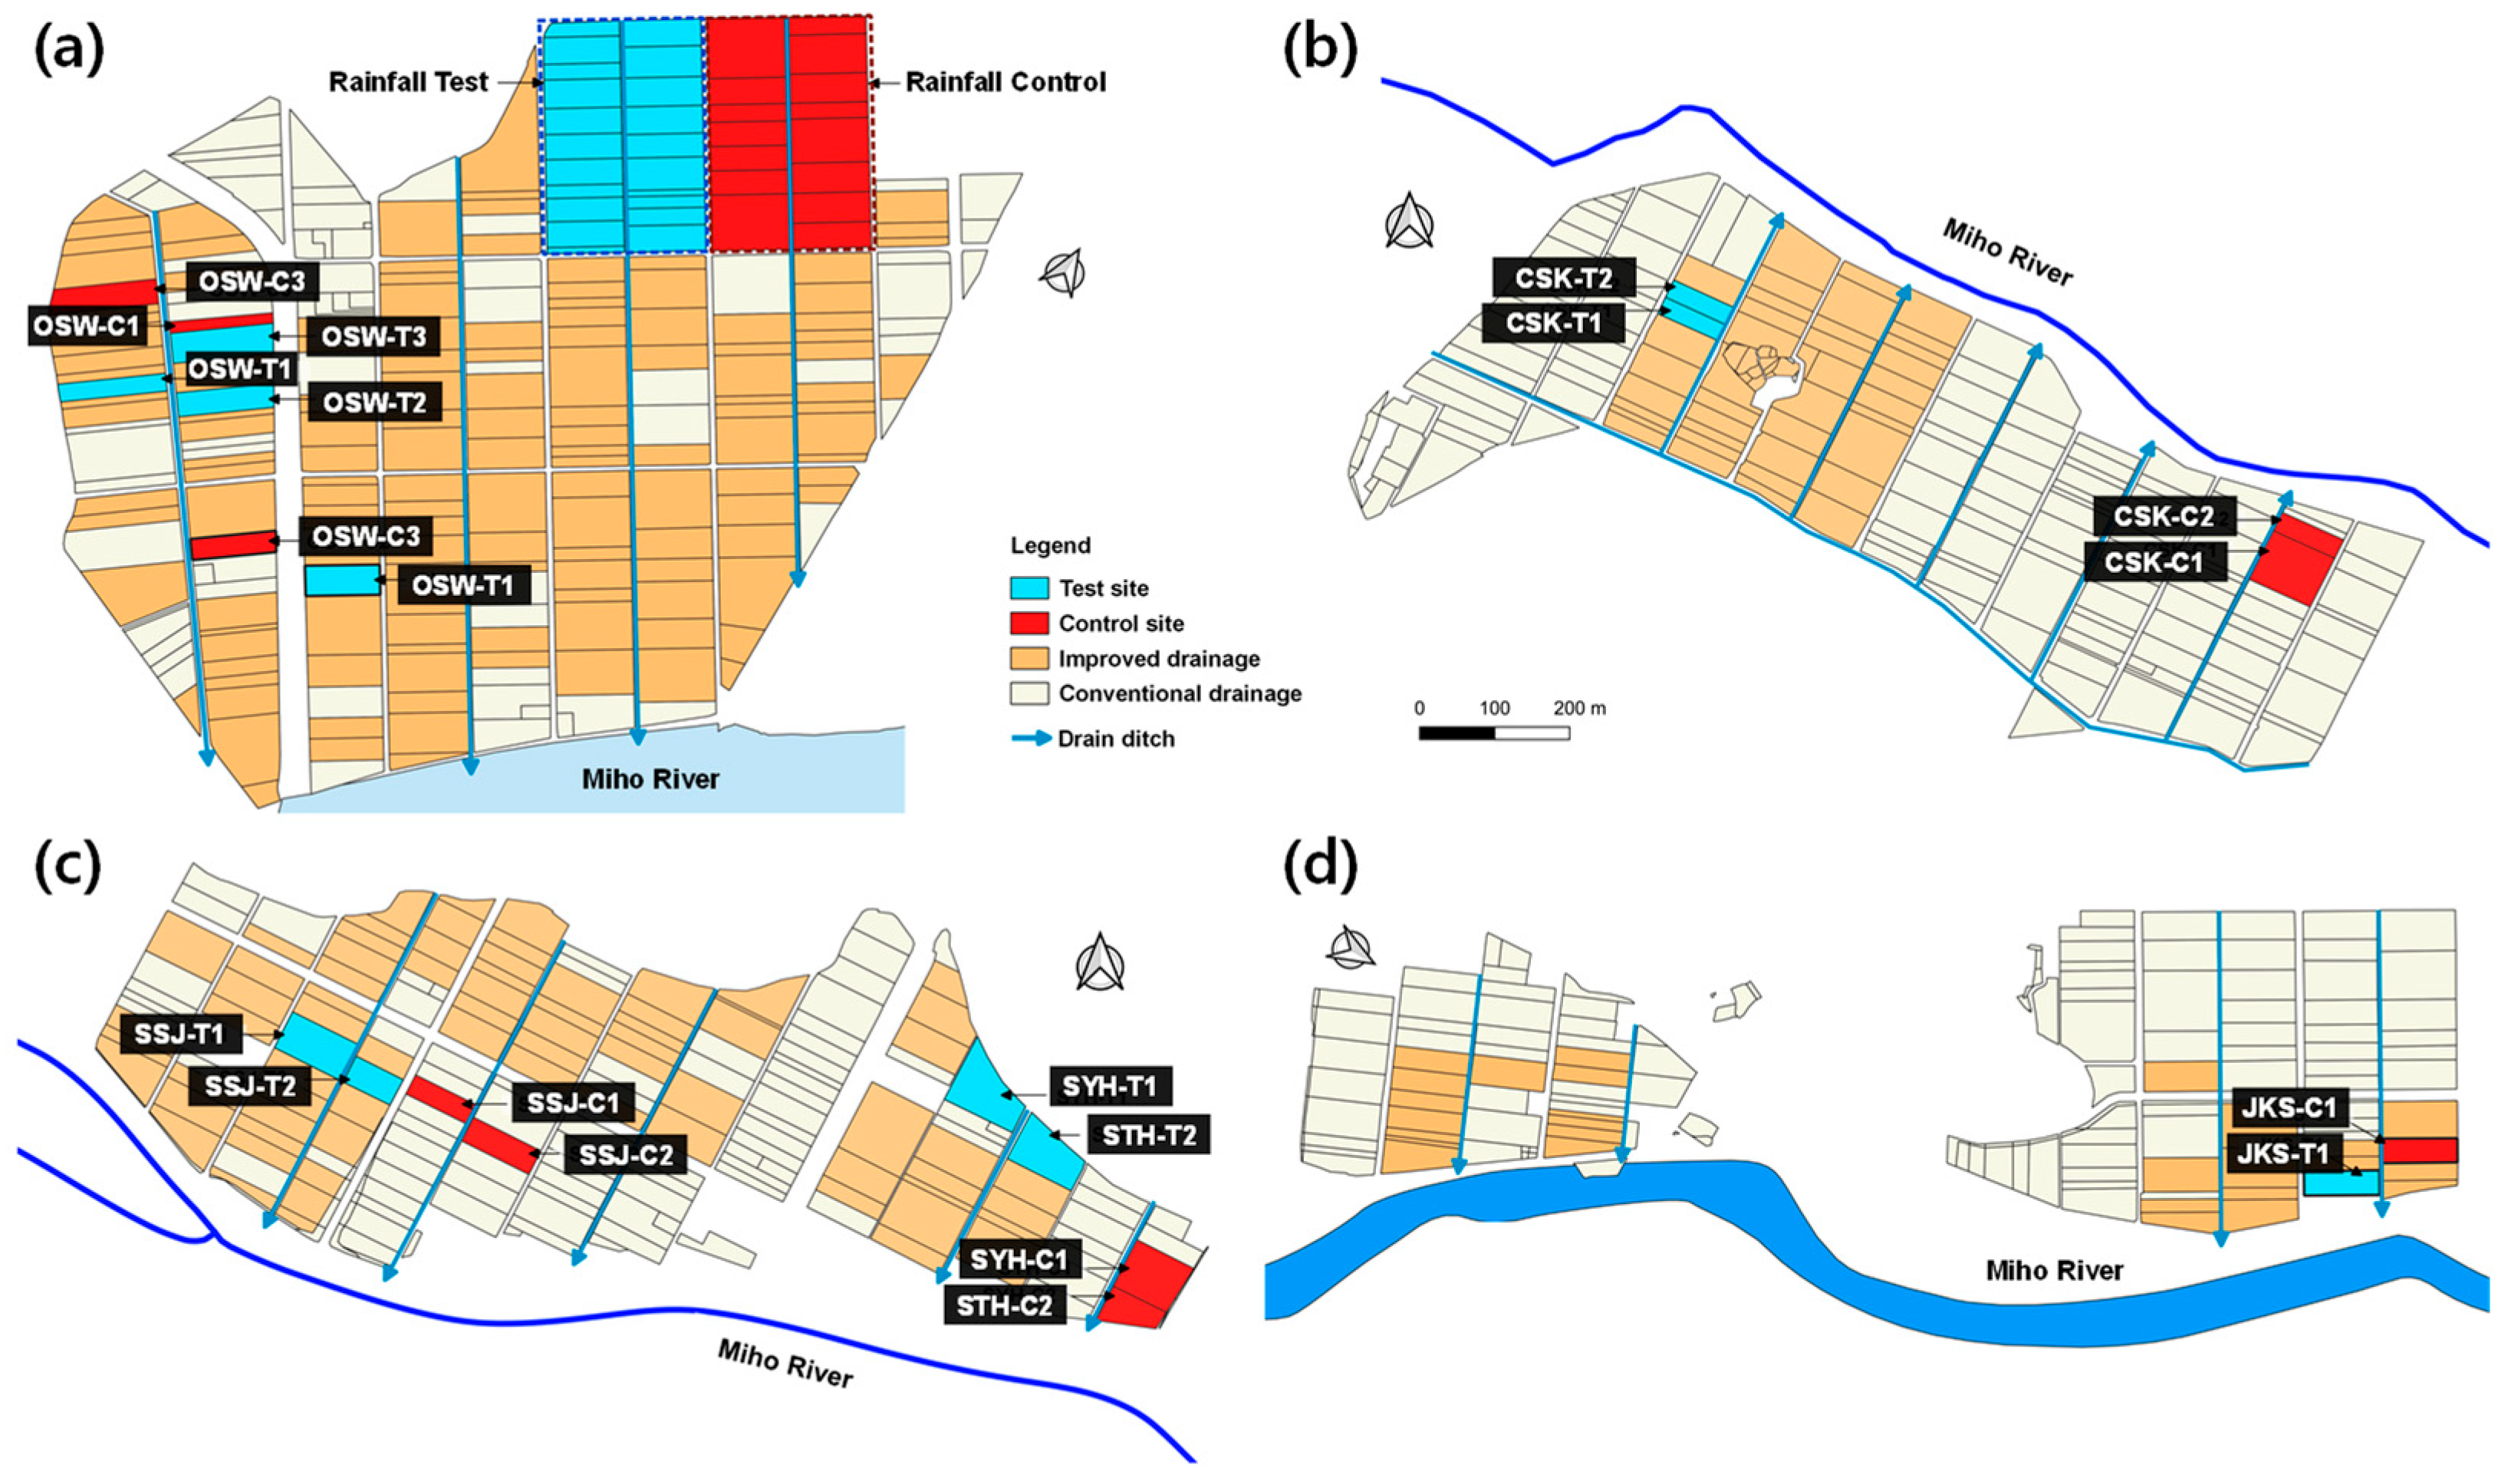
2.1. Study Area

The study areas were rice paddy fields in Jincheon-gun (county) (36.86° N, 127.44° E), Cheongju-si (city) (36.64° N, 127.49° E), Sejong-si, (36.50° N, 127.25° E), and Cheonan-si (36.82° N, 127.11° E) within the Miho River sub-basin of the Geum River Basin, ROK (Figure 1). The area of the Miho River sub-basin is 1854.95 km2, comprising approximately 20% of Geum River Basin. The length of Miho River is 89.2 km, while the ninety-five day flow, normal flow, and drought flow are 37.56~48.88, 21.19~27.58, and 9.78~12.73 m3/s, respectively [30].
The Geum River Basin recorded the poorest satisfaction with water quality standards [31], with the highest non-point source pollutant loads among the four large river basins in the country, with a BOD of 77.9% and a T-P of 81.7% of the total loads [9]. Livestock and farmland are responsible for most of this [32]. The Miho River sub-basin covers a total area of 1855 km2, with agricultural areas (paddy fields) accounting for 472.1 km2 or 25.5% of this. The proportion of the agricultural area is relatively high compared to other subbasins, and most of it is distributed around the main course of the Miho River, directly impacting water quality [33,34]. The ‘Miho River Basin Water Quality Improvement Plan’ has been in progress since April 2019 as part of efforts to reduce agricultural non-point source pollution, including paddy field drainage management [35].

2.2. Monitoring of Paddy Field Discharges

In a total of 22 plots in four areas of investigation (Figure 2), half of the paddy fields are equipped with traditional drainage units (Control) and the other half with controlled drainage units with water level control (Test) (Figure 3). A controlled drainage unit (MG-008, PPS Inc., Yongin, ROK) was equipped with a knob and a gate to control the paddy water level when discharged (Figure S1).
To monitor the discharge during the three stages of the farming period, investigations were performed in Agok-ri (village) and Seoku-ri in Cheongju from April to October 2021: post-harrowing and transplanting drainage (HD) (21–29 May), midseason drainage (MD) (28 June–1 July), and final drainage (FD) (21 September). In this study and in previous reports [36], the HD period was identified to discharge the highest pollution loads in the entire rice cultivation period. Therefore, this period was studied again in all four areas from April to June 2022 and on 18–22 May 2023.
The area of a plot ranged from 1552.1~8175.8 m2, with an average of 3791.7 m2. Drain ditches are placed between two groups of plots, as indicated with arrows in Figure 2. The width and length of them were approximately 3 m and 300 m, respectively, while they were sloped downward to the direction of the arrows at around 3%.
For each drainage event, flowrates were measured and samples were collected at the outlets of either traditional or controlled drainage units seven (7) times, i.e., at the start and 1, 2, 4, 8, 12, and 24 h after the discharge. The flowrates of the discharges were measured manually using a stopwatch and clean 1 L polypropylene bottles. Discharge samples were collected in the bottles and transported to the laboratory for immediate analysis. For each sample, the BOD, SS, T-N, T-P, and TOC were analyzed according to the standard methods of the ROK, using dissolved oxygen consumption in five (5) days of incubation at 20 °C, filtration through a GF/C filter (1.2 μm), persulfate oxidation spectroscopy, ammonium molybdate spectroscopy, and heated-persulfate oxidation, respectively [37]. The discharged load of each pollutant at each drainage event was calculated by multiplication of the flowrate (Qi, m3/s), the pollutant concentration (Ci, mg/L), and the time interval (s, ti), corresponding to the i-th sample of the event. The i was 1~7, as a total of seven (7) samples were collected at each event. The discharged pollutant loads per unit area for each event were calculated by the sum of the loads all samples in the event, using Equation (1) [38]:
P o l l u t a n t   l o a d   ( k g / h a ) = k i = 1 n Q i C i t i × 1 A
where A is the area of the agricultural field, and n is the number of samples analyzed per event. The event mean concentration (EMC) was calculated using Equation (2) [39]:
E M C = ( Q i C i ) Q i
where Σ(QiCi) represents the cumulative pollutant load at each sampling point, and ΣQi represents the cumulative flow rate of runoff water. The area, total discharge volume, and paddy water depth at each site are listed in Table S1. Irrigation water quality, paddy water quality before drainage, and soil properties were analyzed, and applied fertilizer amounts were surveyed to investigate their influence on the discharged pollutant load. The results are presented in Tables S2–S4.

2.3. Statistical Analysis

A Pearson correlation analysis was conducted to investigate the correlations between the reductions of each load at Test sites. In addition, the factors influencing the discharged loads were investigated by Pearson correlations between the loads and the characteristics of discharge and paddy field, which were as follows: paddy water depth, fields area, total discharge volume, initial flow velocity, initial flowrate, irrigation water quality, soil property, fertilizer application, and paddy water quality. A two-way Analysis of Variance (ANOVA) was used to investigate the differences between the sites and between the reductions of pollutants, i.e., BOD, SS, T-N, T-P, and TOC.

2.4. Monitoring of Stormwater Runoff

Stormwater runoff from the paddy field area was monitored during two rainfall events in Ceongju. One was between HD and MD on 10–11 June, with a total of 13 mm, and the other was between MD (31 August) and FD (1 September), with 122.5 mm. Runoff was introduced into the drainage channels of 21 test sites (60,963 m2) and 15 control sites (61,511 m2), denoted as A and B, respectively, in Figure S2. The runoff flowed through the channels receiving discharges from the sites to the outlets, denoted as A′ and B′ in Figure S2. Samples were collected at four (4) points after 0, 0.25, 0.5, 1, 2, 4, 8, and 12 h from the start and end of the runoff. The samples were analyzed for BOD, SS, TN, TP, and TOC. The flow velocity was measured using an electronic flowmeter (801, Valeport Ltd., Devon, UK), and the water levels in the drainage units were recorded to calculate the discharge flow rate. The EMC and pollutant loads were calculated using Equations (1) and (2). The pollutant loads from the sites were obtained by subtracting the loads at the outlets (A′ and B′) from those at the inlets (A and B). Rainfall data were obtained from Ochang automatic weather stations and distributed through Korea Meteorological Administration [40].

3. Results and Discussion

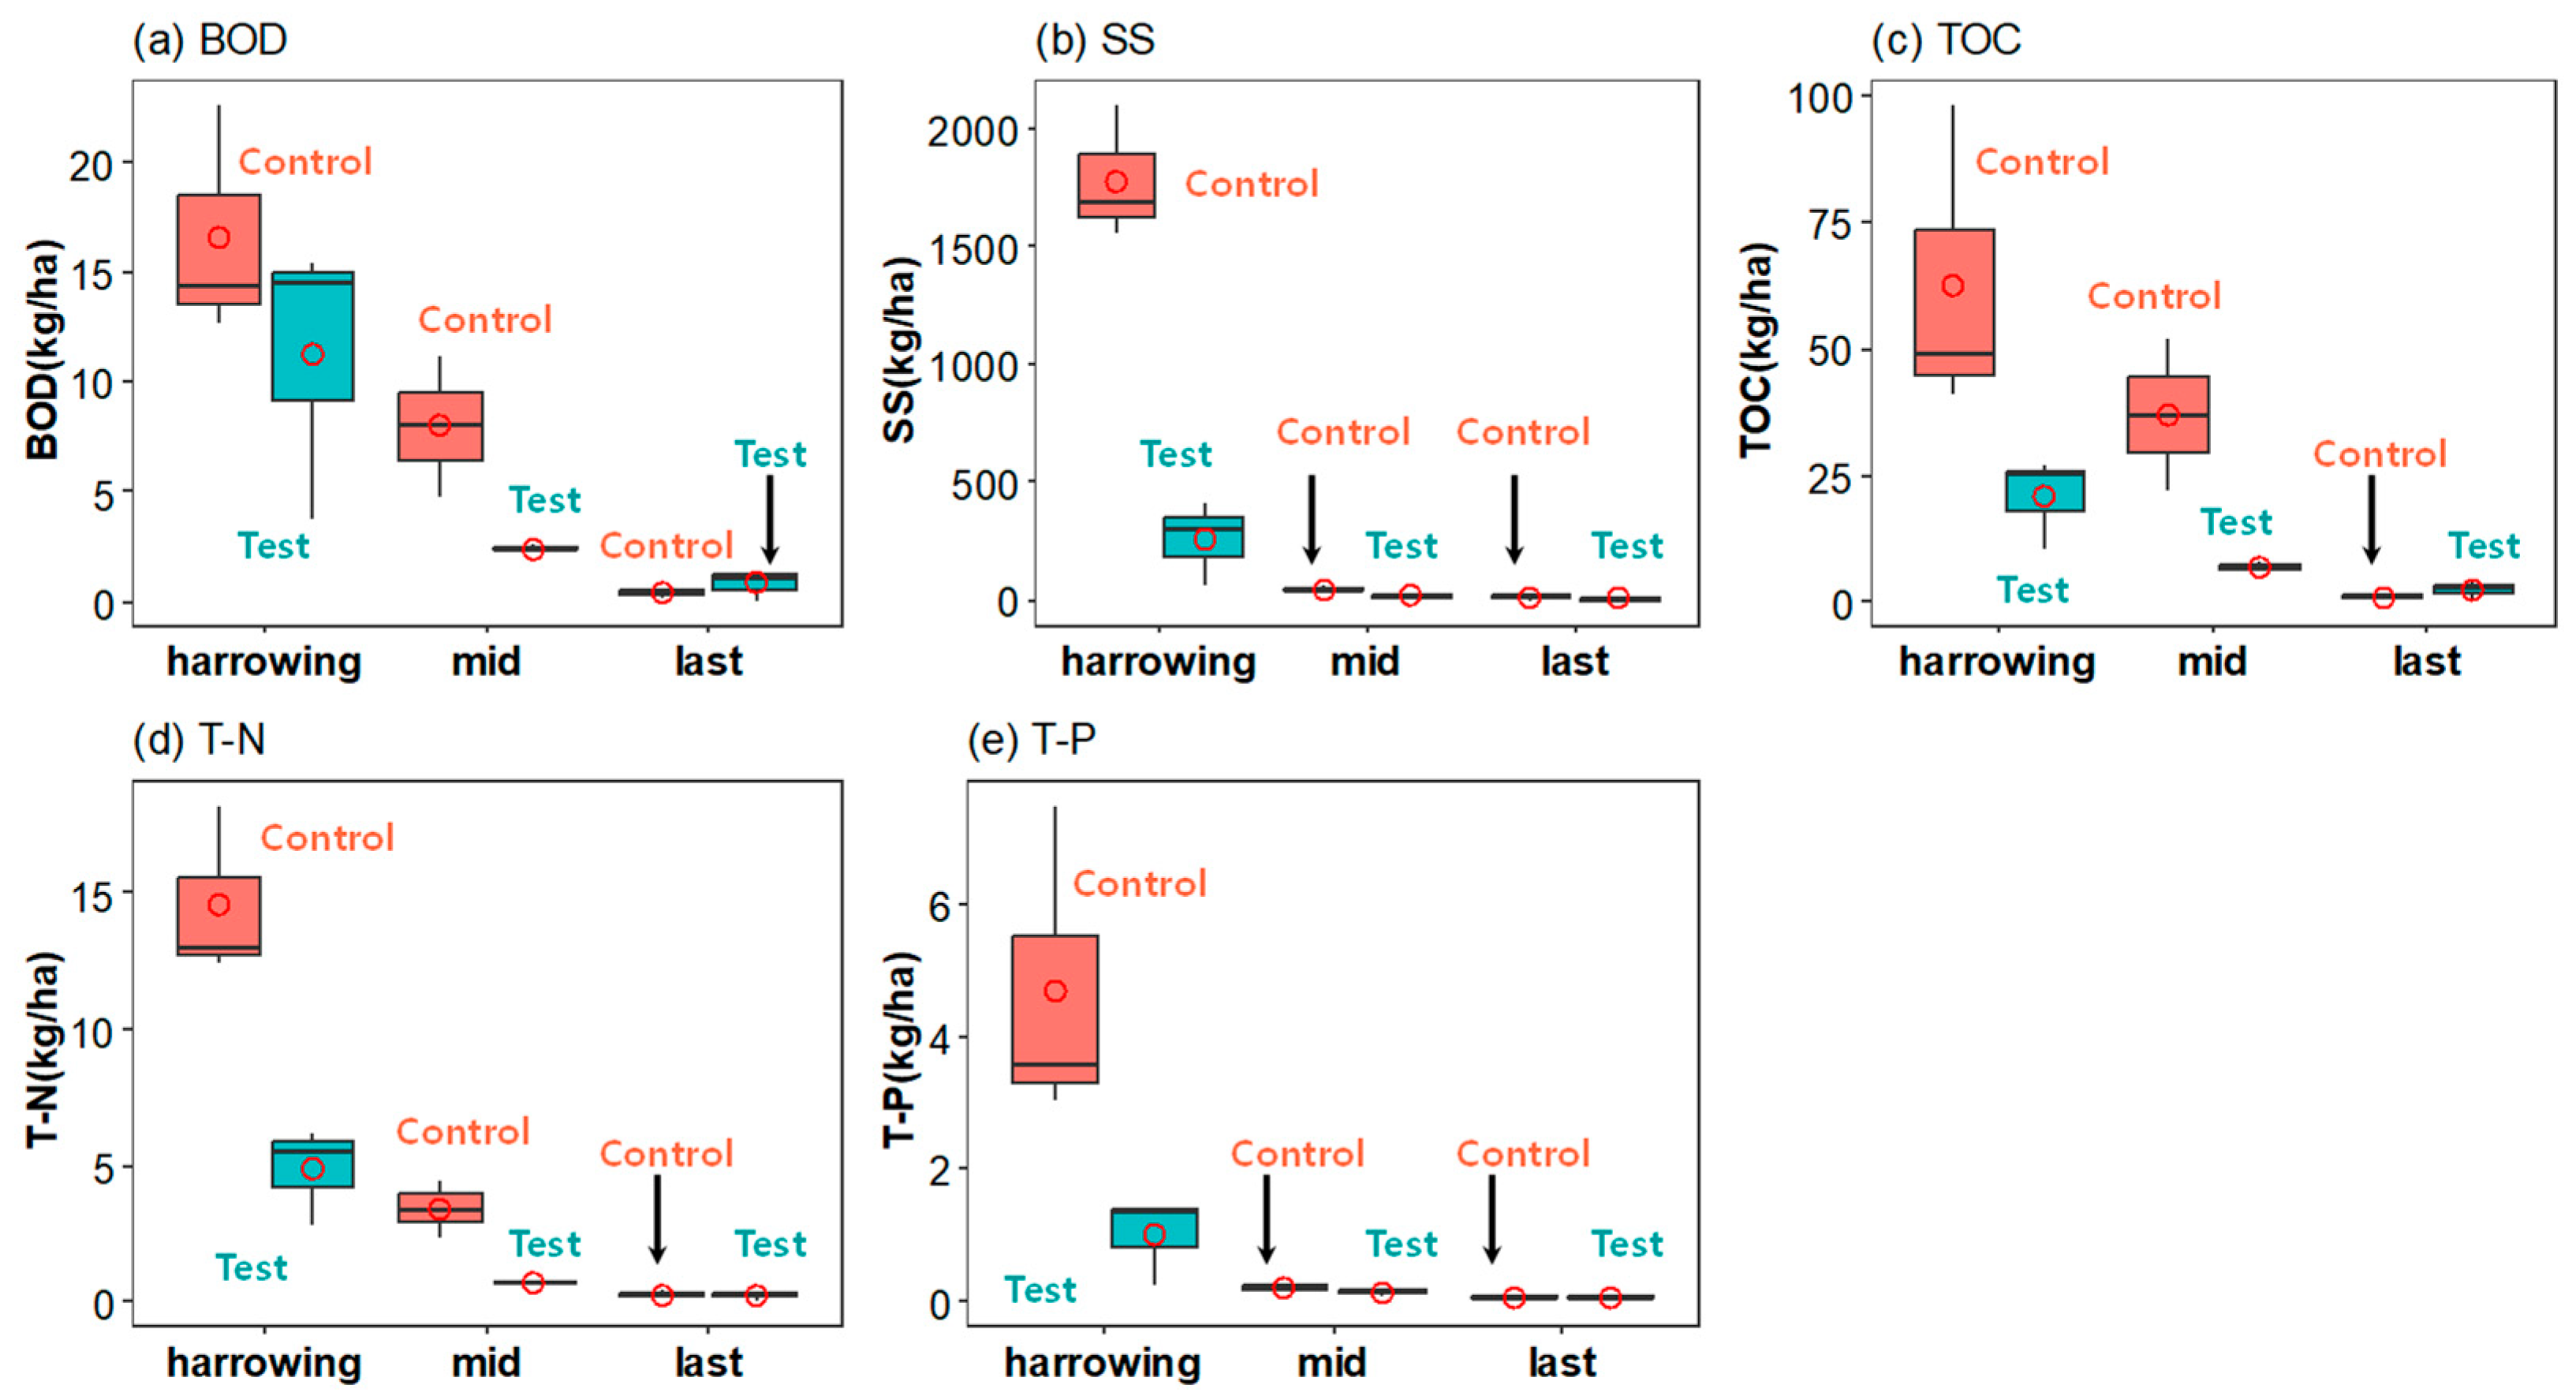
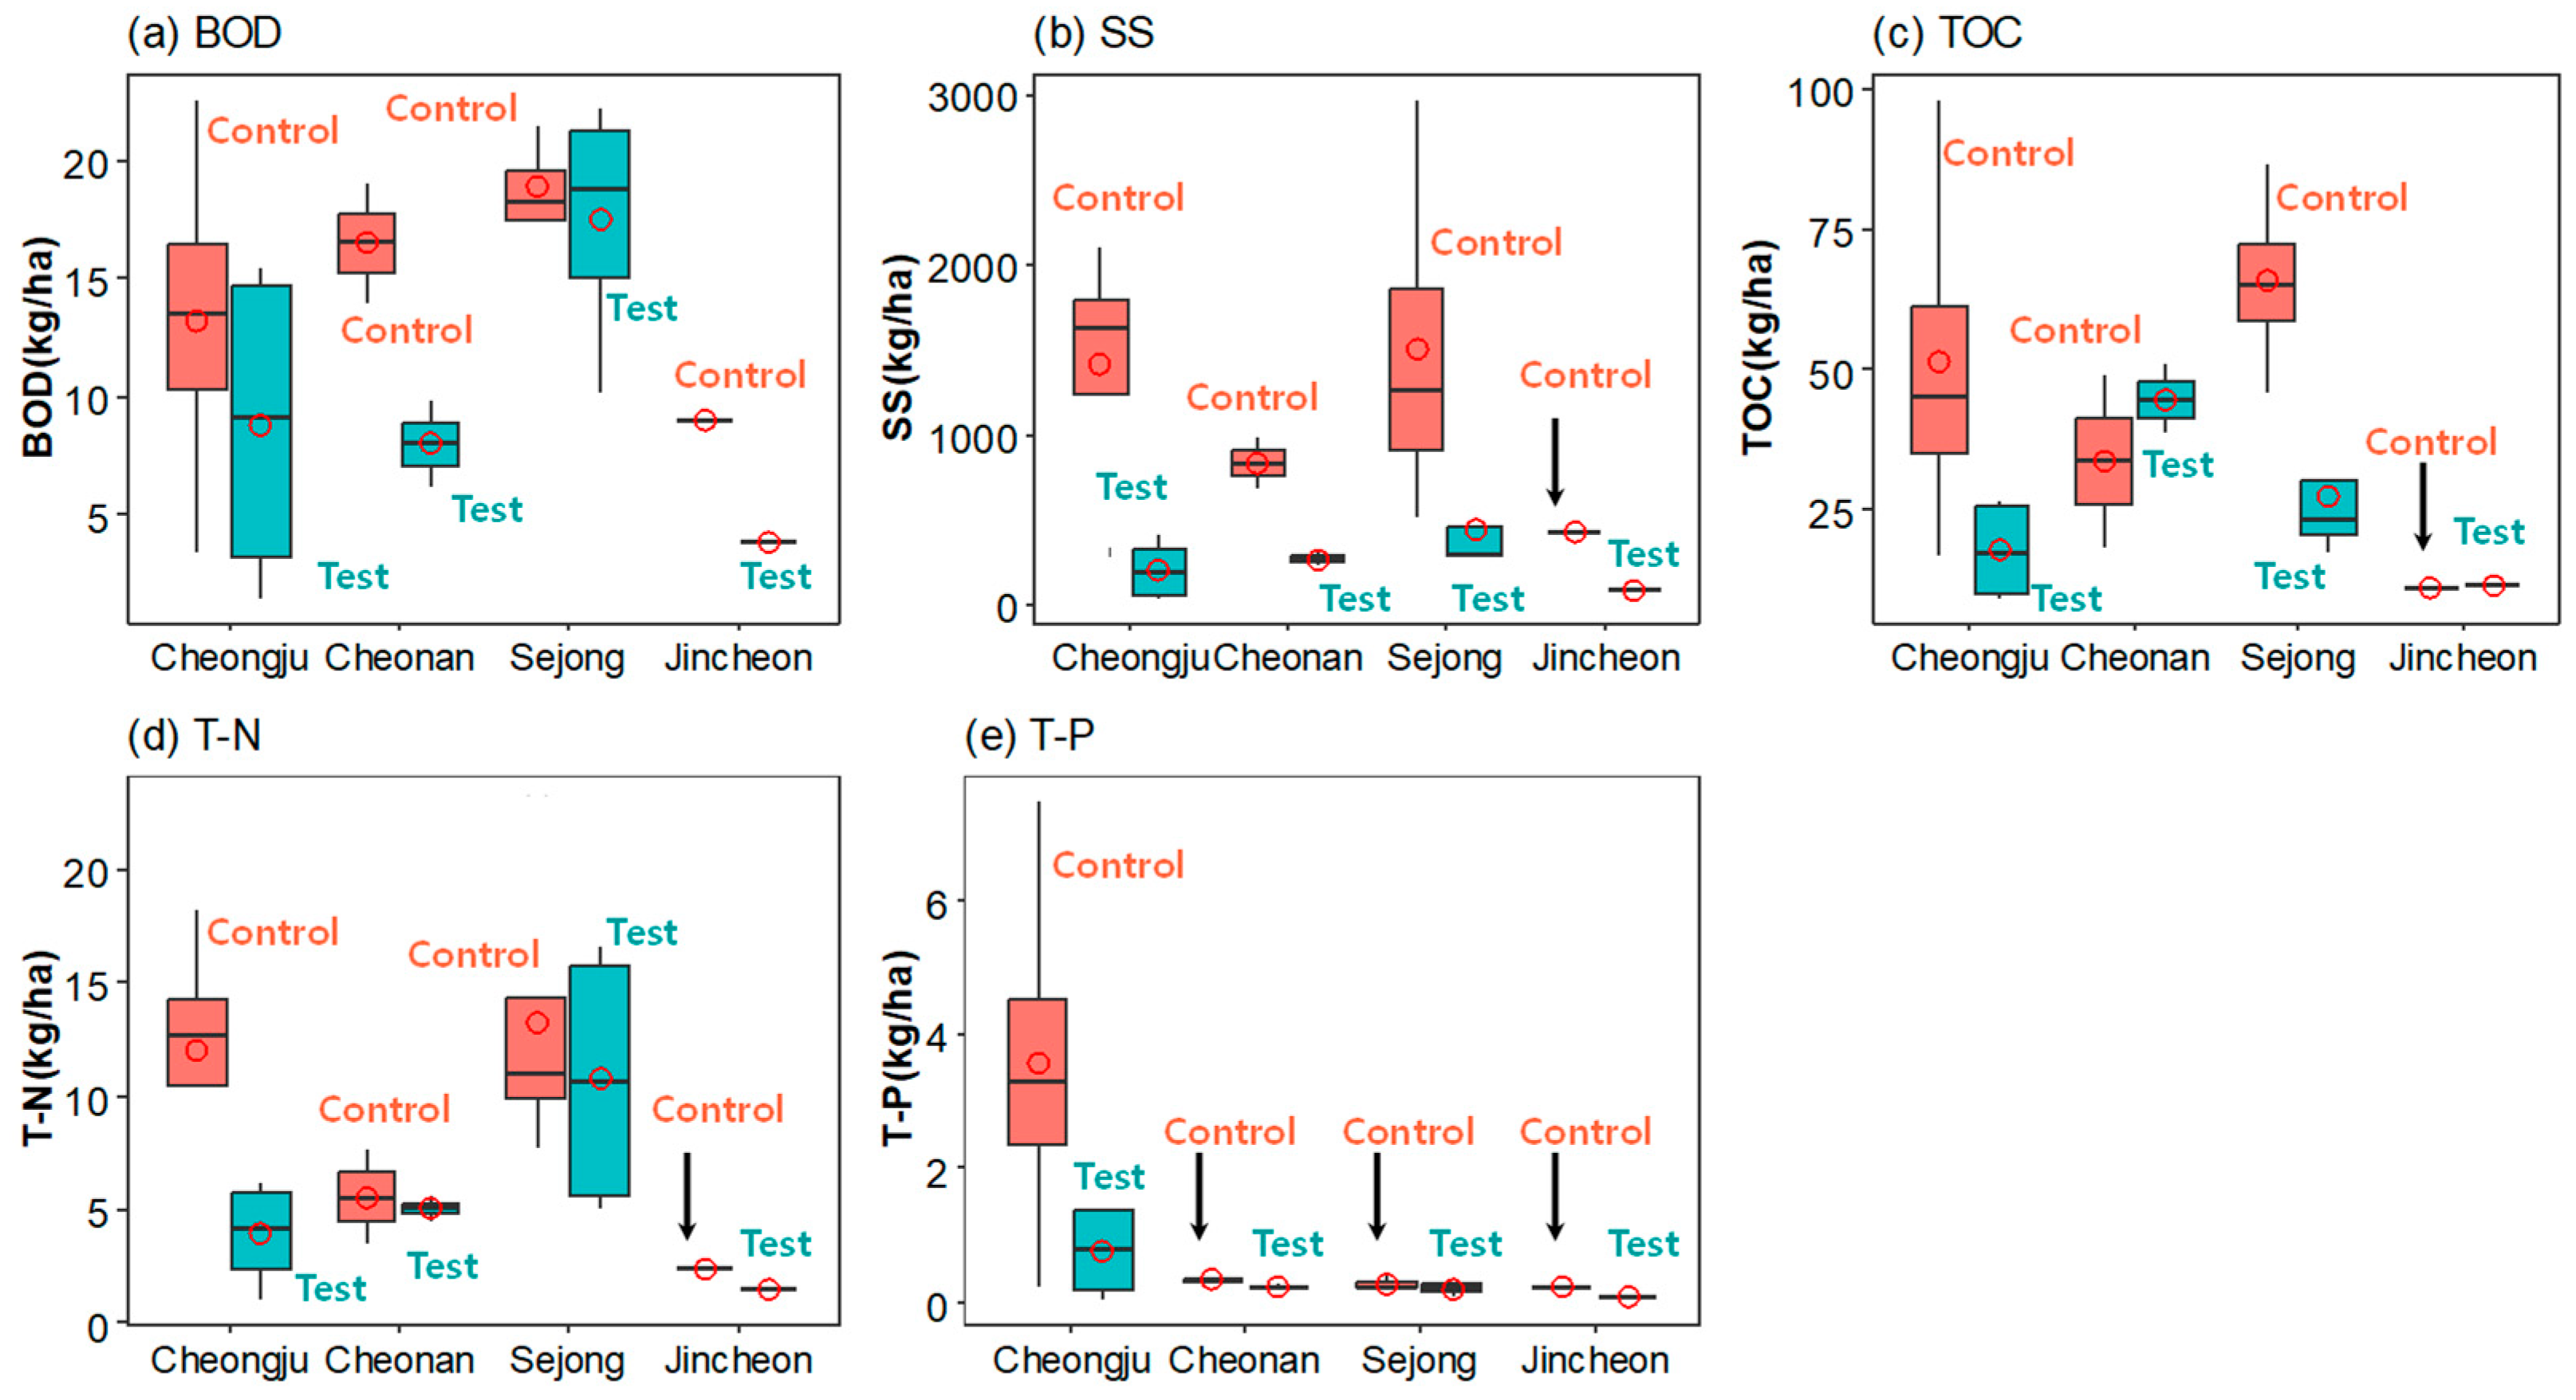
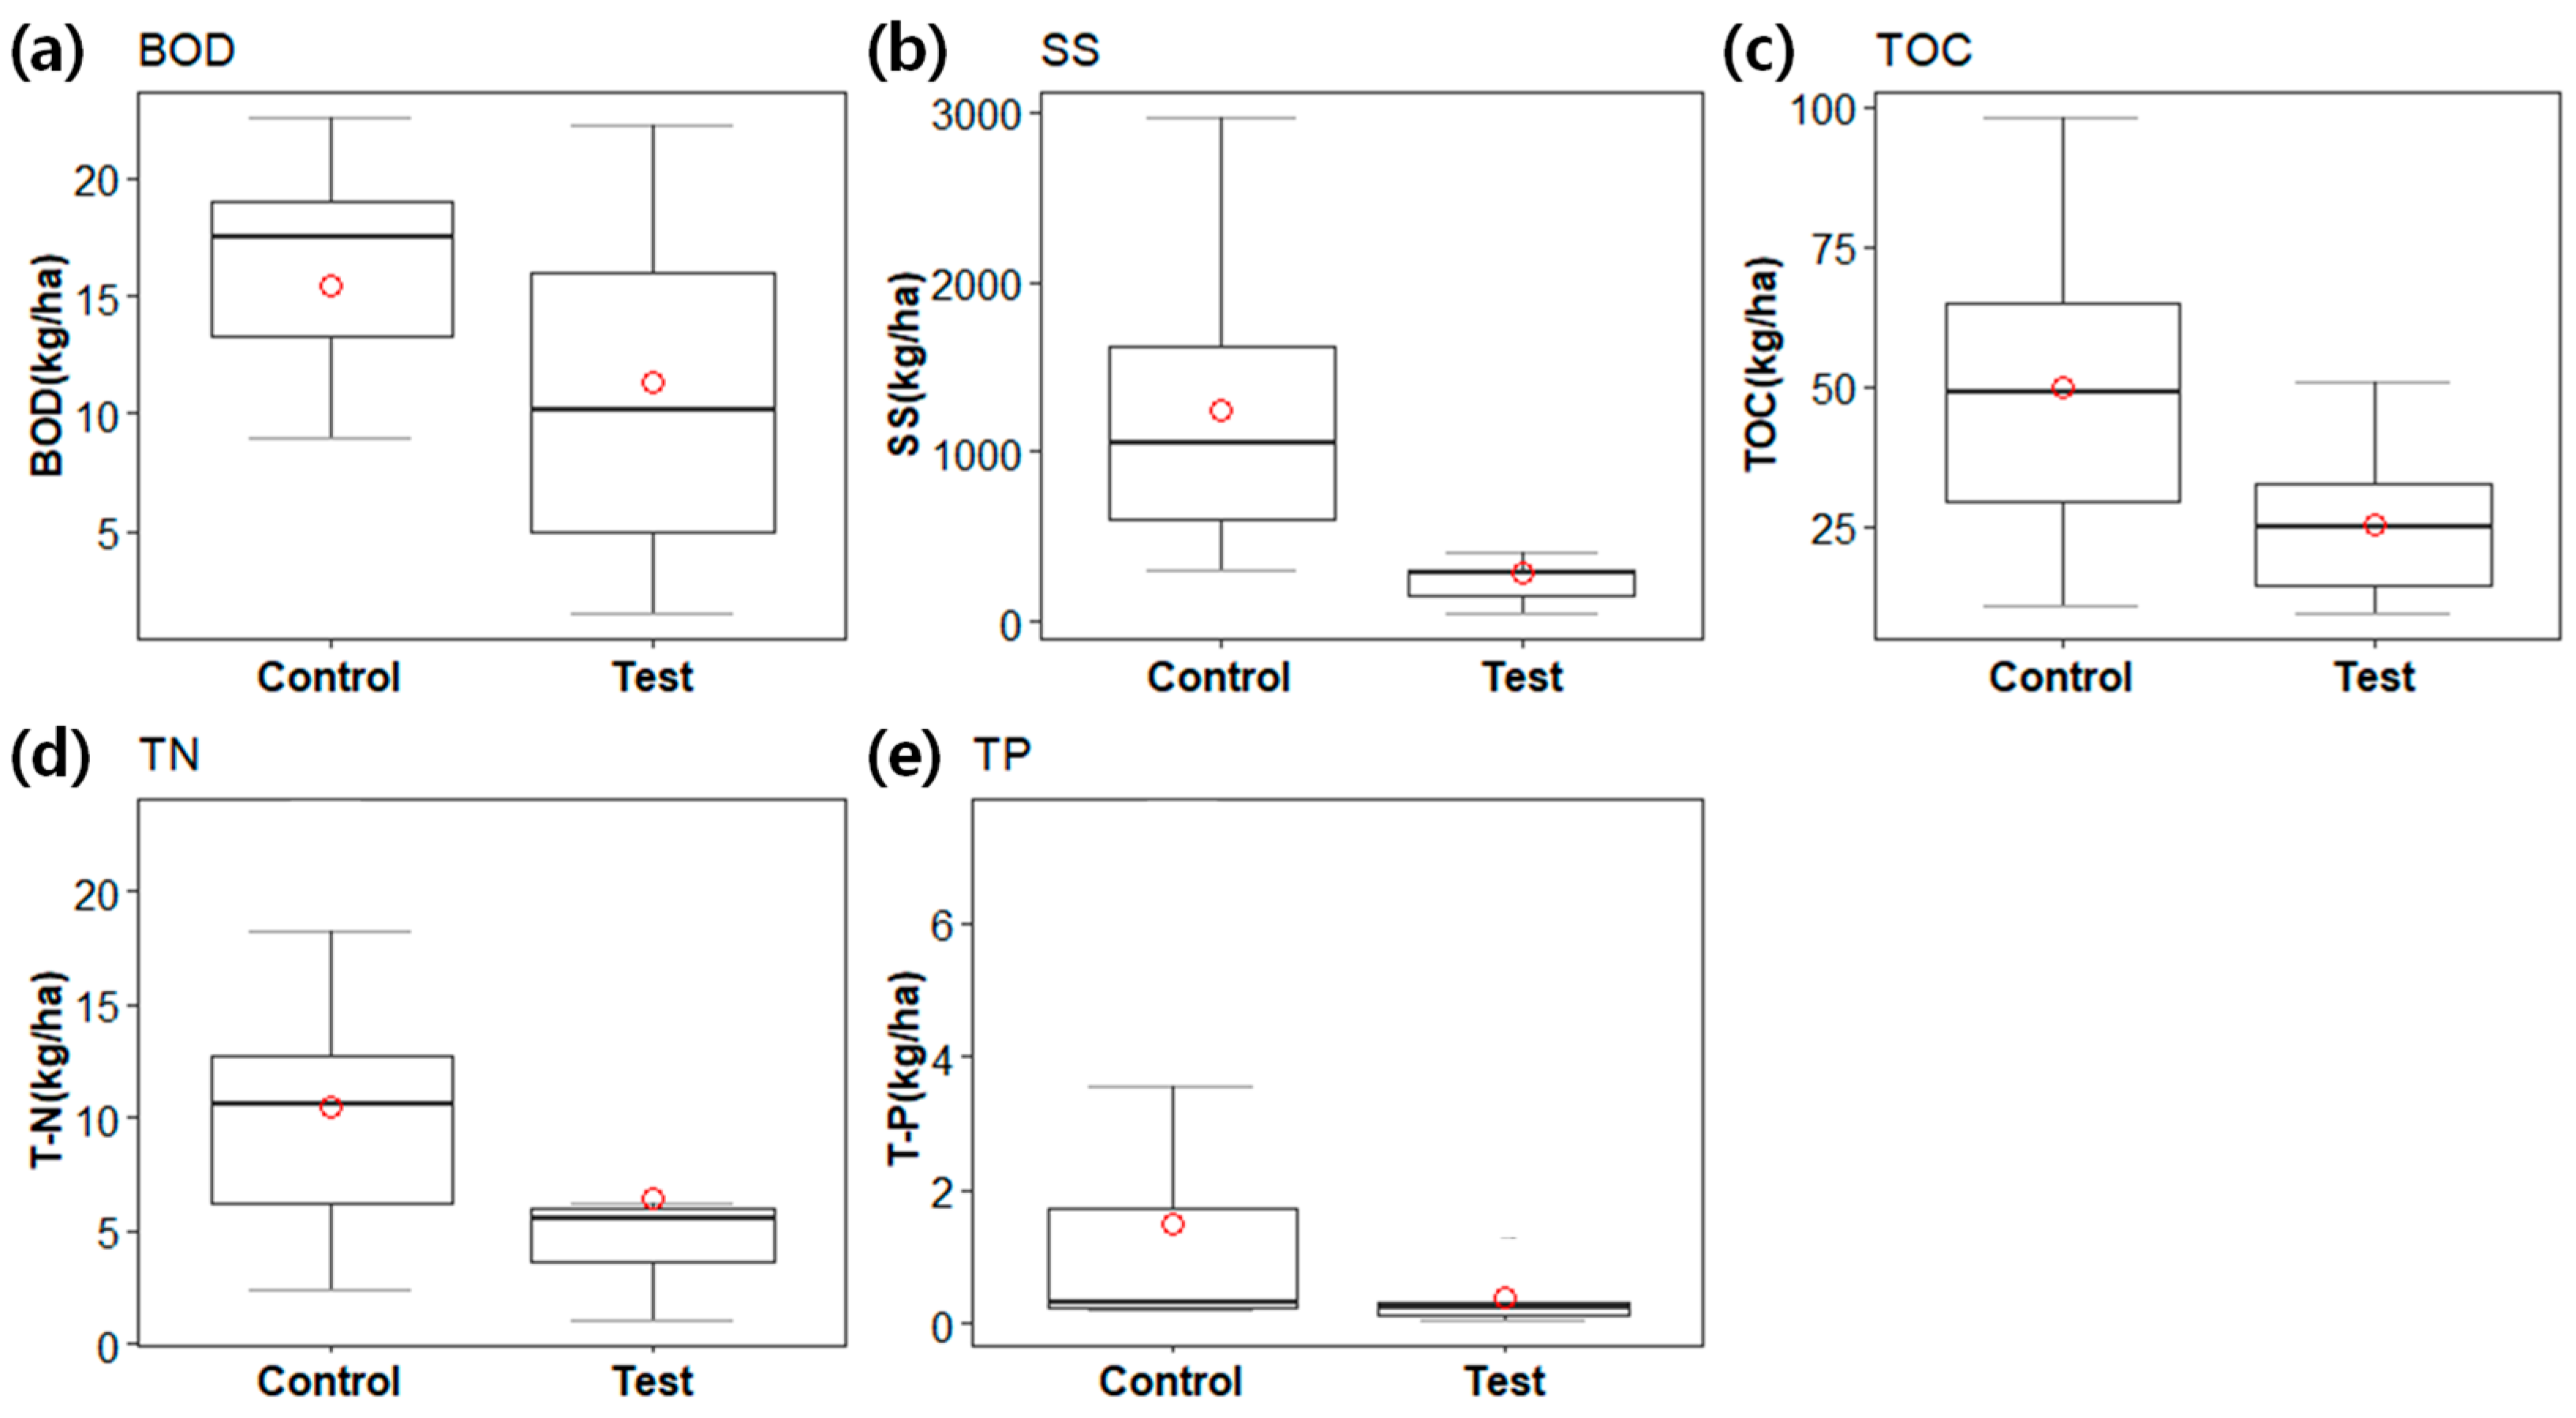
3.1. Discharged Loads from Paddy Fields

The EMCs and pollutant loads in the drainages from the sites in Cheongju are provided in Table S5 and Figure S3 and vary significantly. The loads per unit area of BOD, SS, T-N, T-P, and TOC were 3.80~22.57, 64.94~2095.63, 2.81~18.22, 0.239~7.493, and 10.20~98.02 kg/ha, respectively in HD. They significantly decreased in MD and further in FD to 0.10~1.38, 1.29~25.62, 0.05~0.38, 0.006~0.082, and 0.31~3.69 kg/ha, respectively in FD. It is thought that most of the TN and TP were NO3-N and particulate P, respectively, considering the results of previous studies. In a study performed in Dezhou City, China, NO3-N and particulate P comprised 49.6% of T-N and 73.6% of T-P, respectively, in agricultural runoff [25]. A 10-year field experiment conducted in Fuzhou, China, showed that NO3-N was the major form of N loss from paddy fields [41]. Particulate P accounted for 69.4~79.7% of T-P loss via surface flow from paddy fields in Changsha county, China [42]. T-N and T-P in drainage ditches were increased with the increasing release of paddy field sediments, in a study performed in paddy fields near Yixing City, Jiangsu Province, China [21]. In addition, a high fraction of P supplied by fertilizers was in particulate form, either adsorbed on soil or incorporated into microorganisms in a study on paddy water in Jiangsu Province of the Yangtze River Delta, China [43].
The discharged loads in Cheongju are shown in Figure S3 and summarized in Figure 4 for each drainage period. Notably, most of the loads were discharged in the HD, regardless of the drainage unit, that is, traditional drainage or controlled drainage. The loads of BOD, SS, T-N, T-P, and TOC discharged in HD were 78.9 ± 17.5%, 97.7 ± 2.4%, 85.3 ± 13.6%, 95.1 ± 5.3%, and 70.7 ± 28.0% in the Control, while they were 72.0 ± 19.0%, 87.4 ± 10.7%, 82.7 ± 7.2%, 77.2 ± 22.1%, and 66.8 ± 14.6% in the Test, out of the total annual load, respectively. Filling paddy fields with large amounts of water for 8–15 d before harrowing or transplanting is common, followed by HD, which is an artificial drainage. As fertilizers were applied during this period, they contributed to the highest nutrient loss among the three annual drainages [36].
Table 1 shows the discharged loads in HD, MD, and FD, as well as the total loads, that is, the sum of the loads in the HD, MD, and FD. The results showed a significant reduction in total loads in the Test compared to those in the Control. They were 31.0 ± 28.9%, 83.5 ± 11.8%, 65.4 ± 12.2%, 69.1 ± 21.7%, and 64.9 ± 12.9% for BOD, SS T-N, T-P, and TOC, respectively. The results of the paired t-test show that SS, T-N, and TOC in the Test were significantly different from those in the Control (p < 0.05). The less statistical significance in BOD and T-P is attributable to the high variance in BOD and low values of T-P. However, BOD and T-P in the Test were clearly lower than in its counterpart Control, except for the BOD in OSW-T1 and OSW-C1. This suggests that the drainage quality can be significantly enhanced by changing the traditional drainage to controlled drainage. This is mostly attributable to the reduction in the loads in the HD as well as the substantial reduction in MD, considering the highest load discharge in the HD followed by MD, as shown in Table 1 and Figure 4. This indicates that post-harrowing management will play the most crucial role in the improvement of the quality of the drainage water from paddy fields as well as that of receiving water.
The annual loads from paddy fields reported in the literature are listed in Table 2. The discharged loads from other paddy fields in the ROK were highly variable but comparable to those in this study. Choi et al. [44] analyzed that in paddy fields using cow manure compost, the runoff amounted to 15.7 kg/ha for T-N and 0.4 kg/ha for T-P. Kwon and Yoo [45] conducted a study in Hwaseong, ROK, and found runoff levels of 12.4 kg/ha T-N and 2.2 kg/ha. Yoon et al. [46] reported that during the farming period in extensive paddy fields in Namwon, ROK, the nutrient runoff was 54.7 to 57.8 kg/ha for T-N and 1.96 to 2.33 kg/ha for T-P. Kim et al. [47] found that in the lower reaches of the Iksan-River in the Saemangeum watershed, ROK, the T-N load was 15.5 kg/ha in the conventional management area, 11.7 kg/ha in the water management area, and 8.5 kg/ha in the fertilization management area. In comparison, the T-P load was 1.38 kg/ha in the conventional management area, 1.02 kg/ha in the water management area, and 0.69 kg/ha in the fertilization management area. The loads discharged from the sites in this study were relatively higher than those from paddy fields in Guilan, Iran, Nanjing, and Lianshui [16,20,48,49].
It should be noted that a significant reduction in discharged loads was achieved by irrigation control, such as wet and shallow irrigation, controlled irrigation, and rain-catching and controlled irrigation, in China [16,24,49]. The results of this study suggest that controlled drainage can be an alternative for reducing pollutant discharge from paddy fields as efficiently as irrigation control.

3.2. Discharged Loads from Paddy Fields in HD

The monitoring results in Cheongju revealed that the pollutant loads of HD contributed dominantly to the total discharged loads. Therefore, the HD loads at other sites were investigated in Cheonan, Sejong, and Jincheon, as well as in other plots in Cheongju. The results and those for Cheongju in 2021 are discussed, as summarized in Table S6 and Figure 5 and Figure 6.
The discharged pollutant loads varied significantly but were substantially lower for the Test than for the Control (Table S6). The loads of BOD, SS, T-N, T-P, and TOC in the Control were 3.4~22.6, 305.4~2970.1, 2.41~23.01, 0.2~7.493, and 11~98 kg/ha, respectively, while those in the Test were 1.5~22.2, 41.4~914.1, 1.07~16.67, 0.048~1.398, and 9.4~50.9 kg/ha, respectively.
The paired t-test demonstrated that BOD, SS, T-N, and TOC in the Test were significantly different from those in the Control (p < 0.05), while T-P was not, probably because of low concentrations in Cheonan, Sejong, and Jincheon (0.07~0.41 mg/L, Figure 5e).
The reduction in the discharged loads by controlled drainage also varied significantly and was substantial, with some exceptions. Considering all of the study sites, i.e., Cheongju, Sejong, Cheonan, and Jincheon, it was 30.0 ± 33.6%, 70.9 ± 24.6%, 32.2 ± 45.5%, 45.7 ± 37.0%, and 27.0 ± 71.5%, respectively (Table S6, Figure 5 and Figure 6). The reduced loads of BOD, SS, T-N, T-P, and TOC were 4.1 ± 5.3, 959.2 ± 824.7, 4.0 ± 5.4, 1.1 ± 2.2, and 24.1 ± 30.8 kg/ha, respectively. The results demonstrate that controlled drainage can be as efficient as water-saving irrigation in reducing the loads discharged from paddy fields. Assuming that the controlled drainage was applied to all rice fields in Miho River sub-basin (28,070 ha) [32], they were 115.9 ± 147.4, 26,925.3 ± 23,149.4, 113.1 ± 152.1, 30.4 ± 61.1, and 675.5 ± 864.4 tons, respectively. The reductions in and T-P correspond to 1.2% and 4.5% on average and up to 3.7% and 30.3% of the annual load in the Miho River sub-basin [32], respectively, with statistical significance at p < 0.05. Considering the goal of the ‘3rd Comprehensive Plan for Managing Stormwater Runoff and Non-Point Source Pollution’ in ROK [9], which is a 4% reduction in total T-P, controlled drainage would greatly contribute to the non-point source pollution reduction.
On the other hand, the initial flow rates normalized by the areas of the plots in HD are illustrated in Figure S4, showing that those at the test sites were 74.2 ± 24.9% of those at the Control sites, respectively. This suggests slower discharge from the Test than from the Control, which would decrease the scouring of the paddy field surfaces, therefore reducing SS discharge [53].
ANOVA analysis was conducted to compare the differences in load reductions between parameters, i.e., BOD, SS, T-N, T-P, and TOC, as well as sites (Table S8). The results show that differences in the load reduction in each parameter were significant site by site, but not between parameters (p < 0.05), probably because of the large variances in the load reductions.
Pearson correlations between the pollutants’ load reductions were calculated to investigate their relationships (Table S9). Reduced loads (kg/ha) were compared each other, since the loads were highly varied site by site. Strong correlations were found between T-N, T-P, and TOC reductions, while other pairs showed weak or very weak correlations. The correlation of T-N and T-P is attributable to the same origin, i.e., fertilizer, which is the major source of N and P in paddy fields. In addition, they are applied excessively and their utilization efficiency was as low as 20~30% [54]. The correlations of T-N, T-P, and TOC suggest that they are transported via similar pathways, i.e., from particulate paddy soil to drainage. It was reported that positively charged NH4+-N, which is the major form of N in fertilizer, is attracted by negatively charged soil [54], while P is readily adsorbed onto soil via complexations with Al-Fe oxides and soil organic matter (SOM), as well as electrostatic attraction [23,55,56].
Organic matter (OM) in paddy fields predominantly exists in paddy soil as SOM [57]. Therefore, its discharge with drainage would largely be attributable to solid discharge. However, the correlations of SS with T-N, T-P, and TOC reductions were weak to moderate, suggesting that the dissolution of SOM also significantly affects the discharged loads [55,57]. It should be noted that the correlation between the reductions in BOD and TOC was negligible, and even a negative reduction in TOC was found in Cheonan (Figure 5). This suggests that biodegradable and refractory organic matter co-existed in paddy soil and that their discharges were different. It was reported that the OM in paddy water was 78% non-biodegradables and was mostly composed of fulvic-/humic-like, chromophoric, highly aromatic, and highly humified substances [58]. Therefore, the different discharges of refractory and biodegradable OM are attributable to the differences in water solubility, hydrophobicity, photodegradation, biodegradation, and adsorption onto paddy soil [57].

3.3. Correlations of Discharged Pollutant Loads and Paddy Field Conditions

The quality of discharge from paddy fields, such as runoff nutrients, is significantly influenced by factors such as fertilizer application, soil properties, crop types, nutrient uptake efficiency of crops, and agricultural practices [59,60,61]. The discharged pollutant loads in the HD were correlated with the conditions at the studied sites to identify the factors affecting them (Table 3).
Most of the correlations were statistically significant at the p < 0.05 level, with several exceptions. It was found that it is not plausible to establish generalized correlations between the discharged loads and physical conditions such as paddy water depth, total discharge volume, and area. The paddy water depth strongly correlated with only the BOD load of the discharge at both the control and test sites, but the correlation was statistically insignificant (p > 0.05). The depth and discharge volume were moderately correlated with the SS and TOC at the Test sites, whereas the area was not significantly correlated with any of the discharged loads. The initial flow velocity, flow rate, and pollutant concentrations (Table S7) were also investigated because they are related to the scouring of paddy field surfaces, which significantly affects pollutant discharge [53,62]. However, they showed no notable correlation with the discharged loads. In addition, most quality indicators of irrigation water were not highly correlated with the pollutant loads. Only T-P in the irrigation water showed moderate to strong correlations with BOD and T-N loads in discharges from the test sites.
Moreover, the discharged loads were not dependent on soil properties or the dose of N and P as fertilizers, except for T-N in the soil and T-P in the discharges. Fertilization has been reported to contribute significantly to the concentrations of N and P in paddy water [27]. However, they decrease greatly within two weeks of application [12], by which time the effects of fertilizer on N and P in the drainage would not be significant. In addition, N loss via surface runoff is only significantly affected by fertilizers in the early stages of application [28,29]. Additionally, the results of a study using the SWAT model showed that the fertilizers reduced by only 1.0~20.5% of the T-N and T-P in the nearby Guishui River, China, while they were reduced by 32.5~71.0% near vegetation filtering strips and grassed waterways [63].
The total discharge volume, initial flow velocity, and initial flow rate were normalized by area to more closely investigate their correlations with the loads because the area of a Control site was significantly different from its counterpart Test site (Table S1). The ratio of the test site area to the control site was in the range of 0.33~3.40. However, the correlations with the loads were limited. The area-normalized total discharge volume was well correlated only with BOD, and a strong correlation was found between BOD in the Control and area-normalized initial flow velocity. The area-normalized initial flow rate showed good correlations with BOD in the Control as well as BOD, SS, and T-N in the Test.
Since there was no notable correlation between the discharged loads and the conditions, they were correlated with paddy water quality for seven (7) Test sites and three (4) Control sites in Jincheon and Cheonju, where paddy water quality was measured. Different from other conditions in the Control sites, the loads of SS, T-N, and T-P from Control showed strong to very strong positive correlations with their counterparts, i.e., SS, T-N, and T-P in paddy water, respectively. SS load also positively and very strongly correlated with T-P, indicating that most of the T-P in discharge was associated with particulates, as mentioned before [23,55,56]. In addition, the irregularity of the flow rate and flow velocity in the discharge from the Control sites may cause scouring of the field bed and dissolution of the components in the soil and SS. Sediment release from shallow waters has been shown to significantly increase N and P, as reported in studies conducted in the Yellow River Delta [53], Baitan Lake [62], and a reservoir in East China [64]. It was also found that runoff scoured paddy field surfaces and transported N from paddy soils to adjacent waters [21,65,66]. This suggests that less solid discharge with less flow disturbance results in lower T-P discharge. This is also supported by the lower initial flow velocity and flow rate per unit area in the Test than in the Control (Figure S3). T-N load was very strongly correlated positively with paddy water BOD and TOC, but negatively with SS and T-P, most of which was particulate. This suggests that a significant fraction of N was soluble organic N. T-P load showed the opposite correlations to T-N. It was positively correlated with SS but negatively with BOD, T-N, and TOC. BOD and TOC loads were negatively correlated with SS, while they did not show a strong correlation with other parameters in paddy water. This suggests that a large fraction of the OM was in dissolved form, which is not carried by solids, and was subjected to extensive dissolution, photodegradation, and biodegradation [55,57].
At the Test sites, strong correlations were limitedly found between SS, T-N, T-P, and TOC loads and their concentrations in paddy water. SS load was well-correlated with T-P in paddy water, most of which would be in the solid phase. It should be noted that TOC was strongly correlated with BOD, probably because of the extended and near-equilibrium photodegradation and biodegradation of OM in paddy fields via extended retention by controlled drainage [57].
The results suggest that the concentrations of SS, T-N, and T-P in paddy water can be indicative of their discharged loads. Therefore, multiple linear regressions were conducted to predict discharged loads using paddy water quality parameters [67]. The regressions were performed at a total of 11 Test and Control sites, where paddy water quality was measured. The discharged loads of BOD, SS, T-N, T-P, and TOC were dependent variables, and the independent variables were the concentrations of SS, T-N, and T-P in paddy water (Table 4). The coefficients of determination were very low (0.1548~0.2933) when the interactions were not considered between the concentrations of SS, T-N, and T-P, with the exception of T-N load (0.5499). They were greatly raised to 0.5179~0.7513 when the interactions were incorporated, except for BOD load (0.2964). The predicted values using the model were compared to observed ones (Figure S5), demonstrating that the correlations between them were fair to good. However, the regression constants were not statistically significant, which is attributable to the limited number of data. The coefficient of the interactions between SS and T-N solely showed a p-value of <1.0 in predicting SS load. Therefore, more field experiments must be conducted to establish a better relationship.

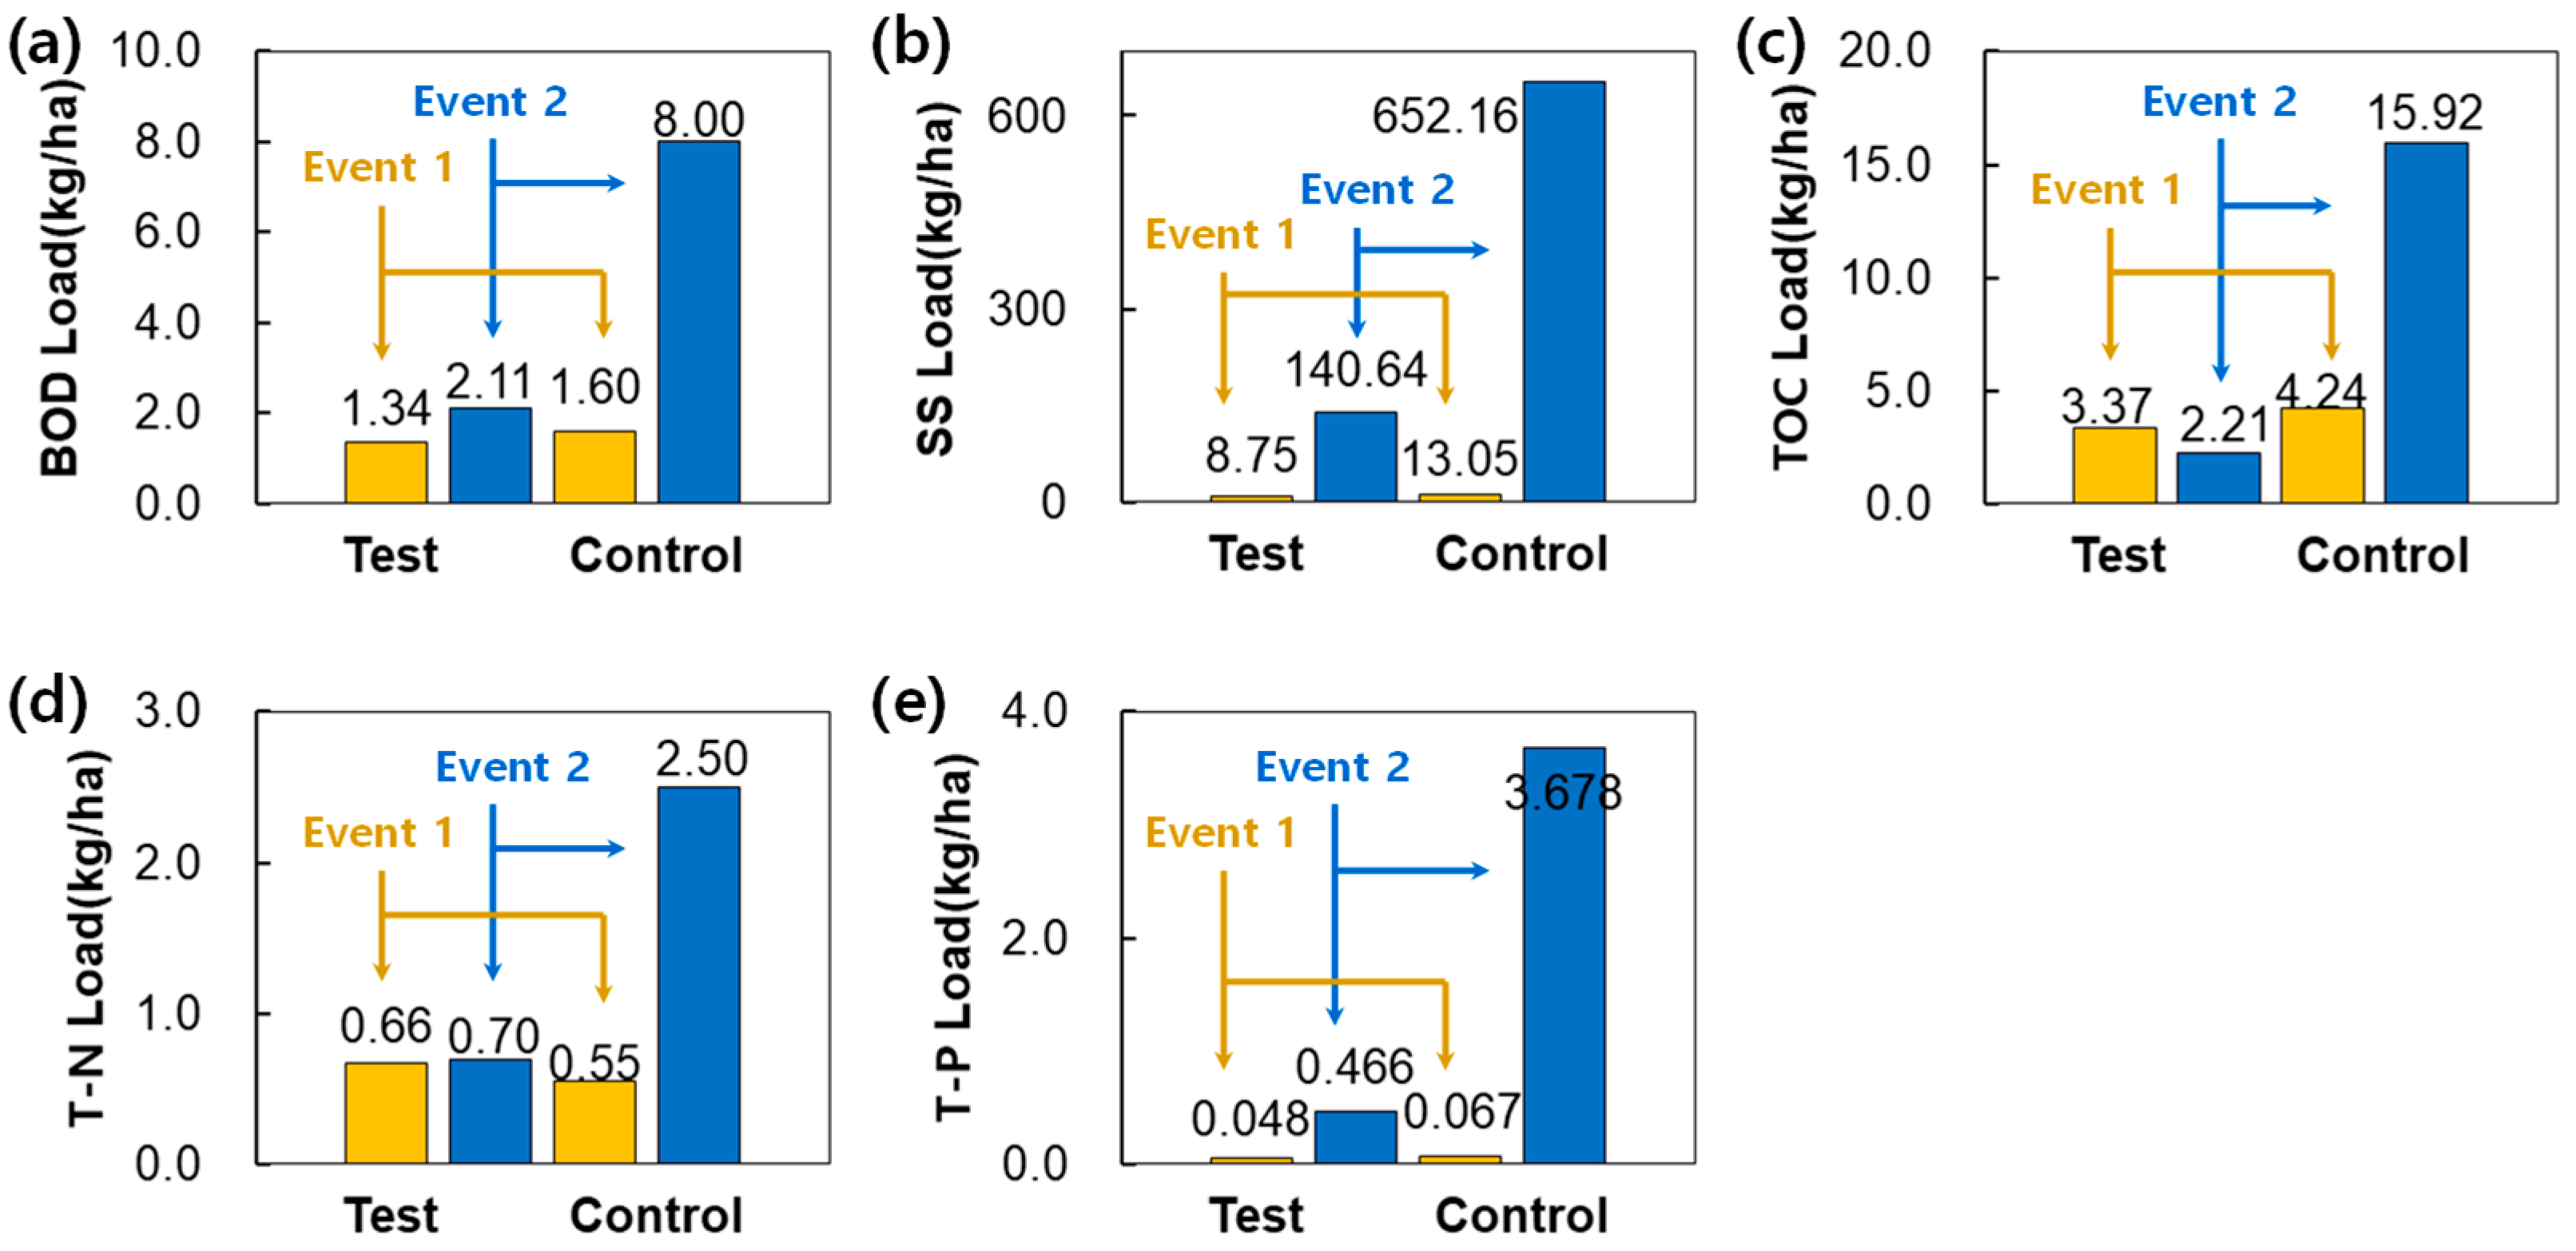
3.4. Characteristics of Stormwater Runoff

It seems clear that controlled drainage is beneficial for reducing pollutant discharge during agricultural drainage, that is, HD, MD, and FD. It has been speculated that the drainage type, that is, traditional drainage or controlled drainage, might also affect the quality and quantity of stormwater runoff [24]. The pollutants carried by stormwater runoff are believed to be important non-point sources in nearby water systems that are not controllable [68]. Therefore, stormwater runoff from the control and test sites in Cheongju was investigated. The rainfall, surface runoff flow rate, and EMC of each event at the Cheongju site are presented in Figure S6 and Table S10.
The flow rate and EMC of the runoff were significantly lower in the Test than in the Control for both events. The peak flow was 0.407 and 0.0543 m3/s at Event 1 and 0.47 and 0.26 m3/s at Event 2 for the Control and Test, respectively. The reduction in EMC in the Test group compared to that in the Control was 15.6~49.7% and 31.2~68.8% for Events 1 and 2, respectively. It was higher when the rainfall amount was higher, that is, higher in Event 2 (122.5 mm) than Event 1 with lower rainfall (13.0 mm).
The pollutant loads in the runoff were higher in the Control than in the Test, except for T-N in Event 2, where the loads were low in both the Control and Test (Figure 7). In Event 1, the loads of BOD, SS, T-N, T-P, and TOC in the Control and Test were 1.60 and 1.34, 13.05 and 8.75, 0.55 and 0.66, 0.067 and 0.048, and 4.24 and 3.37 kg/ha, respectively. In Event 2, they were 8.0 and 2.1, 652.2 and 140.6, 2.50 and 0.70, 3.678 and 0.466, and 15.92 and 2.21 kg/ha, respectively. The reduced values were as follows: 16.0~73.7%, 33.0~78.4%, −20.7~72.1%, 28.1~87.3%, and 20.6~86.1%, respectively. It was also reported that the runoff drainage volume was decreased by 31.3~47.5%, while the loads of T-N, NH4+-N, and NO3-N discharged by the runoffs were reduced by 65.3~69.8% in paddy fields in China when controlled drainage units were used [24].
Notably, the reduction by controlled drainage would be significantly higher if the total annual precipitation in Cheongju, which was 1731.0 mm in 2023 [69], was considered because stormwater is one of the major pathways of T-N and T-P loss from paddy fields [70]. However, the effects of rainfall amount on pollutant discharge leave more to be explored. In a study in Yixing, China, N and P release from paddy fields increased with the increasing return period of rainfall [21]. On the other hand, in the Yangtze River Basin, China, T-N discharge was mostly influenced by short-term and intensive rainfall events, while both the period and the intensity of a rainfall determined T-P loss [70]. In a previous study performed in rice paddy fields in the ROK, the N and P loads in the runoff were monitored for one year from 13 May 1997 to 12 May 1998 [28]. The study period was divided into four stages: fertilizer application, rainy season, non-plowing, and plowing. The total precipitation in each stage was 726.7, 507.1, 236.4, and 286.4 mm, respectively, and it was positively correlated with the discharged loads of N and P. In addition, the total N and P loads in the period were 188.3 and 6.0 kg/ha, respectively. However, this may not suggest that the pollutant release was increased by higher precipitation because fertilizer was applied when the precipitation was the highest. Therefore, it is suggested that the effects of rainfall on pollutant discharge from paddy fields must be further elaborated, considering the characteristics of an event, such as intensity and period, as well as the paddy filed conditions, such as fertilizer and water amount.

3.5. Limitations of This Study, Further Study, and Suggestions for a Greater Reduction in Pollutant Load from Paddy Fields

The results in this study strongly suggest that drainage control is highly likely in the pollutant discharge reduction from paddy fields in agricultural drainage and in stormwater runoff. However, it is thought that much more is to be elaborated to confirm and quantify the reduction as well as to allow for proper field application. First, more field tests are necessary to ensure statistically meaningful reduction. Second, the long-term fates of N and P, mainly introduced by fertilizers, must be investigated more. They have been subjected to a variety of physicochemical and biological reactions and are discharged through both surface and subsurface pathways [12,28,29], so this study demonstrated that the discharged loads were not correlated with fertilizer applications (Table 3). Third, the effects of rainfall on the discharge should be explored further. The fluxes of N and P loss are mainly driven not only by agricultural discharge but also by rainfall, especially by extreme rainfall events from climate change [6,21,70,71]. Climate changes have significant effects on agricultural water management by increasing extreme weather events, i.e., droughts, floods, and heatwaves, enhancing evapotranspiration, and deteriorating water quality [72]. Fourth, the discharge of organic matter is worthy of detailed investigation. It has hardly been studied, but a significant discharge of organic matter was demonstrated in this study, and its impacts on receiving water are reported. In the Takase River system, Japan, the dissolved organic matter (DOM) in the river turned more allochthonous and humic-like in the rice cropping period, changing the ecological effects and bioavailability of the DOM [73].
Based on the results in this study and in the literature, there is suggested potential for a greater reduction in pollutant discharge from rice paddy fields, via the combinations of various alternatives. Other than drainage control in this study, a number of methods have been proposed and tested for the reduction of pollutant loss from paddy fields. These include on-site management such as drainage control and water-saving irrigation, which were discussed in this study [12,19], as well as optimizing fertilizer application. It was demonstrated that the mitigation of N and P application in 20% of the rice fields in China would decrease 48% of N and 70% of P. On the other hand, good potential for off-site treatment was shown. They include wetlands, ditches, and plant buffer zones, where paddy water discharge was introduced before it reached the receiving water. High N and P removal in those systems were reported in an aquatic vegetable wetland—an ecological ditch system in the Taihu Lake Region of South China [71], a plant buffer zone—antifouling curtain wall systems in Nanjing and Yuyao, China [74], a U shaped eco-ditch planted with Zizania latifolia, Canna indica, and Pontederia cordata followed by wetlands [75], and an ecological ditch followed by a vegetated wetland [76]. Therefore, it is thought that the best available reduction can be achieved by the optimum combinations of on-site management and off-site treatment, considering local conditions.

4. Conclusions

This study investigated the discharged pollutant loads in the agricultural drainage and stormwater runoff of 22 rice paddy field plots in the Miho River sub-basin in the ROK to evaluate the feasibility of reducing pollutant discharge using controlled drainage.
The loads of BOD, SS T-N, T-P, and TOC in the agricultural discharge from the Control in Cheongju were 16.4~22.5, 1049.9~2082.3, 11.4~19.3, 2.1~7.5, and 62.5~101.6 kg/ha, respectively. The load from the Test was significantly reduced compared to the Control. The average reduction of total loads in the total agricultural discharges, i.e., in HD, MD, and FD, was in the range of 31.0~83.5%. The loads in HD accounted for 66.8~97.7% of the total discharged loads; therefore, they were further investigated in plots in other areas. They were highly varied both in the Control and Test but reduced significantly in the Test by 30.0~70.9% on average. The results of the ANOVA analysis demonstrated that the reductions were highly variable and were significantly different site by site. The reduction in stormwater runoff loads by controlled drainage was also demonstrated to be 16.0~86.1% on average, for two (2) rainfall events.
The discharged loads did not show a notable correlation with the paddy water depth, area, discharge volume, initial flow velocity, initial flow rate, irrigation water quality, soil properties, or fertilizer application. However, the loads of SS, T-N, and T-P were strongly associated with paddy water quality. Multiple regressions demonstrated that the loads could be predicted by paddy water quality at the Tests sites, but more data are necessary to give a statistically significant prediction.
Overall, the results of this study indicate that controlled drainage can be a good alternative for reducing pollutant load discharge from paddy fields and thereby improving the water quality in the basin. Further, it is suggested that further reduction would be achieved by more field study, identification of the fates of pollutants, considering the effects of rainfall and climate changes, and combinations of various discharge mitigation alternatives optimized for the specific site conditions.

Supplementary Materials

The following supporting information can be downloaded at https://www.mdpi.com/article/10.3390/w17111650/s1, Table S1: Area, total discharge volume, and paddy water depth of each site; Table S2: Irrigation water quality (mg/L); Table S3: Properties of the soil in the study sites; Table S4: Fertilizer application; Table S5: EMCs and pollutant loads for each discharge from the paddy fields; Table S6: Discharged loads in HD in the control and test sites (kg/ha) and the reduction of them using controlled drainage; Table S7: Initial concentration of the discharges in HD (mg/L); Table S8: ANOVA results of the reductions of each pollutant load (Two-way without Replication; Table S9: Pearson correlations coefficients between pollutant load; Table S10: EMC and pollutant loads in the rainfall events in Cheongju; Figure S1: Controlled drainage unit (MG-008, PPS Inc., Yongin, ROK); Figure S2: Monitoring points of runoff during rainfall; Figure S3: Changes in discharged loads from the study sites at each agricultural drainage period in Cheongju: (a) BOD, (b) SS, (c) TOC, (d) T-N, and (e) T-P; Figure S4: Area normalized flow velocities in (a) Cheongju, (b) Cheonan, (c) Sejong, and (d) Jincheon; and area normalized flowrates in (e) Cheongju, (f) Cheonan, (g) Sejong, and (h) Jincheon, for the discharges after harrowing (HD); Figure S5: Observed vs. predicted values the discharged loads of (a) BOD, (b) SS, (c) T-N, (d) T-P, and (e) TOC; Figure S6: Rainfall on and stormwater runoffs from the (a) Controls and Tests in Event 1, and (b) Controls and Tests in Event 2, in Cheongju.

Author Contributions

Conceptualization, S.K. and S.J.; methodology, S.J. and D.K.; software, S.J. and D.K.; validation, S.K. and D.K.; formal analysis, S.J.; investigation, S.J.; resources, S.K.; data curation, D.K. and S.J.; writing—original draft preparation, S.J. and D.K.; writing—review and editing, S.K.; visualization, S.J. and D.K.; supervision, S.K.; project administration, S.K. and S.J.; funding acquisition, S.J. and S.K. All authors have read and agreed to the published version of the manuscript.

Funding

This study was supported by the Environmental Basic Survey Project of the Geumgang River Basin Management Committee. This work was supported by the National Research Foundation of Korea (NRF) grant funded by the Korea Government (MSIT) (RS-2025-00516435).

Data Availability Statement

The datasets presented in this article are available only under the permission of the Korean Ministry of Environment owns them.

Conflicts of Interest

The authors declare no conflicts of interest.

References

  1. Zhao, C.; Piao, S.L.; Wang, X.H.; Huang, Y.; Ciais, P.; Elliott, J.; Huang, M.T.; Janssens, I.A.; Li, T.; Lian, X.; et al. Plausible rice yield losses under future climate warming. Nat. Plants 2017, 3, 16202. [Google Scholar] [CrossRef] [PubMed]
  2. Chauhan, B.S.; Jabran, K.; Mahajan, G. Rice Production Worldwide; Springer International Publishing: Berlin/Heidelberg, Germany, 2017. [Google Scholar]
  3. International Fertilizer Association (IFA) and International Plant Nutrition Institute (IPNI). Assessment of Fertilizer Use by Crop at the Global Level 2014-2014/15; IFA: Paris, France, 2017. [Google Scholar]
  4. Deng, J.; Zhou, Z.; Zhu, B.; Zheng, X.; Li, C.; Wang, X.; Jian, Z. Modeling nitrogen loading in a small watershed in southwest China using a DNDC model with hydrological enhancements. Biogeosciences 2011, 8, 2999–3009. [Google Scholar] [CrossRef]
  5. Han, H.; Gao, R.; Cui, Y.; Gu, S. Transport and transformation of water and nitrogen under different irrigation modes and urea application regimes in paddy fields. Agric. Water Manag. 2021, 255, 107024. [Google Scholar] [CrossRef]
  6. Baker, E.A.; Cappato, A.; Todeschini, S.; Tamellini, L.; Sangalli, G.; Reali, A.; Manenti, S. Combining the Morris Method and Multiple Error Metrics to assess aquifer characteristics and recharge in the lower Ticino basin, in Italy. J. Hydrol. 2022, 614, 128536. [Google Scholar] [CrossRef]
  7. Hou, X.K.; Zhan, X.Y.; Zhou, F.; Yan, X.Y.; Gu, B.J.; Reis, S.; Wu, Y.L.; Liu, H.B.; Piao, S.L.; Tang, Y.H. Detection and attribution of nitrogen runoff trend in China’s croplands. Environ. Pollut. 2018, 234, 270–278. [Google Scholar] [CrossRef]
  8. Fu, J.; Wu, Y.; Wang, Q.; Hu, K.; Wang, S.; Zhou, M.; Hayashi, K.; Wang, H.; Zhan, X.; Jian, Y.; et al. Importance of subsurface fluxes of water, nitrogen and phosphorus from rice paddy fields relative to surface runoff. Agric. Water Manag. 2019, 213, 627–635. [Google Scholar] [CrossRef]
  9. Joint Ministry of Korea. Comprehensive Plan for Managing Stormwater Runoff and Non-Point Source Pollution, 3rd ed.; Joint Ministry of Korea: Sejong, Republic of Korea, 2020. [Google Scholar]
  10. OECD. Agri-Environmental Indicators/Nutrient Balances. 2021. Available online: https://data-explorer.oecd.org (accessed on 10 January 2025).
  11. Matamoros, V.; Caiola, N.; Rosales, V.; Hernández, O.; Ibáñez, C. The role of rice fields and constructed wetlands as a source and a sink of pesticides and contaminants of emerging concern: Full-scale evaluation. Ecol. Eng. 2020, 156, 105971. [Google Scholar] [CrossRef]
  12. Liu, R.; Ouyang, W.; Wang, Y.; Lian, Z.; Pan, J.; Liu, H.; Chen, J.; Niu, S. Paddy water managements for diffuse nitrogen and phosphorus pollution control in China: A comprehensive review and emerging prospects. Agric. Water Manag. 2023, 277, 108102. [Google Scholar] [CrossRef]
  13. Arouna, A.; Dzomeku, I.K.; Shaibu, A.G.; Nurudeen, A.R. Water Management for Sustainable Irrigation in Rice (Oryza sativa L.) Production: A Review. Agronomy 2023, 13, 1522. [Google Scholar] [CrossRef]
  14. Lampayan, R.M.; Bouman, B.A.M.; de Dios, J.L.; Espiritu, A.J.; Soriana, J.B.; Lactaoen, A.T.; Faronilo, J.E.; Thant, K.M. Yield of aerobic rice in rainfed lowlands of the Philippines as affected by nitrogen management and row spacing. Field Crops Res. 2010, 116, 165–174. [Google Scholar] [CrossRef]
  15. Han, H.; Cui, Y.; Huang, Y.; Wang, S.; Duan, Q.; Zhang, L. Impacts of the channel/barrier effect and three-dimensional climate-A case study of rice water requirement and irrigation quata in Yunnan, China. Agric. Water Manag. 2019, 212, 317–327. [Google Scholar] [CrossRef]
  16. Wu, M.; Cao, X.; Guo, X.; Xiao, J.; Ren, J. Assessment of grey water footprint in paddy rice cultivation: Effects of field water management policies. J. Clean. Prod. 2021, 313, 127876. [Google Scholar] [CrossRef]
  17. Hama, T.; Nakamura, K.; Kawashima, S.; Kaneki, R.; Mitsuno, T. Effects of cyclic irrigation on water and nitrogen mass balances in a paddy field. Ecol. Eng. 2011, 37, 1563–1566. [Google Scholar] [CrossRef]
  18. Feng, Y.; Yoshinag, I.; Shiratani, E.; Hitomi, T.; Hasebe, H. Characteristics and behavior of nutrients in a paddy field area equipped with a recycling irrigation system. Agric. Water Manag. 2004, 68, 47–60. [Google Scholar] [CrossRef]
  19. Zampieri, M.; Ceglar, A.; Manfron, G.; Toreti, A.; Duveiller, G.; Romani, M.; Rocca, C.; Scoccimarro, E.; Podrascanin, Z.; Djurdjevic, V. Adaptation and sustainability of water management for rice agriculture in temperate regions: The Italian case-study. Land Degrad. Dev. 2019, 30, 2033–2047. [Google Scholar] [CrossRef]
  20. Wu, M.; Li, Y.; Xiao, J.; Guo, X.; Cao, X. Blue, green, and grey water footprints assessment for paddy irrigation-drainage system. J. Environ. Manag. 2022, 302, 114116. [Google Scholar] [CrossRef]
  21. Shi, L.; Li, S. Simulation Study on Water Quality of Paddy Field Ditches Considering the Effects of Rainfall and Sediment Release. Sustainability 2024, 16, 1075. [Google Scholar] [CrossRef]
  22. Hua, L.; Zhai, L.; Liu, J.; Liu, H.; Zhang, F.; Fan, X. Effect of irrigation-drainage unit on phosphorus interception in paddy field system. J. Environ. Manag. 2019, 235, 319–327. [Google Scholar] [CrossRef]
  23. Liu, L.; Ouyang, W.; Liu, H.; Zhu, J.; Fan, X.; Zhang, F.; Ma, Y.; Chen, J.; Hao, F.; Lian, Z. Drainage optimization of paddy field watershed for diffuse phosphorus pollution control and sustainable agricultural development. Agriculture, Ecosyst. Environ. 2021, 308, 107238. [Google Scholar] [CrossRef]
  24. Yu, Y.; Xu, J.; Zhang, P.; Meng, Y.; Xiong, Y. Controlled Irrigation and Drainage Reduce Rainfall Runoff and Nitrogen Loss in Paddy Fields. Int. J. Environ. Res. Public Health 2021, 18, 3348. [Google Scholar] [CrossRef]
  25. Li, X.-N.; Zhang, W.-W.; Wu, J.-Y.; Li, H.-J.; Zhao, T.-K.; Zhao, C.-Q.; Shi, R.-S.; Li, Z.-S.; Wang, C.; Li, C. Loss of nitrogen and phosphorus from farmland runoff and the interception effect of an ecological drainage ditch in the North China Plain—A field study in a modern agricultural park. Ecol. Eng. 2021, 169, 106310. [Google Scholar] [CrossRef]
  26. National Institute of Agricultural Sciences (NIAS), Korea. Characteristics of Agricultural Non-Point Source Pollution Discharge and Development of Its Integrated Management Practice; NIAS: Wanju, Republic of Korea, 2015. [Google Scholar]
  27. Li, S.S.; Liu, H.B.; Zhang, L.; Li, X.; Wang, H.; Zhuang, Y.; Zhang, F.; Zhai, L.; Fan, X.; Hu, W.; et al. Potential nutrient removal function of naturally existed ditches and ponds in paddy regions: Prospect of enhancing water quality by irrigation and drainage management. Sci. Total Environ. 2020, 718, 137418. [Google Scholar] [CrossRef]
  28. Cho, J.-Y. Seasonal runoff estimation of N and P in a paddy field of central Korea. Nutr. Cycl. Agroecosystems 2003, 65, 43–52. [Google Scholar] [CrossRef]
  29. Cui, N.; Cai, M.; Zhang, X.; Abdelhafez, A.A.; Zhou, L.; Sun, H.; Chen, G.; Zou, G.; Zhou, S. Runoff loss of nitrogen and phosphorus from a rice paddy field in the east of China: Effects of long-term chemical N fertilizer and organic manure applications. Glob. Ecol. Conserv. 2020, 22, e01011. [Google Scholar] [CrossRef]
  30. Korea Ministry of Environment. River Information Management Geographic Information System (RIMGIS). Available online: https://river.go.kr (accessed on 8 May 2025).
  31. National Institute of Environmental Research (NIER), Korea. 2019 National Water Quality Evaluation; NIER: Incheon, Republic of Korea, 2020. (In Korean) [Google Scholar]
  32. Geum River Basin Environmental Office (GRBEO), Korea. 2021 Miho Stream Mid-Watershed Water Environment Management Plan Implementation Assessment; GRBEO: Hwaseong, Republic of Korea, 2022. (In Korean) [Google Scholar]
  33. National Institute of Environmental Research (NIER), Korea. Natl. Pollut. Source Investigation; NIER: Incheon, Republic of Korea. 2020. Available online: https://wems.nier.go.kr (accessed on 8 May 2025).
  34. Geum River Basin Management Committee (GRBEMC), Korea. Study on the Dissemination Effects of Agricultural Drainage Management Facility for Geum River Watershed (2nd Year); GRBEMC: Jeonju, Republic of Korea, 2023. (In Korean) [Google Scholar]
  35. Daejeon Sejong Research Institute (DSRI), Korea. Policy Analysis and Response Strategies for Improving the Water Quality of Miho Stream; DSRI: Seoul, Republic of Korea, 2021. (In Korean) [Google Scholar]
  36. Zhuang, Y.; Zhang, L.; Li, S.S.; Liu, H.; Zhai, L.; Zhou, F.; Ye, Y.; Ruan, S.; Wen, W. Effects and potential of water-saving irrigation for rice production in China. Agric. Water Manag. 2019, 217, 374–382. [Google Scholar] [CrossRef]
  37. National Institute of Environmental Research (NIER), Korea. Official Test Standards of Water Pollution; NIER: Incheon, Republic of Korea, 2021. (In Korean) [Google Scholar]
  38. Eum, J.-S. Runoff Characteristics of Non-Point Source Pollution from Agricultural Watershed and Water Quality Simulations with Crop Change. Ph.D. Thesis, Kangwon National University, Gangwon, Republic of Korea, 2015. [Google Scholar]
  39. Perera, T.; McGree, J.; Egodawatta, P.; Jinadasa, K.B.S.N.; Goonetilleke, A. Catchment based estimation of pollutant event mean concentration (EMC) and implications for first flush assessment. J. Environ. Manag. 2021, 279, 111737. [Google Scholar] [CrossRef]
  40. Korea Meorological Administration. Available online: https://www.weather.go.kr (accessed on 8 May 2025).
  41. Wang, L.; Huang, D. Nitrogen and phosphorus losses by surface runoff and soil microbial communities in a paddy field with different irrigation and fertilization managements. PLoS ONE 2021, 16, e0254227. [Google Scholar] [CrossRef]
  42. Liu, J.; Ouyang, X.Q.; Shen, J.L.; Li, Y.; Sun, W.R.; Jiang, W.Q. Nitrogen and phosphorus runoff losses were influenced by chemical fertilization but not by pesticide application in a double rice-cropping system in the subtropical hilly region of China. Sci. Total Environ. 2020, 715, 136852. [Google Scholar] [CrossRef]
  43. Liu, M.; Wu, Y.; Huang, S.; Yang, Y.; Li, Y.; Wang, L.; Xi, Y.; Zhang, J.; Chen, Q. Effects of Organic Fertilization Rates on Surface Water Nitrogen and Phosphorus Concentrations in Paddy Fields. Agriculture 2022, 12, 1466. [Google Scholar] [CrossRef]
  44. Choi, J.-K.; Son, J.-G.; Yoon, K.-S.; Lee, H.-J.; Kim, Y.-J. Runoff Characteristics in Paddy Field using Cow Manure Compost Fertilizer (in Korean). J. Korean Soc. Agric. Eng. 2012, 54, 29–36. [Google Scholar]
  45. Kwun, S.K.; Yoo, M.H. Establish Prevention of Eutrophication and Environmental Pollution of Reservoirs(Ⅱ); Korean Rural Community and Agricultural Corporation: Anyang, Republic of Korea, 1989. (In Korean) [Google Scholar]
  46. Yoon, K.S.; Han, K.H.; Cho, J.Y.; Choi, C.H.; Son, J.G.; Choi, J.K. Water and Nutrient Balance of Paddy Field Irrigated from a Pumping Station during Cropping Period (in Korean). J. Korean Soc. Rural Plan. 2002, 8, 3–14. [Google Scholar]
  47. Kim, K.; Kang, M.S.; Song, I.; Song, J.-H.; Park, J.; Jun, S.M.; Jang, J.R.; Kim, J.S. Effects of Controlled Drainage and Slow-release Fertilizer on Nutrient Pollutant Loads from Paddy Fields (in Korean). J. Korean Soc. Agric. Eng. 2016, 58, 1–10. [Google Scholar]
  48. Roudbar, M.V.; Dehnavi, A.; Jamshidi, S.; Yazdani, M. A multi-pollutant pilot study to evaluate the grey water footprint of irrigated paddy rice. Agric. Water Manag. 2023, 282, 108291. [Google Scholar] [CrossRef]
  49. Zhang, S.; Rasool, G.; Guo, X.; Sen, L.; Cao, K. Effects of Different Irrigation Methods on Environmental Factors, Rice Production, and Water Use Efficiency. Water 2020, 12, 2239. [Google Scholar] [CrossRef]
  50. Takeda, I.; Fukushima, A. Long-term changes in pollutant load outflows and purification function in a paddy field watershed. Water Res. 2006, 40, 569–578. [Google Scholar] [CrossRef]
  51. Hwang, H.S.; Kong, S.D.; Shin, D.S.; Jeon, J.H. Characteristics of Nutrient Export from Paddy Rice Fields with Irrigation Practices (in Korean). J. Korean Soc. Water Qual. 2004, 20, 597–602. [Google Scholar]
  52. Geum River Basin Management Committee (GRBMC), Korea. Control of Agricultural Non-point Source Pollution Discharge from Paddy Fields by Water Tails of the Geum River Watershed; GRBMC: Daejeon, Republic of Korea, 2020. [Google Scholar]
  53. Zhang, Y.; Fang, W.; Xu, G.; Ren, Y.; Xu, X. Experimental study on the release rate of nitrogen and phosphorus from sediments under wave action. J. Ocean. Univ. China 2016, 50, 102–110. [Google Scholar]
  54. Gu, J.; Yang, J. Nitrogen (N) transformation in paddy rice field: Its effect on N uptake and relation to improved N management. Crop Environ. 2022, 1, 7–14. [Google Scholar] [CrossRef]
  55. Liu, J.; Jiang, T.; Kothawala, D.N.; Wang, Q.; Zhao, Z.; Wang, D.; Zhijian, M.; Zhang, J. Rice-paddy field acts as a buffer system to decrease the terrestrial characteristics of dissolved organic matter exported from a typical small agricultural watershed in the Three Gorges Reservoir Area, China. Environ. Sci. Pollut. Res. 2019, 26, 23873–23885. [Google Scholar] [CrossRef] [PubMed]
  56. Rural Research Institute (RRI), Korea; Korea Rural Community Corporation (KRCC), Korea. The Environmental-Friendly Agricultural Infrastructure Improvement Plan to Reduce the Influence Agricultural Drainage on Water Pollution (Final): Focus on the Paddy Fields; Korea Rural Community Corporation, KRCC: Ansan, Republic of Korea, 2003. (In Korean) [Google Scholar]
  57. Wu, D.; Li, M.; Du, L.; Ren, D.; Wang, J. Straw return in paddy field alters photodegradation of organic contaminants by changing the quantity rather than the quality of water-soluble soil organic matter. Sci. Total Environ. 2022, 821, 153371. [Google Scholar] [CrossRef]
  58. Nguyen, H.V.-M.; Hur, J. Tracing the sources of refractory dissolved organic matter in a large artificial lake using multiple analytical tools. Chemosphere 2011, 85, 782–789. [Google Scholar] [CrossRef]
  59. Choi, S.G.; Kim, M.G.; So, G.H.; Jang, T.I. Application of APEX-PADDY model considering paddy environment. Mag. Korean Soc. Agric. Eng. 2016, 58, 23–27. [Google Scholar]
  60. Hou, X.K.; Zhou, F.; Leip, A.; Fu, B.J.; Yang, H.; Chen, Y.; Gao, S.S.; Shang, Z.Y.; Ma, L. Spatial patterns of nitrogen runoff from Chinese paddy fields. Agric. Ecosyst. Environ. 2016, 231, 246–254. [Google Scholar] [CrossRef]
  61. Zhou, W.; Guo, Z.; Chen, J.; Jiang, J.; Hui, D.; Wang, X.; Sheng, J.; Chen, L.; Luo, Y.; Zheng, J.; et al. Direct seeding for rice production increased soil erosion and phosphorus runoff losses in subtropical China. Sci. Total. Envrion. 2019, 695, 133845. [Google Scholar] [CrossRef]
  62. Xiang, W.; Chen, J.; Li, Z.; Liu, M.; Gan, W.; Jiang, Y. Evaluation of nitrogen and phosphorus pollution in surface sediments of Baitan Lake and its influencing factors of release intensity. Resour. Environ. Eng. 2002, 36, 782–786+794. [Google Scholar]
  63. Xie, C.; Zhang, L.; Wang, M.; Jiang, Q. Scenario analysis on the management practices and optimization of rural non-point source pollution with the coupling of source-process-end: A case study of the Guishui river basin. Ecol. Indic. 2024, 159, 111677. [Google Scholar] [CrossRef]
  64. Zhu, Y.; Gao, P.; Zhao, Y.; Wang, F.; Huang, X.; Li, H. Contribution of ammonia nitrogen release from surface sediments of a reservoir in East China. J. Shanghai Univ. 2022, 28, 49–56. [Google Scholar]
  65. Wang, X.; Li, J.; Li, S.; Zhang, X. A study on removing nitrogen from paddy field rainfall runoff by an ecological ditch-zeolite barrier system. Enviton. Sci. Pollut. Res. 2017, 24, 27090–27103. [Google Scholar] [CrossRef]
  66. Obermann, M.; Rosenwinkel, K.H.; Tournoud, M.G. Investigation of first flushes in a medium-sized Med-iterraneancatchment. J. Hydrol. 2009, 373, 405–415. [Google Scholar] [CrossRef]
  67. Jafar, R.; Awad, A.; Hatem, I.; Jafar, K.; Awad, E.; Shahrour, I. Multiple Linear Regression and Machine Learning for Predicting the Drinking Water Quality Index in Al-Seine Lake. Smart Cities 2023, 6, 2807–2827. [Google Scholar] [CrossRef]
  68. Yang, X.; Lu, Y.; Tong, Y.; Yin, X. A 5-year lysimeter monitoring of nitrate leaching from wheat–maize rotation system: Comparison between optimum N fertilization and conventional farmer N fertilization. Agric. Ecosyst. Environ. 2015, 199, 34–42. [Google Scholar] [CrossRef]
  69. Korea Meteorological Administration (KMA). Annual Weather Report (in Korean); KMA: Daejeon, Republic of Korea, 2023. [Google Scholar]
  70. Li, Q.; Ouyang, W.; Zhu, J.; Lin, C.; He, M. Discharge dynamics of agricultural diffuse pollution under different rainfall patterns in the middle Yangtze river. J. Environ. Manag. 2023, 347, 119116. [Google Scholar] [CrossRef] [PubMed]
  71. Yang, S.; Xu, J.; Zhang, J.; Wang, Y.; Peng, S. Reduction of non-point pollution from paddy fields. Irrig. and Drain 2016, 65, 734–740. [Google Scholar] [CrossRef]
  72. Yin, W.; Yang, X.; Liu, W. Sustainable Management and Regulation of Agricultural Water Resources in the Context of Global Climate Change. Sustainability 2025, 17, 2760. [Google Scholar] [CrossRef]
  73. Abe, Y.; Maie, N.; Shima, E. Influence of Irrigated Paddy Fields on the Fluorescence Properties of Fluvial Dissolved Organic Matter. Surf. Water Qual. 2011, 40, 1266–1272. [Google Scholar] [CrossRef]
  74. Jin, B.; Liu, X.; Tan, J.; Shao, X.; Cheng, J. Effect of Plant Buffer Zone–Antifouling Curtain Wall on Reducing Non-Point Source Pollution in Paddy Fields, China. Sustainability 2022, 14, 6044. [Google Scholar] [CrossRef]
  75. Han, H.; Wang, X.; Zheng, H.; Liu, B.; Gao, R.; Cui, Y.; Liu, X.; Gu, S.; Zhang, B.; Yang, M. Using the paddy eco-ditch wetland system to reduce nitrogen non-point source pollution discharge from paddies: A consecutive six-year study in the Yunnan Plateau, China. Agric. Ecosyst. Environ. 2024, 365, 108911. [Google Scholar] [CrossRef]
  76. Yang, J.R.; Tang, S.; Li, Y.; Zhu, J.; Liu, Z. Assessing the nutrient removal performance from rice-crayfish paddy fields by an ecological ditch-wetland system. Heliyon 2024, 10, e38373. [Google Scholar] [CrossRef]
Figure 1. Location and a schematic map of the experimental site (Miho River basin).
Water 17 01650 g001
Figure 2. Monitoring fields at (a) Cheongju, (b) Sejong, (c) Cheonan, and (d) Jincheon.
Water 17 01650 g002
Figure 3. (a) Controlled drainage units in Cheongju (OSW-T1 and OSW-T2) and (b) traditional drainage units in Cheongju (OSW-C1 and OSW-C2).
Water 17 01650 g003
Figure 4. Changes in the discharged load of each agricultural drainage period in Cheongju: (a) BOD, (b) SS, (c) TOC, (d) T-N, and (e) T-P.
Water 17 01650 g004
Figure 5. Statistical summary of the discharged pollutant loads by HD from the sites in Cheongju, Sejong, Cheonan, and Jincheon for different discharge units: (a) BOD, (b) SS, (c) TOC, (d) T-N, and (e) T-P.
Water 17 01650 g005
Figure 6. Statistical summary of the discharged pollutant loads by HD from all the sites in Cheongju, Sejong, Cheonan, and Jincheon for different discharge units: (a) BOD, (b) SS, (c) TOC, (d) T-N, and (e) T-P.
Water 17 01650 g006
Figure 7. Pollutant loads in stormwater runoffs: (a) BOD, (b) SS, (c) TOC, (d) T-N, and (e) T-P.
Water 17 01650 g007
Table 1. Discharged loads per unit area on paddy fields in Cheongju (kg/ha).
BODSST-NT-PTOC
HDControlAverage16.51777.214.544.7062.6
Standard deviation5.3283.63.202.4430.9
TestAverage11.2256.24.860.9920.6
Standard deviation6.5174.51.810.659.1
MDControlAverage8.045.63.420.2136.9
Standard deviation4.521.41.440.1021.3
TestAverage2.517.40.690.136.9
Standard deviation0.19.20.060.040.9
FDControlAverage0.414.80.260.050.9
Standard deviation0.315.20.180.040.5
TestAverage0.96.00.240.052.3
Standard deviation0.75.30.160.041.8
TotalControlAverage22.21817.516.994.8787.8
Standard deviation10.0261.81.502.2914.9
TestAverage14.6279.55.791.1729.9
Standard deviation6.1177.51.810.629.2
ReductionAverage31.083.565.469.164.9
(%)Standard deviation28.911.812.221.712.9
Note: Total: sum of the discharged loads during HD, MD, and FD.
Table 2. Pollutants discharge from rice paddy fields (kg/ha/yr).
LocationPeriodIrrigation ModeT-NT-PCOD (BOD)Reference
Shimane, Japan1991~2000Conventional13.6~75.0−3.55 *~2.21−24.7 *~48.5[50]
Guilan, Iran2020Conventional10.988.4054.5[48]
Nanjing, China2015Common flood irrigation19.77 **--[20]
Water saving irrigation20.57 **--
Zhoubeidun, China2018Traditional irrigation and drainage30.1--[24]
Controlled irrigation and drainage9.1--
Nanjing, China2016~2017Frequent and shallow irrigation5.56~6.220.06~0.26-[49]
Wet and shallow irrigation5.21~5.220.06~0.20-
Controlled irrigation3.94~4.990.04~0.15-
Rain-catching and controlled irrigation5.41~5.660.06~0.22-
Lianshui, China2016~2017Frequent and shallow irrigation16.3~18.90.84~1.47-[16]
Wet and shallow irrigation9.94~11.50.30~0.41-
Controlled irrigation12.5~13.70.53~0.63-
Rain-catching and controlled irrigation2.09~4.310.14~0.19-
Nanjing, China2015~2017Frequent and shallow irrigation5.2~13.3--[16]
Wet and shallow irrigation4.8~18.1--
Controlled irrigation3.0~18.0--
Rain-catching and controlled irrigation2.6~10.0--
Iksan, ROK2015Conventional15.51.38-[44]
Water management11.71.02-
Fertilization management8.50.69-
Pyeongtaek, ROK2014Before treatment10.150.4784.02[26]
After treatment9.690.3583.94
2013Before treatment23.681.8570.4
After treatment18.171.1647.2
2012Before treatment20.151.75118.5
After treatment9.71.3389.9
Jincheon, ROK2012–2013Traditional paddy field22.72.52-
Yeoju, ROK2012–2013Flat paddy field21.11.82-
Suwon, ROK2012–2013Chemical fertilizer1.630.28-
Pig manure compost9.523.16-
Suwon, ROK2012–2014Traditional paddy field50.63-[26]
Iksan, ROK2012–2014Traditional paddy field8.911.88-
Jeonju2011Cow manure compost15.70.4-[44]
Cheongwon ROK2001Surface water irrigation42.331.50 [51]
Yeoju, ROK2001Groundwater irrigation20.281.15
Namwon, ROK1999–2000Traditional paddy field54.7~57.82.0~2.3-[46]
Jincheon, ROK2020Conventional irrigation38.46 1.831 (25.27)[52] ***
Improved irrigation23.67 0.140 (24.49)
Cheongju, ROK2022Conventional drainage16.99 4.870(22.15)This study
Improved drainage5.79 1.173 (14.55)
Notes: Note 1. Subsurface discharges are not considered. Note 2. * Negative values indicate that the load was decreased by purification in the watershed. ** The total discharged T-N loads in the rice growth periods of turning green, tillering, jointing and booting, heading and flowing, milking stage, and yellow ripening. The highest discharged loads were in tillering, which were 9.45 and 8.45 kg/ha/yr, while the lowest loads were in yellow ripening, which were 0.34 and 0.24 kg/ha/yr, for common flood irrigation and water-saving irrigation, respectively. *** Pollutant loads during rainfall were excluded.
Table 3. Pearson correlation coefficients between the site conditions and discharged loads in HD (kg/ha).
Control (n = 11)Test (n = 11)
BODSST-NT-PTOCBODSST-NT-PTOC
Water depth (cm)0.950.41 *0.44−0.07 *0.47 *0.780.61 **0.34 *−0.05 *0.64 **
Area (m2)0.00 *−0.25 *−0.08 *−0.31 *−0.08 *0.34 *0.53 *0.63 **0.06 *0.10 *
Total discharge volume (m3)0.46 *−0.01 *0.24 *−0.32 *0.25 *0.75 **0.800.58 *−0.03 *0.54 *
Initial flow velocity (m/s)0.58 *0.09 *0.26 *−0.46 *0.31 *0.49 *0.50 *0.78−0.34 *0.34 *
Initial flowrate (m3/s)0.47 *0.08 *0.26 *−0.39 *0.23 *0.58 *0.78 **0.84 **−0.27 *0.48 *
Area normalized total discharge volume (m3/m2)0.95 **0.42 *0.44 *−0.07 *0.47 *0.77 **0.61 **0.34 *−0.05 *0.64 **
Area normalized initial flow velocity (m/m2·s)0.77 **0.34 *0.26 *−0.36 *0.38 *0.49 *0.35 *0.60 **−0.40 *0.43 *
Area normalized initial flowrate (m3/m2·s)0.84 **0.46 *0.38−0.35 *0.40 *0.62 **0.66 **0.72 **−0.36 *0.58 *
IrrigationBOD0.56 *0.42 *0.240.31 *0.23 *0.38 *0.33 *0.370.29 *0.32 *
waterSS−0.47−0.18 *−0.260.34 *−0.39 *−0.50−0.45 *−0.55 *0.20 *−0.48
qualityT-N−0.44 *0.02 *0.05 *0.51−0.12 *−0.31 *−0.36 *−0.41 *0.37 *−0.72 **
(mg/L)T-P0.43 *0.24 *0.35 *−0.400.44 *0.67 **0.50 *0.66 **−0.300.03 *
TOC−0.42 *−0.53 *−0.67 **−0.24 *−0.65 **−0.64 **−0.40 *−0.51−0.25 *0.25 *
SoilT-N (%)−0.35 *0.28 *0.30 *0.96 **0.30 *0.40 *0.40 *−0.45 *0.94−0.04 *
propertyT-P (mg/L)−0.48 *−0.20 *−0.02 *0.53 *0.28 *−0.39 *−0.48 *−0.87 **−0.31 *0.19 *
Sand (%)−0.15 *0.29 *0.15 *0.62 **0.000.12 *0.01 *0.13 *0.72 **−0.61 **
Silt (%)0.16 *−0.10 *−0.10 *−0.55 *0.14 *−0.29 *−0.17 *−0.07 *−0.83 **0.57
Clay (%)0.10−0.47 *−0.15−0.58−0.07 *0.080.17 *−0.18 *−0.55 *0.61 **
FertilizerN0.18 *−0.32 *−0.47 *−0.68 **−0.36 *−0.04 *0.11 *0.14 *−0.59 *0.56 *
(kg/ha)P0.34 *0.08 *0.11 *−0.61 **0.160.42 *0.37 *0.54 *−0.57 *0.08 *
Control (n = 4)Test (n = 7)
PaddyBOD0.44−0.97 *0.97−0.76−0.01 *0.560.56 *0.390.25 *0.63
waterSS−0.50 *0.99 *−0.90 **0.87 **0.21 *0.28 *0.700.14 *0.35 *0.33 *
qualityT-N0.48−0.96 *0.96−0.77 *−0.03 *−0.10−0.44 *0.63−0.53 *−0.06
(mg/L)T-P−0.14 *0.93 *−0.96 **0.65 *−0.11 *−0.06 *0.70 **−0.45 *0.79−0.13 *
TOC0.27 *−0.94 *0.98−0.68 **0.100.530.40 *0.180.05 *0.63
Notes: 1. Pearson correlation coefficients of ≥0.8, 0.8~0.6, 0.6~0.4, 0.4~0.2, and <0.2 indicate very strong, strong, moderate, weak, and very weak correlations, respectively. 2. The symbol “*” indicates statistical significance at the p < 0.05. 3. The symbol “**” indicates strong to very strong correlations at the p < 0.01.
Table 4. Coefficients of multi linear regression.
Load
(kg/ha)
Coefficient of
Determination
β0β1β2β3β4β5β6
Paddy Water Quality (mg/L)
(r2) SST-NT-PSS + T-NSS + T-NT-N + TP
NoBOD0.154821.74210.0721−0.3031−19.1016---
InteractionSS0.17301171.0027−0.8011−16.448856.5278---
T-N0.54999.16160.03380.5457−11.1674---
T-P0.17483.1077−0.0024−0.04620.3920---
TOC0.182268.09440.1292−0.7477−46.9947---
WithBOD0.2964−4.91290.26320.7957−10.4489−0.0068−0.08520.0797
interactionsSS0.6525−604.74227.686022.17293756.8943−0.1497−9.7702 *−89.5768
T-N0.7513−11.61510.29622.2992−2.0688−0.0089−0.0692−3.3491
T-P0.6009−2.20690.03410.157710.7382−0.0009−0.0283−0.5362
TOC0.5179−23.44340.85353.550624.1300−0.0234−0.3466−4.5407
Notes: 1. β0 is the intercept, β1, β2, β3, β4, β5, and β6 are the coefficients of strength and direction of relationships associated with the independent variables of SS, T-N, and T-P, as well as the interactions of SS + T-N, SS + T-N, and T-N + TP, respectively. 2. * significant at p < 0.1.
Disclaimer/Publisher’s Note: The statements, opinions and data contained in all publications are solely those of the individual author(s) and contributor(s) and not of MDPI and/or the editor(s). MDPI and/or the editor(s) disclaim responsibility for any injury to people or property resulting from any ideas, methods, instructions or products referred to in the content.

