Article

Analyses of Morphological Differences between Geographically Distinct Populations of Gymnodiptychus dybowskii

1
College of Animal Science and Technology, Tarim University, Alar 843300, China
2
College of Life Science and Technology, Tarim Research Center of Rare Fishes, Tarim University, Alar 843300, China
3
College of Fisheries, Huazhong Agricultural University, Wuhan 430070, China
*
Author to whom correspondence should be addressed.
These authors contributed equally to this work.
Water 2024, 16(5), 755; https://doi.org/10.3390/w16050755
Submission received: 7 January 2024 / Revised: 22 February 2024 / Accepted: 27 February 2024 / Published: 1 March 2024
(This article belongs to the Special Issue Aquatic Ecosystems: Biodiversity and Conservation)

Abstract

:
To study the morphological differences between and the evolutionary mechanisms driving the differentiation of geographically distinct populations of Gymnodiptychus dybowskii, 158 fish were collected from the Turks River and the Manas River in Xinjiang from 2020 to 2021 with the approval of the Academic Ethics Committee. The morphological characteristics of the fish were assessed using classical fish ecology methods such as traditional morphometric measurements and the framework approach. The results showed that the morphological characteristics of the populations in the Turks River and Manas River were significantly different; a one-way ANOVA revealed 22 highly significant differences (p < 0.01) and 1 significant difference (p < 0.05) among the 33 morphological traits of the observed populations, and a principal component analysis revealed that there was no overlap between the two populations of G. dybowskii. The main characteristics associated with principle component 1 were the terminus of the dorsal fin to the ventral origin of the caudal fin (D—F), the dorsal origin of the caudal fin to the origin of the anal fin (E—H), and the insertion of the pectoral fin to the terminus of the pectoral fin (J—K); the main factors associated with principal component 2 were the body height (BD), the terminus of the dorsal fin to the insertion of the pelvic fin (D—I), the caudal peduncle height (CPH), and the tip of the snout to the last end of the frontal maxilla (A—B); and the main traits associated with principle component 3 were the terminus of the anal fin to the origin of the anal fin (G—H), the body width (BW), the insertion of the pelvic fin to the terminus of the pelvic (I—L), the insertion of the pectoral fin to the terminus of the pectoral fin (J—K), and the insertion of the pelvic fin to the insertion of the pectoral fin (I—J). An OPLS-DA revealed that the two populations could be wholly separated and that the intergroup growth traits of the Manas River population were different and significantly greater than those of the Turks River population. The discriminant functions of the Turks River and Manas River populations of G. dybowskii were as follows: YT = −432.033 + 1787.748X1 + 826.517X2 + 249.002X3 + 1183.050X4 + 554.934X5 + 999.296X6 + 627.428X7; YM = −569.819 + 2041.044X1 + 344.942X2 + 333.737X3 + 940.512X4 + 348.222X5 + 1167.770X6 + 1015.904X7. According to a coefficient of variation analysis, a total of nine traits, namely, EI/BL, C-D/BL, E-F/BL, F-H/BL, H-I/BL, C-J/BL, D-I/BL, D-H/BL, and D-F/BL, had a CD > 1.28, indicating that the differences in these nine traits had reached the subspecies level. The results showed that G. dybowskii significantly differed between the two geographically distinct populations in the Turks River and the Manas River and have differentiated to the subspecies level. This study provides a basis for a better investigation of the population structure of highland endemic fishes and the mechanisms by which they diverged and lays a foundation for developing and utilizing germplasm resources from endemic fishes in Xinjiang.

1. Introduction

Gymnodiptychus dybowskii (Kessler, 1874) is a carp species belonging to Cypriniformes, Cyprinidae, Schizothoracinae, Gymnodiptychus (Herzenstein, 1892) [1]. Schizothoracine fishes originated from the primitive Barbinae subfamily of fishes on the Ti-betan Plateau [2]. After continuous differentiation, they evolved into a specialized group [3,4]; they have unique adaptations to special environments, such as high altitude, hypoxia, and low water temperature [5], and have important economic and scientific value [6]. In recent years, its ecological niche has been disturbed due to human activities [7,8,9] and the introduction of exotic species [1,10], which has triggered food competition and reproductive competition, leading to a very significant decline in its population. It has been listed as Class I key protected aquatic wildlife in the Xinjiang Uygur Autonomous Region since 2004 (Xinjiang Uygur Autonomous Region Key protected Wildlife List (Revised), Xinzhengfa (2022) No. 75). Now that G. dybowskii has become a rare and endangered indigenous fish in Xinjiang, the conservation of G. dybowskii is urgently needed, and studies related to its different geographic populations will provide crucial assistance for long-term biodiversity conservation.
G. dybowskii is mainly distributed in China in the waters of the Ili River basin and the Junggar Basin on the northern slopes of the Tianshan Mountains [1]. The Turks River is one of the largest tributaries of the Ili River. It originates from the northern slope of the central peak of the Tianshan Mountain, i.e., Khan Tengri Peak, and eventually flows into the Ili River; it has a length of approximately 408 km, an elevation of 800~4600 m, and an average annual runoff of 79.33 × 10⁸ m3, accounting for more than 60% of the annual runoff of the Ili River [10]. The Manas River originates from the northern Tianshan Mountains. The Manas River, which has a length of approximately 450 km, originates from the northern foothills of the Tianshan Mountains and eventually flows into Manas Lake in the north. It is an inland river with the most extensive glacier extent in the Junggar inland area, with an elevation of 256 m to 5242 m in the watershed and an average annual runoff of 11.90 × 10⁸ m3 [11]. The geographic differences between the Turks and Manas River basins are significant, and relevant studies have found that populations with significant geographic differences produce greater genetic variation [12]. Fish from different geographic populations can trigger changes in their morphology due to differences in factors such as water flow, predators, habitat modification, and food availability [13,14,15]. Studies to date have focused on comparing differences in fish morphology between reservoirs or lakes and rivers [16,17,18]. Fewer studies have analyzed morphological differences in fish populations in rivers from different catchments at high altitudes and G. dybowskii has been found to have a high degree of variability in its morphology across geographic populations in natural surveys. Therefore, it would be important to carry out studies related to morphological differences between the populations of the Turks River and the Manas River.
In this study, we collected samples of G. dybowskii from the Turks and Manas Rivers. We analyzed the morphological characteristics and quantitative traits of these fishes to identify the characteristics and adaptive evolutionary mechanisms of specialized G. dybowskii fishes in high-elevation areas as well as the effects of geographic isolation on the formation of these species. The aim is to provide a scientific basis for the evolution of highland fish fauna and the conservation of the germplasm.

2. Materials and Methods
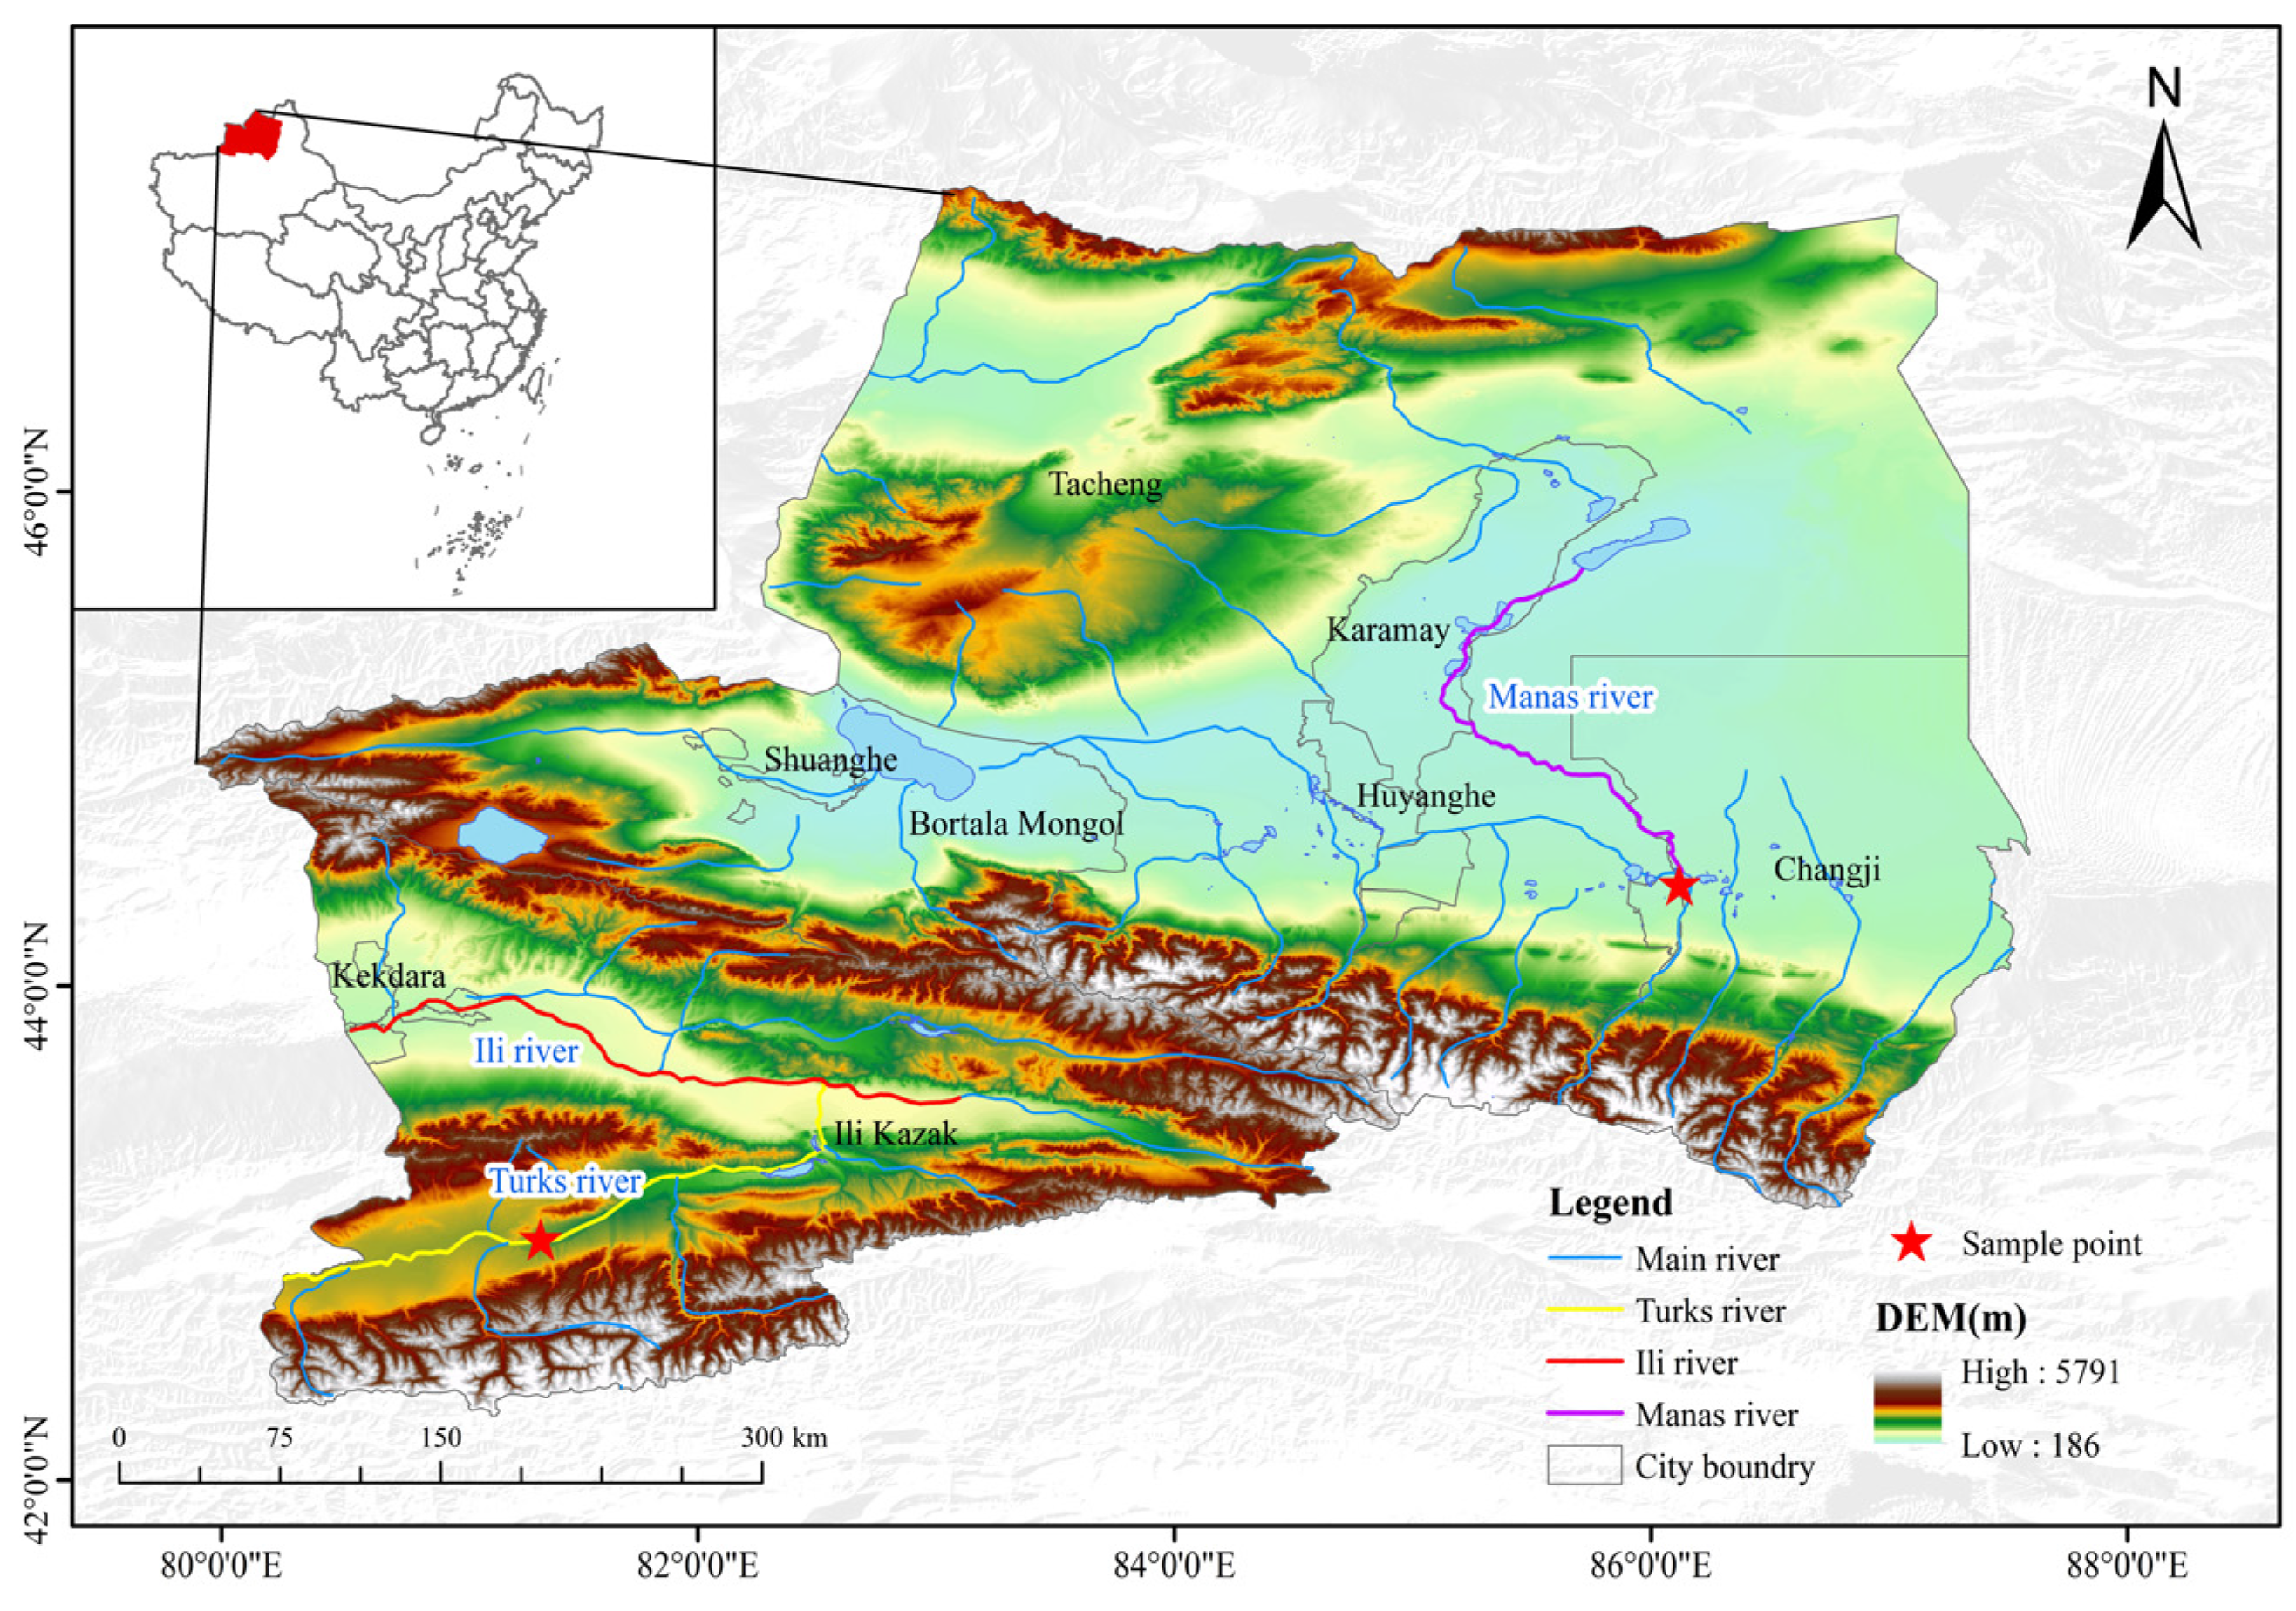
2.1. Materials

From 2020 to 2021, 123 G. dybowskii (body length: 50.08–121.99 mm, 82.29 ± 13.76 mm; weight: 1.86–24.29 g, 8.32 ± 4.16.04 g) were collected from the Turks River (T, E80°55′ N42°81′) using gillnets and ground cages (2a = 2.0 cm), and 35 G. dybowskii (body length: 52.36–273.60 mm, 195.36 ± 11.36 mm; body weight: 2.20–340.00 g, 125.82 ± 15.13 g) were collected from the Manas River (M, E86°13′ N44°30′), Sampling locations are shown in Figure 1. After biological determination on site, the sampled fish were fixed in formalin and returned to the laboratory for subsequent processing. Permission for sampling and collection was provided by an aquatic wildlife license of the People’s Republic of China (approval number: (new) Mizuno Catch Word [2019] No. 4). All experimental protocols were approved by the Ethics Committees of the Tarim University of Technology (approval code: TDDKYXF 20200426, approval date: 26 April 2020) and adhered to animal welfare laws, guidelines, and policies.

2.2. Methodology

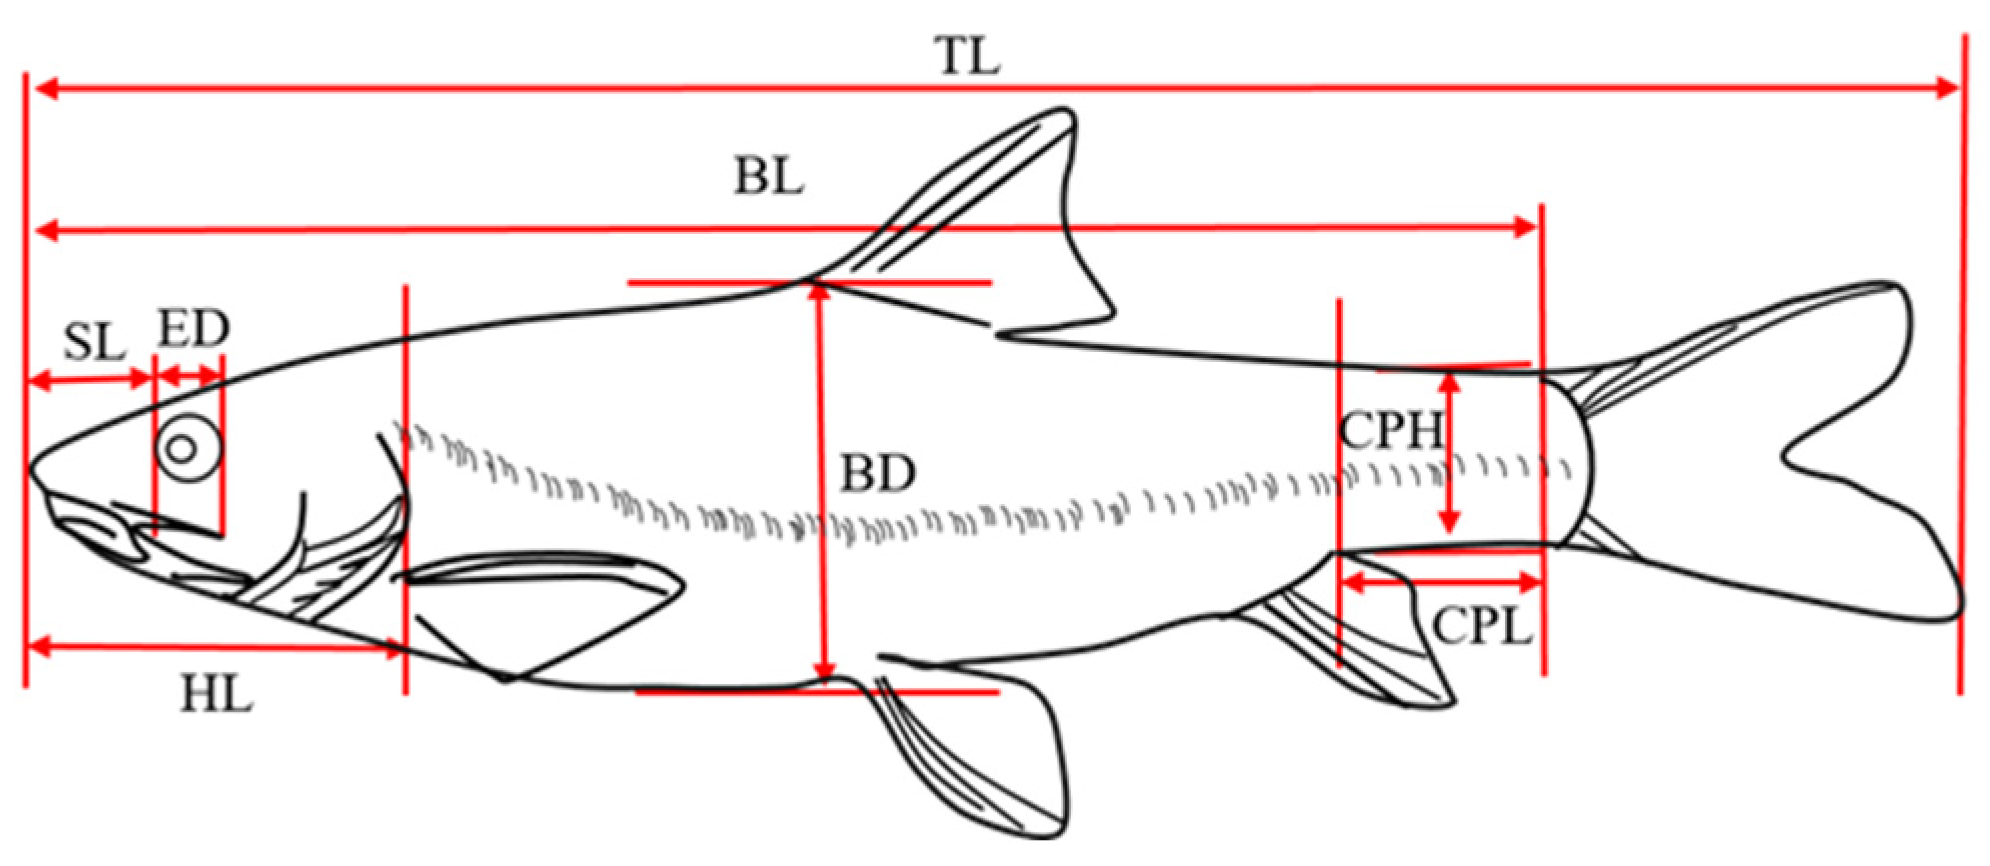
2.2.1. Morphological Indicators

Traditional morphological measurements and the frame method were used to measure the total length (TL), body length (BL), body height (BD), body width (BW), head length (HL), snout length (SL), and eye diameter (ED). Eye interval (EI), caudal peduncle length (CPL), and caudal peduncle height (CPH) were also measured [19,20] (Figure 2).
The frame measurements were determined by 12 anatomical coordinate points [21] (Figure 3), and the 24 frame distances were as follows: tip of snout to the last end of the frontal maxilla (A—B), tip of snout to origin of dorsal fin (A—C), tip of snout to insertion of pelvic fin (A—I), tip of snout to insertion of pectoral fin (A—J), the last end of the frontal maxilla to origin of dorsal fin (B—C), the last end of the frontal maxilla to insertion of pelvic fin (B—I), the last end of the frontal maxilla to insertion of pectoral fin (B—J), origin of dorsal fin to terminus of dorsal fin (C—D), origin of dorsal fin to ventral origin of caudal fin (C—F), origin of dorsal fin to origin of anal fin (C—H), origin of dorsal fin to insertion of pelvic fin (C—I), origin of dorsal fin to Insertion of pectoral fin (C—J), terminus of dorsal fin to dorsal origin of caudal fin (D—E), terminus of dorsal fin to ventral origin of caudal fin (D—F), terminus of dorsal fin to origin of anal fin (D—H), terminus of dorsal fin to insertion of pelvic fin (D—I), dorsal origin of caudal fin to ventral origin of caudal fin (E—F), dorsal origin of caudal fin to origin of anal fin (E—H), ventral origin of caudal fin to origin of anal fin (F—H), terminus of anal fin to origin of anal fin (G—H), origin of anal fin to insertion of pelvic fin(H—I), insertion of pelvic fin to insertion of pectoral fin (I—J), insertion of pelvic fin to terminus of pelvic (I—L) and insertion of pectoral fin to terminus of pectoral fin (J—K).
A digital Vernier caliper (CD67-S15PS) was used to measure the length (accuracy: 0.01 mm), and an electronic balance (LE403E) was used to measure the weight (accuracy: 0.01 g).

2.2.2. Morphological Analysis

Based on the experience of Xie Congxin [22] and Guo Yan [1] et al., the color of the fish body was compared and evaluated by visual observation and a color contrast card test, and the error of color observation was reduced.
One-way ANOVA (at the 0.05 significance level) was used to identify the significance of differences between geographically distinct populations. The least significant difference (LSD) method was used for variables that were significant according to the ANOVA after multiple comparisons, and Tamhane’s T2 method was used for variables that were not significant according to the ANOVA [23].
Principal component analysis (PCA) was used to extract the principle components from the covariance matrix. Contribution rates were calculated, and principal component scatter plots were constructed [24]. Orthogonal partial least squares discriminant analysis (OPLS-DA) was used to further distinguish differences among the data, thus improving the confidence level [25].
Discriminate analysis was used to assess all the proportional data [19]. The discrimination formula was established by identifying the parameters that played a significant role in determining the morphological differences among populations, and the discrimination accuracy and comprehensive discrimination rate were calculated as follows:
Discrimination accuracy (%) = (Ai/Bi) × 100%
Combined   discrimination   rate   ( % ) = i = 1 k A i / i = 1 k B i
where k is the number of populations, Ai is the number of correctly discriminated individuals in the ith population, and Bi is the number of measured individuals in the ith population.
The extent of the morphological variation among the geographically isolated populations was analyzed by the coefficient of difference (CD) [26], which determines whether the differences among populations are due to geographic isolation within a species and is given by the following formula:
CD = (M1 − M2)/(SD1 + SD2)
where M1 and M2 are the standardized means of a parameter for populations 1 and 2, respectively, and SD1 and SD2 are the standard deviations of a parameter for populations 1 and 2, respectively.

2.3. Data Processing

The 34 sets of morphological data were standardized by dividing by body length to eliminate the effect of individual size differences on the morphological parameters, resulting in 33 sets of measured ratio data.
The data were statistically analyzed using SPSS 17.0 and ORIGIN 9.0 and are expressed as the mean ± standard deviation (M ± SD).

3. Results

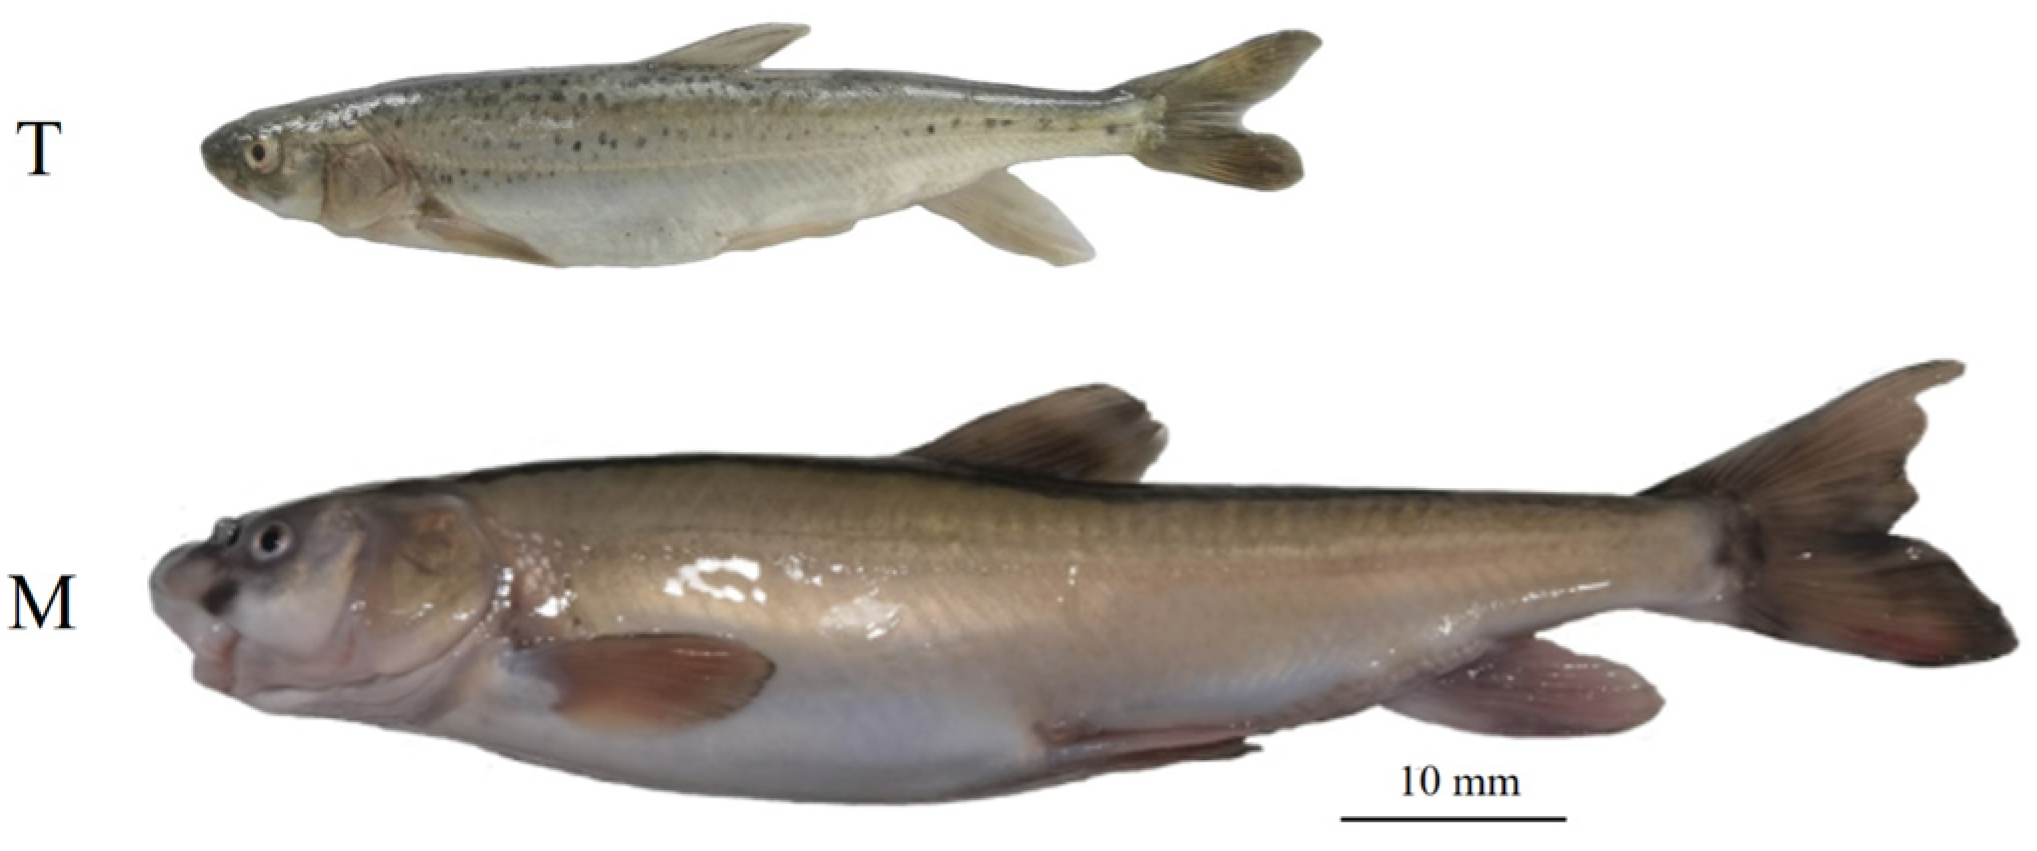
3.1. Characteristics of G. dybowskii

G. dybowskii fish body: prolonged, slightly laterally compressed. The posterior surface of the head is slightly elevated, the head is conical, the muzzle is obtuse and protruding, the mouth is inferior and horseshoe-shaped, the upper and lower lips are very well developed. The postlabial groove is interrupted, 1 pair of jaw whiskers, gill rakers are short and sparse, and the gill covert membrane is connected to the isthmus. Most of the body is lacking scales, appearing only on the shoulders, buttock, and laterally; the upper part of the ventral fins have axillary scales.
Turks River population (Figure 4 (T)): a grayish-white abdomen from the waist up to the lateral line, and from the lateral line to the dorsum, the color fades from light brown to dark brown; the dorsal spine is partly dark brown to partially black, with black spots varying from small to large between the lateral line to the dorsum.
Manas River population (Figure 4 (M)): a creamy white abdomen from the waist upward to the back, and the color gradually deepens to grayish white; the grayish white of the back fades darker; the lateral line is light brown, and the dorsal spine is dark gray, accompanied by fine black spots.

3.2. One-Way ANOVA

There were highly significant differences (p < 0.01) in 22 proportional traits, such as BW/BL, HL/BL, SL/BL, ED/BL, and EI/BL, and significant differences (p < 0.05) in E—F/BL between the two populations, with differences mainly occurring in the posterior part of the carapace (Table 1). The proportional traits that are not significantly different are shown in Appendix A Table A1.

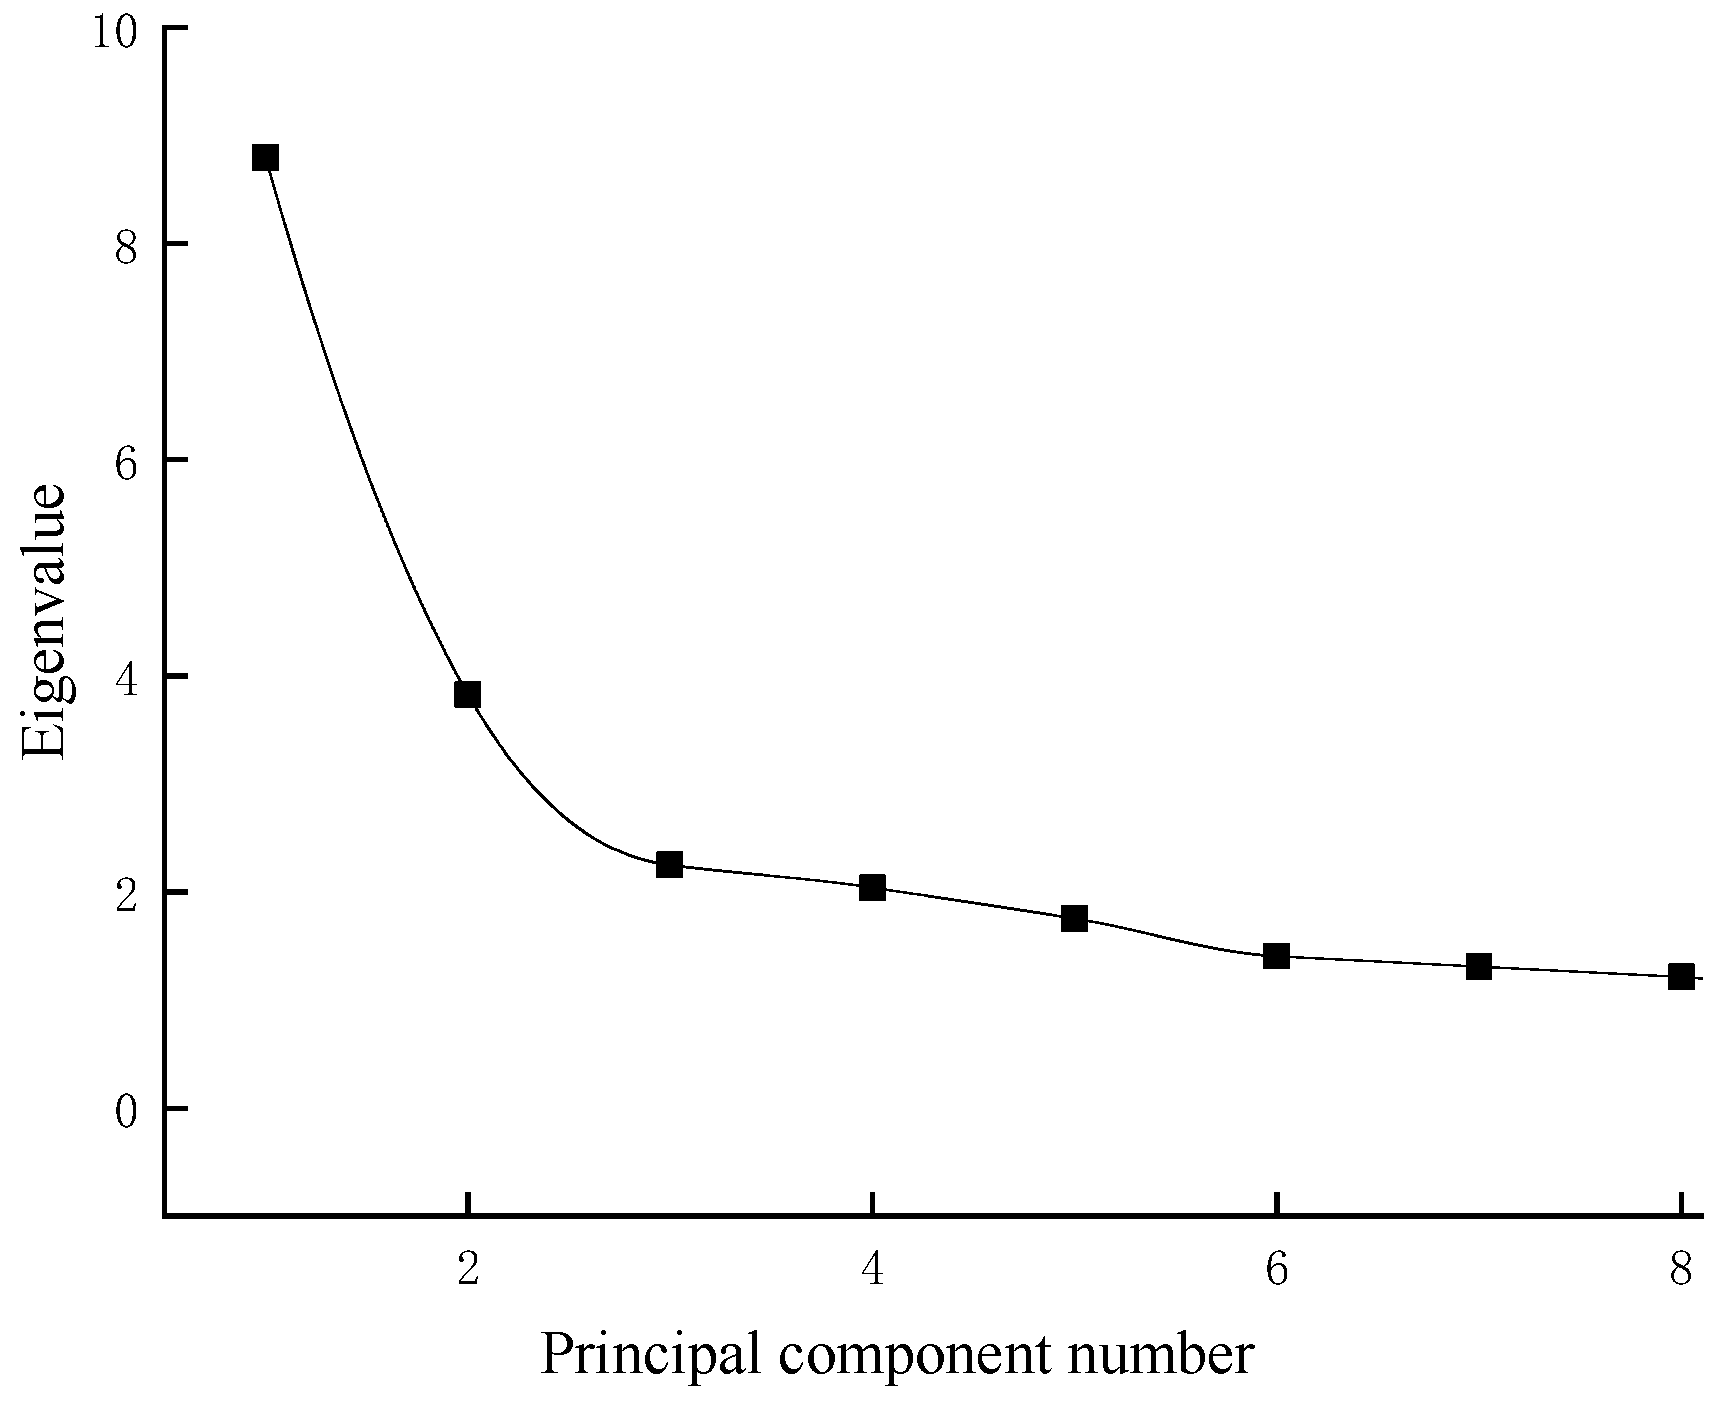
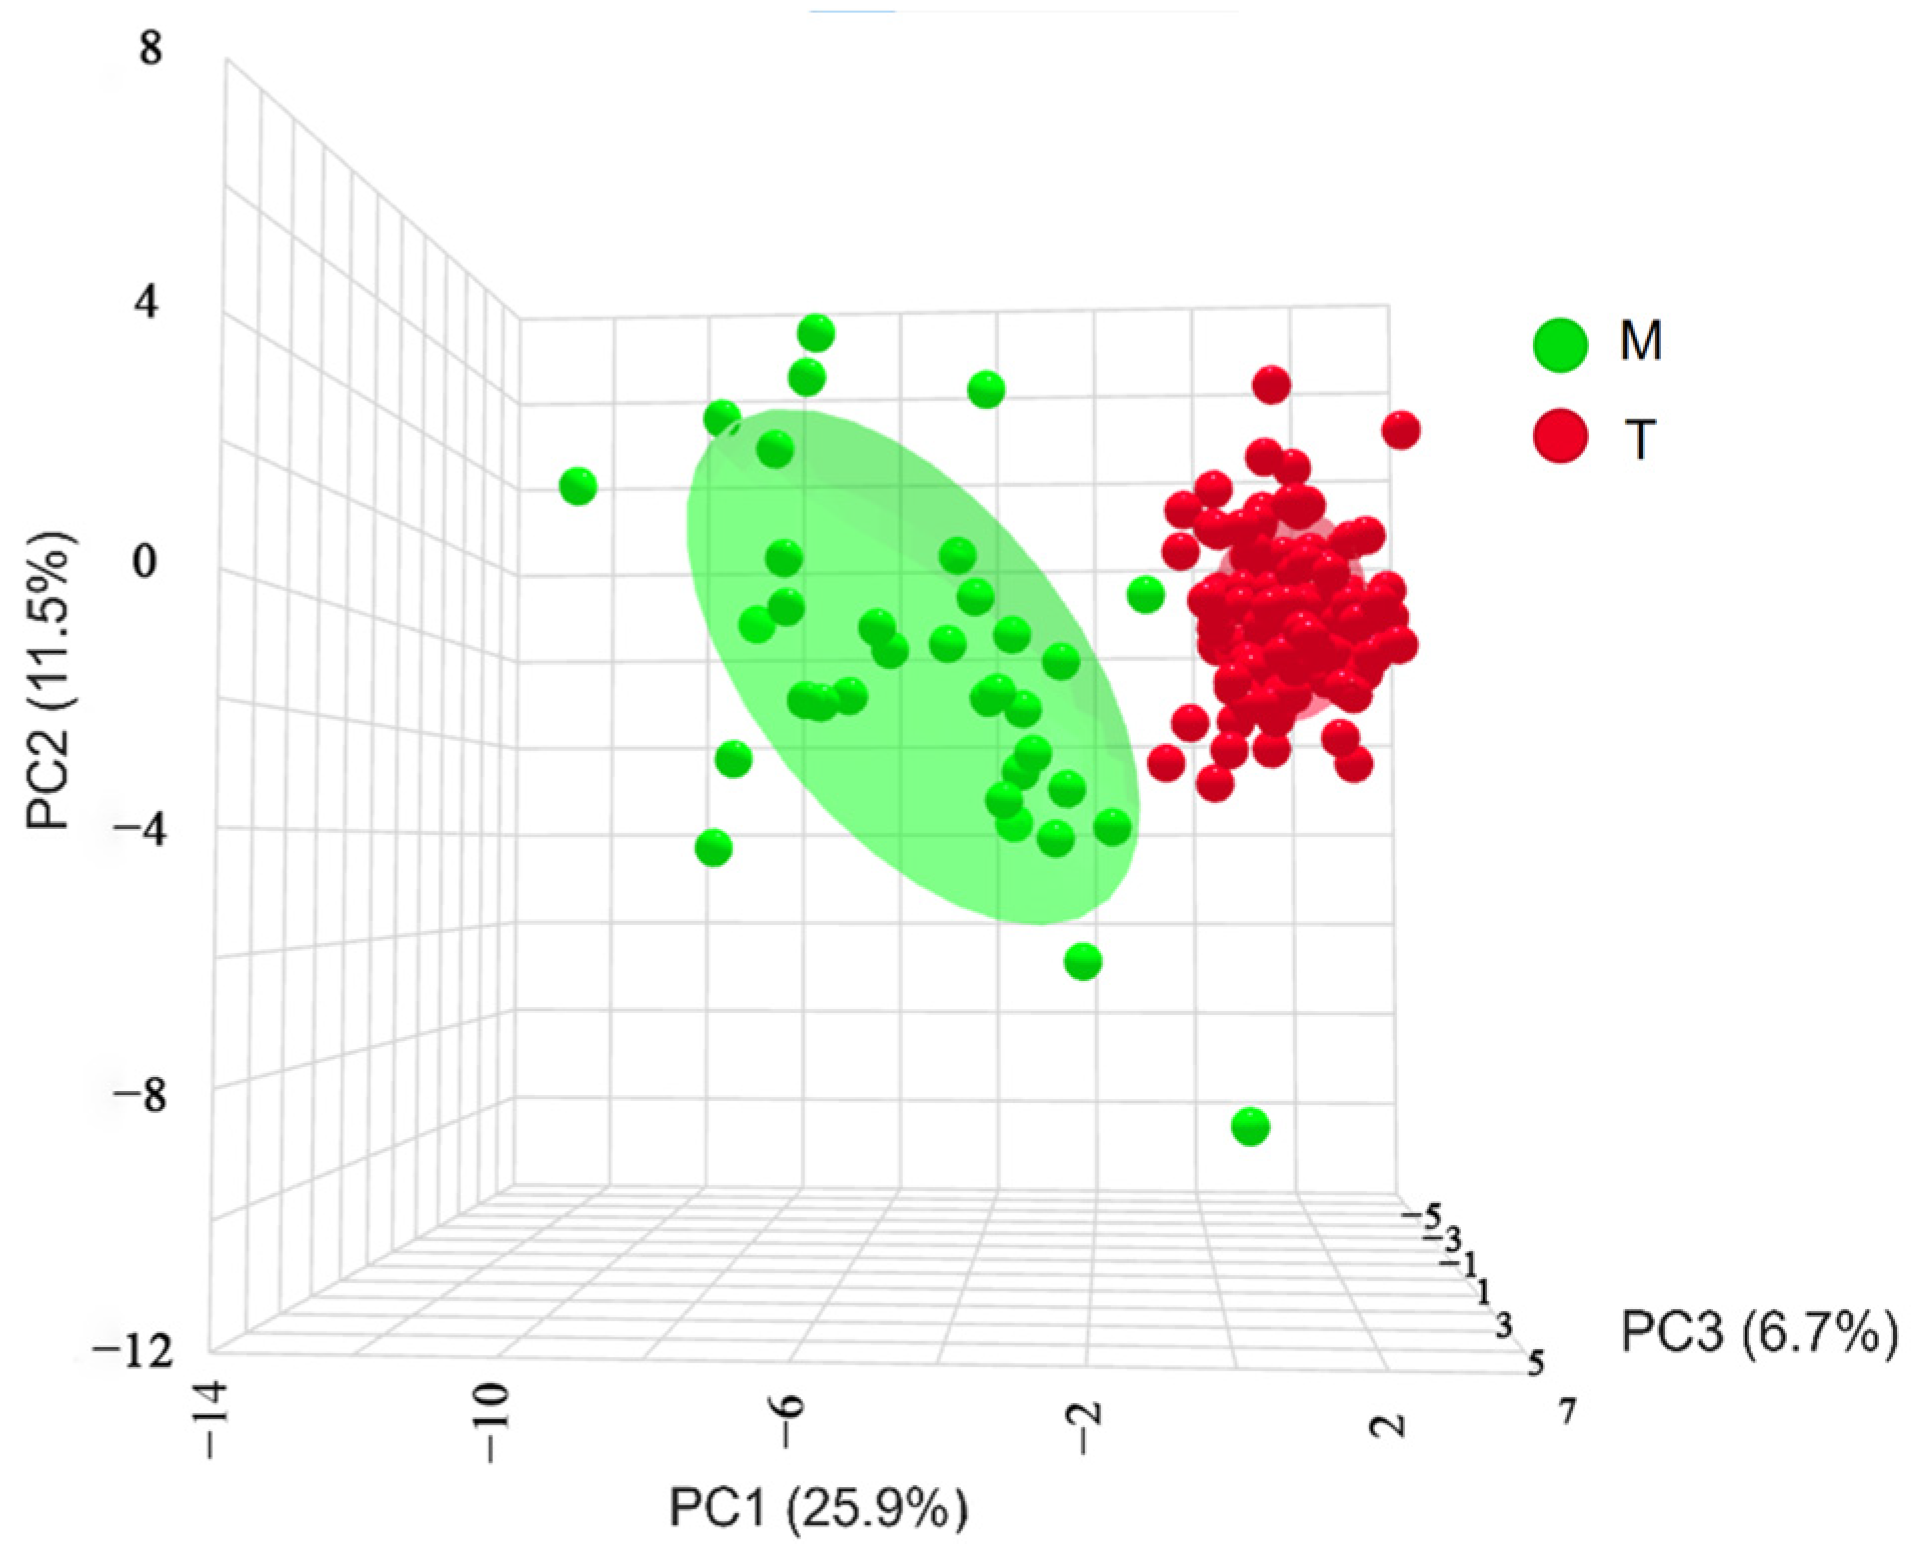
3.3. Principal Component Analysis

The KMO test (KMO = 0.767) and Bartlett’s test of sphericity (p < 0.01) were performed. The KMO test value was 0.767 (>0.600), and the correlation between the variables was strong, which indicated that the morphological differences between the geographically distinct groups of G. dybowskii were suitable for the principal component analysis. As shown in Figure 5, after the third principal component, the eigenvalues of the principle components tended to stabilize. Therefore, the first three principal components were selected for analysis (PC1~PC3).
The contribution rates of these components were 25.9%, 11.50% and 6.70%, respectively, with a cumulative contribution rate of 44.10%. The main traits associated with principal component 1 were D—F, E—H, and J—K; those associated with principle component 2 were BD, D—I, CPH, and A—B; and those associated with principle component 3 were H—G, BW, I—L, J—K, and I—J. The first three principal components were associated with all of the measured traits of G. dybowskii (Table 2).
A three-dimensional scatter plot based on principal components 1, 2, and 3 (Figure 6) revealed no overlap between the geographically distinct populations. Each trait in the Turks River population was more compact and less discrete. In contrast, all the traits in the Manas River population were more dispersed, discrete, and significant than those in the Turks River population. Therefore, it was hypothesized that the Manas River population would exhibit more significant interspecific variation than the Turks River population, as assessed by an OPLS-DA.

3.4. Orthogonal Partial Least Squares Discriminant Analysis (OPLS-DA)

Further assessment by an OPLS-DA (Figure 7) revealed that the Turks River population exhibited less intraspecific variation and more overlap than the Manas River population. In contrast, the Manas River population had more distinct intraspecific variation and almost no overlap between traits, and the Turks River population could be separated entirely from the Manas River population, which was consistent with the results of the 3D scatterplot of the principal components.

3.5. Discriminant Analysis

The stepwise discriminant method was used to discriminate 33 morphometric proportional traits between the two geographically distinct populations, and seven eigenvalues with significant discriminant contributions were selected: SL/BL, ED/BL, CPL/BL, CPH/BL, CD/BL, DF/BL, and EH/BL. These identifiers were replaced by X1–X7, respectively, and discriminant formulas were established for the Turks River population (YT) and the Manas River population (YM):
YT = −432.033 + 1787.748X1 + 826.517X2 + 249.002X3 + 1183.050X4 + 554.934X5 + 999.296X6 + 627.428X7;
YM = −569.819 + 2041.044X1 + 344.942X2 + 333.737X3 + 940.512X4 + 348.222X5 + 1167.770X6 + 1015.904X7.
The combined discriminant value for both the Turks River population and the Manas River population was 100% (Table 3), indicating that the two populations were separated entirely and highly differentiated. These results are consistent with those of the OPLS-DA.

3.6. Analysis of the Coefficient of Difference

The coefficients of difference (CD) of nine traits, including EI/BL, C—D/BL, and E—F/BL, exceeded 1.28, with D—F/BL having the highest CD value of 22.7899 and D—H/BL having the next highest value of 8.7849 (Table 4).

4. Discussion

In the present study, the carapace of G. dybowskii from the Turks River gradually deepened to a brownish gray color from the abdomen to the dorsum. The black spots between the lateral line and the dorsum became lighter and darker. In contrast, the carapace of fish from the Manas River population was grayish white, with tiny black dots only on the dorsal ridge, and these fish differed in body color. The morphological characteristics were the same as those reported in the study conducted by Zhang et al. [27]. A total of 22 of the 33 measured morphological traits were highly significantly different according to the one-way ANOVA (p < 0.01), and one was significantly different (p < 0.05). This finding is similar to the results of a previous study by Pashkov et al. [28], who reported significant differences (p < 0.05) in the morphometrics and body colors of geographically distinct populations. Compared with those of other vertebrates, the morphological characteristics of fish are more susceptible to the influence of the environment [29,30]. Morphological differences among the same fish species are closely related to habitat type and quality [31]. Dunn et al. [32] investigated intraspecific variation in the morphological traits of Galaxias brevipinnis, G. gollumoides, and G. vulgaris in different hydrological environments in rapid-flowing and slow-flowing habitats, and Langerhans et al. [33]. compared intraspecies morphological differences between Bryconops caudomaculatus and Biotodoma wavrini from two habitats in the Neotropical region: a river and a lagoon (p < 0.05). The morphological differences in G. dybowskii observed in this study were related to the different habitats in which the sampled fish were found.
A principal component analysis (PCA) provides adequate data degradation and feature extraction. Moreover, this approach can reveal the correlation, direction of change, and importance of the data [34,35]. In this study, the difference in the principal components between the populations of G. dybowskii from the Turks River and Manas River was noticeable. The samples of the two populations formed distinct groups, suggesting that the two populations were differentiated. The morphological traits associated with the first three principal components were mainly related to the body, tail, height, and head. Dunn et al. reported that fish in fast-flowing habitats tend to have shorter body lengths, slender caudal peduncles, small pointed craniums, and smaller muzzles, while fish in slow-flowing habitats tend to have longer bodies, shorter caudal peduncles, and larger craniums and muzzles [32]. These results are consistent with the results of the present study: the population in the Turks River was characterized by a short body, a slender caudal peduncle, and a small and pointed head, and the water volume in this river is sufficient and the water flow is rapid [10,36]. The population in the Manas River was characterized by having a large and long body, a thick caudal peduncle, and a large and rounded head, and the water flow in this river is gentle compared with that in the Turks River [37].
The PCA combined with the OPLS-DA further differentiated between the groups [38]. This study revealed significant differences between the Turks and Manas River populations of G. dybowskii. In this study, we found substantial interspecific differences between the Turks and Manas River populations of G. dybowskii by an OPLS-DA, and the results of the OPLS-DA were consistent with those of other studies using discriminant statistical approaches. The morphological differences between the Turks River and Manas River populations of G. dybowskii were significant (p < 0.05), and the degree of discrimination may suggest the presence of inter-subspecies or interspecies discrimination [39]. The accuracy of the discrimination between the two populations was 100%, indicating that this approach was suitable for discriminating individuals belonging to G. dybowskii.
According to the 75% subspecies identification and characterization criteria proposed by Mayr et al., subspecies are differentiated when the coefficient of difference (CD) is greater than 1.28, although the use of the coefficient of variation as a metric for distinguishing between subspecies needs to be considered in conjunction with other biological and biogeographical factors [26]. In this study, CD analyses between the Turks River population and the Manas River population showed that the CD values for all nine morphological characteristics of G. dybowskii were greater than 1.28. In combination with the geographic isolation and differences in the outward appearance between populations in the Turks River basin and the Manas River basin, as well as the results of the one-way ANOVA, PCA, OPLS-DA, and discriminant analyses, these findings demonstrated that the two populations had reached at least the subspecific level of differentiation. Meng Yanxiao et al. reported that only one trait of species the Brachymystax lenok and Brachymystax lenok tsinlingensis Li differed at the subspecies level (CD > 1.28); combined with the fact that B. lenok and B. lenok tsinlingensis Li are geographically isolated and because of differences in morphological indicators, these authors inferred that the degree of morphological differentiation between B. lenok and B. lenok tsinlingensis Li had reached the subspecies level [38], and the results of the present study are similar to theirs. Therefore, the results of this study support the conclusion that the degree of differentiation between the Turks River population and the Manas River population of G. dybowskii reaches at least at the subspecies level, although further research is needed to determine whether these two populations should be considered separate species.

5. Conclusions

This study shows that G. dybowskii is a typical cold-water plateau fish, exhibiting apparent differences in body color and morphology between the geographically distinct populations. A comprehensive multivariate analysis and one-way analysis of variance (ANOVA) revealed that 23 traits were significantly different between populations. The PCA, OPLS-DA, and discriminant analysis revealed that the two populations could be wholly distinguished from each other and that the differences in the morphological traits were significant (p < 0.05). The coefficient of difference analyses revealed a total of nine traits, with differences rising to the subspecies level (CD > 1.28). We hypothesize that the differentiation of G. dybowskii populations in the Turks and Manas Rivers has reached the subspecific level. This is due to the differences in the ecosystems and the complexity of the water system structure of the two rivers, leading to the deepening of the degree of differentiation. This study provides a scientific basis for the evolution of highland fish fauna and the conservation of the germplasm.

Author Contributions

Conceptualization, L.H. and N.Y.; software, L.H. and C.W.; validation, L.Y. and G.S.; investigation, B.H. and X.Q.; data curation, F.Z. and Y.S.; writing—original draft preparation, L.H. and N.Y.; writing—review and editing, S.C. All authors have read and agreed to the published version of the manuscript.

Funding

The Special Financial Project of the Ministry of Agriculture and Rural Affairs (Fishery Resources and Environment Survey in Key Waters of Northwest China); the Corps Science and Technology Bureau Key Areas of Science and Technology Public Relations Plan (2022DB019).

Institutional Review Board Statement

All experimental protocols were approved by the Ethics Committees of the Tarim University of Technology (approval code: TDDKYXF 20200426, approval date: 26 April 2020) and adhered to animal welfare laws, guidelines, and policies.

Data Availability Statement

Because the project is not finalized, a link to the data has not been made public.

Acknowledgments

Thank you to our fishery department colleagues and Yingcheng Studio.

Conflicts of Interest

The authors declare no conflicts of interest.

Appendix A

Table A1. One-way ANOVA results for measured traits of G. dybowskii from distinct geographical populations (fraction not significantly different).
TraitsTMp
Mean ± SDMean ± SD
TL/BL1.235 ± 0.3161.163 ± 0.0490.46
BD/BL0.177 ± 0.0120.180 ± 0.0290.217
CPH/BL0.068 ± 0.0050.063 ± 0.0090.128
I—J/BL0.284 ± 0.0150.308 ± 0.0240.495
A—J/BL0.260 ± 0.0130.237 ± 0.0150.615
AI/BL0.537 ± 0.0120.533 ± 0.0490.09
B—J/BL0.141 ± 0.0080.140 ± 0.0110.695
B—I/BL0.374 ± 0.0130.383 ± 0.0530.091
C—J/BL0.244 ± 0.0150.252 ± 0.0470.984
H—G/BL0.088 ± 0.0090.130 ± 0.0630.181

References

  1. Guo, Y.; Zhang, R.M.; Cai, L.G. Xinjiang of Fishery; Xinjiang Science and Technology Press: Urumqi, China, 2012; ISBN 9787546615295. [Google Scholar]
  2. Cao, W.X.; Chen, Y.Y.; Wu, Y.F. Origin and evolution of schizothoracine fishes in relation to the upheaval of the Xizang Plateau. In Tibetan Expedition Team of the Chinese Academy of Science ed. Studies on the Period, Amplitude and Type of the Uplift of the Qinghai-Xizang Plateau; Science Press: Beijing, China, 1981; pp. 118–130. [Google Scholar]
  3. He, D.K.; Chen, Y.F.; Chen, Y.Y.; Chen, Z.M. Molecular phylogeny of the specialized Schizothoracine fishes (Teleostei: Cyprinidae), with their mplications for the uplift of the Qinghai-Tibetan Plateau. J. Chin. Sci. Bull. 2004, 49, 39–48. [Google Scholar] [CrossRef]
  4. Qi, D.; Chao, Y.; Guo, S.; Zhao, L.; Li, T.; Wei, F.; Zhao, X. Convergent, parallel and correlated evolution of trophic morphologies in the subfamily Schizothoracinae from the Qinghai-Tibetan Plateau. PLoS ONE 2012, 7, e34070. [Google Scholar] [CrossRef]
  5. Guan, L.; Chi, W.; Xiao, W.; Chen, L.; He, S. Analysis of ypoxia-inducible factor alpha polyploidization reveals adaptation to Tibetan plateau in the evolution of Schizothoracine fish. BMC Evol. Biol. 2014, 14, 192. [Google Scholar] [CrossRef]
  6. Zhu, X.F.; Chen, Y.F. Preliminary study on the age and growth characteristics of Schizothorax macropogon. Chin. J. Zool. 2009, 44, 76–82. [Google Scholar]
  7. Wang, Z.; Yan, Y.C.; Jiang, P.G.; Yan, A. Effects of different factors on soil moisture in farmland in Manas River Basin. Xinjiang Agric. Sci. 2013, 50, 1879–1886. [Google Scholar]
  8. Li, Y.Y.; Zhang, H.L.; Zhang, F.H.; Chen, F.; Lai, X.Q. Analysis on the Potential of the Available Agricultur e Water Resour ces in Manas River Valley, Xinjiang. J. Nat. Resour. 2007, 22, 44–50. [Google Scholar] [CrossRef]
  9. Sui, F.G. Tectonic evolution and its relationship with hydrocarbon accumulation in the northwest margin of Junggar Basin. J. Geol. 2015, 89, 779–793. [Google Scholar] [CrossRef]
  10. Ren, M.L.; Guo, Y.; Zhang, Q.L.; Zhang, R.M.; Li, H.; A, D.K.; Cai, L.G.; Yong, W.D.; Ren, B.; Gao, H.; et al. Fish Resources and Fishery of Ili River; Heilongjiang Science and Technology Press: Harbin, China, 1998; pp. 13–310. ISBN 7-5388-3369-2. [Google Scholar]
  11. Chen, L.P. Study on the Ecological Environment of Manas River Basin. Master’s Thesis, Shihezi University, Xinjiang, China, 2020. [Google Scholar] [CrossRef]
  12. Robinson, W.B.; Parsons, J.K. Changing times, spaces, and faces: Tests and implications of adaptive morphological plasticity in the fishes of northern postglacial lakes. Can. J. Fish. Aquat. Sci. 2002, 59, 1819–1833. [Google Scholar] [CrossRef]
  13. Langerhans, R.B.; Layman, C.A.; Shokrollahi, A.M.; DeWitt, T. Predator-driven phenotypic diversification in Gambusia affinis. Evolution 2004, 58, 2305–2318. [Google Scholar]
  14. Lostrom, S.; Evans, J.P.; Grierson, P.F.; Collin, S.P.; Davies, P.M.; Kelley, J.L. Linking stream ecology with morphlogical variabilityin a native freshwater fish from semi-arid Australia. Ecol. Evol. 2015, 5, 3272–3287. [Google Scholar] [CrossRef]
  15. Scharnweber, K. Morphological and trophic divergence of lake and stream minnows (Phoxinus phoxinus). Ecol. Evol. 2020, 10, 8358–8367. [Google Scholar] [CrossRef]
  16. Franssen, N.R. Anthropogenic habitat alteration induces rapid morphological divergence in a native stream fish. Evol. Appl. 2011, 4, 791–804. [Google Scholar] [CrossRef]
  17. Lang, J.J.V.; Snyder, R.J.; Clapsadl, M.D.; Michalak, P.; Kang, L.; Pérez-Fuentetaja, A. Morphometric differentiation and gene flow in emerald shiner (Notropis atherinoides) from the lower Great Lakes and the Niagara River. J. Great Lakes Res. 2018, 45, 324–332. [Google Scholar] [CrossRef]
  18. Ramler, D.; Palandacic, A.; Delmastro, G.B.; Wanzenbock, J.; Ahnelt, H. Morphological divergence of lake and stream Phoxinus of northern Italy and the Denube basin based on geometric morphometric analysis. Ecol. Evol. 2016, 7, 572–584. [Google Scholar] [CrossRef]
  19. Li, S.F.; Li, C.H.; Li, J.L. Analysis of morphological differences among strains of Nile tilapia. J. Zool. 1998, 44, 75–82. [Google Scholar]
  20. Yin, M.C. Fish Ecology; China Agricultural Press: Beijing, China, 1995; ISBN 9787109031432. [Google Scholar]
  21. Wang, W.; Chen, L.Q.; Gu, Z.M.; Peng, S.M.; Li, Y.K. Analysis of Morphological Variations among Seven Populations of Erythroculter ilishaeformis. Freshw. Fish. 2007, 37, 40–44. [Google Scholar]
  22. Xie, C.X.; Zhang, J.B.; Diao, X.M.; Kong, X.Y.; Li, S.A.; Wu, H.H.; Zhang, J.P.; Wu, Y.F.; Qin, W.; Huang, Q.; et al. Ichthyology; China Agricultural Press: Beijing, China, 2010; ISBN 978-7-109-13579-6. [Google Scholar]
  23. Wang, J.L.; Chen, Q.H.; Lu, W.Z.; Yuan, S.Q.; Hu, Q.X.; Cen, S.S.; Zhou, C.J.; Meng, X.L.; Nie, G.X.; Gu, Q.H. Morphological differences among five species in rhodeinae in Huaihe River basin in Henan Province. J. Aquat. Biol. 2019, 43, 123–132. [Google Scholar]
  24. Dray, S.; Dufour, A. The ade4 Package: Implementing the Duality Diagram for Ecologists. J. Stat. Softw. 2007, 22, 1–20. [Google Scholar] [CrossRef]
  25. Trygg, J.; Wold, S. Orthogonal projections to latent structures (O-PLS). J. Chemom. 2002, 16, 119–128. [Google Scholar] [CrossRef]
  26. Mayr, E.; Gorton, L.E.; Usinger, R.L. Methods and Principles of Systematic Zoology; Mc-Graw-Hill Book Company: New York, NY, USA, 1953; pp. 125–154. [Google Scholar]
  27. Zhang, Y.J.; Chen, S.A.; Wang, C.X.; Wang, X.Y.; Li, J.L.; Xie, C.X.; Wei, Q. Morphological differences among different geographic populations of the naked heavy-lipped fishes in Xinjiang. Xinjiang Agric. Sci. 2023, 60, 511–520. [Google Scholar] [CrossRef]
  28. Pashkov, N.A. Morphological characteristics of the populations of black-striped pipefish Syngnathus abaster Risso, 1827 (Pisces, Actinopterygii, Syngnathidae) in some North Caucasian water bodies. Mar. Biol. J. 2017, 2, 55–69. [Google Scholar]
  29. Vincent, R.; Marc, P.; Pierre, M. Parallel evolution of morphological traits and body shape in littoral and pelagic brook charr, Salvelinus fontinalis, along a gradient of interspecific competition. Oecologia 2021, 197, 421–436. [Google Scholar]
  30. Hetzel, C.; Forsythe, P. Phenotypic plasticity of a generalist fish species resident to lotic environments: Insights from the Great Lakes region. Ecol. Evol. 2023, 13, e10715. [Google Scholar] [CrossRef]
  31. Caiger, P.E.; Croq, C.; Clements, K.D. Environmentally induced morphological variation in the temperate reef fish, Forsterygion lapillum (F. Tripterygiidae). Mar. Biol. 2021, 168, 131. [Google Scholar] [CrossRef]
  32. Dunn, N.R.; O’Brien, L.K.; Burridge, C.P.; Closs, G.P. Morphological Convergence and Divergence in Galaxias Fishes in Lentic and Lotic Habitats. Diversity 2020, 12, 183. [Google Scholar] [CrossRef]
  33. Langerhans, R.B.; Layman, C.A.; Langerhans, A.K.; Dewitt, T.J. Habitat-associated morphological divergence in two Neotropical fish species. Biol. J. Linn. Soc. 2003, 80, 689–698. [Google Scholar]
  34. Ola-Oladimeji, F.A.; Oso, J.A.; Oladimeji, T.E.; Idowu, E.O.; Adeleke, K.; Urihe, F.O. Phenotypic Diversities of Four Populations of Clarias Gariepinus (Siluriformes, Clariidae) Obtained from Ogun and Ondo State Waterbodies in South-Western Nigeria. Vestn. Zool. 2017, 51, 285–294. [Google Scholar]
  35. Iqbal, M.Z.; Chamily, F.A.; Rahman, M.M.; Tasnim, R.; Mohiuddin, M.; Sultana, F.; Rahman, S.M.; Ali, M.M. Habitat salinity and source-induced variation in body shape of euryhaline long whiskers catfish (Mystus gulio). Reg. Stud. Mar. Sci. 2024, 69, 103308. [Google Scholar]
  36. Wang, Y.; Ding, J.; Li, X.; Zhang, J.; Ma, G. Impact of LUCC on ecosystem services values in the Yili River Basin based on an intensity analysis model. J. Ecol. 2022, 42, 3106–3118. [Google Scholar]
  37. Jiang, L. Analysis on Groundwater Characteristics at Mosuowan Irrigation District of the ManasRiver Basin. Groundwater 2016, 38, 1–3. [Google Scholar]
  38. Jiang, E.; Yang, Y.; Pan, M.; Tao, Y. Efficacy evaluation and metabolomics analysis of raw and salt-processed Achyranthes bidentata Radix in zebrafish larvae for osteoporosis treatment. J. Pharm. Biomed. Anal. 2024, 237, 115774. [Google Scholar] [CrossRef]
  39. Mong, Y.X.; Wang, G.H.; Xiong, D.M.; Liu, H.X.; Zhang, J.L.; Wang, J.L.; Wang, L.X.; Liu, X.L. Exploring the validity of subspecies of Qinling Chinook salmon based on morphological differences. J. Aquat. Biol. 2018, 42, 550–560. [Google Scholar]
Figure 1. Sampling sites for G. dybowskii.
Water 16 00755 g001
Figure 2. Traditional morphological measurements of G. dybowskii. TL: total length; BL: body length; BD: body depth; HL: head length; SL: snout length; ED: eye diameter; CPL: caudal peduncle length; CPH: caudal peduncle height.
Water 16 00755 g002
Figure 3. Frame structure of G. dybowskii. A. Tip of the snout; B. end of the frontal maxilla; C. origin of the dorsal fin; D. terminus of the dorsal fin; E. dorsal origin of the caudal fin; F. ventral origin of the caudal fin; G. terminus of the anal fin; H. origin of the anal fin; I. insertion of the pelvic fin; J. insertion of the pectoral fin; K. terminus of the pectoral fin; L. terminus of the pelvic fin; L. terminus of the pelvic fin; L. terminus of the pectoral fin; L. terminus of the pelvic fin.
Water 16 00755 g003
Figure 4. Morphological characteristics of G. dybowskii (T: Turks River population; M: Manas River population).
Water 16 00755 g004
Figure 5. Eigenvalues of the principal component factors.
Water 16 00755 g005
Figure 6. Three-dimensional spatial distribution of G. dybowskii from geographically distinct populations; PC1, PC2, and PC3 are principal components 1, 2, and 3, respectively; T is the population in the Turks River, and M is the population in the Manas River.
Water 16 00755 g006
Figure 7. OPLS-DA of G. dybowskii from geographically distinct populations; T is the population from the Turks River, and M is the population from the Manas River; the vertical coordinate “Orthogonal T Score” indicates the orthogonal principal components test score, which responds to within-group differences. The horizontal coordinate “T Score” indicates the predictive principal component test score, which reflects the difference between groups.
Water 16 00755 g007
Table 1. One-way ANOVA results for measured traits of G. dybowskii from distinct geographical populations (fraction with significant differences).
TraitsTMp
Mean ± SDMean ± SD
BW/BL0.139 ± 0.0120.135 ± 0.019<0.001 **
HL/BL0.253 ± 0.0110.228 ± 0.0220.007 **
SL/BL0.075 ± 0.0070.080 ± 0.012<0.001 **
ED/BL0.055 ± 0.0060.036 ± 0.010<0.001 **
EI/BL0.074 ± 0.0060.081 ± 0.007<0.001 **
CPL/BL0.127 ± 0.0160.173 ± 0.046<0.001 **
A—B/BL0.201 ± 0.0100.187 ± 0.017<0.001 **
B—C/BL0.267 ± 0.0140.274 ± 0.046<0.001 **
C—D/BL0.127 ± 0.0100.110 ± 0.016<0.001 **
D—E/BL0.331 ± 0.0290.403 ± 0.085<0.001 **
E—F/BL0.071 ± 0.0060.114 ± 0.0600.03 *
F—H/BL0.205 ± 0.0120.252 ± 0.037<0.001 **
H—I/BL0.195 ± 0.0220.205 ± 0.029<0.001 **
A—C/BL0.455 ± 0.0250.457 ± 0.030<0.001 **
C—I/BL0.180 ± 0.0140.194 ± 0.022<0.001 **
C—H/BL0.319 ± 0.0260.319 ± 0.045<0.001 **
C—F/BL0.482 ± 0.0360.551 ± 0.031<0.001 **
D—I/BL0.144 ± 0.0130.156 ± 0.026<0.001 **
D—H/BL0.202 ± 0.0130.225 ± 0.025<0.001 **
D—F/BL0.358 ± 0.0170.440 ± 0.026<0.001 **
E—H/BL0.227 ± 0.0130.290 ± 0.016<0.001 **
J—K/BL0.037 ± 0.0050.093 ± 0.062<0.001 **
I—L/BL0.043 ± 0.0050.077 ± 0.0500.004 **
Note: Superscript “*” indicates a significant difference (p < 0.05), and superscript “**” indicates a highly significant difference (p < 0.01).
Table 2. Principal component analysis of G. dybowskii from geographically distinct populations.
TraitsPrincipal Components
PC1PC2PC3
TL/BL0.02690.18110.2311
BD/BL−0.06770.3448−0.2049
BW/BL0.00660.2441−0.3475 a
HL/BL0.23010.21240.0575
SL/BL−0.04030.1062−0.1167
ED/BL0.24000.13260.1405
EI/BL−0.17310.1897−0.0684
CPL/BL−0.2145−0.07780.1633
CPH/BL0.07500.3008 a−0.0511
A—B/BL0.15430.2680 a0.2055
B—C/BL−0.08350.00900.1412
C—D/BL0.15520.1579−0.1804
D—E/BL−0.1876−0.0088−0.0190
E—F/BL−0.1557−0.0788−0.1160
F—H/BL−0.2374−0.0484−0.0071
H—I/BL−0.0899−0.0619−0.0867
I—J/BL−0.18840.1049−0.2560 a
A—J/BL0.20920.21770.2051
A—I/BL−0.02760.21770.0015
B—J/BL−0.02510.19180.1029
B—I/BL−0.10600.22870.0059
A—C/BL−0.04220.14840.0698
C—J/BL−0.0631−0.0088−0.0920
C—I/BL−0.15990.2499−0.0863
C—H/BL0.00290.1119−0.1902
C—F/BL−0.2216 a−0.0659−0.1287
D—I/BL−0.16990.3295 a−0.0890
D—H/BL−0.23050.1111−0.0782
D—F/BL−0.2977−0.0611−0.0914
E—H/BL−0.2821 a−0.0496−0.0523
J—K/BL−0.2679 a0.05410.3061 a
I—L/BL−0.24250.07970.3426 a
H—G/BL−0.22880.06140.3476 a
Eigenvalue8.803.922.27
Percentage of Variance (%)25.911.56.7
Cumulative (%)25.937.444.1
Note: Superscript “a” indicates a load that exceeds 0.2500.
Table 3. Discriminant analysis of G. dybowskii from geographically distinct populations.
MethodPopulationPredicted Group MembershipIdentification
Accuracy/Percent
Discriminant Accuracy/Percent
TM
Stepwise discriminationT1230100100
M035100
Note: T is the population from the Turks River, and M is the population from the Manas River.
Table 4. Analysis of the coefficients of difference of G. dybowskii from geographically distinct populations.
TraitsTMCD
Min~MaxMean ± SDMin~MaxMean ± SD
TL/BL0.1106–2.29281.2354 ± 0.31580.9567–1.26061.1633 ± 0.04940.1490
BD/BL0.1600–0.23000.1772 ± 0.01240.1200–0.25000.1797 ± 0.0292−0.4488
BW/BL0.1100–0.17000.1386 ± 0.01160.0900–0.17000.1354 ± 0.0187−2.2707
HL/BL0.2100–0.27000.2530 ± 0.01090.1400–0.26000.2280 ± 0.02190.8481
SL/BL0.0600–0.10000.0754 ± 0.00690.0500–0.10000.0797 ± 0.0120−4.7870
ED/BL0.0400–0.07000.0554 ± 0.00600.0200–0.06000.0363 ± 0.010012.6230
EI/BL0.0600–0.09000.0737 ± 0.00630.0700–0.09000.0814 ± 0.00691.5063 *
CPL/BL0.1100–0.19000.1269 ± 0.01600.0700–0.37000.1726 ± 0.0463−1.3499
CPH/BL0.0600–0.08000.0675 ± 0.00490.0400–0.08000.0626 ± 0.0085−1.8644
A—B/BL0.1800–0.22000.2006 ± 0.00980.1500–0.23000.1874 ± 0.01690.2266
B—C/BL0.2200–0.30000.2670 ± 0.01400.1800–0.49000.2743 ± 0.0462−2.5602
C—D/BL0.1000–0.16000.1267 ± 0.00970.0500–0.14000.1097 ± 0.01641.3048 *
D—E/BL0.1000–0.37000.3305 ± 0.02890.0500–0.46000.4034 ± 0.08480.7900
E—F/BL0.0600–0.09000.0707 ± 0.00550.0600–0.45000.1140 ± 0.06041.9013 *
F—H/BL0.1800–0.24000.2051 ± 0.01230.0900–0.30000.2517 ± 0.03681.4903 *
H—I/BL0.0200–0.23000.1949 ± 0.02220.0900–0.26000.2049 ± 0.02892.5655 *
I—J/BL0.2500–0.32000.2842 ± 0.01510.2400–0.36000.3077 ± 0.0243−8.3643
A—J/BL0.2200–0.29000.2596 ± 0.01260.2000–0.26000.2371 ± 0.0153−0.0874
A—I/BL0.5000–0.57000.5367 ± 0.01170.3000–0.60000.5334 ± 0.0495−0.3953
B—J/BL0.1200–0.16000.1410 ± 0.00800.1200–0.17000.1400 ± 0.01060.2191
B—I/BL0.3500–0.41000.3742 ± 0.01260.1200–0.45000.3831 ± 0.05320.4773
A—C/BL0.2300–0.50000.4550 ± 0.02550.3800–0.53000.4571 ± 0.02990.2541
C—J/BL0.1700–0.28000.2437 ± 0.01460.0100–0.31000.2520 ± 0.04731.8431 *
C—I/BL0.1500–0.28000.1799 ± 0.01430.1500–0.25000.1940 ± 0.02200.0105
C—H/BL0.2600–0.51000.3187 ± 0.02650.0800–0.36000.3189 ± 0.0454−15.8851
C—F/BL0.1400–0.55000.4815 ± 0.03560.4400–0.60000.5506 ± 0.03120.9605
D—I/BL0.1100–0.18000.1439 ± 0.01320.1200–0.60000.1563 ± 0.02611.8586 *
D—H/BL0.1700–0.24000.2020 ± 0.01290.1600–0.27000.2246 ± 0.02508.7849 *
D—F/BL0.3100–0.41000.3580 ± 0.01650.3600–0.51000.4397 ± 0.025822.7899 *
E—H/BL0.2000–0.27000.2274 ± 0.01320.2400–0.32000.2903 ± 0.01600.9998
J—K/BL0.0300–0.05000.0370 ± 0.00540.0300–0.17000.0934 ± 0.06180.7654
I—L/BL0.0300–0.05000.0427 ± 0.00510.0200–0.14000.0769 ± 0.04980.7736
H—G/BL0.0500–0.11000.0880 ± 0.00880.0600–0.29000.1300 ± 0.06310.2706
Note: T is the population from the Turks River, M is the population from the Manas River. SD represents the coefficient of difference, with a superscript “*” indicating that the data suggest the presence of two subspecies (CD > 1.28).
Disclaimer/Publisher’s Note: The statements, opinions and data contained in all publications are solely those of the individual author(s) and contributor(s) and not of MDPI and/or the editor(s). MDPI and/or the editor(s) disclaim responsibility for any injury to people or property resulting from any ideas, methods, instructions or products referred to in the content.

