Abstract
Smart water cities (SWCs) use advanced technologies for efficient management and preservation of the urban water cycle, strengthening sustainability and improving the quality of life of the residents. This research aims to develop measurement and evaluation tools for SWC key performance indicators (KPIs), focusing on innovative water technologies in establishing unified global standards and certification schemes. The KPIs are categorized based on the stage at which water is being measured, namely the urban water cycle, water disaster management and water supply and treatment. The objective is to assess cities’ use of technologies in providing sufficient water supply, monitoring water quality, strengthening disaster resilience and maintaining and preserving the urban water ecosystem. The assessment is composed of a variety of procedures performed in a quantitative and qualitative manner, the details of which are presented in this study. The developed SWC KPI measurements are used to evaluate the urban water management practices for Busan Eco Delta City, located in Busan, South Korea. Evaluation processes were presented and established, serving as the guideline basis for certification in analyzing future cities, providing integrated and comprehensive information on the status of their urban water system, gathering new techniques, and proposing solutions for smarter measures.
1. Introduction
Urban water management plays a crucial role in ensuring an adequate and clean water supply for cities. There has been an increase in the management’s responsibility to adopt more sustainable approaches in the management of urban water due to external factors such as climate change and population growth; therefore, there has been the adaptation of advanced technologies and more robust management models due to increased water service demands.
The use of Information and Communication Technology (ICT) is often presented as a powerful strategy for smart water development, allowing the better management of natural water resources and facilitating positive progress. The integration of ICT in urban water management is integral in addressing the complexities of water management ranging from various categories, including water source, supply, stormwater, wastewater, reuse, disposal, environmental flow, water conservation and more []. The combined effect of urbanization in response to population growth in cities affects the natural landscape, affecting the quality and quantity of usable water from water sources [].
Key performance indicators (KPIs) are sets of values that are used to measure the performance of the criteria. The assessment of different technological human interventions and their impact throughout the urban water cycle helps the assessment of the extent to which a city can be considered a “smart water city”. The concept of smart water cities (SWCs) pertains to urban municipalities that integrate advanced technologies and implement data-driven solutions to optimize the efficiency, sustainability, and resilience of their water management system []. Such cities leverage the use of ICTs and innovative tools in the monitoring, analysis, and management of various aspects of the urban water cycle. The proposal for SWCs offers hope and progress in time of rapid urbanization and growing water challenges such as water scarcity, water pollution, flood, drought and more.
While previous standards and certification schemes have dealt with urban sustainable growth and development since the early 1990s, certain deficits have been identified. Despite their usefulness, these standards primarily focus on measuring access to drinking water and sanitation but lack a comprehensive assessment of smart urban water management. The deficiencies cited include a limited number of indicators in examining diverse water functions, insufficient measurement of smart technology implementation, inadequate preparation for climate change, limited application of low-impact development and green infrastructures and insufficient evaluation of the quality and effectiveness of observation-measuring instruments. These standards are reviewed based on the performance of the standard measures such as sustainability, smartness and resilience and mainly focus on the local level, primarily understanding the city as a unit. These standards are as follows: United 4 Smart Sustainable Cities (U4SSC) [], ISO 37120 Series (Sustainable Cities and Communities) [], OECD (Organization for Economic Co-operation) Smart City measurement framework [], CITYKeys Smart City Index [], LEED for Cities and Communities [], Arcadis Sustainable Cities Water Index [], KWR Blueprint Approach [] and AWS International Water Stewardship Standard [].
Upon analysis, these standards are recognized as valuable tools for measuring various urban aspects; however, the examination revealed certain deficiencies in the context of smart water management. The identified deficits include (1) indicators examining the diverse functions of water in the city being limited. The existing standards predominantly focus on almost exclusively measuring the accessibility to drinking water and sanitation, overlooking other vital functions; (2) the standards lack comprehensive indicators measuring the implementation of smart technologies in urban water management. This limitation hinders the understanding regarding whether the cities are incorporating smart technologies effectively in their smart water management practices; (3) the standards inadequately address the cities’ preparedness for climate change, specifically concerning issues such as the excess and deficiency in the water supply; (4) insufficient emphasis on the application of low-impact development and green infrastructures, which play a crucial role in enhancing the sustainability of the urban water cycle (5) and the lack of evaluation on the quality and effectiveness of observation-measuring instruments used in urban water management. These identified deficits emphasize the need for a more comprehensive and inclusive approach in the development of standards that can effectively analyze the city’s urban water management, allowing integral information for policy makers and providers to define the priorities in urban water management at the municipal level.
The goal of this research is to assess the technological solutions implemented by cities to strengthen their water resource management. To achieve this, the study involves an examination of the existing global standards and frameworks for smart water cities, aiming to identify common water challenges and, finally, develop a robust smart water city key performance indicators (KPIs) evaluation methodology that can be applied to examine the technological approaches developed by cities to monitor and mitigate water-related issues.
The smart water city project aims to develop an instrument for measuring and evaluating smart urban water management in cities around the world to form a global standard and certification scheme for smart water cities. The instrument will serve to examine and compare urban water management for urban water resources in different countries. The global standard and certification schemes will provide integrated and comprehensive information on the urban water status and can offer guidance to cities and communities to become smart(er). This global standard and certification scheme will contribute to the development of capacities and decision-making functions of local water providers and communities, as well as for authorities.
The developed methodology for assessing the performance of smart water cities is implemented in the examination of technologies and practices employed in Busan Eco Delta City located in Busan Metropolitan City, South Korea. The evaluation results derived from the assessment can serve as valuable resources for cities worldwide, aiding in identifying deficiencies in their urban water management strategies and offering potential solutions for implementation. At the same time, this presents an excellent opportunity to acknowledge and showcase the innovative efforts of the cities in providing unique solutions to their water problems. This recognition can serve as a guide for other cities to emulate successful practices and apply tailored solutions within their urban context.
2. Developing Technical Key Performance Indicators
For this study, the indicators designated to evaluate the characteristics of urban water and the strategies implemented by the city to optimize the water management, showcasing features recognizable as a smart water city, shall be referred to as technical key performance indicators (KPIs). The development of these KPIs follows the methodology outlined in the figure below (Figure 1).
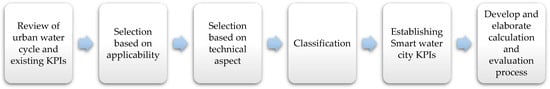
Figure 1.
Smart water city technical KPIs selection, classification, and evaluation process.
Firstly, a comprehensive review and compilation of the existing international standards for smart water cities is conducted. Simultaneously, analysis of the current state of water management in cities located in both progressive and developing countries is undertaken (Details of this review can be found in the Smart Water Cities Phase 1: Identifying Smart Water Cities Report 2021 []). The prevalent water technologies used and the recurring challenges in urban water management are considered. Subsequently, an assessment is made regarding the availability of the data needed for the evaluation, both for developed and developing countries. The KPIs are then systematically categorized into either technical or water governance indicators. Governance indicators pertain to regulations and operational practices in urban water management, as well as the effective implementation of water policies. In this evaluation, water governance indicators shall not be prioritized, and the primary focus shall be applied to the smart water technologies, contributing to their role in the city water cycle management. Recurring KPIs from established global standards are retained based on their significance, and new indicators are developed based on the overall assessment of the inadequacies in the current water management of cities. The final phase of the methodology involves formulating the calculation methods and evaluation processes derived from an extensive literature review, urban water reports, guidelines, research articles and related sources. The developed methodology is used to calculate the city’s standings in the application of Information and Communication Technologies (ICTs) and its efficiency in urban water management. This assessment aims to determine whether the city can be quantified as a smart water city.
2.1. Categories
The technical KPIs evaluate the city’s proficiency in leveraging technologies in enhancing water disaster resilience, mitigating risks, ensuring adequate water supply, monitoring, and maintaining the quality of potable water and wastewater and sustaining the balance of the urban water ecosystem. This research delineates three primary categories in the assessment to distinguish the technological water interventions based on the functions they fulfill in the city water management. These categories are named the urban water cycle, water disaster management and water supply and treatment.
2.1.1. Urban Water Cycle
The urban water cycle category is composed of technical indicators that evaluate the city’s ability to facilitate water data and information management related to precipitation, ground surface, infiltration, and urban water bodies. The indicators in this category assess how the natural hydrological cycle is being preserved and maintained, despite the ongoing development of artificial structures as a result of dynamic urbanization.
The indicators in this category evaluates the capacity of the cities to (1) monitor the processes of water circulation within the city by consistently observing the spatial and temporal characteristics of the hydro-meteorological and urban surface data; (2) ensure the quality of the observation data through high-frequency monitoring; (3) guarantee the accuracy of observations through consistent data quality assurance, minimizing missing or erroneous data, and conducting instrument calibrations; (4) implement developments and infrastructures to assist the natural flow of the water circulation, [including, but not limited to, low-impact developments (LIDs), green infrastructures (GIs) and nature-based solutions (NBSs)]; (5) preserve the health of the urban water bodies and aquatic ecosystems; (6) apply modern technological developments in the collection, storage and transmission of water cycle data; (7) implement real-time measurements, automations and facilitate easy access to data and (8) build infrastructures that enhance urban water amenities for ecological health and aesthetic purposes.
2.1.2. Water Disaster Management
The water disaster management category outlines the measures cities undertake to manage the impact of water-related disasters and adaptation strategies implemented to prepare for the anticipated effects of climate change. Recognizing and addressing the city’s vulnerability to water disasters through building and strengthening resilience is proven to be more cost-effective than mitigating losses and sustaining during disaster events.
These water disaster management indicators evaluate the city’s (1) exposure and vulnerability to water-related disasters, specifically urban flooding and drought events; (2) capability to provide accurate weather-related forecasts and adequate early warning to residents; (3) ability to identify and fortify urban risk areas; (4) utilization of real-time and state-of-the-art measuring devices for disaster monitoring and prevention; (5) application of ICT-based technologies in flood and drought management; (6) capability to store excess water and provide an alternative water supply source in case of water deficits; (7) development of city-scale climate adaptation action plans and (8) efforts conducted to save and reduce the municipal-level energy usage, including the utilization of renewable energy, usage of eco-friendly facilities, zero-emission devices and more.
2.1.3. Water Supply and Treatment
Finally, smart water cities must be evaluated based on their capacity to provide sufficient and high-quality water supply to urban residents, as well as their proper handling of sanitation and wastewater treatment at the municipal level. This category highlights the assessment of the distribution, treatment and management of potable water and wastewater. The water supply and treatment KPIs provide an assessment of the city’s proficiency in the following aspects: (1) constant monitoring and maintenance of the standard water supply and wastewater quality, (2) provision of an alternative source of water supply, (3) sufficient distribution of the water supply and wastewater services to the urban population, (4) detection of deteriorating supply and sewage pipe networks, along with the provision of adequate maintenance, (5) management and operation of city-scale water purification and wastewater treatment plants, (6) implementation of real-time water flow and water quality monitoring or smart meter reading, (7) utilization of ICT-based technologies in remote control and monitoring, (8) the application of advanced water treatment technologies in treatment facilities, (9) assurance of the quality of the drinking water, (10) the establishment of proper treatment regulations for sewage waste discharge and (11) efficient reuse and constant monitoring of the quality of treated wastewater.
2.2. Key Performance Indicators
The smart water city technical evaluation categories are further broken down into 11 subcategories, classifying indicators based on specific functions that different water technologies fulfill at the city-level water management. These subcategories are named precipitation, surface water, stream water level, stream water quality, groundwater level and groundwater quality for the urban water cycle category; flood, drought, and climate change for the water disaster management and water source, drinking water treatment, water distribution, wastewater treatment and water reuse for the water supply and treatment category, respectively. The details of the indicators for each subcategory are listed in Table 1.

Table 1.
Smart water city evaluation main categories, subcategories, and respective key performance indicators.
For each subcategory, the Smart Water City Index selected indicators that can be categorized into two types: sustainability and smartness based on the types of water management they measure. Sustainability refers to the city’s capacity to provide basic necessities in the sustainable management of the urban water system. In the technical aspect, sustainability indicators provide a fundamental framework in preserving and improving the quality of life of citizens, ensuring the stability of the urban water system. It emphasizes enhancing the integrity of the urban water environment, addressing not only the present needs but also preparing for future water challenges. Indicators of this type seek to measure the performance of these functional purposes at different stages of urban water management. Smartness, on the other hand, defines the city’s ability to leverage more sophisticated forms of technologies to achieve and enhance the sustainability of the urban water management system as a solution tool to resolve urban water problems. Smartness indicators are comprised of advancements in the provision and operation of modern technology in terms of data, infrastructure and services. Data indicators provide an evaluation for the management and security of fundamental hydro-meteorological data for optimal urban smart water management. The indicators under infrastructure assess the ICT-based infrastructure solution tools for urban water system functional awareness and solving urban water-related problems. Meanwhile, service indicators analyze the smart city’s capacity to provide decision support services, enhancing the efficiency and competitiveness of water services in improving the quality of life of the citizens.
2.3. Scoring and Evaluation
The technical KPIs are scored based on the performance of the city examined, with each indicator serving as a measure of the city’s ability to manage and preserve the urban water cycle. The main objective is to enhance sustainability and contribute to the improvement in quality of life of the urban residents []. The cities shall be evaluated on whether they satisfy such criteria. These KPIs are scored on a scale from 0 to 4, where 4 indicates excellent performance in the variable measured by the indicator, 3 corresponds to a “good performance”, 2 is a “moderate” performance, 1 is a “poor performance” and 0 is a “bad” performance.
The assessment and rating of the water management demands an in-depth understanding of the local water systems and their implementation. The primary challenge in evaluating urban water management lies in the need for a comprehensive understanding of these systems and their functionalities. Achieving an overall assessment requires expertise from various city water departments. This ensures that the evaluation accurately reflects the existing water management practices, establishes realistic standards, and considers the attainability of necessary water data.
2.3.1. Evaluation Guidelines
The indicators undergo evaluation using either quantitative or qualitative methods. To define the actual values for each indicator, various strategies are implemented []:
- Ratio calculations: Indicators are assessed as a ratio to a certain established reference value.
- Reference range: Indicators are assessed based on a specific range from an established reference (journal articles, technical reports, website data, established guidelines, etc.), which is specific to the indicator.
- Standards: Indicators are assessed based on the presence (full score) or absence (zero score) of a certain standard. In these cases, evidence of existence shall be required, such as documentation, reports, photo, etc.
- Survey questionnaires: Indicators are assessed based on survey questionnaires confirming the present establishment of certain standards.
- Comparison with other cities: Indicators are assessed as a comparison to the average performance of progressive cities/mega cities.
- Expert opinion: In addition, certain criteria lacking established standards from the literature shall be evaluated based on experts’ opinions. Further evaluations of the KPIs were collected from specialists from different fields within the water sector to identify the appropriate evaluation methods for these particular indicators.
2.3.2. Developed KPI Calculation and Evaluation Process
Following the evaluation guidelines, methods are devised to calculate the performance of the city, assessing its potential to be classified as a smart water city. These methods are categorized into quantitative and qualitative approaches, depending on the nature of the available data. The list of KPIs, along with the corresponding evaluation type, evaluation method and the literature basis for calculation, is presented in Table 2.
Table 2.
Evaluation type, method and corresponding reference for each technical indicator.
Calculation methods are systematically compiled for each indicator based on an extensive literature review. For quantitative indicators, the computational formulas and standards are derived from the existing guidelines found in research articles, reports and frameworks established by credible organizations. For example, the recommended rainfall observation coverage density for urban areas according to the WMO (2020) [] is at least one rain gauge for every 10–20 km2 surface area. An example of the evaluation form for smart water city assessment can be seen in Figure 2. These types of indicators determine the percentage or ratio of a certain value and its correlation to the recommended value from the established literature. This involves the use of numerical data or statistical analysis, focusing on the quantifiable measures to analyze the performance of the city.
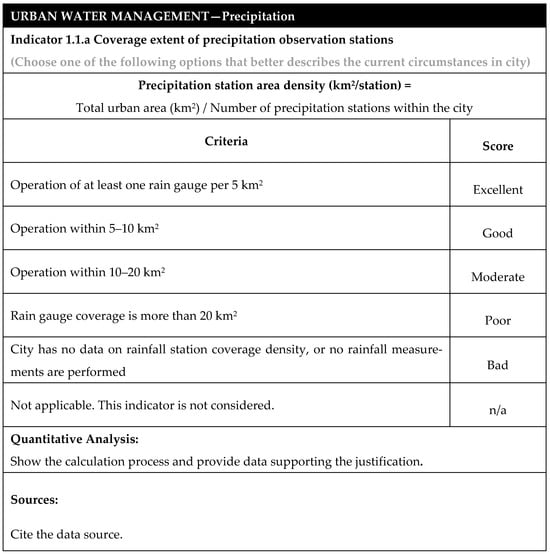
Figure 2.
Sample format of the developed quantitative assessment smart water city evaluation form.
For the qualitative indicators, however, a set of criteria is presented to assess the performance of the city based on the existence or establishment of certain elements, such as the application of particular technologies, implementation of specific systems, adherence to standards and more. These indicators are designed to interpret non-numerical data and categorical variables. The formulation of these guidelines is derived from recommendations provided by experts from various water sectors. An example of the developed evaluation form for the smart water city assessment under a qualitative approach can be seen in Figure 3. This approach seeks to comprehensively evaluate the aspects that may not be easily quantified, utilizing expert-derived criteria to assess the city’s performance in smart water management.
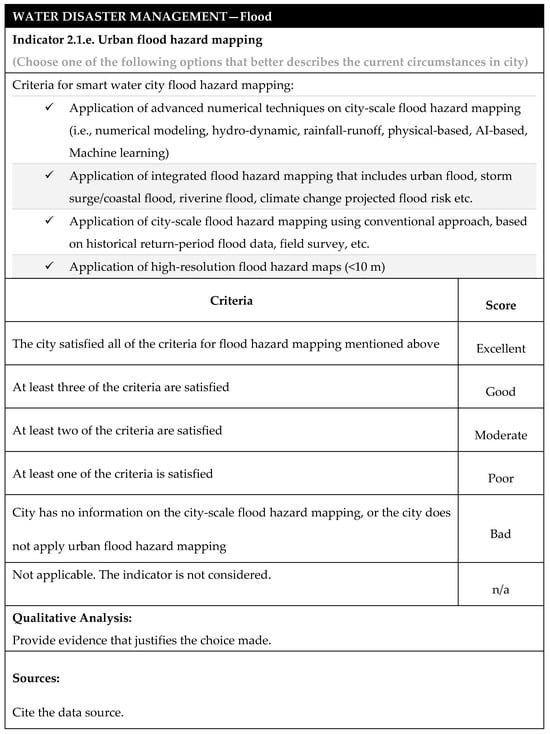
Figure 3.
Sample format of the developed qualitative assessment smart water city evaluation form.
A comprehensive set of 78 key performance indicator evaluation methods has been formulated to assess the efficiency of the city’s urban water management across various stages of the water system. For a complete version of the evaluation forms, kindly refer to the attached Supplementary Materials. Weighing values are assigned to each indicator, subcategory and category based on their significance in the urban water cycle. Finally, the final scores are presented, providing a clear depiction of the strengths and weaknesses in the city’s urban water management system. This assessment serves as a valuable tool for identifying potential improvements in the future.
3. SWC Pilot Testing
A pilot evaluation was undertaken to assess the feasibility of the new initiative on a smaller scale level, aimed at determining the city’s strengths, as well as the potential issues in their management of the urban water. The selection of the pilot city was conducted on the basis of (1) the relevance of the evaluation to identify the needs and challenges of the city, highlighting its goals and priorities, (2) the commitment of the local stakeholders to ensure the active participation in the evaluation and (3) the feasibility of implementing the assessment to the selected city, particularly considering the availability of the relevant data needed for the evaluation.
The smart water pilot city evaluations have been executed for a city, determining the applicability of the developed smart water city evaluation methodology. The pilot city assessments were conducted on the urban water management of Busan Eco Delta City, located in Busan Metropolitan City, Republic of Korea.
3.1. Busan Eco Delta City (Busan Metropolitan City), Korea
The smart water city technical evaluation is applied to Busan Eco Delta City (BEDC), located in Busan, Republic of Korea (Figure 4). BEDC is a new urban development in the western part of Busan, poised to accommodate approximately 76,000 residents. The new urban district has a total surface area of 11.8 km2, dedicated to prioritizing building for housing, commerce, logistics and research and development. BEDC is designed to underscore the efforts to create a new city that integrates blue and green spaces into various aspects of urban living. The city’s diverse building units serve as the testing ground for different water technologies, offering valuable insights in the practical application and adaptability of smart water technologies. The BEDC assessment can serve as a unique exploration of the smart water city evaluation, presenting an advanced benchmark aspiring to integrate cutting edge technologies into local water management.
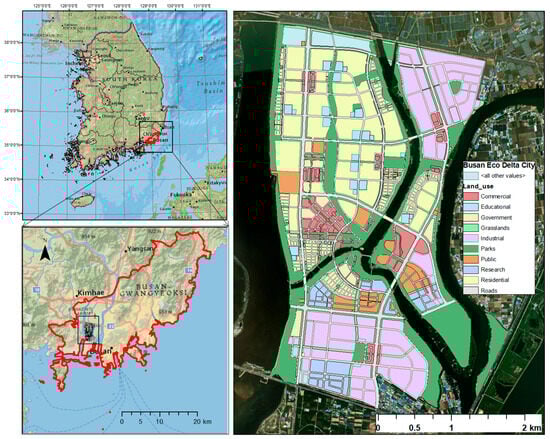
Figure 4.
Smart water city evaluation: Busan Eco Delta City, located in Busan Metropolitan City, South Korea.
The indicators for the technical aspect of the evaluation utilized information drawn from both BEDC and the city of Busan as a whole. Due to the fairly recent establishment of BEDC, some indicators may encounter insufficient information. Busan Metropolitan City has a total surface area of 770.9 km2, serving about 3.47 million inhabitants (2022). The metropolitan city is composed of mountainous and coastal areas, with its ports ranking among the busiest ports in the world. The Nakdong River, South Korea’s largest river, flows through the city, with its estuaries leading to the East China Sea, serving as the primary water source for 94% of the city’s population. Busan Eco Delta City is designated as Busan’s eco-friendly waterfront city, situated in the junction of the West Nakdong River, Pyeonggang Stream and Maekdo River.
The data used to for the evaluation of Busan Eco Delta City were gathered from either the surrounding districts of BEDC (Gangseo, Sasang and Buk Districts) or from the broader datasets of Busan Metropolitan City. In the Republic of Korea, the majority of the water information required for the smart water city evaluation is accessible online. A comprehensive list of agencies and their corresponding data source for each indicator is presented in Table 3.
Table 3.
Smart water city evaluation technical KPI data sources and access for BEDC and Busan Metropolitan City.
3.2. Evaluation
The smart water city evaluation is performed for Busan Eco Delta City (BEDC) in Busan, South Korea. Scores were assigned based on the evaluation of the water data gathered from both cities. The comprehensive evaluations of the pilot city are detailed as follows.
The smart water city evaluation for Busan Eco Delta City, as part of Busan Metropolitan City, is presented for each category in Figure 5, Figure 6 and Figure 7. The horizontal axis delineates the individual key technical key performance indicators, while the vertical axis illustrates the final scoring for each KPI. The graphical representations offer an overview of the city’s performance across various water management categories, showing its strengths and areas for improvements.
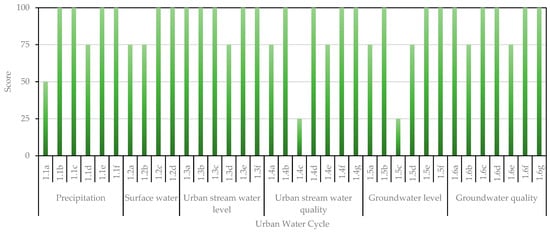
Figure 5.
Smart water city individual evaluation scores for Busan Eco Delta City (Busan Metropolitan City) under the urban water cycle category.
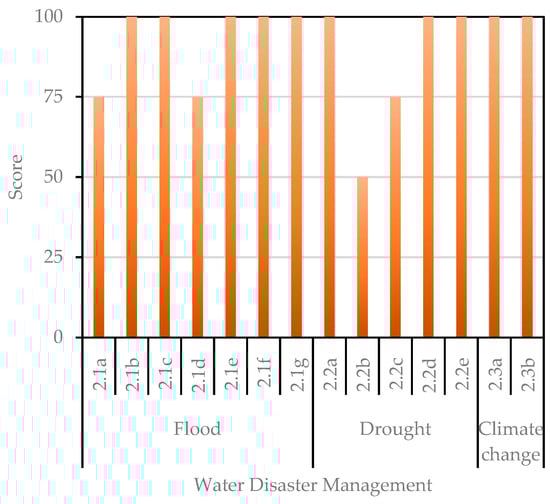
Figure 6.
Smart water city individual evaluation scores for Busan Eco Delta City (Busan Metropolitan City) under the water disaster management category.
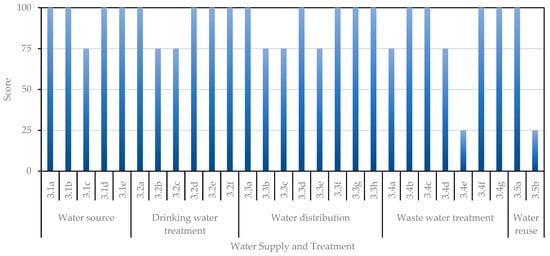
Figure 7.
Smart water city individual evaluation scores for Busan Eco Delta City (Busan Metropolitan City) under the water supply and treatment category.
Busan Eco Delta City excels in several smart water city indicators within the urban water cycle category, demonstrating the city’s strong commitment to efficient urban water data management. BEDC achieved a high score in the following: monitoring coverage; frequency; missing data percentage and data accessibility to key parameters such as rainfall, stream water level, stream water quality, groundwater level and groundwater level; the establishment of waterfront amenities; the application of LID and green infrastructures and water quality standards for stream and groundwater. This implies that the city exhibits smart water management in facilitating and monitoring the urban water data. The thorough spatial and temporal observation of the hydrological parameters, coupled with the application of ICT and green infrastructures and easy access to data, ensures a high level of awareness regarding the city’s urban hydrology. Notably, excellent scores in stream water and groundwater quality standards indicate minimal pollutants in water sources, signifying good overall urban water health. The prevalent use of nature-based solutions further underscores the city’s commitment to preserving water quality through natural means.
However, the evaluation highlights areas for improvement, particularly in addressing missing data, specifically for the stream water level and groundwater level. Mitigating missing hydrological data is crucial to avoiding biases in model simulations and ensuring accurate interpretations for future water level forecasts. Additionally, enhancing the number of rain gauge stations is recommended to monitor rainfall spatial distribution effectively, especially in densely populated areas. These improvements will further enhance the city’s smart water management capabilities and contribute to a more resilient urban water system.
The water disaster management in Busan Eco Delta City and, by extension, Busan Metropolitan City demonstrates effective preparation and mitigation strategies, evident from the full scores attained in various crucial aspects. These include the flood property index; flood risk area index; flood hazard mapping; integrated disaster information system; urban flood prediction and early warning; drought damage index; drought information and availability of emergency water supplies; drought prediction system and the implementation of city-scale climate adaptation planning, renewable energy usage and energy-saving strategies. These results underscore the city’s exceptional performance in predicting and mitigating localized flood events through the application of modern technologies. Smart water management practices are evident in the utilization of advanced technologies for flood hazard mapping, an integrated water disaster information system, city-scale flood and drought forecasting and flood early warning systems. The city’s proactive climate preparatory strategies, encompassing climate change actions, adaptation measures and a focus on alternative renewable energy sources, contribute to maintaining low risks in flood damage and flood-susceptible areas. These efforts serve as significant indicators of effective smart water management.
Despite these achievements, the analysis highlights the city’s vulnerability to climate risk events, particularly drought events and flood-related casualties recorded in recent years. While the city performs well in many water disaster management indicators, some deficiencies are noted. These include a relatively low percentage of completed flood preventive structures and a need for an enhanced usage of advanced drought forecasting and impact assessment in drought hazard mapping. The construction of levees and dams proves instrumental in reducing the risk to urban residents during flood events, while modern procedures for drought hazard development ensure the accuracy and efficiency of drought prediction. Addressing these deficiencies will further strengthen the city’s resilience to water-related disasters and enhance the overall efficacy of its smart water management practices.
Lastly, the city managed to obtain exceptional points in the water supply and treatment management, particularly in key areas such as monitoring the frequency of water sources and wastewater, application of ICT-based technologies in data collection, availability of consumable water, capacity of water treatment plants, compliance with safe drinking water standards, service coverage of water supply distribution, accessibility to water-related data, application of advanced technologies in water treatment, maintenance of pipelines, installation of smart meters, acceptable quantity of aged pipelines and a high percentage of treated wastewater being recycled. These outcomes underscore the city’s embodiment of smart water city characteristics in effectively managing the water supply, drinking water treatment and wastewater treatment. The concerted efforts of responsible agencies in facilitating the water supply contribute to the safety of drinking water and the reliability of facility services, ensuring efficient water distribution and minimizing non-revenue water, a critical factor in water conservation. However, relatively lower scores are obtained in the application of a separated sewage network and recycling of wastewater sludge materials. The implementation of a separated storm and sewage system ensures the consistency of stormwater flow during flood events, while the application of biowaste recycling helps in the reduction of wastewater byproducts that can affect the health of the ecosystem if not disposed of properly.
However, there are relatively lower scores in the application of a separated sewage network and recycling of wastewater sludge materials. Implementing a separated storm and sewage system is crucial for managing the stormwater flow during flood events and the application of biowaste recycling aids in reducing the environmental impact of wastewater byproducts. Addressing these aspects will further enhance the city’s overall water treatment and conservation efforts, contributing to a more comprehensive and sustainable smart water management system.
3.3. Overall Pilot Testing Assessment
An overall evaluation for BEDC is detailed in Figure 8. By examining each of the key performance indicators under sustainability and smartness, insights can be gathered on the effectiveness and efficiency of the pilot cities’ water management practices, contributing to a broader understanding of their capabilities in the application of advanced technologies for sustainable and resilient urban water management systems.
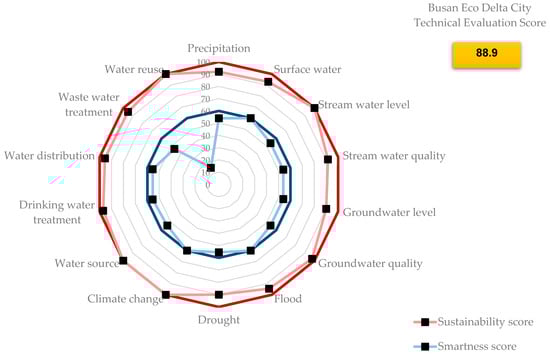
Figure 8.
Smart water city overall assessment for BEDC Busan Metropolitan City.
In terms of sustainability, Busan Eco Delta City excelled in the stream water level, climate change, water source and wastewater reuse indicators. The city demonstrated effective sustainable management by maintaining a high level of proficiency in monitoring the stream water levels through well-distributed water level stations, ensuring minimal error data, and recording frequencies. Additionally, its proactive approach to climate change actions, robust adaptation strategies, the meticulous monitoring of primary water sources and efficient recycling of treated wastewater underscored the city’s commitment to sustainable water practices. Under the smartness category, the city achieved full scores in the surface water, flood, and climate change indicators. This success is attributed to Busan Eco Delta City’s implementation of low-impact development and green infrastructures, facilitating a natural urban hydrological flow. The city’s utilization of advanced flood hazard mapping, an integrated disaster information center and urban flood forecasting and early warning systems during flood events showcased its advanced technological measures. Furthermore, the city’s endeavors to maximize renewable energy usage and employ energy-saving strategies underscore its qualification as a smart water city.
3.4. Alignment with Previous Standards
The smart water city assessment applied to Busan Eco Delta City and Busan Metropolitan City involved an analysis of the water-related aspects using the established frameworks for smart cities. These frameworks were selected for their alignment with the key themes that they examine, such as sustainability, resilience, and smartness, as well as their relevance at the local level. Particular recurring indicators include surface and groundwater quality (GCF); green space (CITYKeys, LEED and Arcadis); stormwater management (LEED); flood vulnerability status (LEED, Arcadis and GCF); climate resilience (ISO 37120, OECD, CITYKeys and GCF); the application of renewable energies (LEED); accessibility to a water supply (U4SSC, ISO 37120, LEEDS and Arcadis); water loss in the water distribution system (U4SSC, ISO 37120, CITYKeys, Arcadis and GCF); accessibility to wastewater collection services (U4SSC, ISO 37120 and LEED); compliance of the drinking water and wastewater treatment quality (ISO 37120, LEED, Arcadis and GCF); implementation of smart water meters (U4SSC, ISO 37122, OECD, LEED and Arcadis); utilization of ICT-based technologies in the monitoring of water distribution systems (U4SSC, ISO 37120 and OECD); number of water quality monitoring systems (ISO 37122); application of advanced wastewater treatment (U4SSC); recycling of wastewater and biosolids (ISO 37122, CITYKeys, Arcadis and GCF); sewage pipe monitoring using ICT (ISO 37122 and GCF) and alternative water source and water sufficiency (ISO 37123, Arcadis and GCF).
The remaining KPIs were supplemented through an extensive literature review of individual indicators, an examination of the average performance of progressive cities and surveys based on experts’ opinions. The availability of the water data was confirmed, and the computational analysis was applied for the pilot city. In conclusion, all 78 developed KPIs were assessed either quantitatively or qualitatively, following sets of standards from established references.
4. Conclusions and Recommendations
The evaluation of smart water cities underscores the crucial role of advanced technologies in the efficient management of urban water, hereby enhancing sustainability and improving the quality of life of residents. The primary objective of this research is to develop measurements and evaluation tools for SWC key performance indicators, focusing on innovative water technologies to establish unified global standards and certification schemes.
The indicators are categorized into three stages: the urban water cycle, water disaster management and water supply and treatment. These categories aim to assess the effective use of technologies in ensuring a sufficient water supply, monitoring the water quality, enhancing disaster resilience, and maintaining the overall urban water system. The developed evaluation methods and measurement tools are applied to evaluate the urban water management practices of Busan Eco Delta City in Busan, South Korea. The established evaluation processes serve as guideline basis for smart water city certification, offering a framework for analyzing future smart water cities. The evaluation would identify the city’s good water practices and, at the same time, pinpoint the areas of water management that need further improvements.
Based on the overall evaluation, the technical assessment of Busan Eco Delta City highlights the application of smart water city technologies and strategies in the management of its urban water. Smart water cities leverage the usage of advanced technologies and smart water management techniques to optimize urban water management, ensuring consistent monitoring, efficient water usage and the health of the population and the environment. Further improvements can be suggested in the following areas: Minimizing erroneous or missing data specially on the stream water quality and groundwater level observations necessitates a commitment to consistent instrument calibrations and data quality control implementations. To enhance urban water management practices, it is recommended to prioritize the installation of separated stormwater and sewage water pipe networks. This approach mitigates floodwater contamination by segregating sanitary wastewater and stormwater runoff. Furthermore, efforts should be directed towards expanding the utilization of recycled sludge materials. This can include their application as fertilizers in agriculture and as materials in cement production for construction purposes. Such measures contribute to sustainable waste management practices and resource conservation. Lastly, it is advisable to install more rainfall monitoring stations within the city to ensure the accurate recording of rainfall distribution that is critical for city-scale weather forecasting and flood early warnings. This step ensures comprehensive coverage and reliable recording of rainfall distribution, enhancing the overall resilience of urban water management systems.
The developed smart water city evaluation scheme not only emphasizes the utilization of smart water technologies in enhancing the overall urban water management but also accentuates the sustainable practices adopted by cities to safeguard the safety and improve the quality of life of the residents. Parameters such as the recommended number of the monitoring stations, recording intervals, acceptable levels of missing data, compliance to quality standards, application of flood hazard mapping tools, access to water information and implementation of recycling and reuse strategies serve as crucial measurement tools to improve sustainability, particularly for climate-vulnerable, lesser-developed cities. However, while this study evaluates the technical capacities of cities to maintain urban water sustainability, a comprehensive evaluation of water governance is also imperative. Water governance pertains to the economic, political, and administrative systems set in place by the city government to manage the urban water resources and effectively implement its policies. An assessment of the technical, as well as governance, aspects of smart water cities can provide valuable insights to serve as models for efficient management of the urban water system.
As a next step, we are aiming to further develop and refine the scoring and measuring tools to evaluate average cities in developing countries. This evaluation would examine the current practices, for both the technical and governance aspects, adopted by average cities, highlighting the smart innovations tailored to their specific urban water issues and addressing the limitations in their urban water management practices. By performing smart water city evaluations, improvements can be made towards facilitating more effective management while simultaneously sharing novel approaches implemented by smart water cities worldwide, contributing to the improvement of urban water cities in the future.
Supplementary Materials
The following supporting information can be downloaded at https://www.mdpi.com/article/10.3390/w16050741/s1, 2024_SWC_Supplementary_document.
Author Contributions
Conceptualization, L.D., J.L. and S.J. (Suhyung Jang); methodology, analysis, L.D. and J.L.; resources, S.J. (Suhyung Jang); writing—original draft preparation, L.D.; writing—review and editing, J.L., S.J. (Sungphil Jang) and S.J. (Sungphil Jang); supervision, project administration and funding acquisition; J.L., S.J. (Sungphil Jang) and S.J. (Suhyung Jang). All authors have read and agreed to the published version of the manuscript.
Funding
This research was supported by the Korea Water Resources Corporation, Grant Number G220614.
Data Availability Statement
Data are contained within the article and supplementary materials. Further inquiries can be directed to the corresponding author.
Conflicts of Interest
The authors declare no conflicts of interest.
References
- Lawrence, A.; Ellis, J.; Marsalek, J.; Urbonas, B.; Phillips, B. Total urban water cycle-based management. In Proceedings of the International Conference on Urban Storm Drainage, Sydney, NSW, Australia, 30 August–3 September 1999; pp. 1142–1149. [Google Scholar]
- Marsalek, J.; Jimenez-Cisneros, B.; Malmquist, P.-A.; Karamouz, M.; Goldenfum, J.; Chocat, B. Urban Water Cycle Processes and Interactions; International Hydrological Program (IHP); United Nations Educational, Scientific and Cultural Organization (UNESCO): Paris, France, 2006. [Google Scholar]
- Oberascher, M.; Rauch, W.; Sitzenfrei, R. Towards a smart water city: A comprehensive review of applications, data requirements, and communication technologies for integrated management. Sustain. Cities Soc. 2022, 76, 103442. [Google Scholar] [CrossRef]
- U4SSC. 2023. Available online: https://u4ssc.itu.int (accessed on 28 August 2023).
- ISO 37120; ISO 37120: 2018(en) Sustainable Cities and Communities—Indicators for City Services and Quality of Life. ISO: Geneva, Switzerland, 2018. Available online: https://iso.org/obp/ui (accessed on 28 August 2023).
- OECD. Organization for Economic Co-Operation. 3 December 2020. Available online: https://oecd.org/cfe/cities/Smart-cities-measurement-framework-scoping.pdf (accessed on 28 August 2023).
- Huovila, A.; Airaksinen, M.; Pinto-Seppa, I.; Piira, K.; Bosch, P.; Penttinen, T.; Neumann, H.-M.; Kontinakis, N. CITYKeys Smart City Performance Measurement System. Int. J. Hous. Sci. Its Appl. 2017, 41, 113–125. [Google Scholar]
- USGBC. LEED for Cities and Communities. US Green Building Council. 2023. Available online: https://usgbc.org/leed/rating-systems/leed-for-cities-communities (accessed on 19 July 2023).
- Arcadis. Citizen Centric Cities: The Sustainable Citied Index 2018; Arcadis: Amsterdam, The Netherlands, 2018. [Google Scholar]
- KWR. City Blueprint; KWR Water Research Institute: Nieuwegein, The Netherlands, 2023; Available online: https://kwrwater.nl/en/tools-producten/city-blueprint/ (accessed on 19 July 2023).
- AWS. The AWS International Water Stewardship Standard. Alliance for Water Stewardship. 2022. Available online: https://a4ws.org/the-aws-standard-2-0/ (accessed on 19 July 2023).
- International Water Resources Association. Smart Water Cities Phase 1: Identifying Smart Water Cities Report; IWRA; Kwater; AWC: Paris, France, 2021; Available online: https://iwra.org/wp-content/uploads/2022/03/Rapport-complet-web-ok-2.pdf (accessed on 28 August 2023).
- Ranta, E.; Vidal-Abarca, M.R.; Calapez, A.R.; Feio, M.J. Urban stream assessment system (UsAs): An integrative tool to assess biodiversity, ecosystem functions and service. Ecol. Indic. 2021, 121, 106980. [Google Scholar] [CrossRef]
- World Meteorological Organization. Guide to Hydrological Practices; WMO-No. 168; WMO: Geneva, Switzerland, 2020; Volume 1. [Google Scholar]
- Christiano, E.; Velfhuis, M.; Van de Geissen, N. Spatial and temporal variability of rainfall and their effects on hydrological response un urban areas—A review. Hydrol. Earth Syst. Sci. 2017, 21, 3859–3878. [Google Scholar] [CrossRef]
- Ocampo-Marulanda, C.; Ceron, W.; Avila-Diaz, A.; Canchala, T.; Alonzo-Morales, W.; Kayano, M.; Torres, R. Missing data estimation in extreme rainfall indices for the Metropolitan area of Cali-Colombia: An approach based on artificial neural networks. Data Brief 2021, 39, 107592. [Google Scholar] [CrossRef] [PubMed]
- Maswanganye, S. A Comparison of Remotely-Sensed Precipitation Estimates with Observed Data Form Rain Gauges in the Western Cape, South Africa; University of Cape Town: Cape Town, South Africa, 2018. [Google Scholar]
- Liu, Z.; He, C.; Zhou, Y.; Wu, J. How much of the world’s land has been urbanized, really? Hierarchical framework for avoiding confusion. Land Ecol. 2014, 29, 5. [Google Scholar] [CrossRef]
- European Environmental Agency. Percentage of Total Green Infrastructures, Urban Green Spaces, and Urban Tree Cover in the Area of EEA-Capital Cities. 2022. Available online: https://eea.europa.eu (accessed on 5 September 2022).
- Liu, Y.; Wang, H.; Feng, W.; Huang, H. Short term real-time rollong forecast of urban river water levels on LSTM: A case study in Fuzhou City, China. Int. J. Environ. Res. Public Health 2021, 18, 9287. [Google Scholar] [CrossRef] [PubMed]
- Tencaliec, P.; Favre, A.; Prieur, C.; Mathevet, T. Reconstruction of missing daily streamflow data using dynamic regression models. Water Resour. Res. 2015, 51, 9447–9463. [Google Scholar] [CrossRef]
- Mfwango, L.; Salim, C.; Kazumba, S. Estimation of missing river flow data for hydrological analysis: The case of Great Ruaha river catchment. Hydrol. Curr. Res. 2018, 9, 2. [Google Scholar] [CrossRef]
- YSI Incorporated. YSI Parameter Series: Water Level Measurement. 19 September 2022. Available online: https://ysi.com/parameter/level (accessed on 26 June 2023).
- Corragio, E.; Han, D.; Gronow, C.; Tryfonas, T. Water quality sampling frequency analysis of surface fresh water: A case study on Bristom. Front. Sustain. Cities 2022, 3. [Google Scholar] [CrossRef]
- Environmental Protection Agency. Preliminary Data Summary of Urban Storm Water Best Management Practices; US EPA: Washington, DC, USA, 1999.
- Kwater. Development of KPIs for Level Evaluation of Water Resource Management; Korea Water Resources Corporation: Daejeon, Republic of Korea, 2017. [Google Scholar]
- International Groundwater Resource Assessment Centre. Guidelines on: Groundwater Monitoring for General Reference Purposes; IGRAC: Utrecht, The Netherlands, 2008. [Google Scholar]
- Barcelona, M.; Wehrmann, H.; Schock, M.; Sievers, M.; Karny, J. Sampling Frequency for Groundwater Quality Monitoring; US EPA: Washington, DC, USA, 2002.
- Zhu, S.; Dai, Q.; Zhao, B.; Shao, J. Assessment of population exposure to urban flood at building scale. Water 2020, 12, 3253. [Google Scholar] [CrossRef]
- Park, J.; Kim, K.; Lee, W. Recent advances in information and communications technology (ICT) and sensor technology for monitoring water quality. Water 2020, 12, 510. [Google Scholar] [CrossRef]
- Seoul Metropolitan Government. Seoul Tap Water Arisu; Seoul Solutions: Seoul, Republic of Korea, 2022.
- University of California. What Are the Advanced Water Treatment Processes? University of California: Auckland, CA, USA, 2022; Available online: https://engineeringonline.ucr.edu (accessed on 8 August 2022).
- Seoul Metropolitan Government. Water Distribution: Old Pipe Network Maintenance Project. 2017. Available online: https://seoulsolution.kr (accessed on 21 September 2022).
- Klepka, A.; Broda, D.; Michalik, J.; Kubat, M.; Malka, P.; Staszewski, W.; Stepinski, T. Leakage detection in pipelines—The concept of smart water supply system. In Proceedings of the 7th ECOMAS Thematic Conference on Smart Structure and Materials, Ponta Delgada, Azores, 3–6 June 2015. [Google Scholar]
- Organization for Economic Co-operation and Development. Wastewater Treatment (% Population Connected); OECD: Paris, France, 2022; Available online: https://stats.oecd.org (accessed on 25 August 2022).
- Song, S.; Sheng, S.; Xu, J.; Zhao, D. What is the suitable frequency for water quality monitoring in full-scale constructed wetland treating tail water? Water 2022, 14. [Google Scholar] [CrossRef]
- Water Corporation. How Wastewater Is Treated; Water Corporation: Perth, WA, Australia, 2023. Available online: https://watercorporation.au (accessed on 20 December 2023).
- Yeo, U.; Oh, D.; Kim, K.; Park, S.; Lee, Y. A Study on Enhancing Reponse to Climate Change Using Spatial Analysis of Green Infrastructure; Busan Development Institute: Busan, Republic of Korea, 2021. [Google Scholar]
- Lee, J.; Kim, J. Assessing Strategies for Urban Climate Change Adaptation: The Case of Six Metropolitan Cities in South Korea. Sustainability 2018, 10, 2065. [Google Scholar] [CrossRef]
- Baek, S.; Park, E.; Kim, M.; Kwon, S.; Kim, J.; Ohm, J.; del Pabil, A. Optimal renewable power generation systems for Busan metropolitan city in South Korea. Renew. Energy 2016, 88, 517–525. [Google Scholar] [CrossRef]
Disclaimer/Publisher’s Note: The statements, opinions and data contained in all publications are solely those of the individual author(s) and contributor(s) and not of MDPI and/or the editor(s). MDPI and/or the editor(s) disclaim responsibility for any injury to people or property resulting from any ideas, methods, instructions or products referred to in the content. |
© 2024 by the authors. Licensee MDPI, Basel, Switzerland. This article is an open access article distributed under the terms and conditions of the Creative Commons Attribution (CC BY) license (https://creativecommons.org/licenses/by/4.0/).