Article

Integrated Constructed Wetland–Microbial Fuel Cell Systems Using Activated Carbon: Structure-Activity Relationship of Activated Carbon, Removal Performance of Organics and Nitrogen

Key Laboratory of Clean Energy Utilization and Pollutant Control in Tianjin, School of Energy and Environmental Engineering, Hebei University of Technology, Tianjin 300401, China
*
Authors to whom correspondence should be addressed.
Water 2024, 16(2), 278; https://doi.org/10.3390/w16020278
Submission received: 14 December 2023 / Revised: 6 January 2024 / Accepted: 9 January 2024 / Published: 12 January 2024
(This article belongs to the Special Issue Green and Low Carbon Development of Water Treatment Technology)

Abstract

:
This study designed integrated constructed wetland–microbial fuel cell (CW–MFC) systems using activated carbon (AC) as both CW substrates and MFC anodes and investigated the structure-activity relationship of six kinds of commercial columnar AC, as well as the organics and nitrogen removal, microbial activity and diversity of CW–MFCs. Results showed that the nitrogen adsorption by AC tended to be a linear process in which physical adsorption played a leading role and micropores made great contributions. A higher specific surface area, developed mesopores, and oxygen functionalities were conducive to the capacitance properties of AC, while a higher specific surface area and developed micropores were conducive to reduce material resistance and improve ion permeability. Coconut-shell-based AC had both excellent nitrogen adsorption capacity and electrochemical properties, making it ideal as both CW substrates and MFC anodes for CW–MFCs. The electricity generation, coulombic efficiency, internal resistance, and organics and nitrogen removal of CW–MFCs were positively correlated with the total depth of AC anodes. The total depth of AC anodes can be determined based on the influent organics/nitrogen loadings and organics/nitrogen removal load of AC, and a relatively smaller depth of a single AC anode (5 cm) was recommended. The MFC effectively improved the enzymatic activity (by 10.33% dehydrogenase, 8.72% catalase, and 7.35% ammonia monooxygenase), nitrification/denitrification intensity (by 9.53%/6.68%), and microbial diversity (by 1.64–4.07%) of AC (MFC anodes) in CW–MFCs, while the depth of a single AC anode barely influenced the microbial activity and diversity. MFCs increased COD and NH3-N removal in CW–MFCs by 11.60% and 3.4%, respectively. The increased total adsorption capacity of AC with the increase of its total depth narrowed the difference in COD removal resulting from the promotion of MFCs on organics degradation. MFCs increased TN removal in CW–MFCs by 5.29% through promoting denitrification in cathodes and enhancing NH3-N assimilation in anodes. The phyla of EAB (Proteobacteria, Bacteroidetes, Firmicutes, and Acidobacteria) and genera of EAB (Citrobacter, Geobacter, and Pseudomonas) accounted for 85–86% and 15.58–16.64% of the microbial community on AC anodes in CW–MFCs, respectively.

1. Introduction

The constructed wetland coupled microbial fuel cell systems (CW–MFCs) have gained enormous academic interests owing to their ability to perform concurrent wastewater treatment and electricity generation. A typical CW–MFC system generally uses vertical up-flow CWs, and MFC anodes are placed at the anaerobic region formed near the bottom of CWs, while MFC cathodes are placed at the aerobic region formed near the plant roots or the CW substrates’ surface [1,2]. This arrangement can guarantee the redox gradient required for MFC operations. MFCs use electrochemically active bacteria (EAB) as biocatalysts to oxidize organic substances and generate electricity. EABs could efficiently rewire the reductive equivalence derived from the cellular metabolism to different reductase with sophisticated electron transfer pathways [3,4,5]. Therefore, MFCs are capable of promoting the degradation of bio-refractory organics in CWs [2,6]. Moreover, the bacteria on MFC cathodes can use the electrons produced by EAB to reduce nitrite ( N O 2 -N) and nitrate ( N O 3 -N) to N2, and thus enhancing the nitrogen removal in CW–MFCs [7,8]. Because electrode materials (e.g., carbon fiber, graphite, stainless steel, activated carbon) are relatively expensive, the construction cost of CW–MFCs are around 1.5 times higher than that of conventional CWs [9]. However, MFCs implemented in CWs would improve CWs’ treatment efficiency and reduce their surface area requirements, reduce clogging and its derived operation and maintenance costs, and reduce greenhouse gas emissions [2,6,9]. Taking all factors into consideration, CW–MFCs would be competitive with conventional CWs. The current CW–MFC system is in the pilot-scale and lab-scale stages, and the main challenges involve improving power densities and collecting and utilizing the generated electricity in full-scale CW–MFCs [6].
In an MFC reactor, only part of the organic matter consumed by microorganisms is converted into electricity by EAB, and coulombic efficiency is generally used to indicate the conversion efficiency, that is, the ratio of the actual electricity production to the theoretical electricity production of organics in an MFC [5]. Due to the limitations in operating conditions and the redox capacity of the EABs themselves, the power density of MFC reactors reported in previous studies is relatively low (0.2–200 W/m3), which is still far away from the large-scale practical application of MFCs (at least 1 kW/m3) [5,10,11]. Currently, the most mature applications of MFCs are sediment MFCs, which can provide the energy for sensors for detecting water quality, water temperature, flow rate, etc. [5,12]. The main mechanism of electricity production in CW–MFCs was by the direct transfer of electrons to the anodes by the EAB attached to the anodes [13]. Therefore, the promotion of MFCs on the anaerobic degradation of organic matter in CWs occurred only on/near the surface of MFC anodes. In the current research on CW–MFCs, generally, a very limited number of MFC electrodes were dispersedly placed in the CW substrates, and only a very small amount of organic matter can transfer to the surface of MFC anodes and then be utilized by EAB. Additionally, the relatively large volume of CW–MFC reactors (in liters) and the power density and coulombic efficiency of CW–MFCs are much lower than those of pure MFC reactors (in centimeters). Hence, it is of great importance to increase the proportion of the volume of MFC anodes to the effective volume of CW–MFC so as to expand the influence range of MFCs on the organics degradation and denitrification in CWs.
Activated carbon (AC) is prepared from carbon-rich organic materials, such as coal, asphalt, sludge, agricultural and forestry wastes (wood, fruit shells, corn cobs, and plant straw), etc. AC has the characteristics of high porosity, a large specific surface area, a high adsorption capacity, good mechanical strength, stable chemical properties, light weight, and easy availability. Therefore, AC is widely used in the treatment of wastewater and exhaust gas. AC is also widely used as an electrode material for MFCs and energy storage owing to its qualification of high conductivity [14]. Based on the above information, this present study intended to design integrated CW–MFC systems using granular AC as both CW substrates and MFC anodes, so as to further enhance the removal of organics and nitrogen in CW–MFCs. However, AC prepared by different precursors has different adsorption capacity and conductivity. Coal and fruit-shell-based AC are the most widely used industrial adsorbents because of their large reserves and wide sources of precursors. In order to improve the practical applicability of CW–MFCs, this study selected six kinds of commercial columnar AC with mature application scales, including coal-based AC (C-AC), coconut-shell-based AC (CS-AC), walnut-shell-based AC (WS-AC), peach-shell-based AC (PS-AC), jujube-shell-based AC (JS-AC), and apricot-shell-based AC (AS-AC). The specific objectives of the present study were to (1) screen out the commercial AC that has both excellent nitrogen adsorption capacity and electrochemical properties and analyze the structure-activity relationship of AC between its physicochemical properties and nitrogen adsorption capacity as well as electrochemical properties, and (2) build integrated CW–MFC systems using the screened-out granular AC as both CW substrates and MFC anodes and investigate the electricity generation, organics and nitrogen removal, microbial activity, and diversity of CW–MFCs. This study might be of technical significance for further promoting the application of CWs-coupled microbial electrochemical technology in the field of wastewater treatment.

2. Materials and Methods

2.1. Screening of Activated Carbon

All AC samples had a diameter of 4 mm and an iodine value between 800 and 1000 mg/g (provided by the Zhengzhou Tianchen Purification Material Co., Ltd., Zhengzhou, China).

2.1.1. Determination of the Physical and Chemical Properties of Activated Carbon

The morphology of the AC samples was analyzed by a scanning electron microscope (SEM, Sigma 300, Zeiss, provided by Carl Zeiss AG, Oberkochen, Germany). The surface functional groups of AC were characterized by a Fourier transform infrared spectrometer (FTIR, Nicolet6700, Thermo Scientific, provided by Thermo Fisher Scientific, Waltham, MA, USA). A surface area and porosity size analyzer (ASAP2460, provided by Micromeritics Instrument Ltd., Norcross, GA, USA) was used to characterize the Brunauer–Emmett–Teller (BET) specific surface area, pore volume, and average pore diameter of AC.

2.1.2. Experiment on the Nitrogen Adsorption of Activated Carbon

In the adsorption isotherm experiment, 2 g of AC of each type was added to 30 mL of NH4Cl solution, and the initial concentration of N H 4 + -N was 100 mg/L, 200 mg/L, 400 mg/L, 600 mg/L, and 800 mg/L. The solution pH was maintained at 7.0 using HCl and NaOH. The above solution mixture was shaken at 25 °C, 200 r/min for 24 h in a constant-temperature air oscillator, and then solution samples were taken and analyzed.
In the adsorption kinetics experiment, 2 g of AC of each type was added to 30 mL of 600 mg/L NH4Cl. The solution pH was maintained at 7.0 using HCl and NaOH. The above solution mixture was shaken at 25 °C, 200 r/min in a constant-temperature air oscillator, and 2 mL of the solution was sampled after 10 min, 30 min, 60 min, 120 min, 240 min, and 360 min.
The collected solution sample was filtered through a 0.45-μm cellulose membrane, and the filtrate was immediately analyzed for ammonia nitrogen (NH3-N) using Nessler’s reagent spectrophotometry method. Three repeat experiments were performed for each initial concentration condition. All of the chemicals were of analytical grade (provided by Tianjin Bohua Chemical Reagent Co., Ltd., Tianjin, China).
The nitrogen adsorption capacity of AC at time t and saturation was calculated as follows:
Q t = ( C 0 C t ) × V m
Q e = ( C 0 C e ) × V m
where Qt and Qe are the nitrogen adsorption capacity of AC (mg N/g) at time t and saturation, respectively; Ct and Ce are the NH3-N concentration (mg/L) in solution when the adsorption reaches time t and saturation, respectively; C0 is the initial NH3-N concentration (mg/L); V is the volume of NH3-N solution (L); and m is the mass of AC (g).
The nitrogen adsorption isotherms were fitted to Langmuir (Equation (3)) and Freundlich (Equation (4)) isotherm models [15] as follows:
Q e = K L × Q m × C e 1 + K L × C e
Q e = K F × C e 1 n
where Qe is the nitrogen saturation adsorption capacity of AC (mg N/g); Qm is the maximum equilibrium adsorption capacity (mg N/g); Ce is the NH3-N concentration in the solution when the adsorption reaches saturation (mg/L); KL is the Langmuir model constant (L/mg); and KF (mg1−1/n·L1/n·g−1) and n are Freundlich model constants.
The adsorption kinetics of AC were described by pseudo-first order model (Equation (5)), pseudo-second order model (Equation (6)), and intraparticle diffusion model (Equation (7)) [16], as follows:
Q t = Q e × [ 1 exp ( K 1 × t ) ]
Q t = K 2 × Q e 2 × t 1 + Q e × K 2 × t
Q t = K × t 0.5 + C
where Qt and Qe are the nitrogen adsorption capacity of AC (mg N/g) at time t and saturation, respectively; t is the adsorption time (min); K1 (min−1) is the parameter of pseudo first order model; K2 (g·mg−1·min−1) is the parameter of pseudo second order model; K is the diffusion rate constant within the particle (mg·g−1·min−0.5); and C is an empirical constant that is related to the thickness of the boundary layer. The greater the boundary layer effect, the larger the C value is.

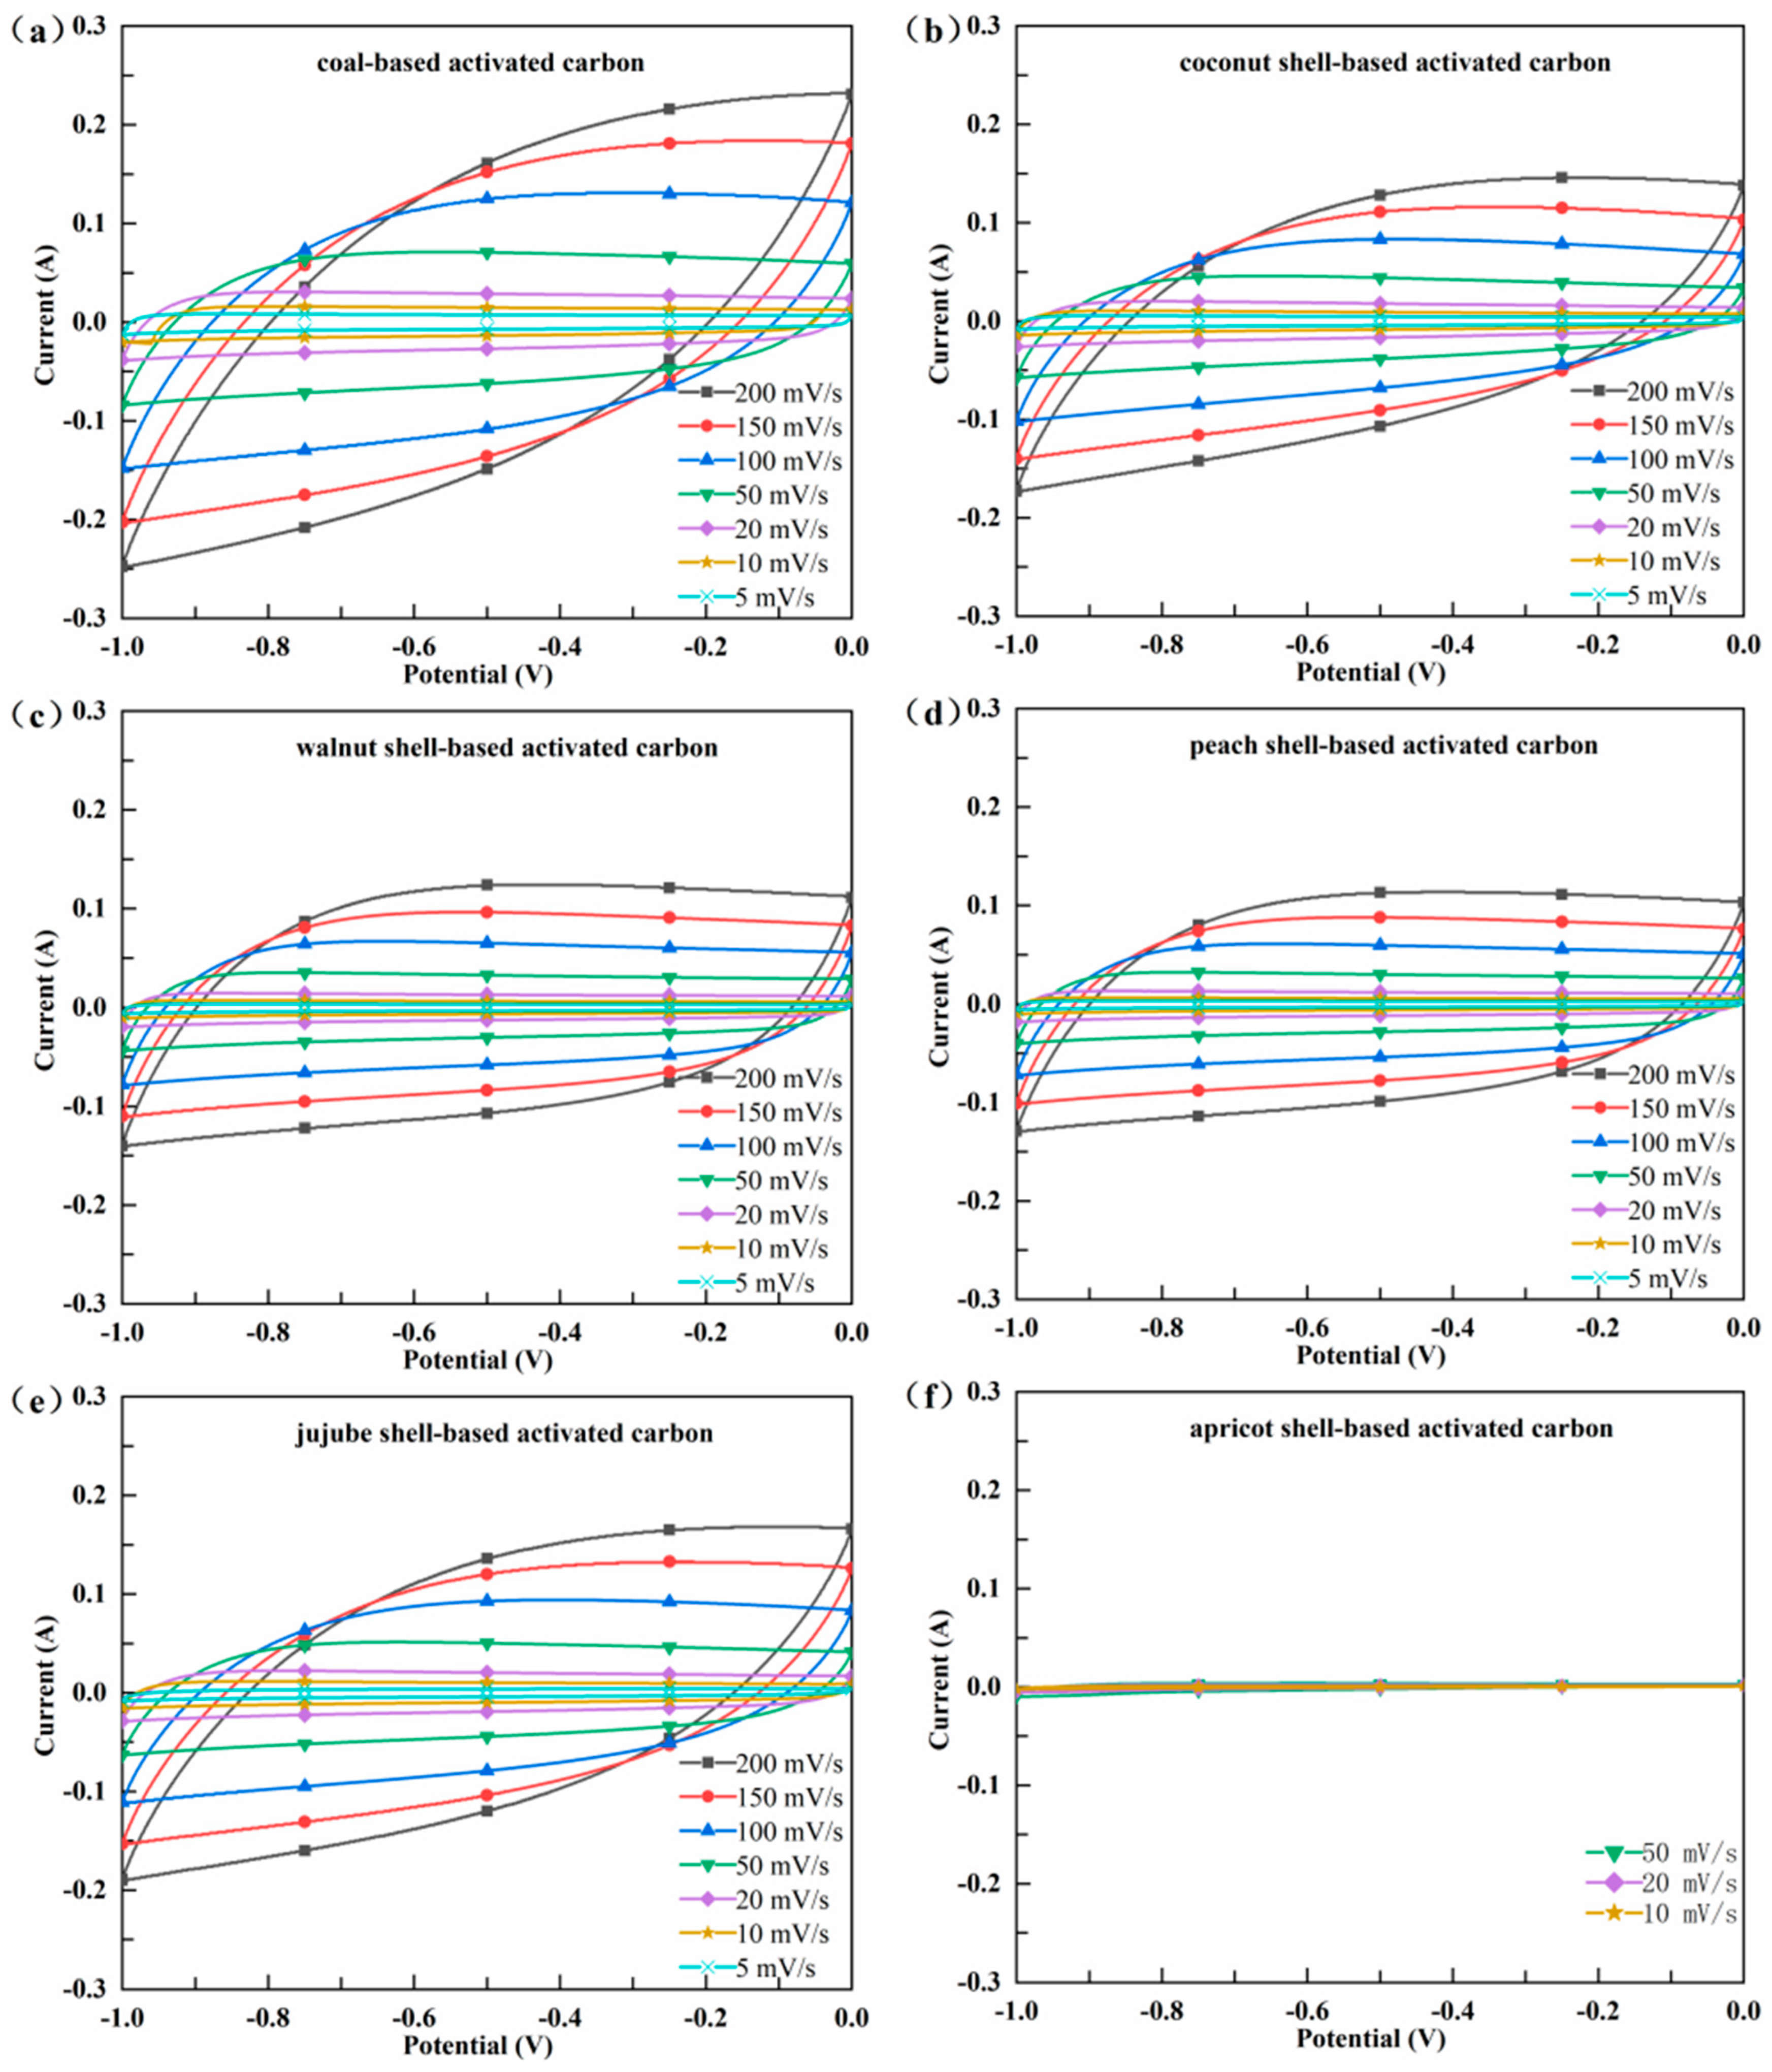
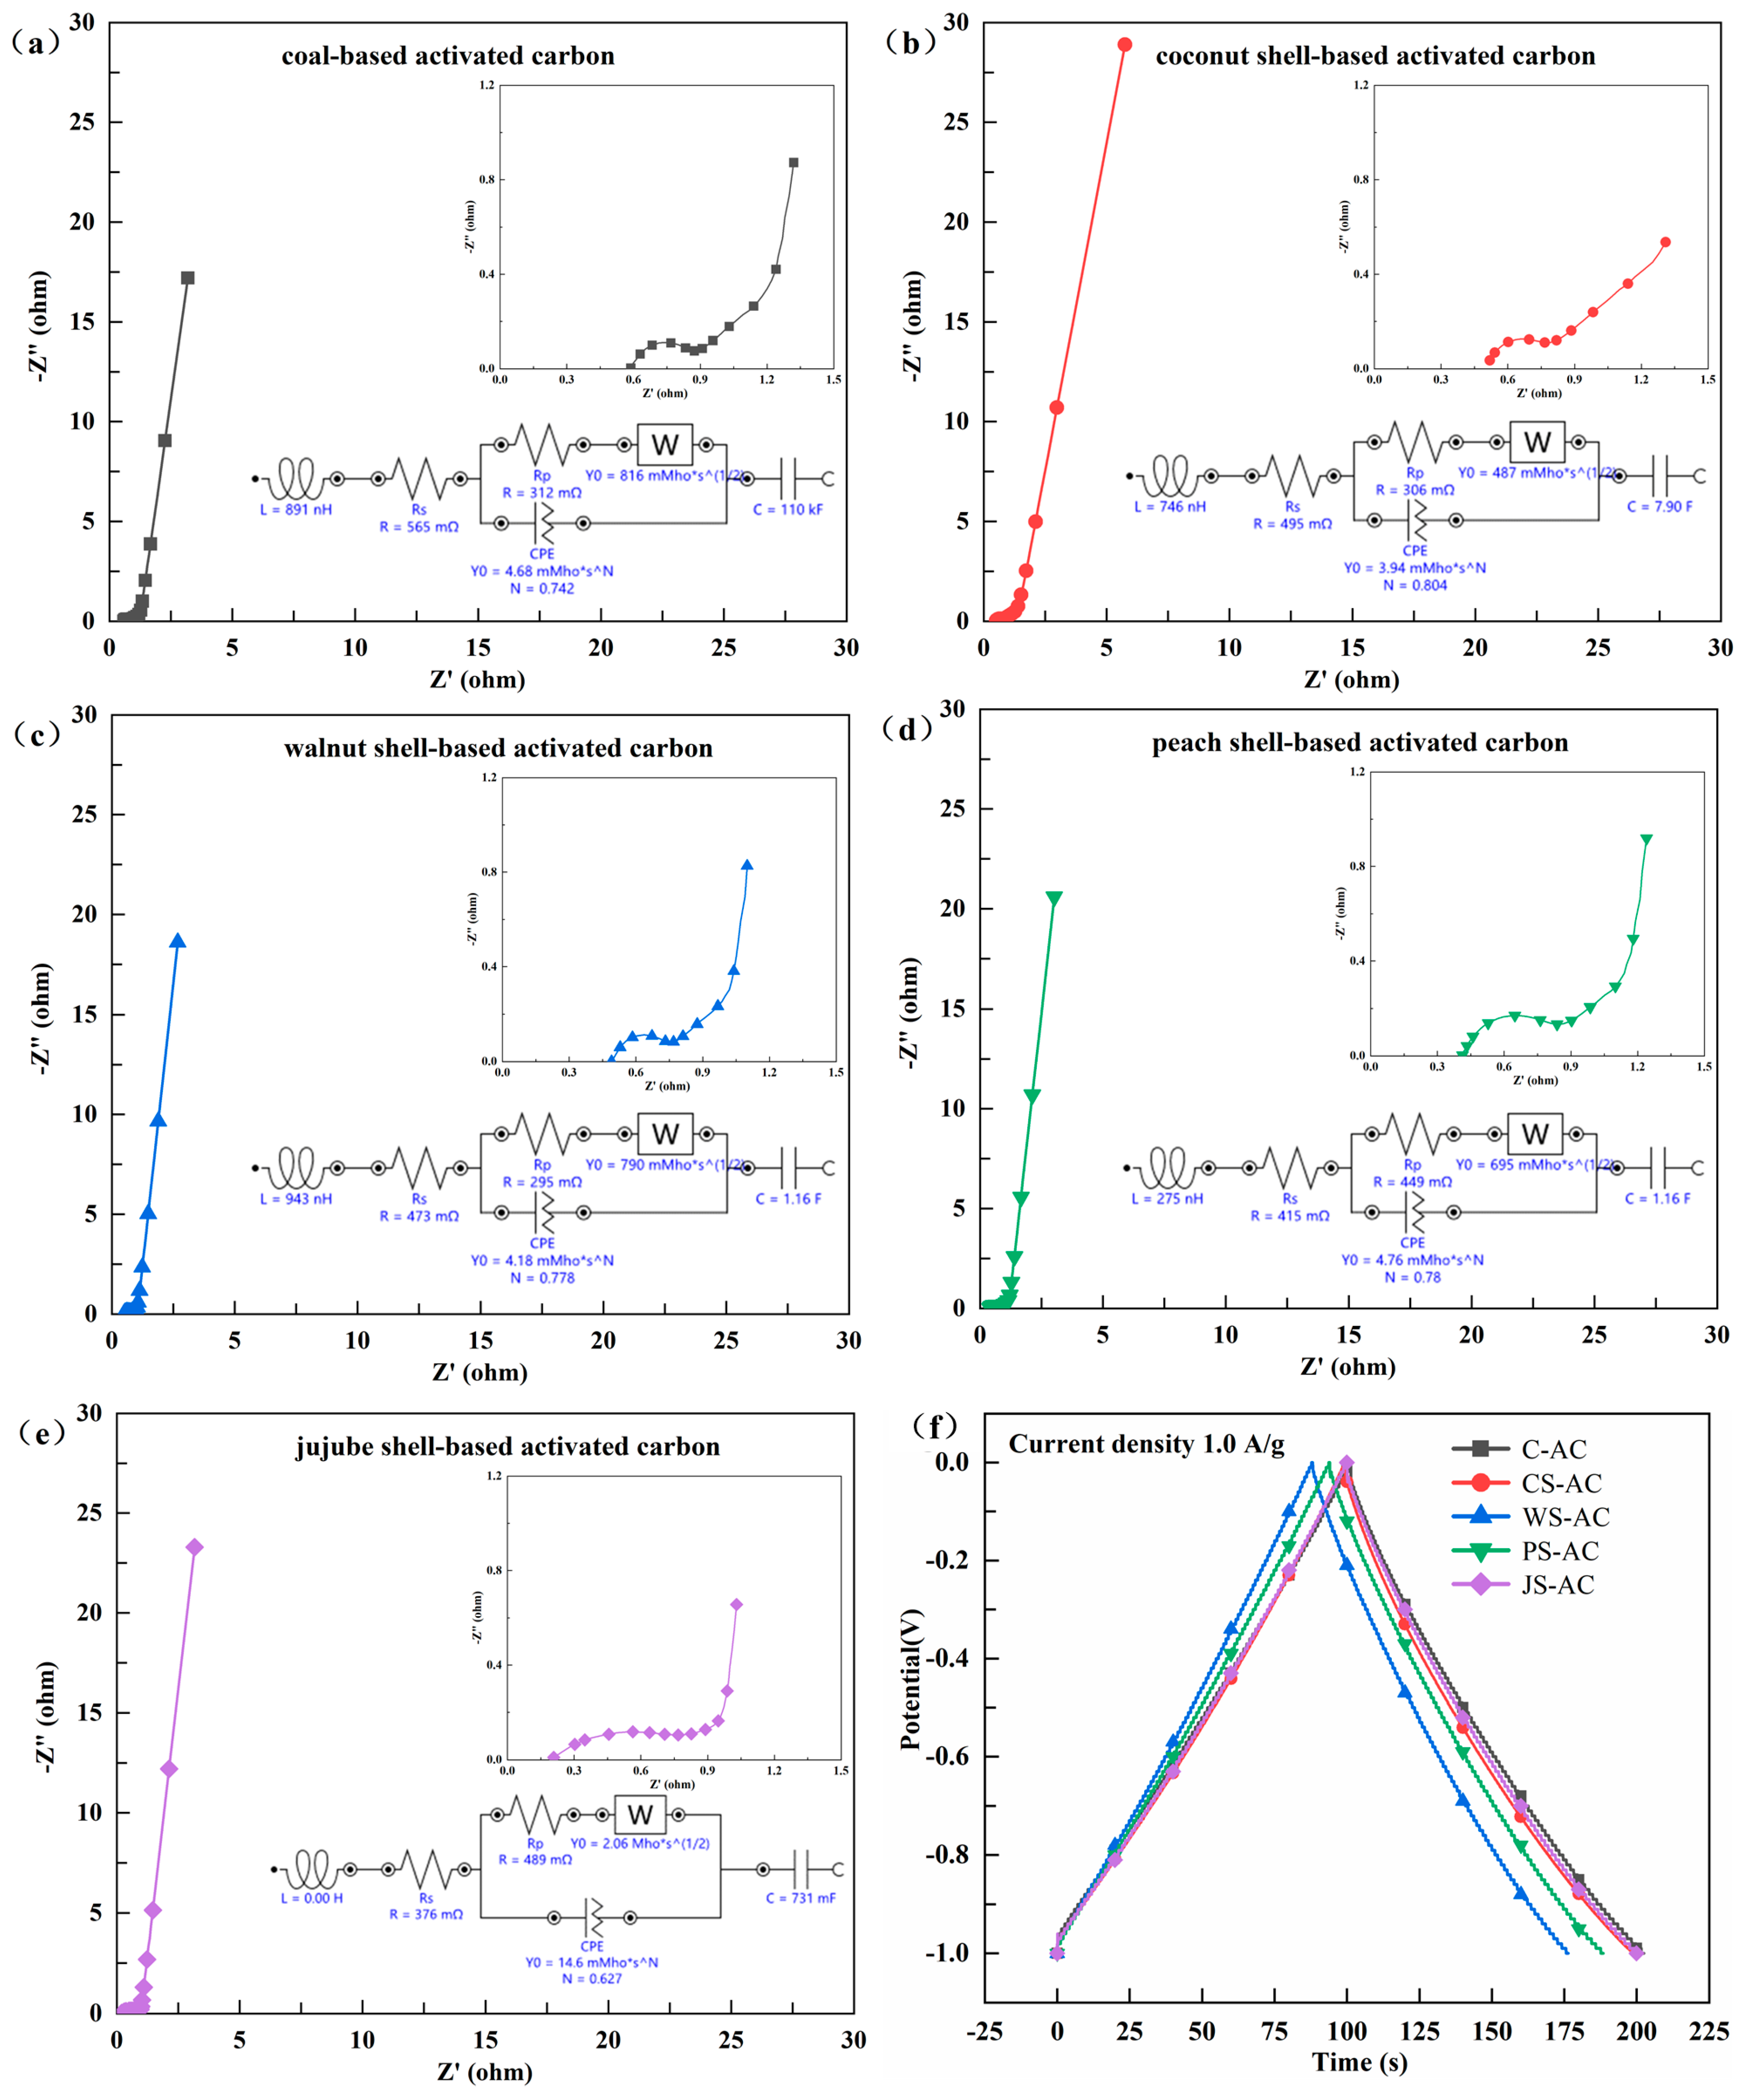
2.1.3. Characterization of the Electrochemical Properties of Activated Carbon

The electrochemical properties of AC were measured using a three-electrode cell system in which AC was used as the working electrode, the mercuric oxide electrode was used as the reference electrode, and the platinum tablet was used as the auxiliary electrode. The preparation of the AC working electrode was as follows: (1) AC was ground to powder, and then sieved through a 140 mesh screen, (2) the sieved AC powder (85%), carbon black (10%), and polytetrafluoroethylene (5%) were mixed in 30 mL of ethanol and then stirred on a thermostatic magnetic stirrer until the ethanol completely volatilized, (3) the above mixed material was rolled into a 1 cm × 1 cm electrode sheet for a 12 h drying treatment followed by tabletting treatment on foamed nickel with a tabletting machine, and (4) before the electrochemical testing, the working electrode was immersed in KOH solution (6 M) to ensure that most of the ions could well penetrate the pores of the active material. The electrochemical properties of the prepared working electrode were tested via cyclic voltammetry (CV), galvanostatic charge/discharge (GCD) and electrochemical impedance spectroscopy (EIS) using an electrochemical workstation (VoltaLab 40 PGZ301, HACH). The CV test was carried out at a scanning range of −1.0–0.0 V and a scanning speed of 5–200 mV/s. The GCD test was carried out at a current density of 0.5 A/g, 1.0 A/g, 2.0 A/g, 5.0 A/g, and 10.0 A/g, respectively, and the specific capacitance of AC was calculated by using the GCD discharge curve at 1.0 A/g. The EIS curve was tested by applying a sine wave with an alternating current amplitude of 10 mV in the range of 10 kHz–0.1 Hz. The conductivity of AC was measured by a four-probe tester (ST2722-SD, Suzhou Jingge Electronics Co., Ltd., Suzhou, China)
The specific capacitance of AC obtained from CV (Equation (8)) and GCD (Equation (9)) tests was calculated as follows [17]:
C sp = A i 2 × Δ V × dv dt × m
C sp = I × Δ t m × Δ V
where Csp is the specific capacitance of AC (F/g); Ai is the total area under the CV curve; dv/dt is the scanning rate (mV/s); m is the mass of the active material (mg); ΔV is the voltage window (V); I/m is the current density (A/g); and Δt is the discharge time (s).

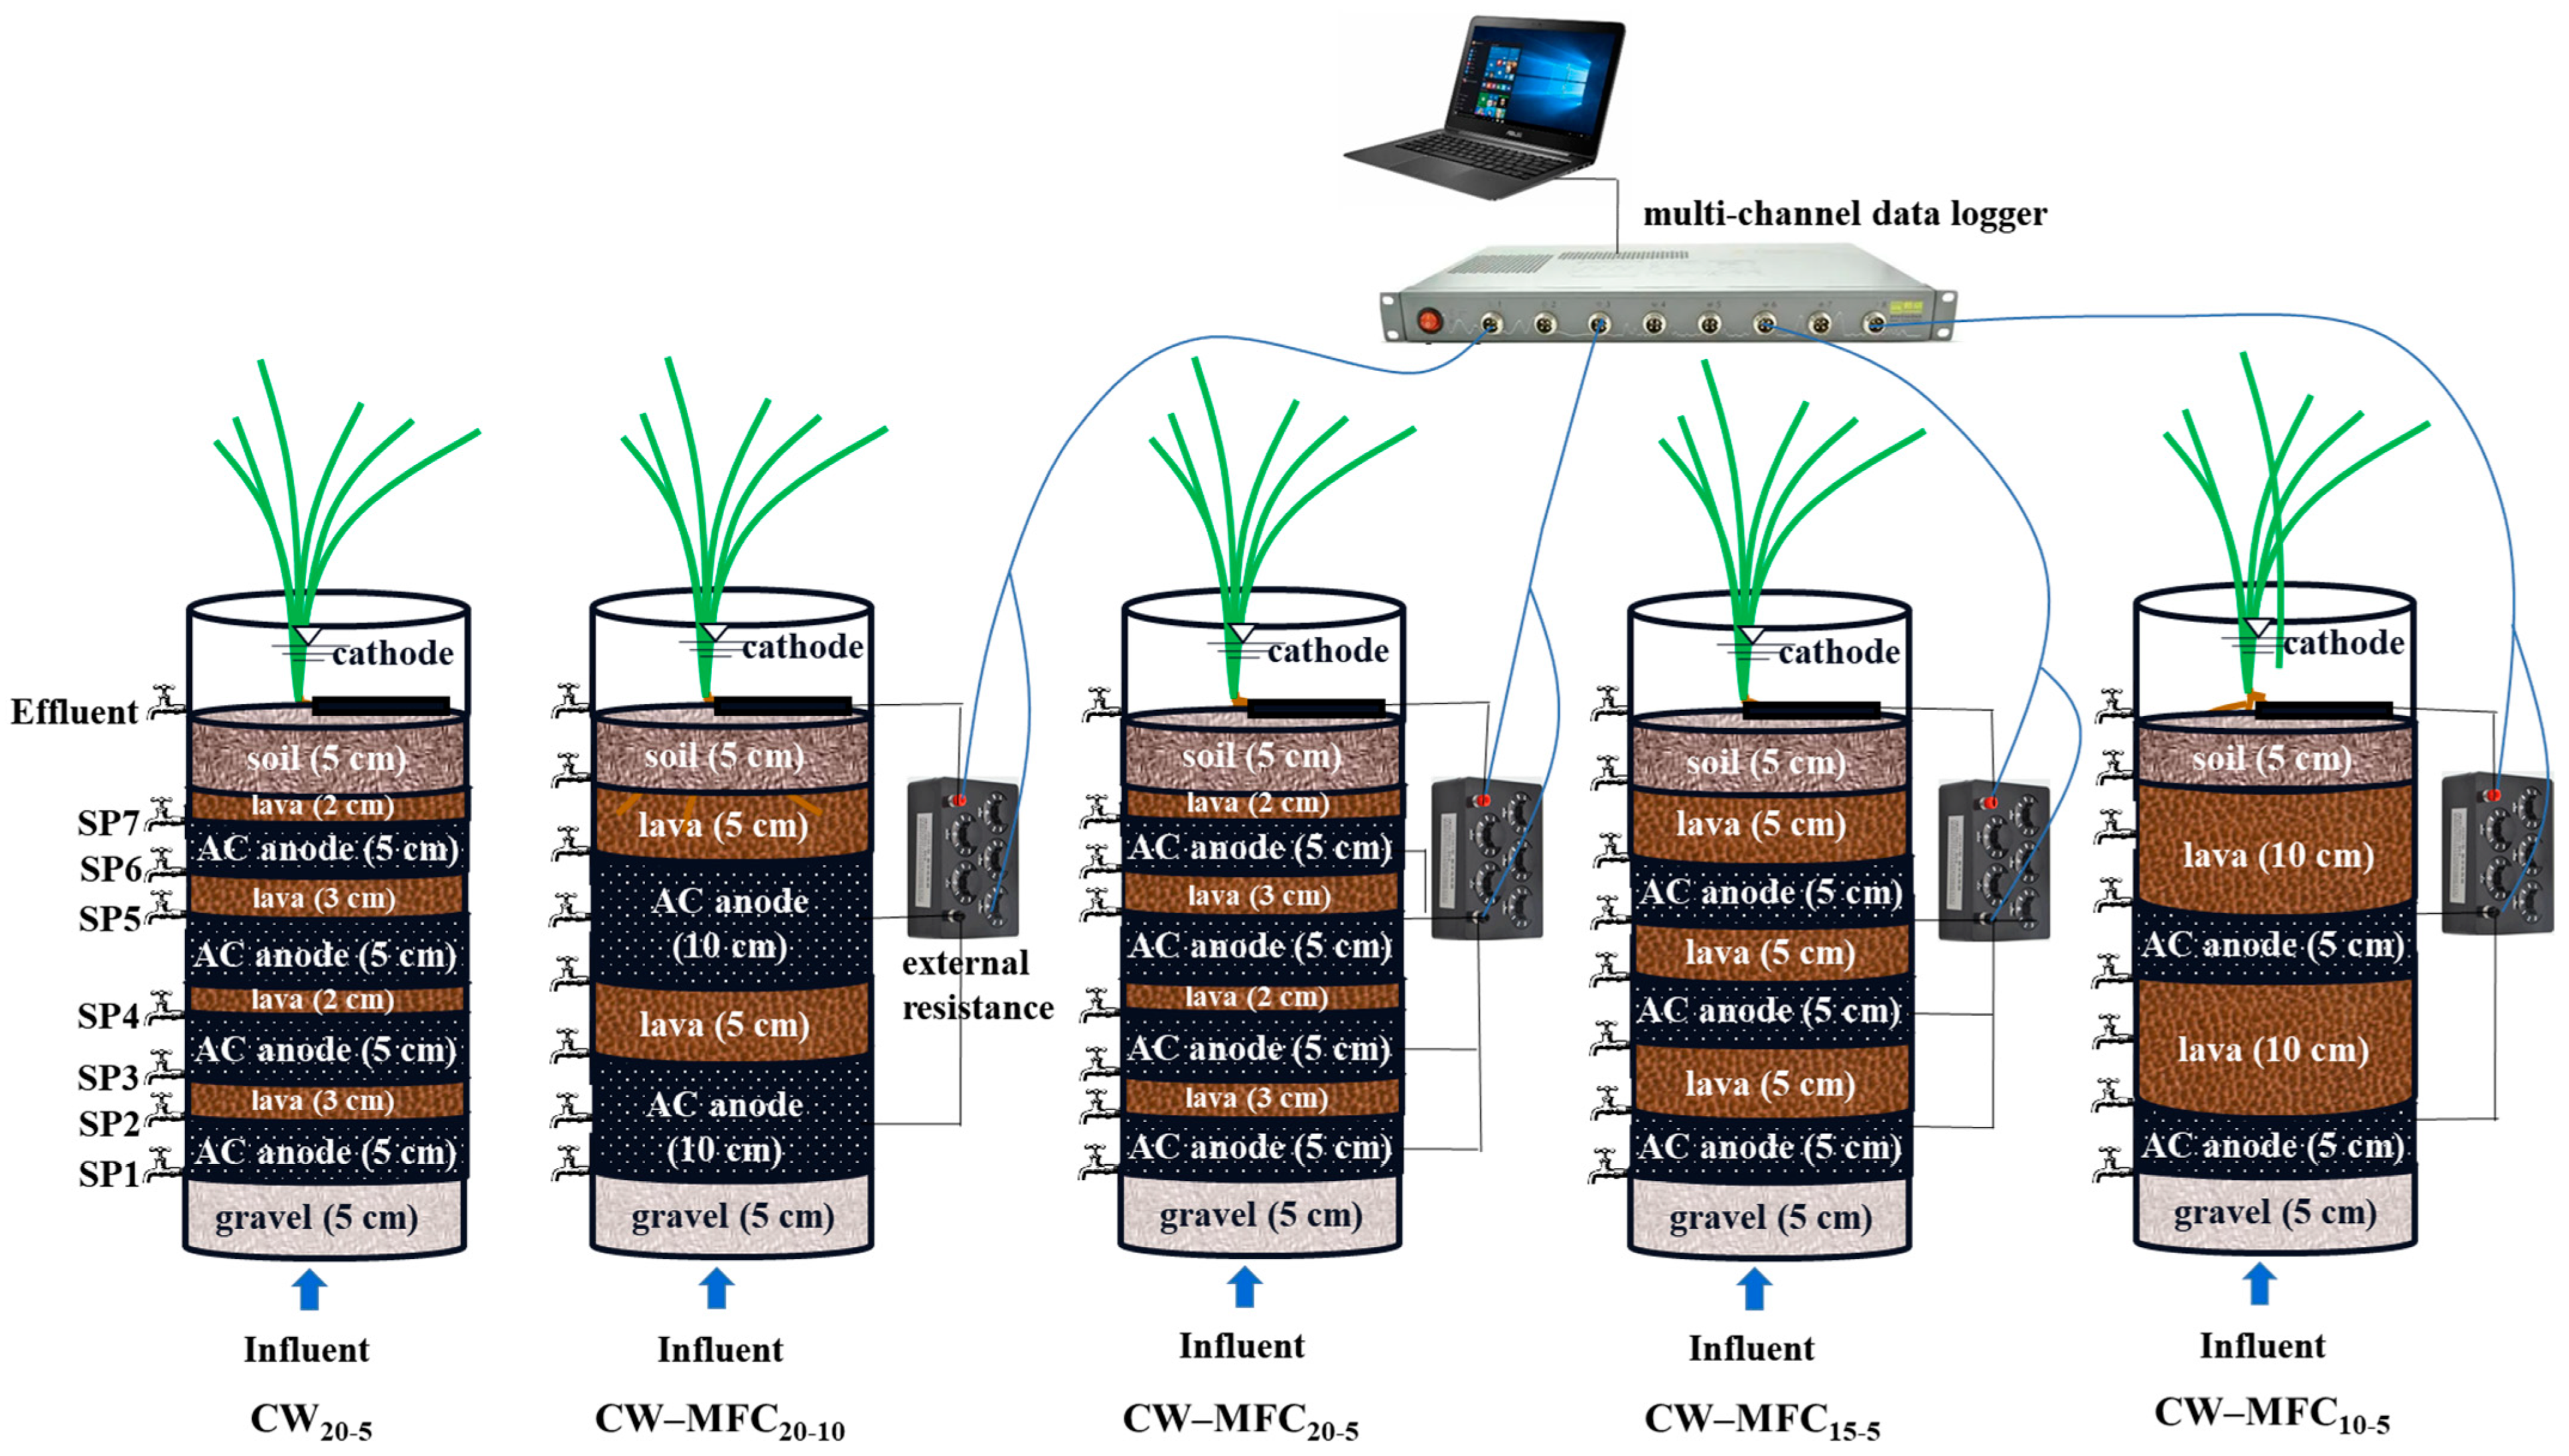
2.2. Construction of the Integrated CW–MFC Systems

Five lab-scale up-flow CW–MFC systems, namely, CW–MFC10-5, CW–MFC15-5, CW–MFC20-5, CW–MFC20-10, and CW20-5, were built indoors on a campus in Tianjin, China. The specific location is shown in Figure 1. The schematic of the integrated CW–MFC systems is shown in Figure 2. Each wetland microcosm was made of Perspex glass with height of 50 cm and an inner diameter of 19 cm. The substrates from bottom to top were 25–35 mm gravel (5 cm deep), 4 mm AC (CS-AC), 5–10 mm lava, and soil (5 cm deep). The AC was wrapped in a stainless-steel mesh cylinder with a dimension of 19 cm in diameter, 5 cm or 10 cm in depth, 5 mm in aperture, and 2 mm in thickness, which was also used as the MFC anode. The depth of a single AC anode was 5 cm or 10 cm. Taking CW–MFC20-5 and CW–MFC20-10 for example, the “5” or “10” meant the single AC anode was 5 cm or 10 cm deep, and the “20” meant the depth of all AC anodes was 20 cm; that was, there were 4 AC anodes in CW–MFC20-5, and 2 AC anodes in CW–MFC20-10. The main substrate layers alternated between AC and lava, and the specific arrangement of each CW–MFC is shown in Figure 2. One graphite plate (10.0 cm × 7.0 cm × 1.0 cm, provided by Hebei King Carbon Technology Co., Ltd., Langfang, China) was placed on the soil’s surface as the MFC cathode. The anodes and cathode were connected by titanium wires (diameter of 1 mm) across a variable external resistor (0–9999.9 Ω, provided by Taizhou Zhongtai Teaching Equipment Co., Ltd., Taizhou, China). Eight sampling points (SP) were located along the wetland microcosm.
Canna spp. Has the advantages of rapid growth, strong pollution resistance, good root secretion ability of organics and oxygen, a long flowering period, and high ornamental value, and it is the most popular plant used in CWs in China [18]. In this study, Canna indica L. was selected as the wetland plant. After planting, the microcosms were immediately submerged in tap water with NH4Cl, KH2PO4, MgSO4·7H2O, and CaCl2·2H2O (10 mg/L). After 30 days, the MFC circuits in CW–MFC10-5, CW–MFC15-5, CW–MFC20-5, and CW–MFC20-10 were connected, and the external resistors were set to 1000 Ω to start up the systems, while the MFC circuits in CW20-5 remained disconnected as the control. During startup and operation, the synthetic wastewater was continuously pumped into the systems from the bottom (peristaltic pump BT100-1F, Baoding longer constant current pump Co., Ltd., Baoding, China), and the effluent was discharged from the top. The average hydraulic residence time (HRT) of the CW–MFC systems was 2.0 days. After 13 days of operation, reproducible maximum voltages were observed, indicating the successful start-up of CW–MFCs. The operation of the five CW–MFC systems lasted for two years. The entire experimental period was from May 2020 to October 2023, during which the recorded average indoor temperatures were 20.3–29.2 °C.
The synthetic influents were prepared using C6H12O6, CO(NH2)2, NH4Cl, MgSO4·7H2O, and CaCl2·2H2O. All of the chemicals were of analytical grade (provided by Tianjin Bohua Chemical Reagent Co., Ltd., Tianjin, China). The major characteristics of the influents were pH 7.0 ± 0.2, 188.8–203.5 mg/L chemical oxygen demand (COD), 23.5–25.2 mg/L NH3-N, 14.5–16.1 mg/L organic nitrogen (Org-N), and 39.2–40.0 mg/L total nitrogen (TN).

2.3. Sampling and Analysis

After the successful start-up of the CW–MFCs, water samples were collected every ten days from SP along the wetland microcosms and were analyzed immediately for COD, NH3-N, N O 2 -N, N O 3 -N, and TN with a multi-parameter water quality tester (MI-200H, Tianjin ZKCP Technology Co., Ltd., Tianjin, China). The standard operation was provided by the manufacturer. The tests were repeated three times. The Org-N was calculated by the difference between TN and NH3-N, N O 2 -N, and N O 3 -N.
The removal rate and removal load of COD, Org-N, NH3-N and TN were calculated as follows:
R p = ( C i C e ) C i × 100 %
R L = q × ( C i C e ) V
where Rp is the removal rate (%); RL is the removal load (g·m−3·d−1); Ci and Ce are the mean influent and effluent concentrations (mg/L), respectively; q is the influent flowrate (m3/d); and V is the wetland volume (m3).
The output voltage of CW–MFCs was recorded at an interval of 30 min by a multi-channel data logger (Model CT-4008-5v10mA-164, Shenzhen Neware Electronics Co., Ltd., Shenzhen, China). The current density and power density was calculated as follows:
I d = U V × R e x × 1000
P d = U 2 V × R e x × 1000
where Id is the volume current density (mA/m3); Pd is the volume power density (mW/m3); U is the output voltage (V); V is the effective volume of CW–MFCs (m3); and Rex is the external resistance (Ω).
The coulombic efficiency of CW–MFCs was calculated as follows [5]:
C E = M I F q b C O D × 100 %
where CE is the coulombic efficiency (%); M is the molar mass of organic matter using oxygen as the standard (32 g/mol); I is the current (A); F is the faraday constant (96,485 C/mol e); q is the influent flowrate of CW–MFCs (m3/s); b is the number of electrons transferred by oxidizing 1 mol of organic matter using O2 as the standard (4e mol/mol); and ΔCOD is the concentration difference of COD in influents and effluents of CW–MFCs (mg/L).
The internal resistance of the CW–MFCs was calculated by the polarization curve slope method [5]. The polarization curve was obtained by the following steps: (1) disconnect the MFC circuit of CW–MFCs in operation and measure the open-circuit voltage (OCV) every 10 min until stable values appear, (2) connect the MFC circuit and obtain the stable output voltage under external resistances of 9000 Ω, 7000 Ω, 5000 Ω, 4000 Ω, 3000 Ω, 2000 Ω, 1500 Ω, 1000 Ω, 500 Ω, 400 Ω, 250 Ω, 150 Ω, 100 Ω, and 50 Ω, (3) calculate the current density (Id) by the formula (12), and (4) plot the polarization curve with Id as the abscissa and U as the ordinate. The power density curve was plotted with Id as the abscissa and Pd as the ordinate.
After the two years of operation, microbial samples were collected from the biofilm attached to gravel, CS-AC (MFC anodes), lava, soil, plant roots, and MFC cathodes. The microbial diversity was determined using 16s rRNA sequencing by Beijing Novogene Technology Co., Ltd., Beijing, China. The enzymatic activity was determined by dehydrogenase (DHA), catalase (CAT), and ammonia monooxygenase (AMO) activity using the double-antibody sandwich method. ELISA reagent kits were provided by the Shanghai Enzyme-linked Biotechnology Co., Ltd., Shanghai, China. The nitrification and denitrification potential were determined by constant temperature shaking culture with nitrification culture solution and constant temperature culture with denitrification culture solution, respectively. The specific operation of high throughput sequencing, double antibody sandwich method, and nitrification/denitrification potential determination was provided in Supplementary Materials.

3. Results and Discussion

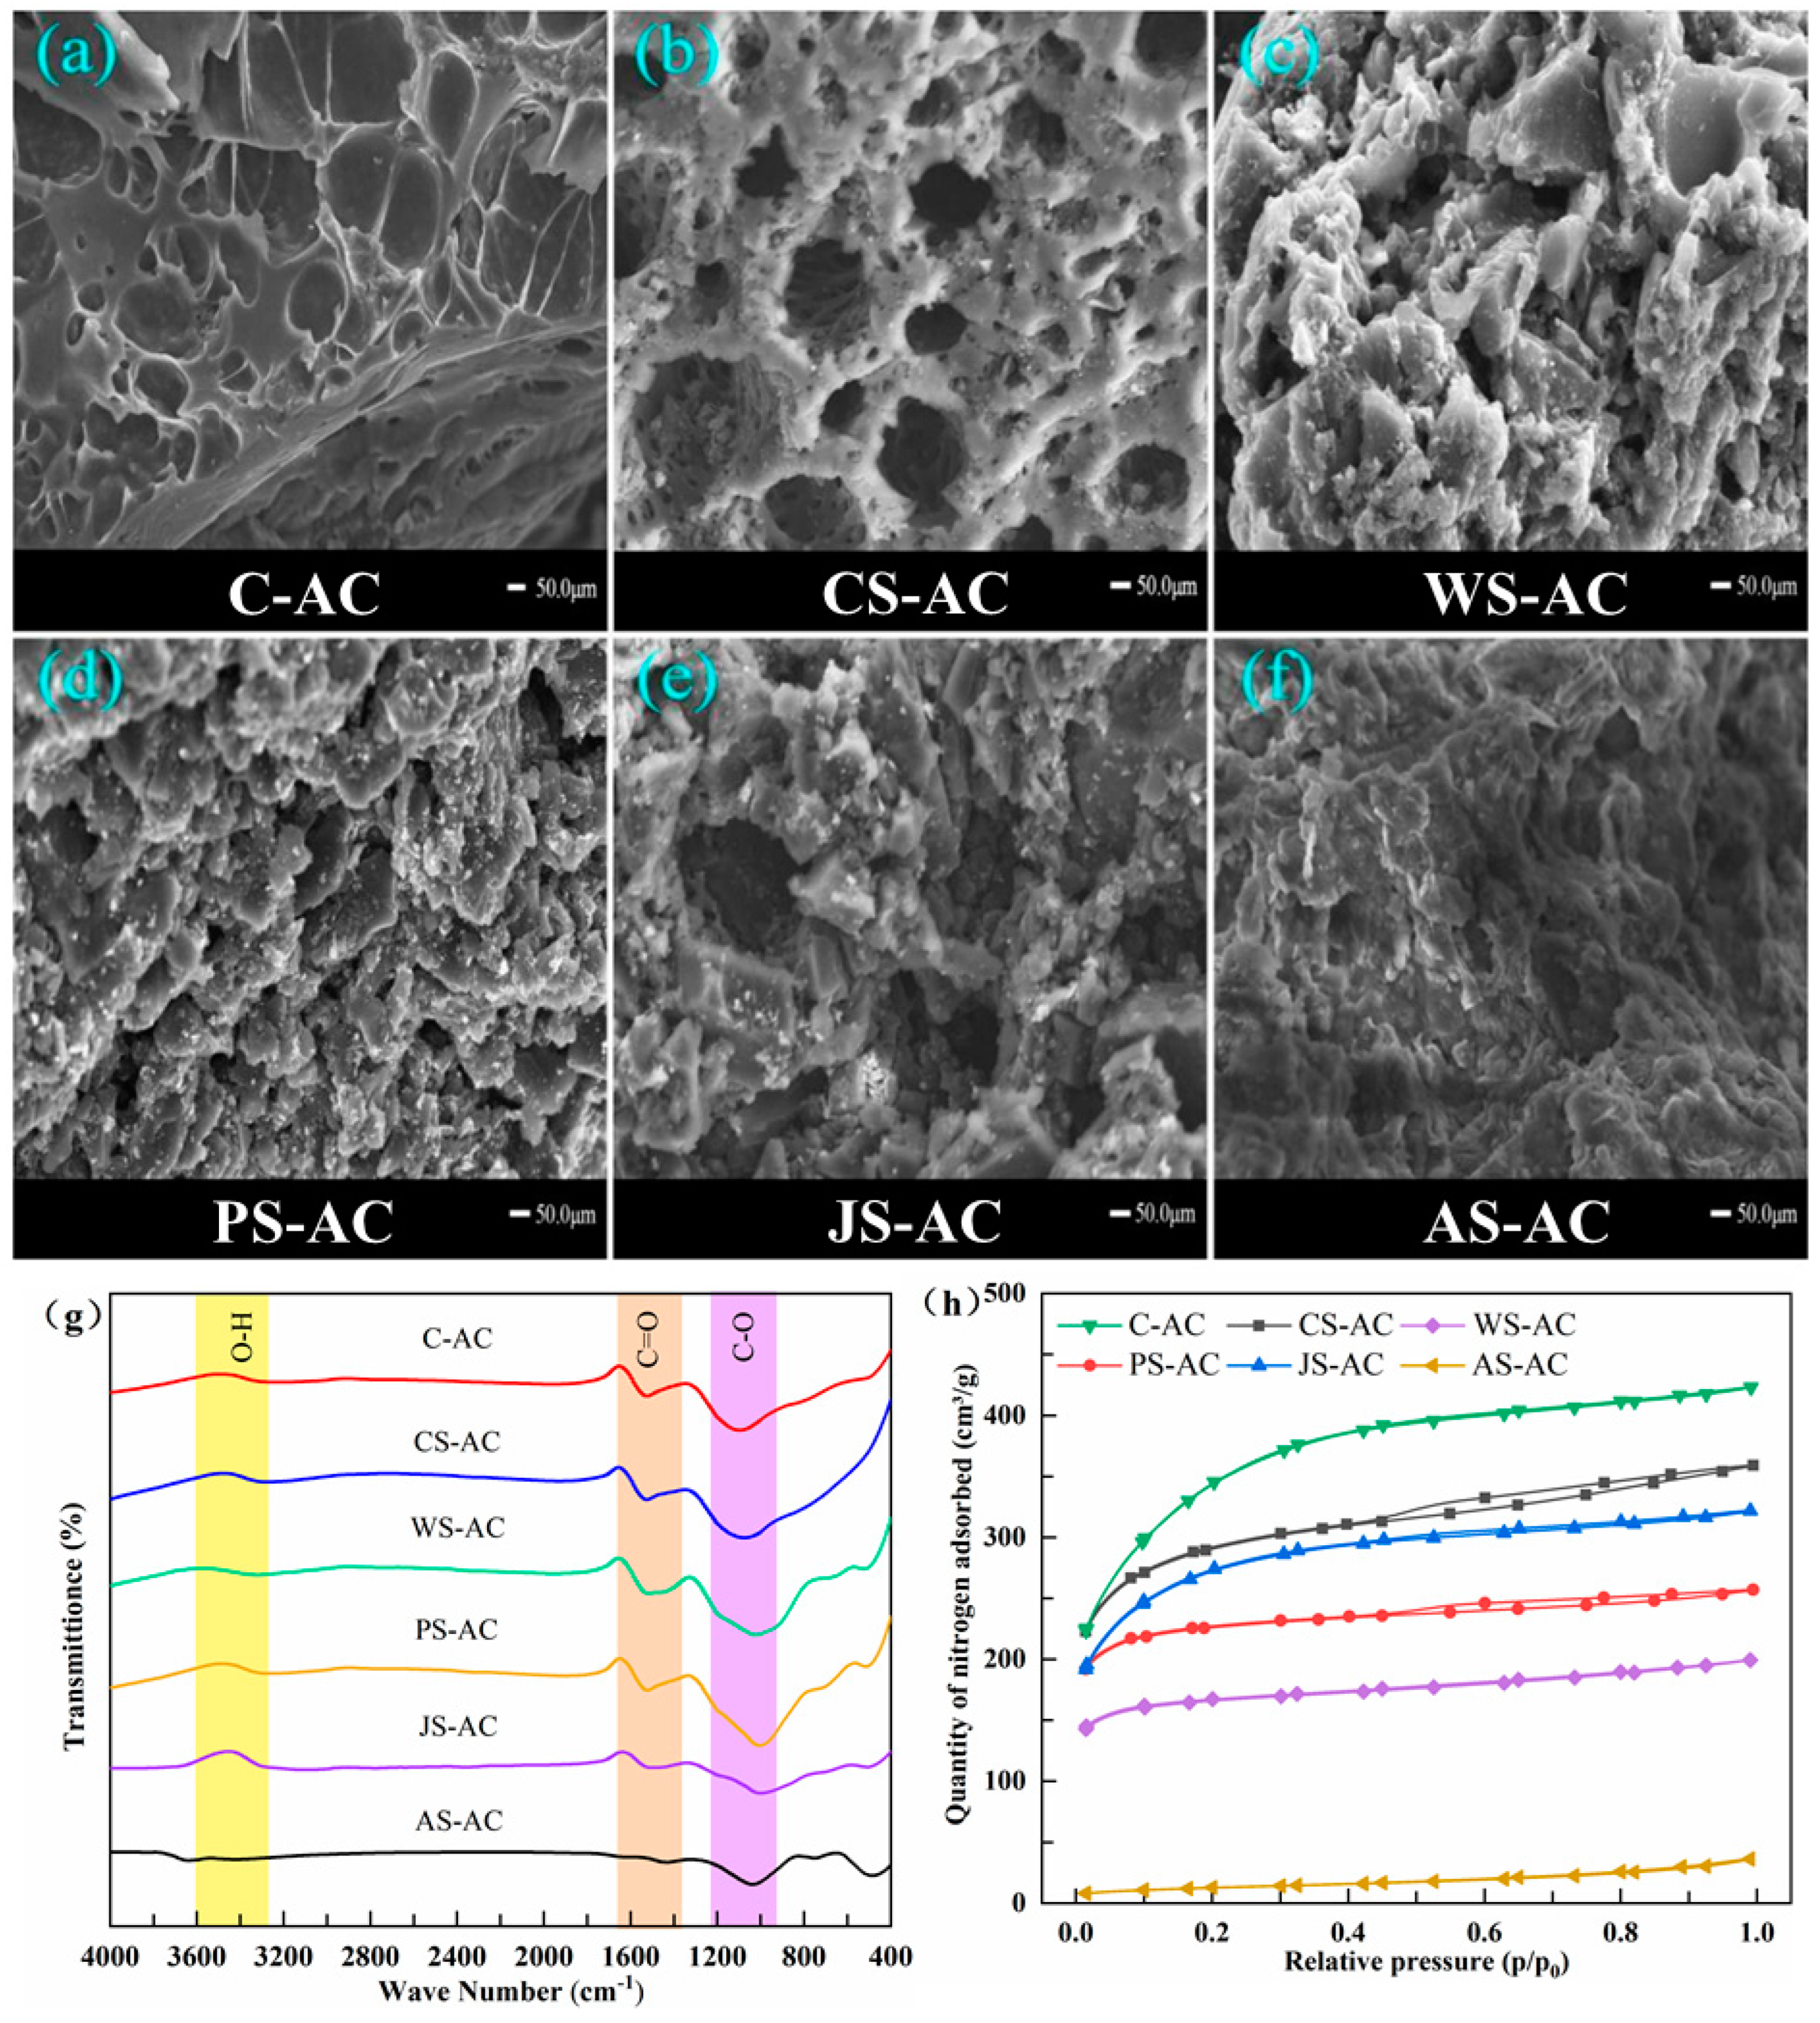
3.1. Characterization of Activated Carbon

The microscopic morphologies of AC are shown in Figure 3a–f. All AC samples had relatively regular morphological structures, demonstrating honeycomb-like layers with varying degrees of folds. The WS-AC and PS-AC had the most obvious fold morphology, followed by AS-AC and JS-AC, while CS-AC and C-AC had the most obvious pits and pores on the surface. This intuitively exhibited the more developed pore structure of CS-AC and C-AC than the other types of AC. Moreover, a large number of interconnected small pores were clearly visible inside the large pores of CS-AC, forming an excellent interconnected carbon network.
The FTIR spectra of AC is shown in Figure 3g. The bands at 3600–3250 cm−1 corresponded to O-H stretching vibrations, indicating the phenolic hydroxyl [19]. The peaks at 1557 cm−1 corresponded to -C=O stretching vibrations resulting from the carboxylic acid group [20]. The peaks at 1060 cm−1 corresponded to C-O stretching vibrations resulting from phenol, ether, or lactone groups. The amplitude of O-H peaks was not as large as that of -C=O and C-O for all AC samples, indicating that the amount of O-H was less than that of -C=O and C-O. The relatively higher magnitude of -C=O and C-O peaks indicated rich carboxyl, phenol, ether, or lactone groups on the surface of C-AC, CS-AC, WS-AC, and PS-AC. In contrast, JS-AC and AS-AC had lower magnitudes of -C=O and C-O peaks, suggesting a decrease in relevant functional groups. In particular, almost no peaks of O-H and C=O were observed for AS-AC. The hydrophilic groups (hydroxyl, carboxyl, ether) were beneficial for the nitrogen adsorption of AC [21].
Nitrogen adsorption–desorption isotherms of AC are shown in Figure 3h. For the six AC samples, the quantity of nitrogen adsorbed increased sharply at a very low relative pressure (P/P0), and the subsequent curve was a horizontal or nearly horizontal line, indicating that the adsorption capacity reached a limit value, which conformed to the type-I isotherm proposed by the International Union of Pure and Applied Chemistry (IUPAC). The type-I isotherm is a typical Langmuir isotherm, which usually works for microporous materials such as AC, zeolite molecular sieves, and some porous oxides. As listed in Table 1, C-AC and CS-AC had larger specific surface areas (>830.0 m2/g), followed by JS-AC, WS-AC and PS-AC (480.0–790.0 m2/g), while AS-AC had a quite small specific surface area (<45 m2/g). There was a positive correlation between the total pore volume and specific surface area of AC. However, only CS-AC exhibited a uniform and good distribution of both micropores (48.1%) and mesopores (51.9%), while the mesopores took a hugely dominant position in AS-AC (97.1%), C-AC (85.4%), and JS-AC (61.7%), and micropores dominated in WS-AC (69.8%) and PS-AC (66.4%).
Overall, CS-AS was rich in hydrophilic functional groups and had the characteristics of a large specific surface area, a developed pore structure, and good distribution of both micropores and mesopores. Additionally, the AC costs vary greatly because of the sources, labor, and transportation, etc. Fruit-shell-based AC is around 2.0 times more expensive than coal-based AC (Table 1); However, fruit shells have the advantages of renewability, environmental friendliness, large reserves, and wide sources, which make fruit-shell-based AC have lower environmental impacts than coal-based AC.

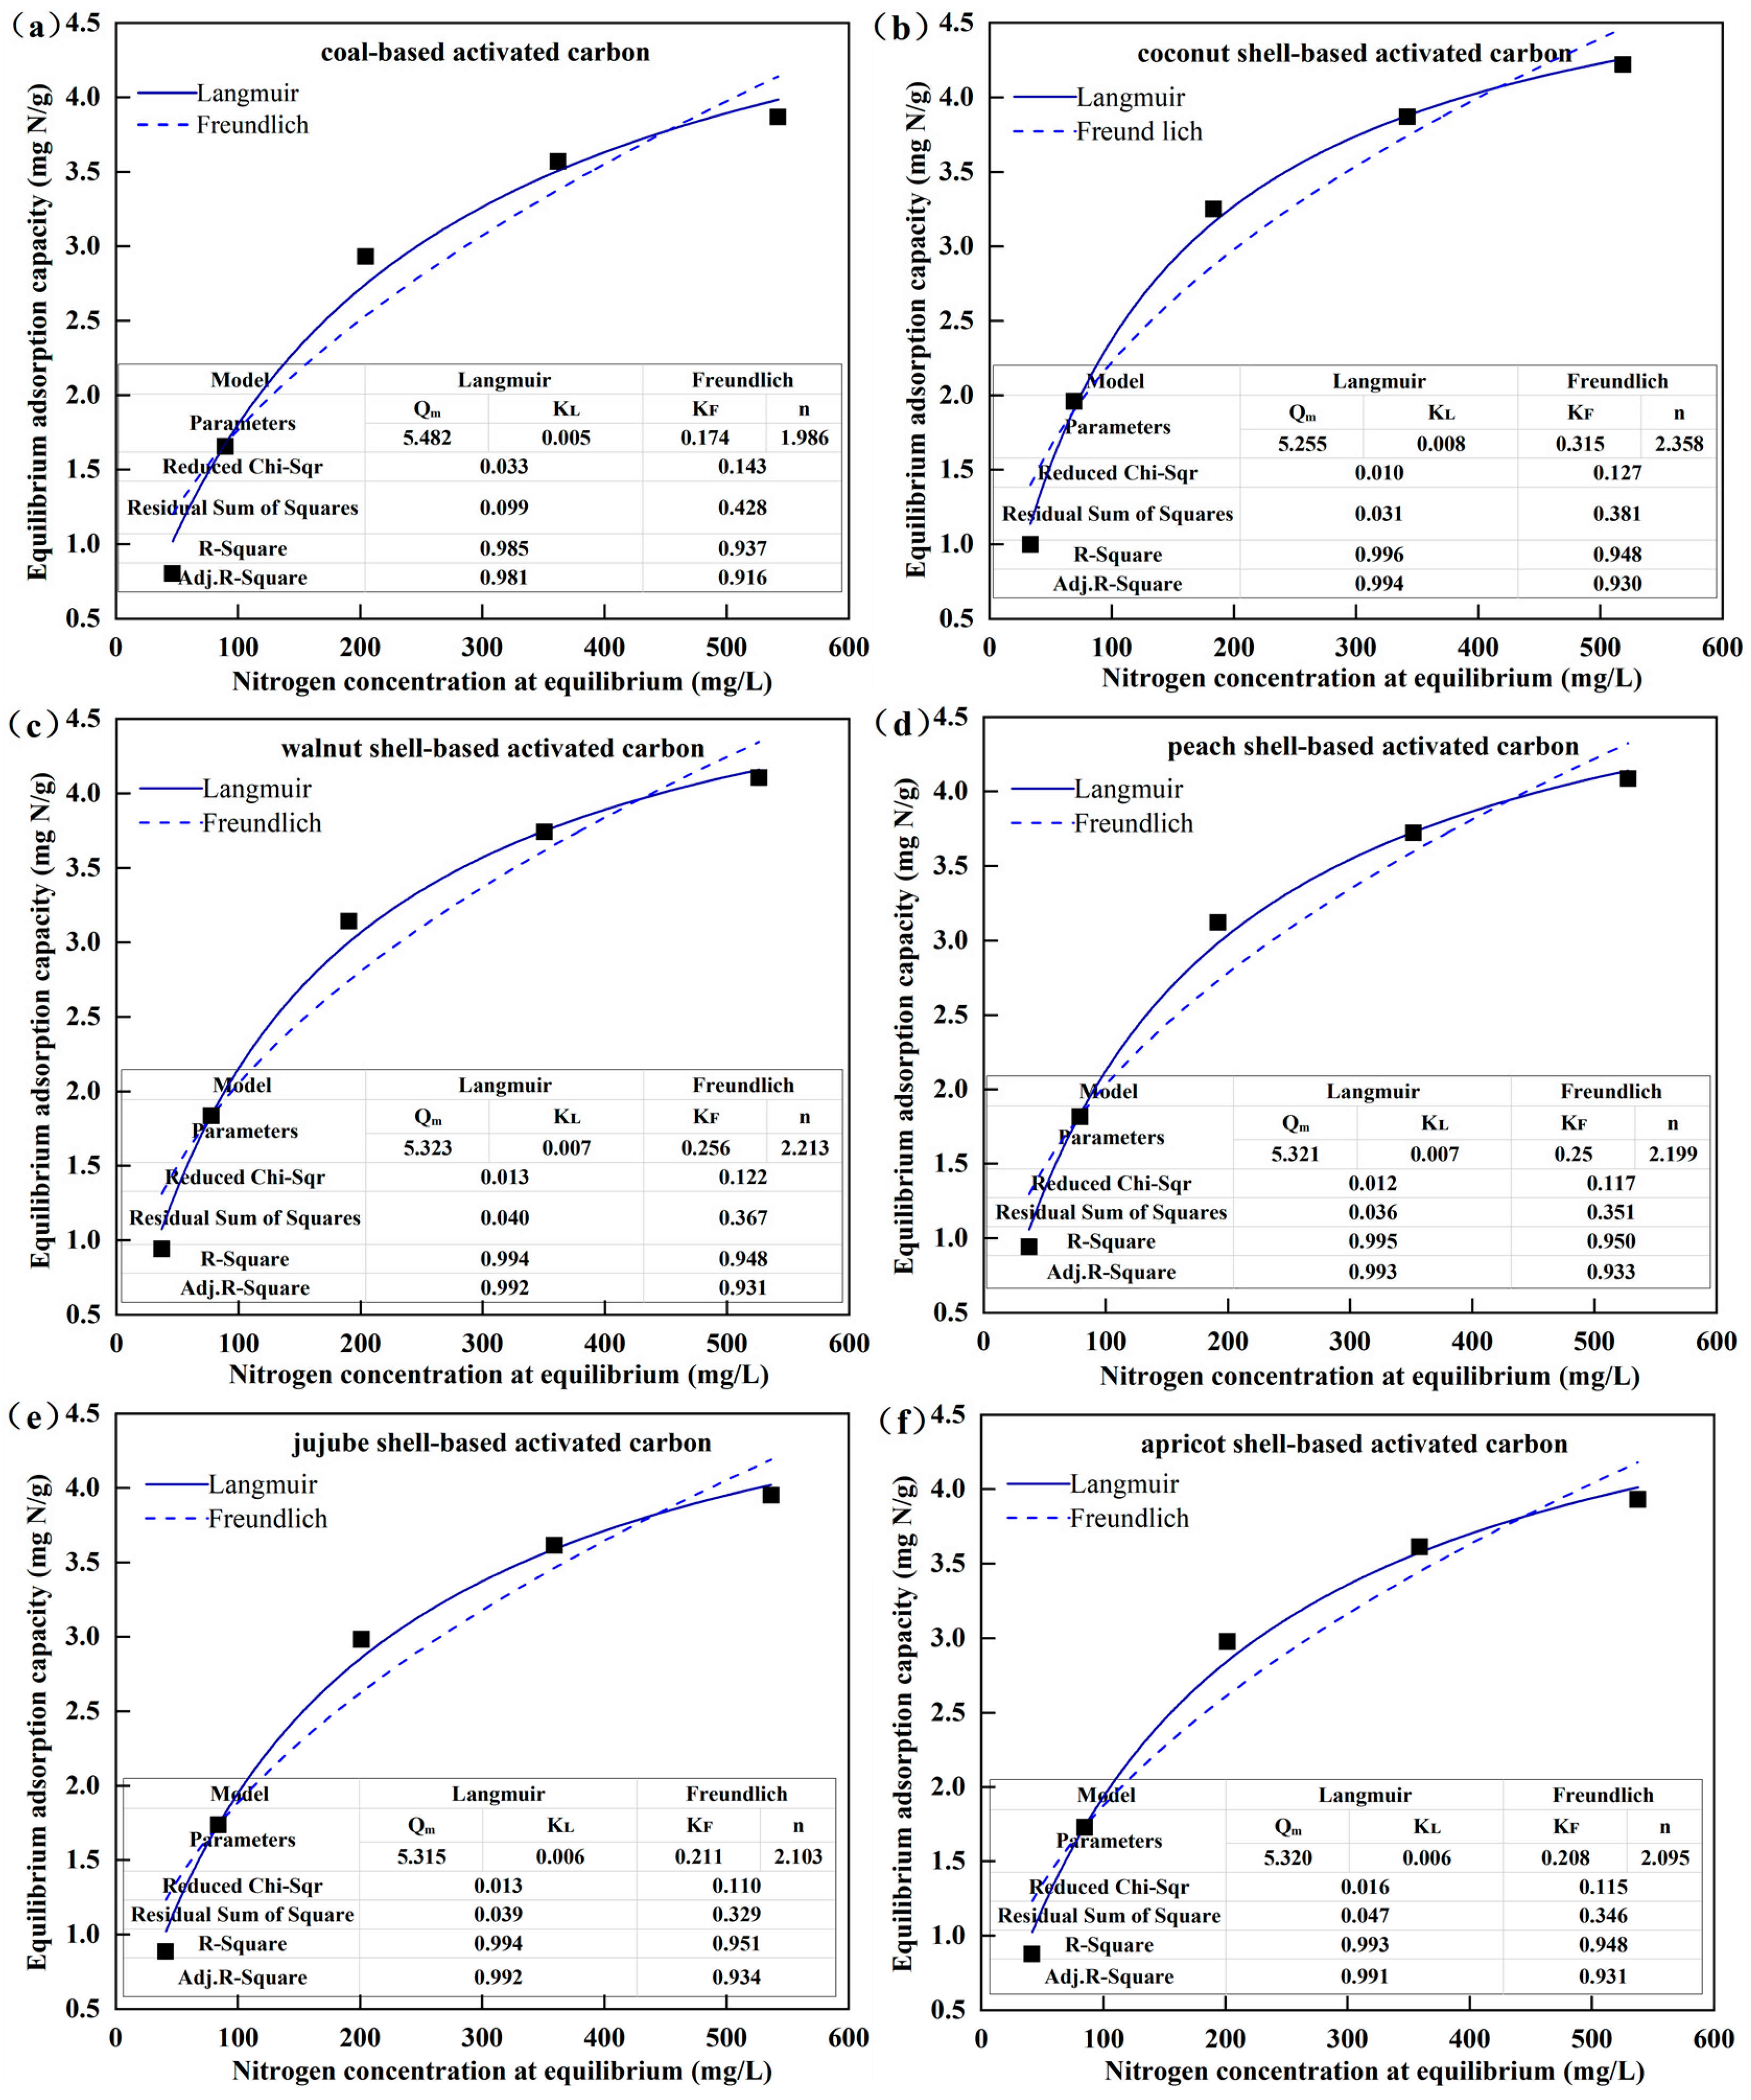
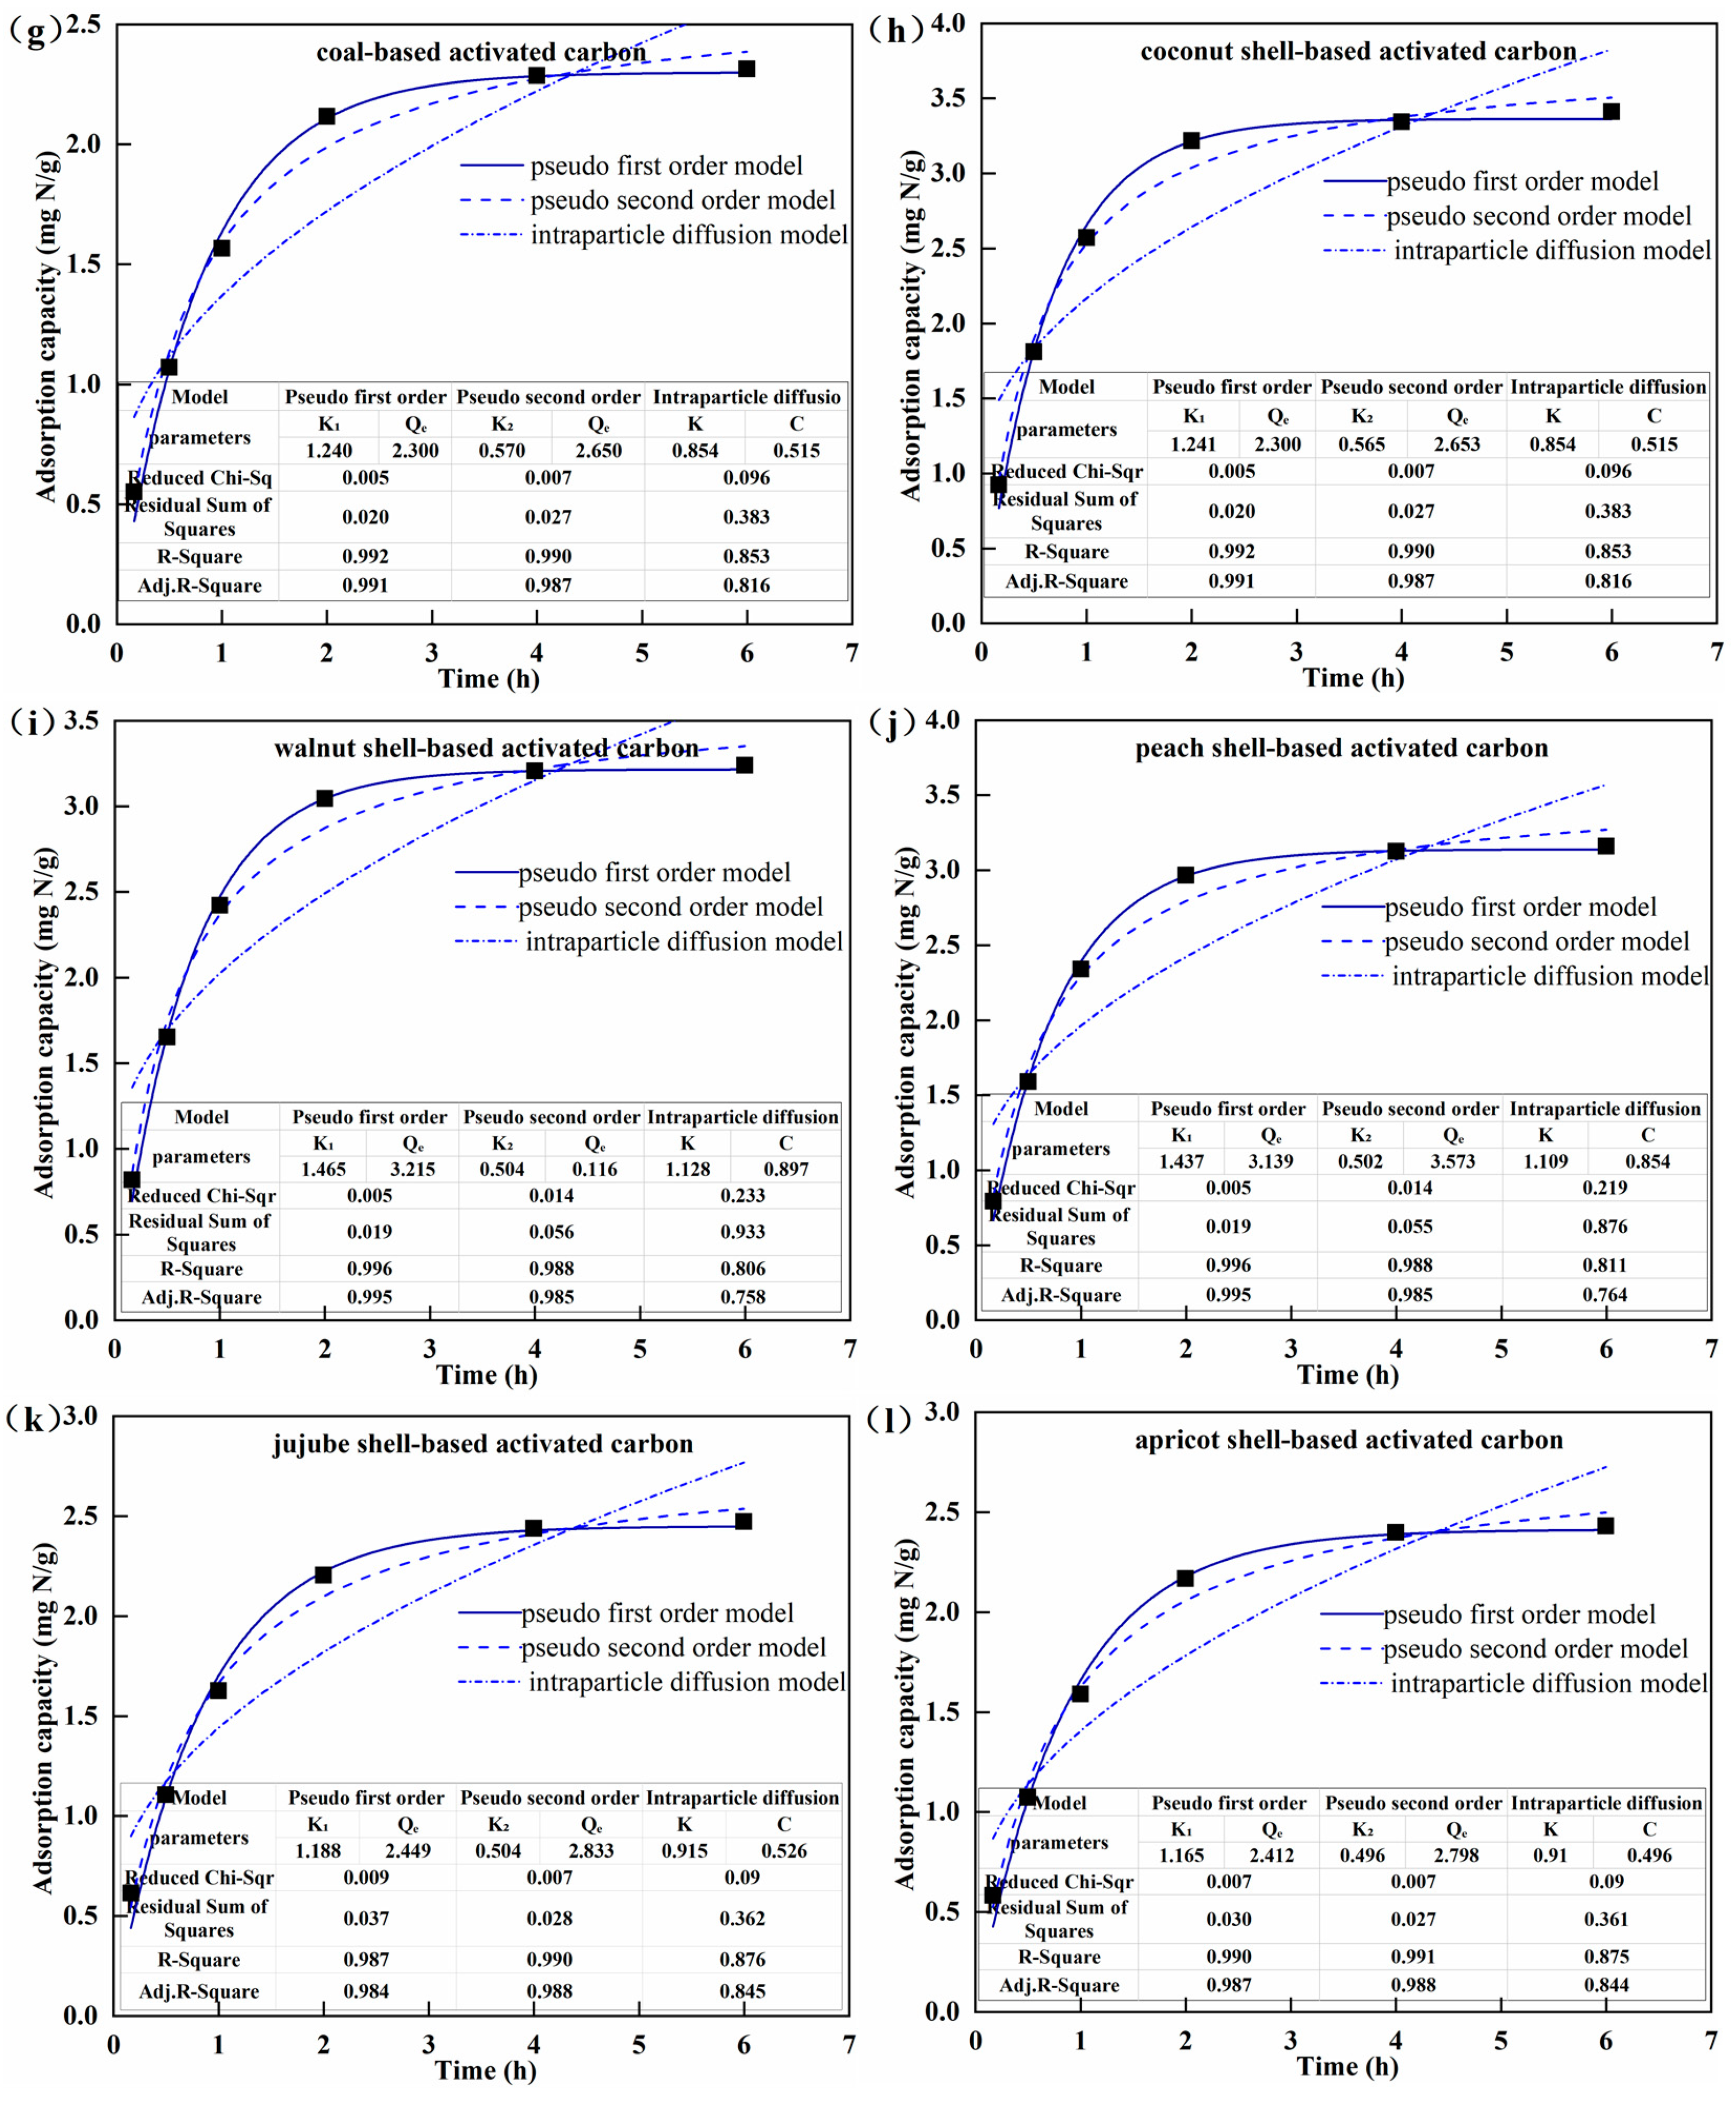
3.2. Nitrogen Adsorption Capacity of Activated Carbon

The adsorption isotherms of AC for nitrogen are provided in Figure 4a–f. The equilibrium adsorption capacity of all the types of AC for nitrogen increased with the increase in NH3-N concentration and gradually reached saturation. The maximum equilibrium adsorption capacity observed at the initial NH3-N concentration of 800 mg/L was 4.22 mg N/g for CS-AC, followed by WS-AC (4.10 mg N/g), PS-AC (4.09 mg N/g), JS-AC (3.95 mg N/g), AS-AC (3.93 mg N/g), and C-AC (3.87 mg N/g). Based on the higher R-Square, the much lower residual sum of squares, and Chi-Square, the Langmuir model fitted better for the nitrogen adsorption isotherms of all AC samples than the Freundlich model. According to the basic assumptions for deriving the Langmuir model, it was inferred that the adsorption process of AC for nitrogen was dominated by monolayer adsorption, and the adsorption active sites were evenly distributed on the surface of AC. This was in line with the findings by Nguyen et al. [22].
The adsorption kinetics of AC for nitrogen are provided in Figure 4g–l. The nitrogen adsorption capacity of all AC increased rapidly in the first hour and reached 65.4–75.4% of the maximum equilibrium adsorption capacity at 1 h. This was because at the initial period of adsorption, there were enough available adsorption active sites on the surface of AC, and the impetus of mass transfer, i.e., the NH3-N concentration difference between the solution and the surface of AC, was relatively larger. Then, the nitrogen adsorption rate slowed down after 1 h, and the equilibrium adsorption capacity reached 89.2–94.4% of the maximum at 2 h. Afterward, the nitrogen adsorption capacity increased extremely slowly and basically reached saturation at 4 h, indicating the full occupation of adsorption sites by ammonia molecules. Throughout the entire adsorption process, CS-AC always had the highest nitrogen adsorption capacity, followed by WS-AC, PS-AC, JS-AC, AS-AC, and C-AC, which was consistent with the adsorption thermodynamics results. Based on the higher R-Square, the lower residual sum of squares, and Chi-Square, the pseudo-first order model better described the nitrogen adsorption kinetics of the six types of AC than the pseudo-second order model and the intraparticle diffusion model. This indicated that the nitrogen adsorption by AC tended to be a linear process in which physical adsorption played a leading role.
The physical adsorption mainly depends on the specific surface area and pore structure. Although C-AS had the largest specific surface area and total pore volume, CS-AC, WS-AC, and PS-AC had higher nitrogen adsorption capacities than C-AS. Considering the developed microporous structure of CS-AC, WS-AC, and PS-AC (Table 1) as well as the type-I isotherm of microporous materials (Figure 3h), it was inferred that micropores played a major role in the adsorption of AC for nitrogen.

3.3. Electrochemical Properties of Activated Carbon

The CV characteristic curves of AC electrodes are provided in Figure 5a–f. The CV characteristic is used to evaluate the capacitance of electrode materials, and the larger area of the closed CV curve at a certain scanning rate indicated a higher capacitance [23]. The CV cycle of AS-AC was extremely narrow with a surface area of almost zero, indicating that the capacitance of AS-AC was nearly zero. This may be due to the poor pore volume and AS-AC’s lack of oxygen-containing functional groups (-OH and -COOH). Elaiyappillai et al. [24] reported that oxygen functionalities were capable of improving the electrochemical properties by providing added pseudocapacitance to the carbon material. The CV curves of C-AC, CS-AC, WS-AC, PS-AC, and JS-AC were symmetric quasi parallelograms, demonstrating a typical double-layer capacitor characteristic. Compared to batteries using electrochemical principles, double-layer capacitors do not undergo material changes during charging and discharging, and therefore they have features such as short charging time, long service life, good temperature characteristics, energy conservation, and environmental friendliness [23,24]. This further proved the enormous potential of AC as a material for electrodes and energy storage. It was obvious that C-AC had the largest area of the closed CV curve, followed by CS-AC, JS-AC, PS-AC, and WS-AC. In order to quantitatively compare the capacitance, the specific capacitance (Csp) of the five AC electrodes at a scanning speed of 5 mV/s was calculated by Formula (8). The results showed that C-AC and CS-AC had higher Csp values (106.13 F/g and 103.23 F/g, respectively), followed by PS-AC and JS-AC (97.44 F/g and 97.09 F/g, respectively), while WS-AC had the lowest Csp value (91.05 F/g).
The GCD curves of AC electrodes are provided in Figure 6f. The GCD test was also used to analyze the charge storage capacity of electrode materials, and the longer discharge time indicated a stronger charge storage capacity [19,25]. The Csp values calculated by using GCD discharge curves at 1.0 A/g that were 101.20 F/g for C-AC, 100.00 F/g for JS-AC, 99.12 F/g for CS-AC, 94.15 F/g for PS-AC, and 88.05 F/g for WS-AC. From GCD tests in conjunction with the CV characteristics, it can be seen that C-AC, CS-AC, and JS-AC possessed higher capacitances and stronger charge storage capabilities than the other types of AC. The pore structure, microcrystalline structure, and surface chemical structure and state significantly influence the electrochemical properties of AC. The abundant micropores in AC can increase the energy storage space forming an electric double-layer, and a certain amount of mesopores can improve the migration rate of electrolyte ions at high current densities, thereby improving the rate capability of AC electrodes [26,27]. The heteroatoms such as O, N, and P on the surface of AC can increase the pseudocapacitance, conductivity, and wettability of the AC electrode surface [28]. Overall, a high-performance AC electrode for supercapacitors should have a well-developed microporous structure, a wide distribution of micropores and mesopores, an unobstructed micro mesoporous connected structure, and more exposed structural defects and heteroatom groups on the surface of AC, thereby improving the energy density of supercapacitors. The higher specific surface area and developed mesopores of C-AC, CS-AC, and JS-AC provided low-resistance channels for the fast transport of electrolyte ions, enhancing the chances of internal redox reaction in AC [17]. The higher specific surface area and developed micropores endowed CS-AC and JS-AC with higher charge storage capabilities.
The Nyquist plot and fitted equivalent circuit diagram for the EIS test of AC electrodes is provided in Figure 6a–e, and the corresponding parameters were summarized in Table 2. In the Nyquist plot, the semicircle in the high-frequency region indicates the charge transfer resistance at the material interface (Rct), and the smaller the diameter of the semicircle, the smaller is the Rct value; the intercept of the plot on the X-axis represents the electrolyte resistance (Rs), and the sum of Rct and Rs is the equivalent series resistance (ESR) [19,23]. CS-AC, WS-AC, and C-AC had lower Rct values (0.29–0.31 Ω), followed by PS-AC and JS-AC (0.45–0.49 Ω), indicating that CS-AC, WS-AC, and C-AC possessed lower resistance. CS-AC and WS-AC had lower ESR values (0.77–0.80 Ω), followed by PS-AC, JS-AC, and C-AC (0.86–0.88 Ω), indicating that CS-AC and WS-AC were more susceptible to the penetration of electrolyte ions in the solution. It can be seen that CS-AC and WS-AC had lower material resistance and higher ion permeability. This was because the higher specific surface area and relatively developed micropores of CS-AC and WS-AC provided more available channels for the transport of electrons and ions [16,24]. Moreover, C-AC and CS-AC had higher conductivity (0.98–1.02 S/m), followed by JS-AC (0.91 S/m), WS-AC (0.82 S/m), PS-AC (0.68 S/m), and AS-AC (0.12 S/m).
Based on the above results, CS-AC had the characteristics of good capacitance properties, low resistance, high conductivity, and good ion permeability, exhibiting better electrochemical properties than the other types of AC.

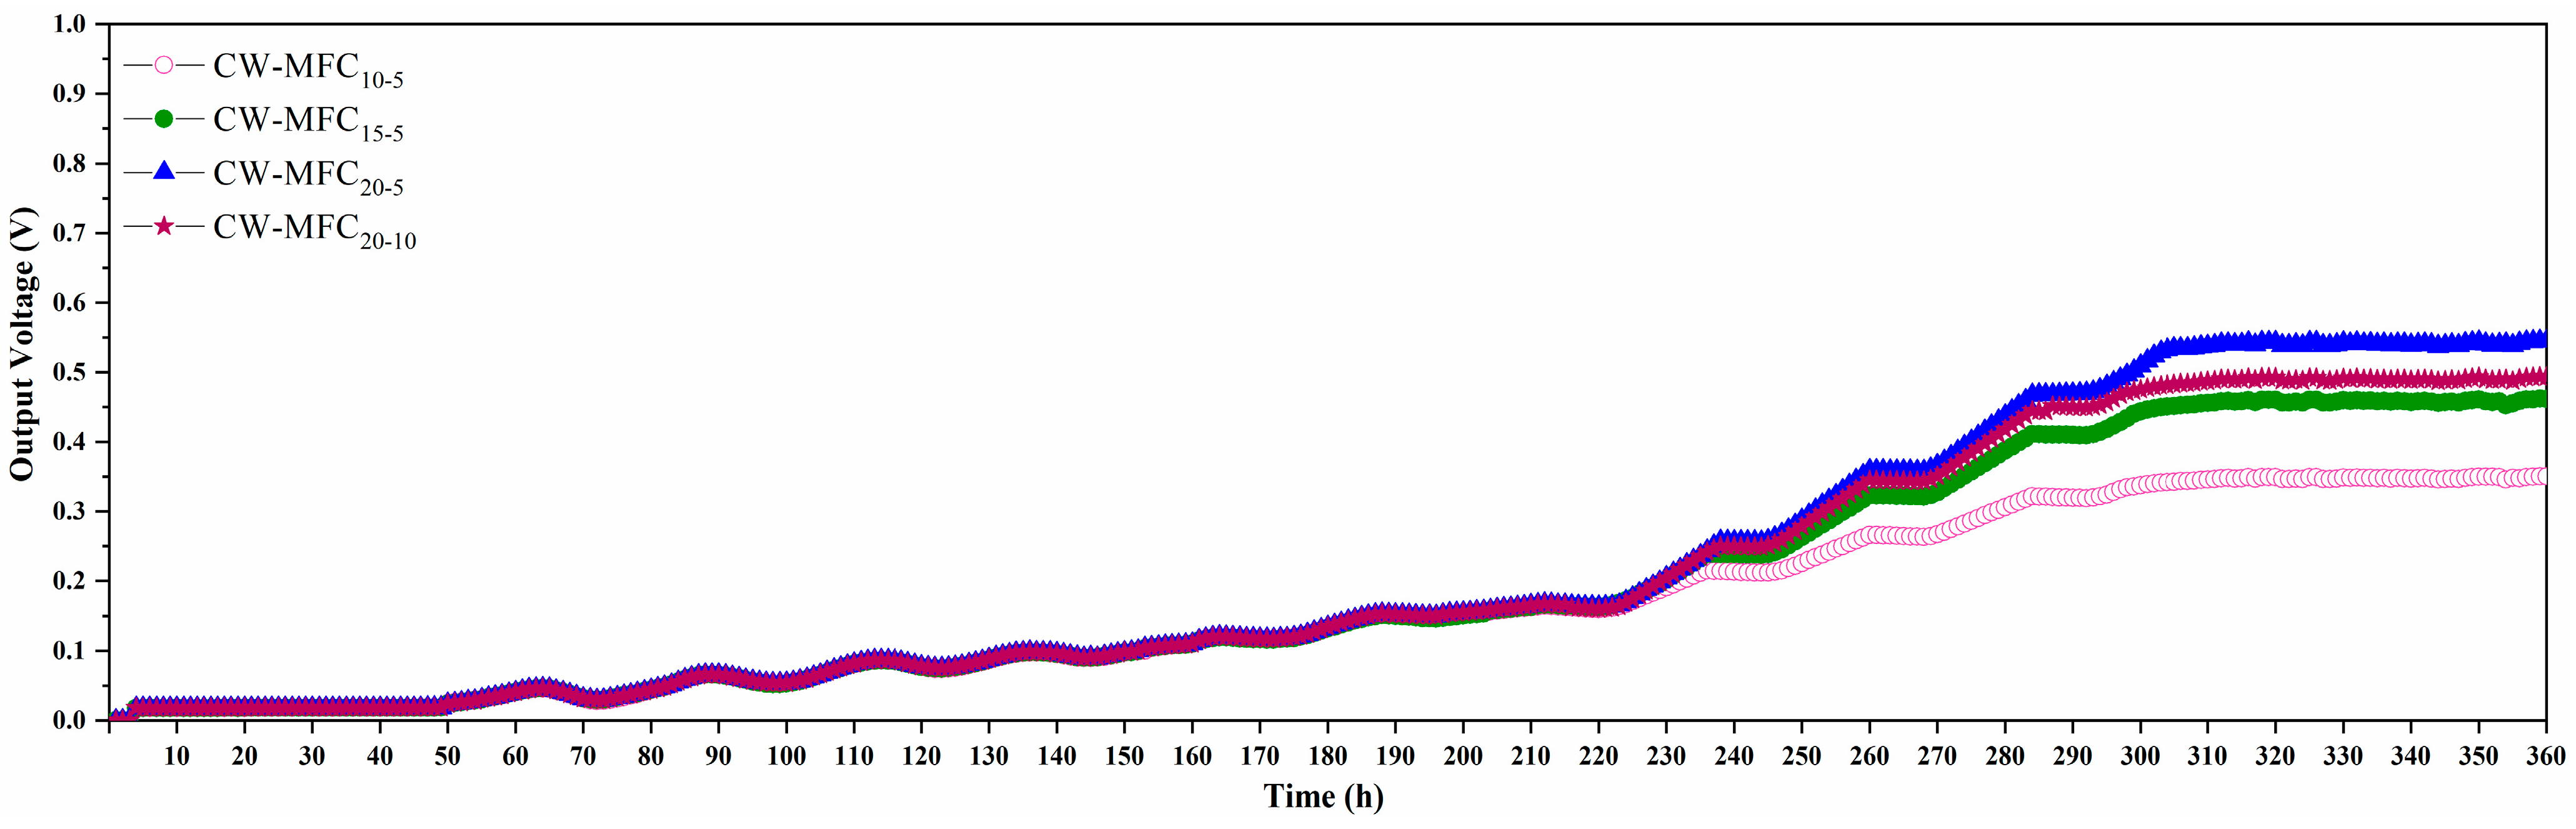
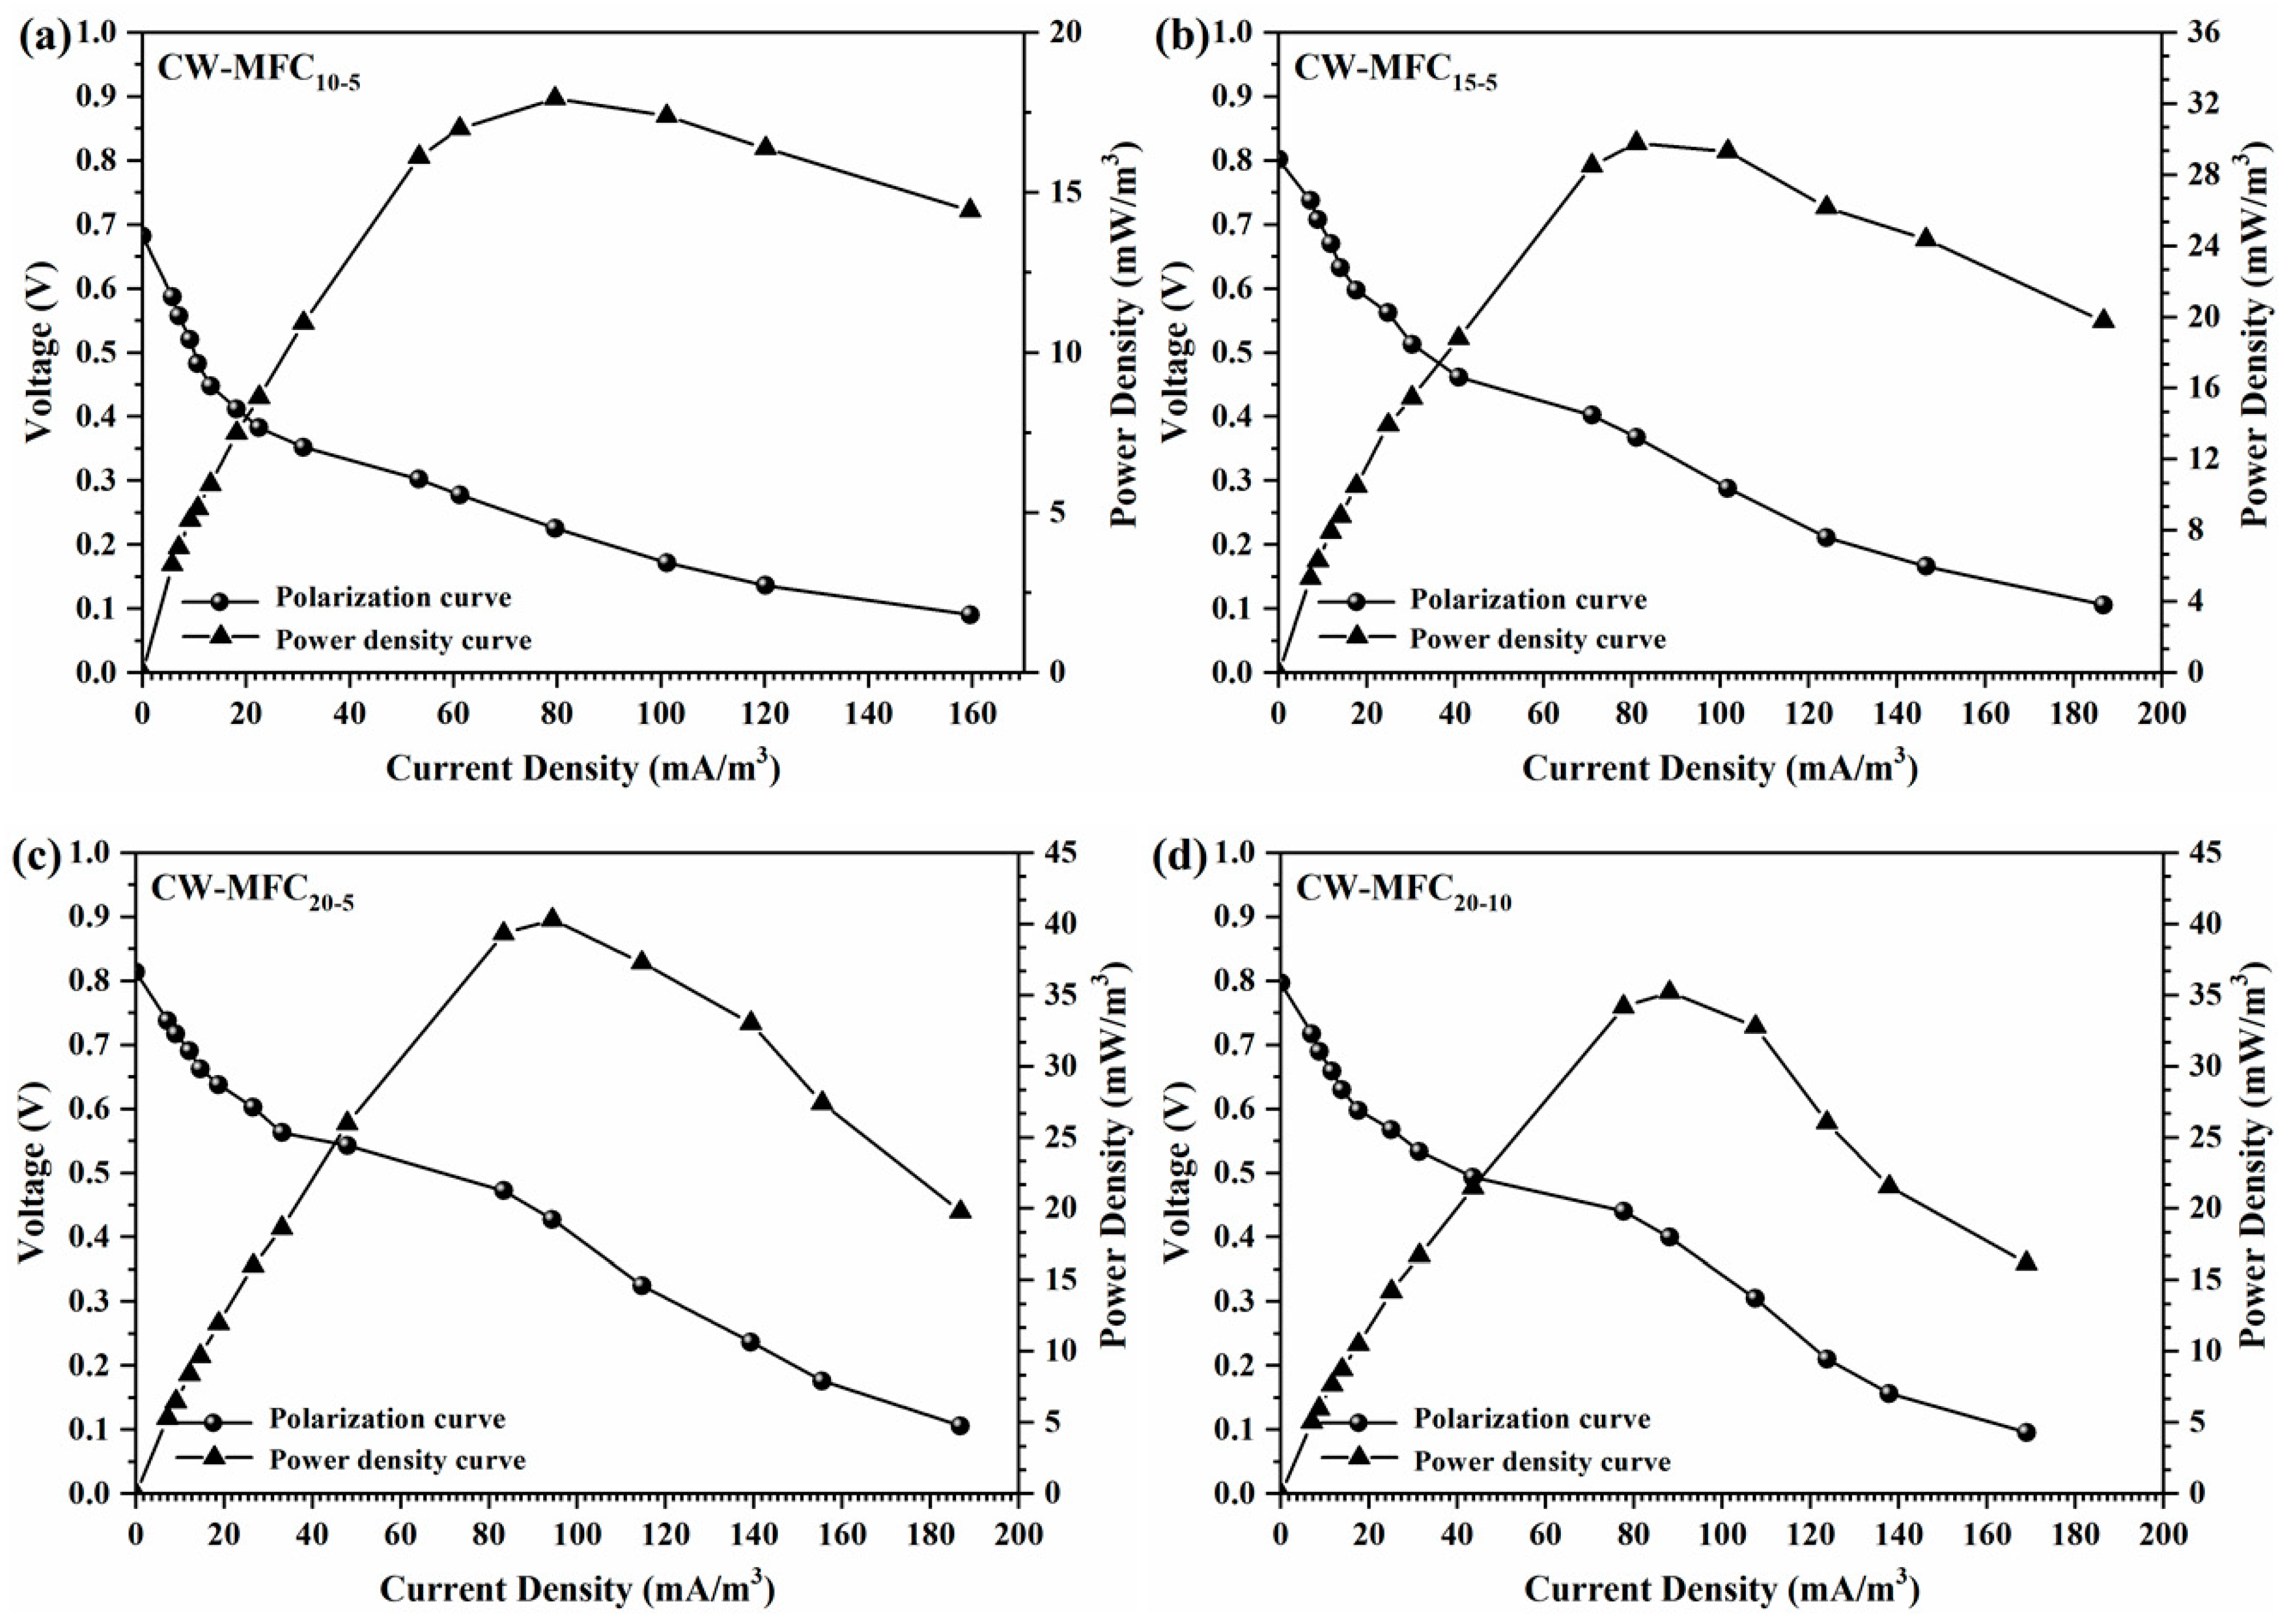
3.4. Electricity Generation and Coulombic Efficiency of CW–MFC Systems

The CS-AC was selected as the CW substrate and the MFC anode because of its higher nitrogen adsorption capacity and better electrochemical properties as compared to other types of AC. As illustrated in Figure 7, the output voltage of the four integrated CW–MFCs showed the same pattern of change. After starting the CW–MFCs, an initial voltage of 0.0176–0.0184 V was observed only approximately 4 h later, which may be due to the chemical and biological reactions caused by the potential difference between cathode and anodes [29]. Then, the output voltage of the CW–MFCs started to increase slowly approximately 50 h later, and the voltage slightly decreased at night because of the light and cooling but showed an overall “fluctuating” upward trend until it reached 0.1637–0.1661 V after another 173 h (about 7.2 days), during which the EAB might be in competition with other microbial populations. Afterward, the increase of the voltage sped up; moreover, the output voltage of the four CW–MFCs started to differ from each other. After another 86 h (about 3.6 days), CW–MFC20-5 achieved the highest reproducible maximum voltages (≈0.54 V), followed by CW–MFC20-10 (≈0.49 V), CW–MFC15-5 (≈0.46 V), and CW–MFC10-5 (≈0.35 V), and the corresponding maximum power densities were 25.71 mW/m3, 21.17 mW/m3, 18.66 mW/m3, and 10.80 mW/m3, respectively. It took nearly 13 days for EAB to adapt and successfully attach to anodes.
It was obvious that the maximum power density of CW–MFCs was positively correlated with the total depth of AC anodes, which was in line with expectations. This was because that the more activated carbon provided a higher total adsorption capacity for pollutants and more attachment surfaces for microorganisms, thereby facilitating the adsorption and biodegradation of pollutants as well as the enrichment and function of EAB. Specifically, the maximum voltage and power density of CW–MFC15-5 were higher than that of CW–MFC10-5 by 31.4% and 72.7%, respectively, but were lower than that of CW–MFC20-5 by only 17.4% and 37.8%, respectively. This demonstrated that the increase in the electricity generation of CW–MFCs would slow down or even stop as the total depth of AC anodes increased to a certain value. This was probably subject to the influent organic loading because the influent organics were unable to provide unlimited carbon sources and electron donors for EAB. The maximum voltage and power density of CW–MFC20-10 were lower than that of CW–MFC20-5 by 9.3% and 17.7%, respectively, and were higher than that of CW–MFC15-5 by only 6.5% and 13.5%, respectively, which indicated that the depth of a single AC anode also influenced the electricity generation of CW–MFCs.
CW–MFC20-5 achieved the highest coulombic efficiency (0.8896%), followed by CW–MFC20-10 (0.8177%), CW–MFC15-5 (0.7908%), and CW–MFC10-5 (0.6708%). Similar to the electricity generation, the increase in the coulombic efficiency of CW–MFCs was influenced by both the total depth of the AC anodes and the influent organic loading. The coulombic efficiency of CW–MFC20-10 was only 3.4% higher than that of CW–MFC15-5 and was 8.1% lower than that of CW–MFC20-5, indicating that a larger depth of a single AC anode was not conducive to the conversion of chemical energy to electric energy by EAB. Based on the influence of the depth of a single AC anode on the electricity generation and coulombic efficiency of CW–MFCs, it was speculated that the depth of a single AC anode would affect the probability of electron transfer to MFC anodes and the occurrence of internal short-circuit.
As illustrated in Figure 8, the polarization curves and power density curves of the four integrated CW–MFCs had the same trend of change: (1) in the low-current density region, the voltage of CW–MFCs decreased rapidly with the increase of current, while the power density continuously increased with the increase of current; (2) in the medium-current density region, the decrease in the voltage of CW–MFCs with the increase of current slowed down while the power density reached its maximum and subsequently decreased as the current increased; (3) in the high-current density region, both the voltage and the power density of CW–MFCs kept decreasing with the increase of current. The internal resistances of CW–MFC10-5, CW–MFC15-5, CW–MFC20-5, and CW–MFC20-10 calculated by the polarization curve slope method were 257.1 Ω, 301.2 Ω, 334.4 Ω, and 352.8 Ω, respectively. It was obvious that the internal resistance of CW–MFCs was positively correlated with the total depth of the AC anodes, while the depth of a single AC anode has a limited effect on the internal resistance of CW–MFCs.
Table 3 summarizes the performances of CW–MFCs in several previous studies. There were great fluctuations in the pollutant removal, power density, and coulombic efficiency of CW-MFCs under different conditions. Compared to other studies, the COD, NH3-N, TN removal, power density, and coulombic efficiency of CW–MFCs in the present study were relatively high. This can be attributed to the large specific surface area, developed pore structure, and high adsorption capacity of AC, which provided a sufficient surface for the adhesion and growth of microbial populations, as well as increased opportunities for EAB to contact and utilize organic matters.

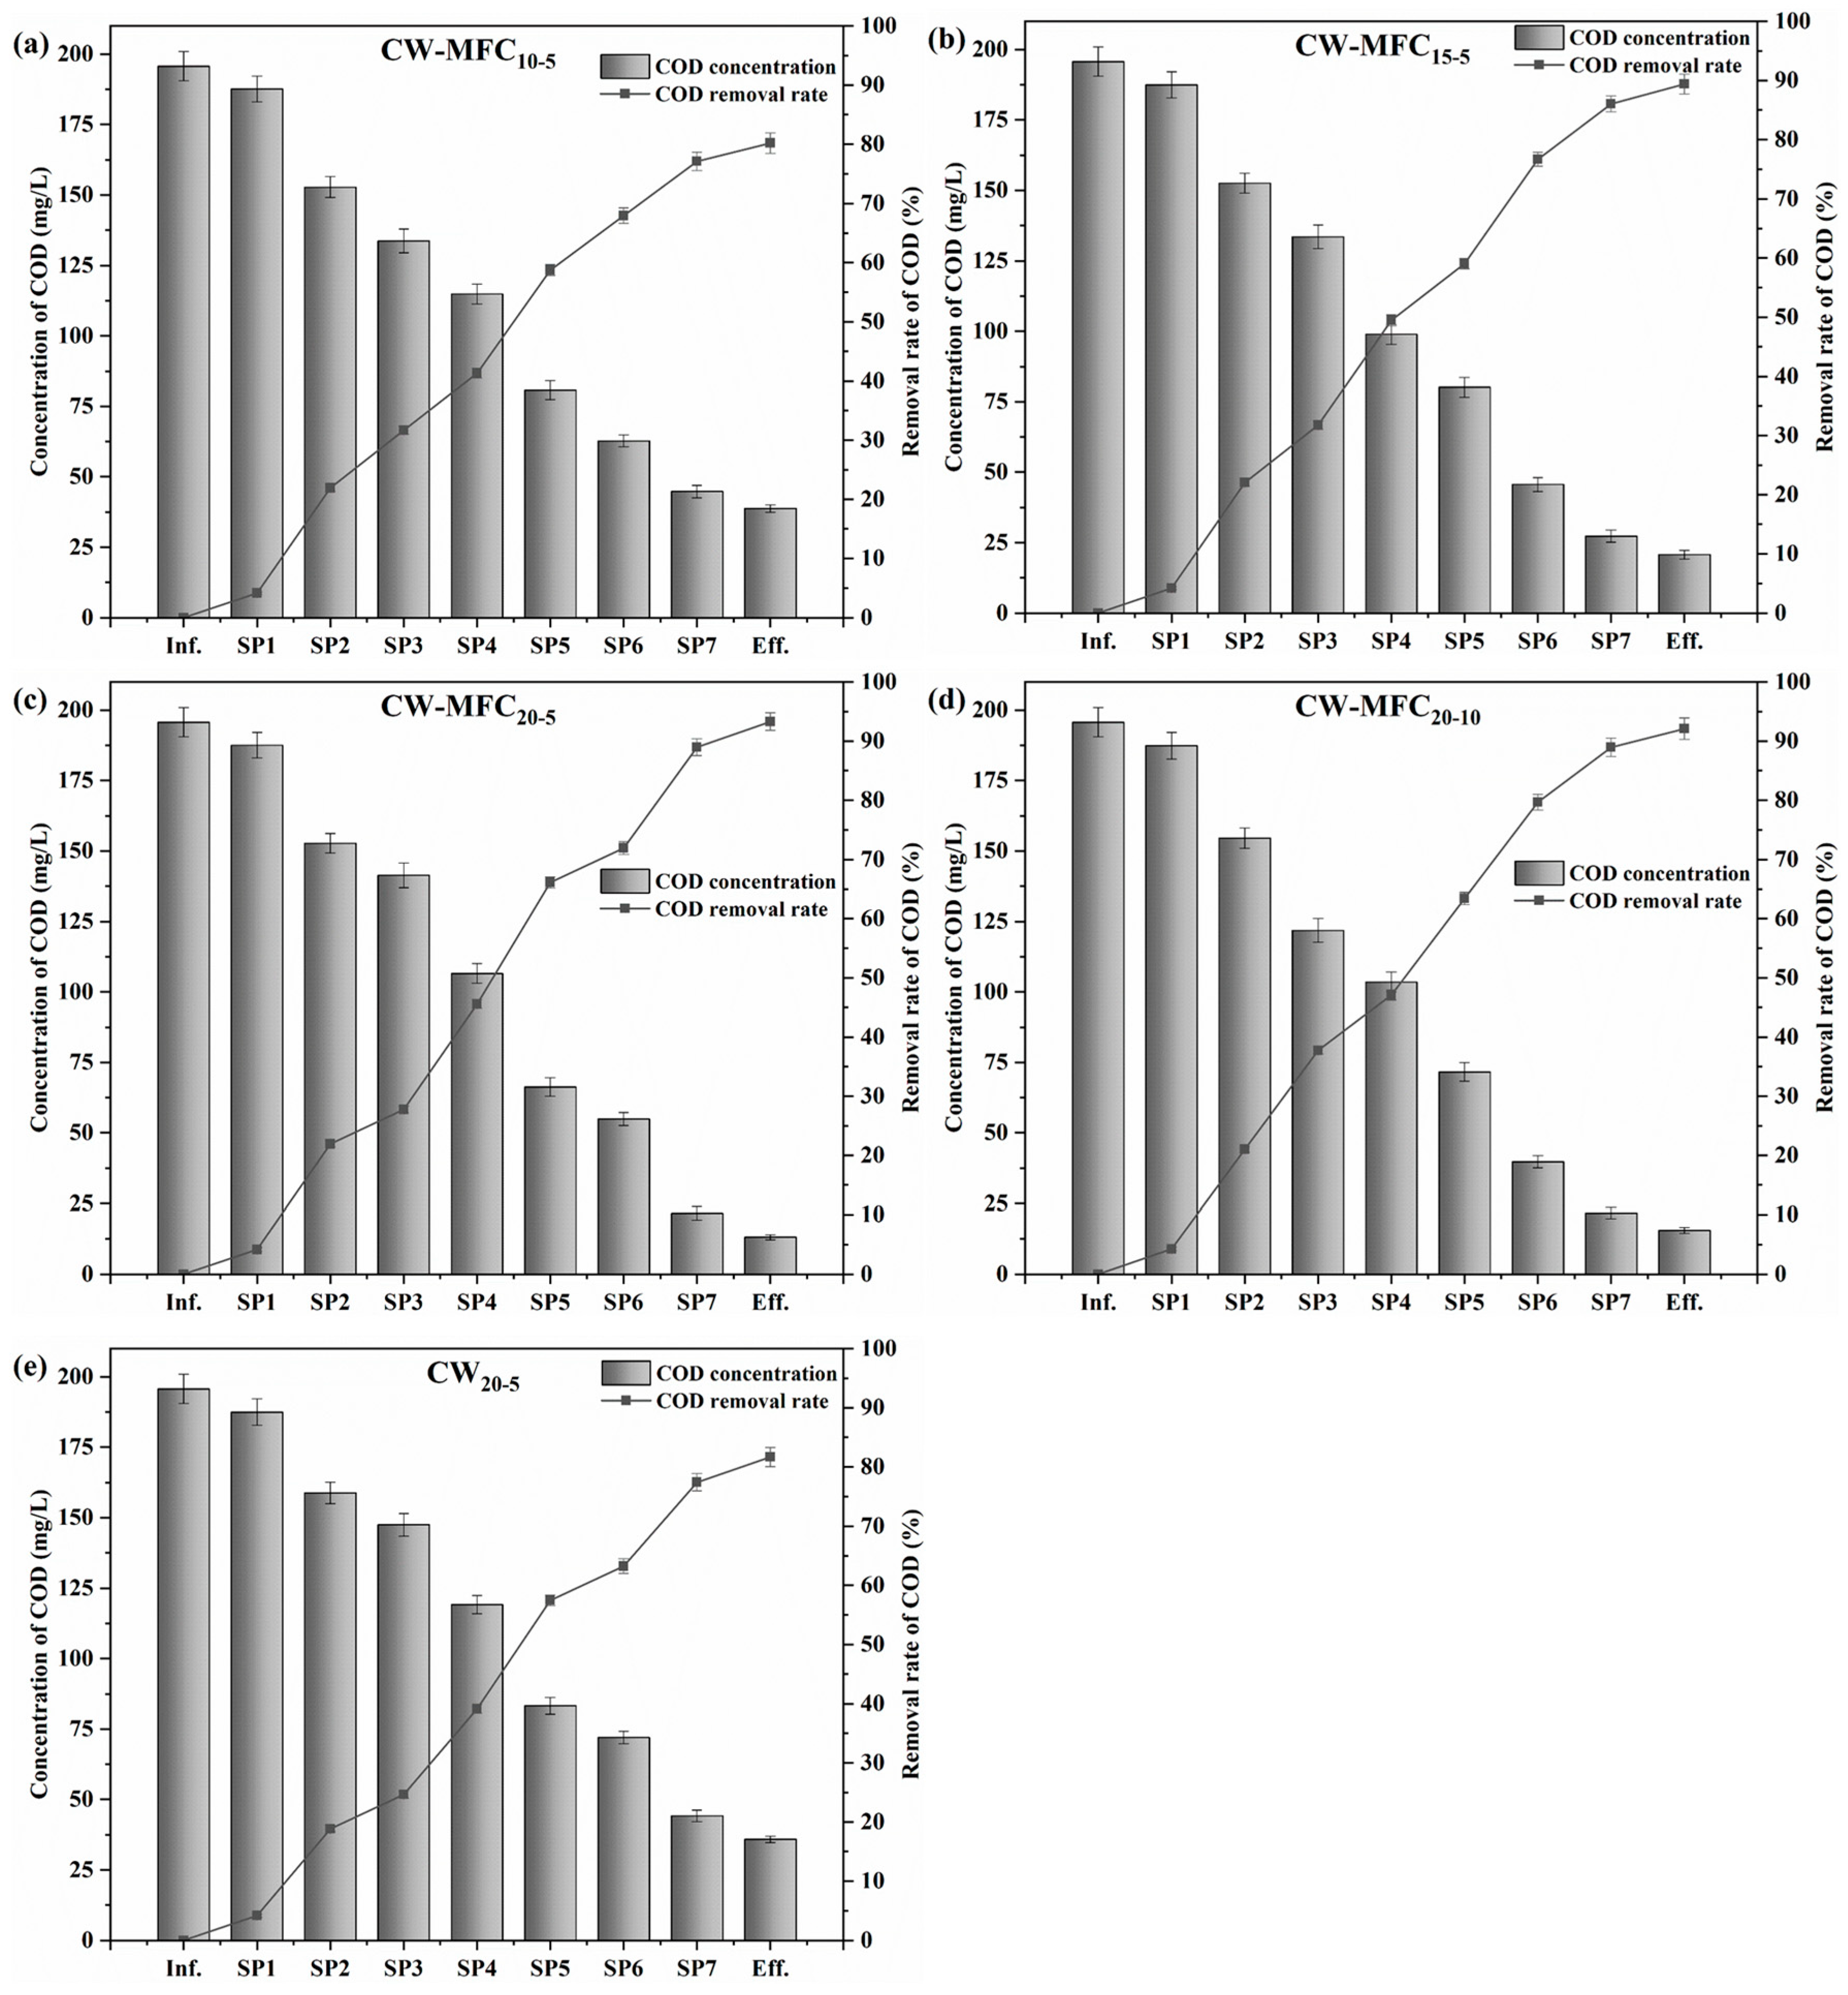
3.5. Organics Removal in CW–MFC Systems

The organics removal in CW–MFC systems is provided in Figure 9a–e. CW–MFC20-5 achieved the highest COD removal (93.30%), followed by CW–MFC20-10 (92.10%), CW–MFC15-5 (89.40%), CW20-5 (81.70%), and CW–MFC10-5 (80.20%), and the corresponding removal load was 38.34 g·m−3·d−1, 37.85 g·m−3·d−1, 36.74 g·m−3·d−1, 33.58 g·m−3·d−1, and 32.96 g·m−3·d−1, respectively. As expected, the COD removal of CW–MFCs was positively correlated with the total depth of the AC anodes. Comparing CW–MFC20-5 and CW20-5, it can be seen that MFCs increased the COD removal of CWs by 11.60%. As described before, MFCs can enhance the anaerobic degradation of organic matters in the anodes because of the high bioreduction efficiency of EAB for organics [2,3,6]. However, the increase of COD removal slowed down as the total depth of AC anodes was above 15 cm, which was similar to the variation trend of electricity generation with the total depth of the AC anodes. The output voltage, power density, and coulombic efficiency of CW–MFC20-5 were higher than that of CW–MFC20-10 by 10.2%, 21.4%, and 8.8%, respectively, showing a significant difference in electricity generation. Theoretically, CW–MFC20-5 should have a significantly higher COD removal than CW–MFC20-10, but in reality, the COD removal of CW–MFC20-5 and CW–MFC20-10 was very close. This was because that the total adsorption capacity of AC increased as its amount increased, which narrowed the difference in COD removal resulting from the promotion of MFCs on organics degradation. It was inferred that EAB would still play an important role in the subsequent degradation of the adsorbed organics, slowing down the rate of adsorption reaching saturation or even alleviating the occurrence of clogging in CWs.
Calculated from the profile of COD concentrations across the systems, the average COD removal load of each type of substrate was 1.72 g·m−3·d−1 for gravel; 3.99 g·m−3·d−1 for lava; 1.31 g·m−3·d−1 for soil; 7.31 g·m−3·d−1 for AC in CW–MFC10-5, CW–MFC15-5, and CW–MFC20-5; 6.76 g·m−3·d−1 for AC in CW–MFC20-10; and 6.02 g·m−3·d−1 for AC in CW20-5. This further demonstrated that the adsorption capacity of AC was much higher than other types of substrates, and EAB greatly promoted organics degradation on the anodes. Moreover, the 5-cm-deep AC anode was more effective than the 10-cm-deep anode in promoting organics degradation, which was also verified by the higher electricity generation and coulombic efficiency of CW–MFC20-5.

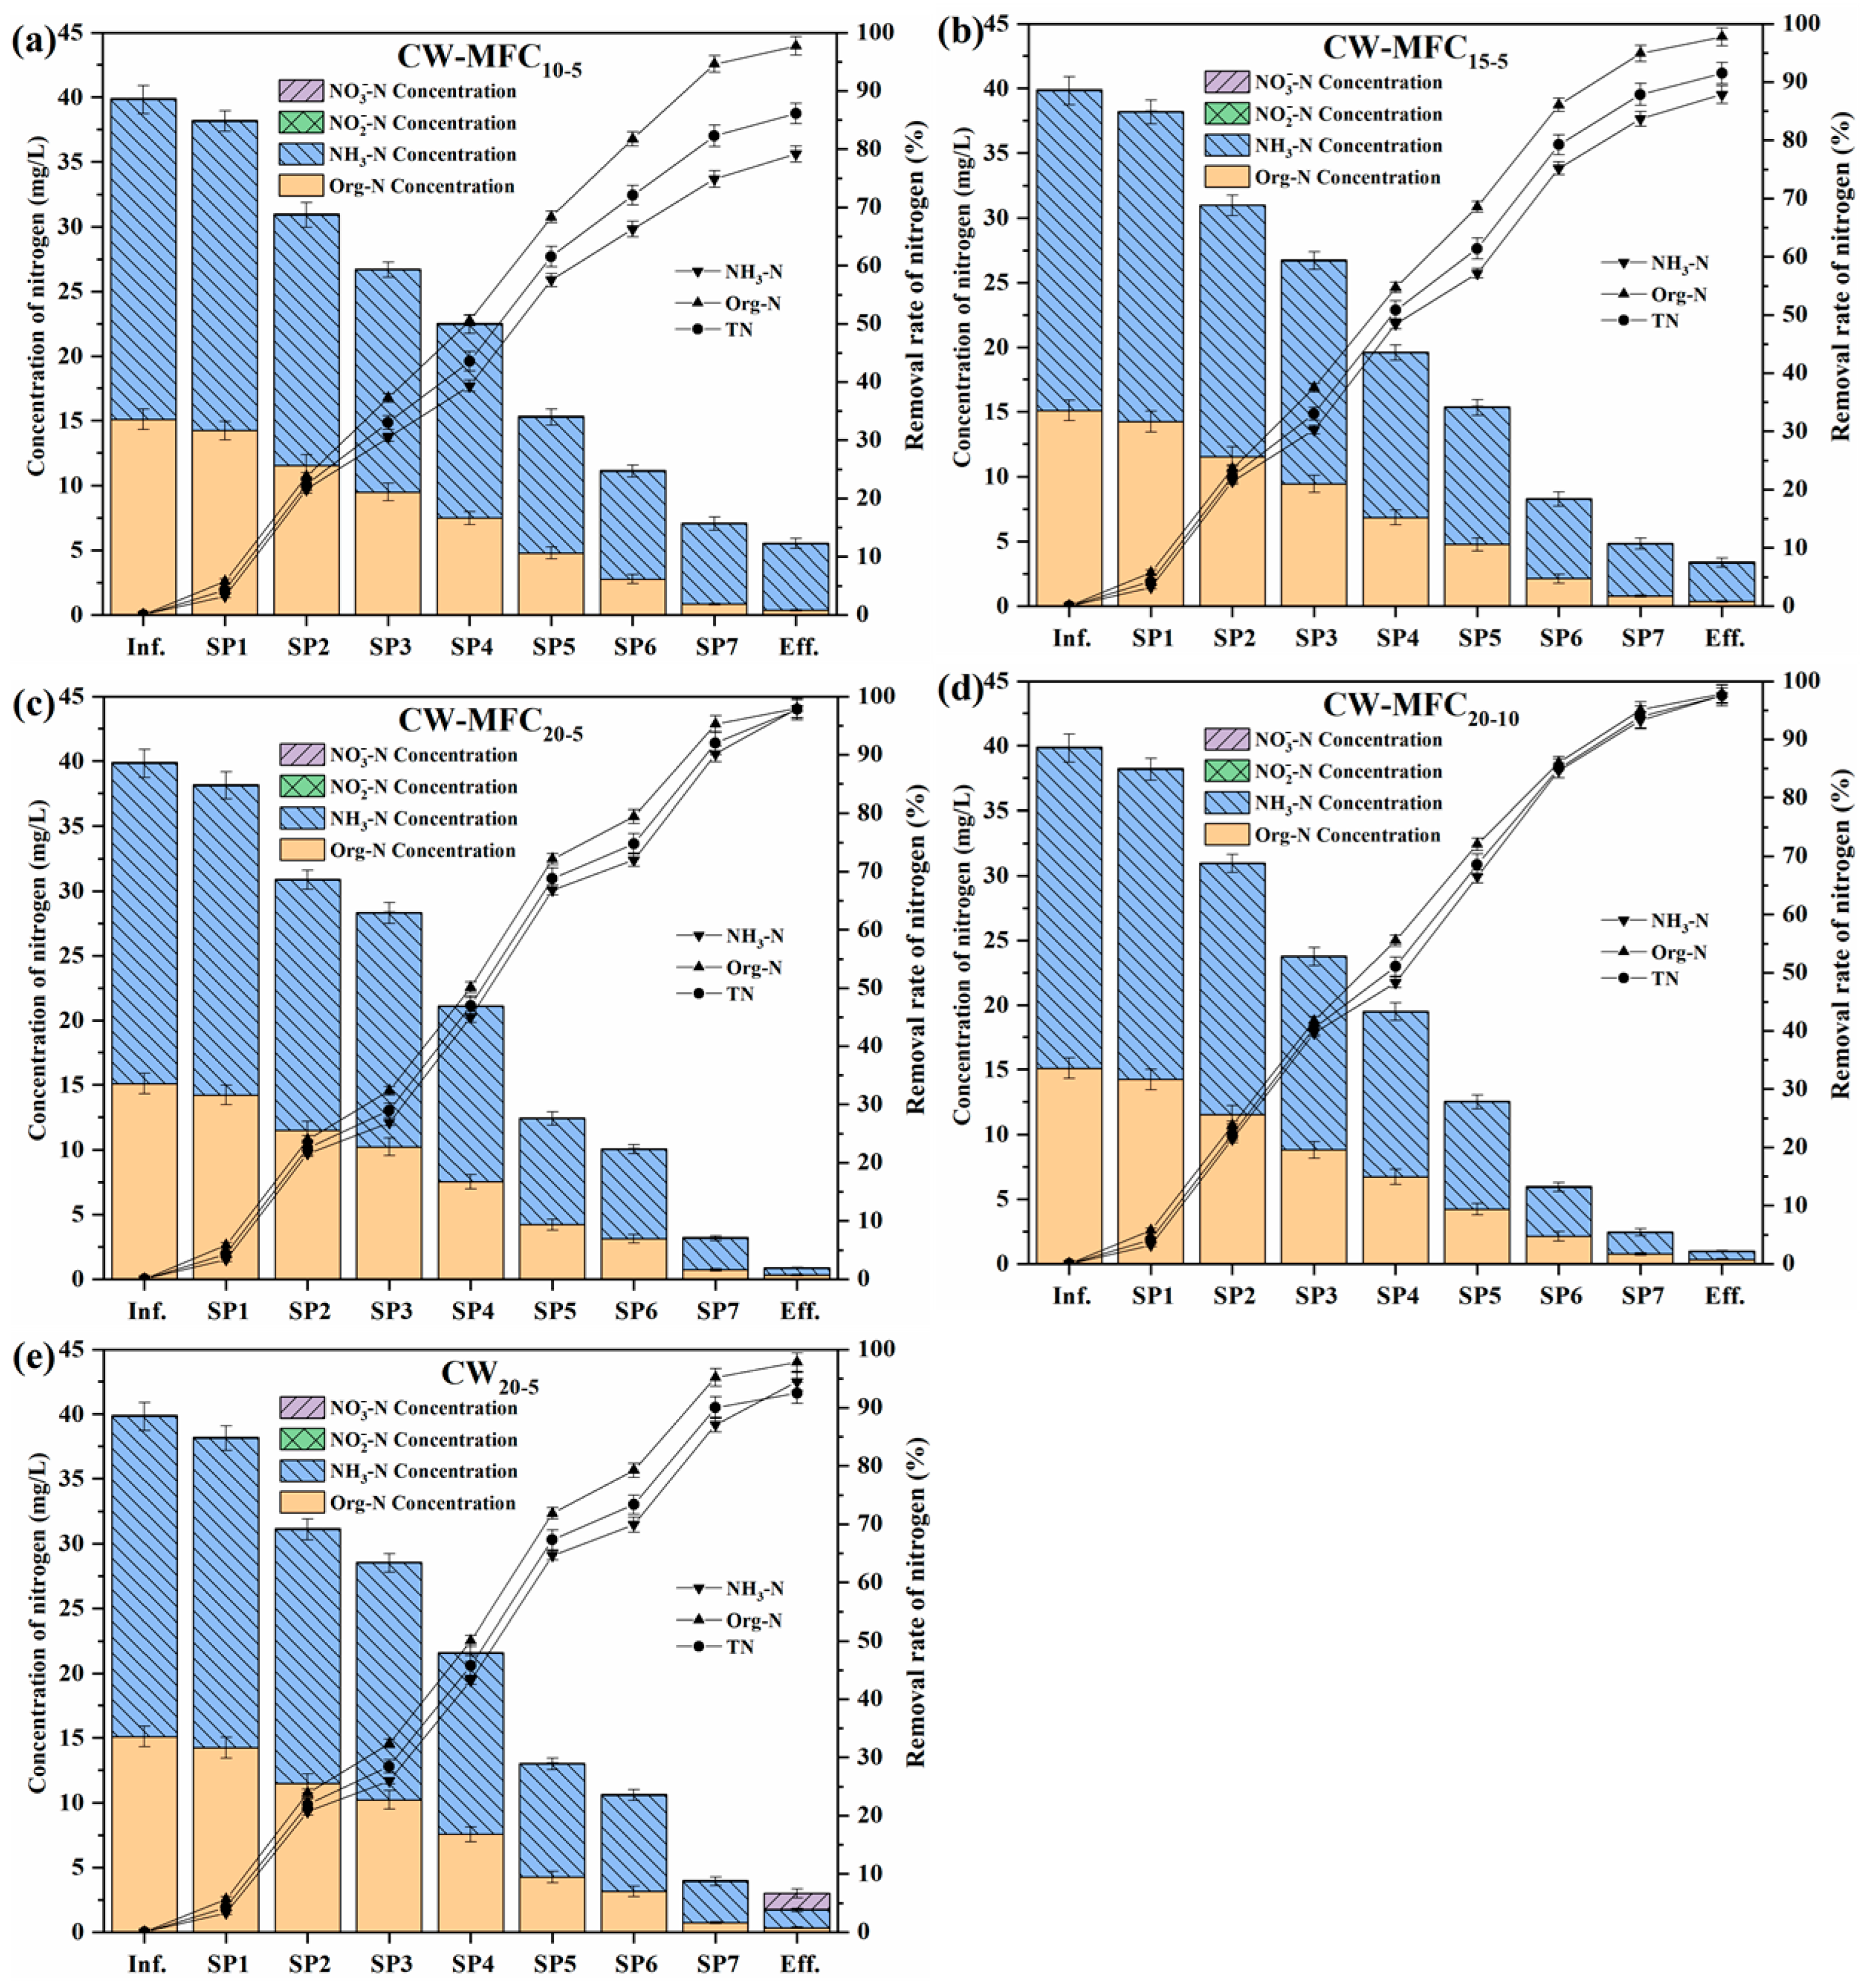
3.6. Nitrogen Removal in CW–MFC Systems

The distribution and removal of nitrogen in CW–MFC systems is provided in Figure 10a–e. The NH3-N and Org-N in influents accounted for approximately 61.95% and 37.84% of TN, respectively. The Org-N removal in the four CW–MFCs and CW20-5 were similar, and the removal rates and loads were 97.68–97.95% and 3.10–3.11 g·m−3·d−1, respectively. Org-N was readily converted to NH3-N through ammonification under either aerobic or anaerobic/anaerobic conditions [39]. Therefore, MFCs and the depth of AC anodes hardly influenced the Org-N removal in CW–MFCs. CW–MFC20-5 achieved the highest NH3-N removal (97.86%), followed by CW–MFC20-10 (97.45%), CW20-5 (94.46%), CW–MFC15-5 (87.82%), and CW–MFC10-5 (79.13%), and the corresponding removal load was 5.08 g·m−3·d−1, 5.06 g·m−3·d−1, 4.90 g·m−3·d−1, 4.56 g·m−3·d−1, and 4.11 g·m−3·d−1, respectively. The NH3-N removal of CW20-5 was lower than that of CW–MFC20-5 by only 3.4%, but was higher than that of CW–MFC15-5 and CW–MFC10-5 by 6.63% and 15.33%, respectively. The NH3-N removal of CW–MFC20-5 and CW–MFC20-10 was almost the same despite the higher electricity generation and coulombic efficiency of CW–MFC20-5. It can be concluded that adsorption and subsequent biodegradation played a major role in the NH3-N removal of wetland systems, while MFCs slightly enhanced the microbial assimilation of NH3-N by 3.4%. MFCs can stimulate the degradation of organic matters by fostering more efficient degradation pathways carried out by EAB [2,3,4,5,6], and thereby synchronously promoting the microbial assimilation of NH3-N. The concentration of N O 2 -N and N O 3 -N across substrate layers was only 0.01–0.03 mg/L and 0.02–0.05 mg/L, respectively, which was due to the dominated anoxic/anaerobic environment inside CWs. In the effluent of CW20-5, the N O 3 - -N concentration increased to 1.24 mg/L because of the aerobic condition on the substrate surface. However, no accumulation of N O 3 -N was observed in the effluent of CW–MFCs. Wang et al. [40] reported that the MFC improved N O 3 -N removal in a CW–MFC by an average of 40.2%, and the abundance of nitrobacteria and denitrifying bacteria was greatly promoted. Xu et al. [41] designed a three bio-cathode CW–MFC and found that the systematic nitrification/denitrification rate was increased by 82%. This was because the bacteria on MFC cathodes can use the electrons produced by EAB to reduce N O 2 -N and N O 3 -N to N2, resulting in the promotion of nitrogen removal in CW–MFCs [7,8]. N O 2 -N is highly unstable and is an intermediate product in both nitrification and denitrification reactions, hence, the N O 2 -N concentration in CW–MFCs and CWs was always very low. Based on the conversion and removal of Org-N, NH3-N, N O 2 -N, and N O 3 -N, the TN removal was the highest in CW–MFC20-5 (97.79%), followed by CW–MFC20-10 (97.49%), CW20-5 (92.51%), CW–MFC15-5 (91.50%), and CW–MFC10-5 (86.09%), and the corresponding TN removal load was 8.19 g·m−3·d−1, 8.17 g·m−3·d−1, 7.75 g·m−3·d−1, 7.67 g·m−3·d−1, and 7.21 g·m−3·d−1, respectively. Comparing CW–MFC20-5 with CW20-5, it can be seen that the MFC increased TN removal of CW–MFC by 5.29%. This was owing to the microbial assimilation of NH3-N in anodes and microbial denitrification in cathodes enhanced by MFCs.
Calculated from the profile of nitrogen concentrations across the systems, the average NH3-N removal load of each type of substrate was 0.17 g·m−3·d−1 for gravel; 0.46 g·m−3·d−1 for lava; 0.22 g·m−3·d−1 for soil; 0.95 g·m−3·d−1 for AC in CW–MFC10-5, CW–MFC15-5, CW–MFC20-5 and CW–MFC20-10; and 0.90 g·m−3·d−1 for AC in CW20-5. The average TN removal load was 0.35 g·m−3·d−1 for gravel; 0.90 g·m−3·d−1 for lava; 0.52 g·m−3·d−1 for soil; 1.53 g·m−3·d−1 for AC in CW–MFC10-5, CW–MFC15-5, CW–MFC20-5 and CW–MFC20-10; and 1.48 g·m−3·d−1 for AC in CW20-5. This further demonstrated the much higher adsorption capacity of AC than other types of substrates, and the promotion of EAB on the microbial assimilation of NH3-N in anodes was limited.

3.7. Microbial Activity in CW–MFC Systems

3.7.1. Enzymatic Activity

The enzymatic activities in CW–MFC20-5, CW–MFC20-10, and CW20-5 are provided in Table 4. The enzymes in CWs mainly come from the secretion of wetland plants and microorganisms themselves and their release during the decay process after death. Enzymes participate in various life processes of wetland organisms, and enzymatic activity can directly reflect the activity of microorganisms in wetlands, which is an important indicator of microbial community structure. DHA participates in the microbial degradation of organic matters by catalyzing the transfer of hydrogen to electron acceptors, and DHA activity can indicate the ability of microorganisms to degrade organics [42]. CAT catalyzes the oxidation of organics by hydrogen peroxide through double electron transfer, and CAT activity is closely related to the metabolism of aerobes [42]. AMO can convert NH3-N to hydroxylamine during nitrification, and AMO activity directly affects the removal of NH3-N [43]. The enzymatic activity of biofilm on gravel, lava, soil, and plant roots in CW–MFC20-5, CW–MFC20-10, and CW20-5 was similar, respectively, while the enzymatic activity of AC (MFC anodes) in CW–MFC20-5 was higher than that in CW20-5 by 10.33% DHA, 8.72% CAT, and 7.35% AMO. This indicated that MFCs effectively enhanced the enzymatic activity of biofilm on AC substrates (MFC anodes) in CW–MFC, thereby promoting the removal of organics and nitrogen. The enzymatic activity of AC in CW–MFC20-5 was higher than that in CW–MFC20-10 by 1.36% DHA, 1.69% CAT, and 0.72% AMO, which demonstrated that the depth of a single AC anode has a slight impact on its enzymatic activity. As has been noted, the depth of a single AC anode would affect the probability of electron transfer to MFC anodes and the occurrence of internal short-circuit; subsequently, it affects the electricity generation and pollutant removal of CW–MFCs. In CW–MFC20-5, the enzymatic activity of biofilm on AC was higher by 30.48% DHA, 8.66% CAT, and 15.0% AMO than that on gravel; by 12.32% DHA, 7.95% CAT, and 11.0% AMO than that on lava; and by 13.53% DHA and 4.26% CAT than that on soil. AC had more developed specific surface area and pore structure, providing a rich attachment surface for microbial growth as well as more carbon sources and nutrients for microbes through higher adsorption capacity, plus the current stimulation of MFCs and the enrichment of EAB with higher bioreduction efficiency; consequently, the biofilm on AC had higher enzymatic activity than that on other types of substrates. The enzymatic activity of plant roots in CW–MFC20-5 was higher than that of AC by 7.53% DHA, 23.84% CAT, and 27.01% AMO. This was mainly due to the radial oxygen loss and exudates from the roots, which provided oxygen and carbon sources for the microbial growth [18]. The DHA activity of MFC cathode in CW–MFC20-5 was 53.76% lower than that of AC. This may be due to the much lower organics concentration in the cathodes of up-flow CW–MFCs. Because the MFC cathode is located on the substrates surface (aerobic environment), CAT and AMO activity of MFC cathode in CW–MFC20-5 were 21.12% and 21.38% higher than that of AC, respectively.

3.7.2. Nitrification and Denitrification Potential

The nitrification and denitrification potentials in CW–MFC20-5, CW–MFC20-10, and CW20-5 is provided in Table 5. The vast majority of nitrogen in CWs is ultimately removed through microbial nitrification-denitrification [39,44]. Nitrification potential refers to the intensity of the oxidation of NH3-N into N O 2 -N and N O 3 -N under the action of nitrifying bacteria, while denitrification potential refers to the amount of denitrification products (NO, N2O, and N2) produced by denitrifying bacteria within a certain period of time. The nitrification/denitrification intensities of gravel, lava, soil, and plant roots in CW–MFC20-5, CW–MFC20-10, and CW20-5 were similar, respectively, while the nitrification and denitrification intensities of AC (MFC anodes) in CW–MFC20-5 were higher than that in CW20-5 by 9.53% and 6.68%, respectively. This was mainly due to the current stimulation of MFCs and the enrichment of EAB with higher bioreduction efficiency. The nitrification and denitrification intensities of AC in CW–MFC20-5 was higher than that in CW–MFC20-10 by 2.66% and 1.84%, respectively, which indicated that the depth of a single AC anode has a slight impact on its nitrification/denitrification intensities. In CW–MFC20-5, the nitrification intensity of AC was higher than that of gravel, lava, and soil by 21.07%, 22.89%, and 6.68%, respectively. This was due to the promotion of MFCs as well as the richer pore structure of AC, which was conducive to the mass transfer of dissolved oxygen. In CW–MFC20-5, the nitrification intensity of plant roots was higher than that of AC by 19.24%, which was mainly due to the aerobic microenvironment in the rhizosphere, and, correspondingly, the denitrification intensity of plant roots was 45.93% lower than that of AC. The nitrification intensity of the MFC cathode in CW–MFC20-5 was 10.38% higher than that of AC, which was due to the aerobic environment on the substrates surface. Because the bacteria on the MFC cathodes can utilize electrons produced by EAB to reduce N O 2 -N and N O 3 -N to N2, the denitrification intensity of the MFC cathode was also relatively high, which was similar to that of gravel, lava, and soil under anaerobic/anaerobic environments and was 14.61% lower than that of AC.

3.8. Microbial Diversity in CW–MFC Systems

The microbial diversity in CW–MFC20-5, CW–MFC20-10, and CW20-5 is provided in Table 6. The diversity and richness of the microbial communities of gravel, lava, soil, and plant roots in CW–MFC20-5, CW–MFC20-10, and CW20-5 were similar, respectively, while the microbial diversity of AC (MFC anodes) in CW–MFC20-5 was higher than that of CW20-5 by 3.85% species, 4.07% Shannon, 1.64% Simpson, 3.37% Chaol, and 3.96% ACE. The microbial diversity of AC in CW–MFC20-5 was similar to that in CW–MFC20-10 but was higher than that of other types of substrates by 1.12–6.16%. This indicated that the depth of a single AC anode did not influence the microbial diversity. The MFC cathodes showed the lowest microbial diversity. This was because of the aerobic environment on the substrates’ surface, which resulted in the enrichment of aerobes on MFC cathodes. The plant roots showed the highest microbial diversity, which was due to the root exudates and the abundant aerobic/anoxic/anaerobic microenvironment in the rhizosphere.
As shown in Figure 11, the microbial community in CW–MFCs was mainly composed of 10 phyla, and the four most abundant microorganisms were Proteobacteria (38.38–54.28%), Bacteroidetes (2.10–30.01%), Actinobacteria (5.93–21.13%), and Firmicutes (1.94–19.58%). Up to now, the validated EAB in CW–MFCs are mainly distributed in Proteobacteria, Firmicutes, Acidobacteria, and Bacteroidetes, etc., and the common genera include Geobacter, Desulfobulbus, Pseudomonas, and Desulfovibrio [40,45]. The total proportion of Proteobacteria, Bacteroidetes, Firmicutes, and Acidobacteria on AC (MFC anodes) in CW–MFC20-5 and CW–MFC20-10 was 85–86%, which was higher than that on gravel, lava, soil, plant roots, and MFC cathodes, as well as AC in CW20-5. This proved that there is enrichment of EAB on AC anodes. Furthermore, the genera of EAB such as Citrobacter, Geobacter, and Pseudomonas accounted for 15.58–16.64% of the microbial community on AC anodes, which was much higher than that on the other parts of CW–MFCs (2.06–3.59%). EABs possess high bioreduction efficiencies for complex macromolecular organics through sophisticated electron transfer pathways, including microbial nanowires, electron shuttle, electrokinetic movement, and polyheme c-type cytochrome [3,4,5]. For example, Zhang et al. [3] summarized that many EABs include Pseudomonas, Shewanella, Geobacter, Desulfovibrio, Enterobacter, Enterococcus, Comamonas, Clostridium acetobutylicum, and Rhodobacter capsulatus had extraordinary bioreduction capability for nitroaromatic compounds (NACs), and the recognized electron transfer pathways for NACs reduction were: (1) the direct transport of intracellular electrons released from the electron donor substrate to the nitroreductase by membrane electron transfer chain, and (2) the reverse transmembrane electron transport pathway for biocathodic reduction. Richter et al. [46] reported that Geobacteracea had the ability to reduce insoluble oxidants without apparent reliance on soluble extracellular electron transfer mediators, and OmcB (outer membrane c-type cytochrome B) and OmcZ played important roles in the extracellular electron transfer of Geobacteracea. Jiang et al. [47] reported that Shewanella oneidensis MR-1 promoted electron transfer activity via the formation of nanotubes between cells, which resulted in the increase of denitrification enzymes activity, carbon source metabolism, ATP levels and cell viability, and the improvement of denitrification with the reduction of nitrite accumulation and N2O emission was therefore achieved. Overall, the electron transfer pathways of EABs for organics bioreduction are quite complicated, which calls for further investigation.

4. Practical Applications and Future Research Prospects

CWs have found wide applications in treating various wastewaters due to the characteristics of low cost, convenient operation and maintenance, no secondary pollution, good landscape, and realization of water recycling. MFCs were capable to promote the organics and nitrogen removal of CWs through the sophisticated electron transfer pathways of EAB. In the current research on CW–MFCs, the MFC electrodes and CW substrates were relatively independent. This study designed an integrated CW–MFC system using granular AC as both CW substrates and MFC anodes, combining the electrochemical performance, adsorption capacity and biofilm degradation to further enhance the organics and nitrogen removal in CW–MFCs. This study provided a new research perspective for CW–MFCs and offered some data for the engineering applications of CW–MFCs.
The future research on CW–MFCs using AC as both CW substrates and MFC anodes will mainly focus on the following two aspects: (1) the nitrogen mass balance and the microbial response of CW–MFCs, so as to reveal the synergistic mechanism of the electrochemical performance, the adsorption capacity, and the biofilm degradation of AC in enhancing nitrogen removal in CW–MFCs, and (2) the environmental and economic analyses of a large-scale CW–MFC system treating real wastewaters based on long-term monitoring data (e.g., MFCs lifespan, electricity generation, wastewater treatment efficiency, greenhouse gas emissions, costs), so as to comprehensively evaluate the cost-effectiveness and practicality of CW–MFCs using AC.

5. Conclusions

The nitrogen adsorption by AC tended to be a linear process in which physical adsorption played a leading role and micropores made great contributions. The higher specific surface area, relatively developed mesopores, and oxygen functionalities were conducive to the capacitance properties of AC, while the higher specific surface area and relatively developed micropores were conducive to reduce material resistance and improve ion permeability. Overall, CS-AC had both excellent nitrogen adsorption capacity and electrochemical properties, making it ideal as both CW substrates and MFC anodes for CW–MFCs. The electricity generation, coulombic efficiency, and organics and nitrogen removal of CW–MFCs were positively correlated with the total depth of AC anodes, but the increase in CW–MFCs performance slowed down as the total depth of AC anodes increased to a certain value. The total depth of AC anodes can be determined based on the influent organics/nitrogen loadings and organics/nitrogen removal load of AC, and a relatively smaller depth of a single AC anode (5 cm) was recommended. The MFC effectively improved the enzymatic activity (by 10.33% DHA, 8.72% CAT, and 7.35% AMO), nitrification/denitrification intensity (by 9.53%/6.68%), and microbial diversity (by 1.64–4.07%) on AC (MFC anodes) in CW–MFCs, while the depth of a single AC anode barely influenced the microbial activity and diversity. MFCs increased COD and NH3-N removal in CW–MFCs by 11.60% and 3.4%, respectively. The increased total adsorption capacity of AC with the increase of its total depth narrowed the difference in COD removal resulting from the promotion of MFCs on organics degradation. MFCs increased TN removal in CW–MFCs by 5.29% through promoting denitrification in cathodes and enhancing NH3-N assimilation in anodes. The phyla of EAB (Proteobacteria, Bacteroidetes, Firmicutes, Acidobacteria) and genera of EAB (Citrobacter, Geobacter, Pseudomonas) accounted for 85–86% and 15.58–16.64% of the microbial community on AC anodes in CW–MFCs, respectively.

Supplementary Materials

The following supporting information can be downloaded at: https://www.mdpi.com/article/10.3390/w16020278/s1 [48,49,50,51,52,53,54,55,56].

Author Contributions

X.W.: conceptualization, methodology, writing—review and editing, supervision, funding acquisition; M.X.: investigation, methodology, formal analysis, writing; Z.W.: investigation, methodology, formal analysis; W.X.: investigation, formal analysis; C.Z.: conceptualization, methodology, supervision. All authors have read and agreed to the published version of the manuscript.

Funding

This work was supported by the Natural Science Foundation of Hebei Province of China (Grant No. E2020202027) and the Central Guidance on Local Science and Technology Development Fund of Hebei Province (Grant No. 226Z3605G).

Data Availability Statement

The data presented in this study are available on request from the corresponding author.

Conflicts of Interest

The authors declare no conflicts of interest.

References

  1. Doherty, L.; Zhao, Y.; Zhao, X.; Hu, Y.; Hao, X.; Xu, L.; Liu, R. A Review of a recently emerged technology: Constructed wetland—Microbial fuel cells. Water Res. 2015, 85, 38–45. [Google Scholar] [CrossRef] [PubMed]
  2. Guadarrama-Pérez, O.; Gutiérrez-Macías, T.; García-Sánchez, L.; Guadarrama-Pérez, V.H.; Estrada-Arriaga, E.B. Recent advances in constructed wetland-microbial fuel cells for simultaneous bioelectricity production and wastewater treatment: A review. Int. J. Energy Res. 2019, 43, 5106–5127. [Google Scholar] [CrossRef]
  3. Zhang, C.L.; Yu, Y.Y.; Fang, Z.; Naraginti, S.; Zhang, Y.; Yong, Y.-C. Recent advances in nitroaromatic pollutants bioreduction by electroactive bacteria. Process Biochem. 2018, 70, 129–135. [Google Scholar] [CrossRef]
  4. Sallam, E.R.; Khairy, H.M.; Elnouby, M.S.; Fetouh, H.A. Sustainable electricity production from seawater using Spirulina platensis microbial fuel cell catalyzed by silver nanoparticles-activated carbon composite prepared by a new modified photolysis method. Biomass Bioenergy 2021, 148, 106038. [Google Scholar] [CrossRef]
  5. Bruce, E. Logan. Microbial Fuel Cells. Wiley Online Library. 2008. Available online: https://aiche.onlinelibrary.wiley.com/doi/10.1002/aic.11634 (accessed on 7 November 2023).
  6. Ji, B.; Zhao, Y.; Vymazal, J.; Mander, Ü.; Lust, R.; Tang, C. Mapping the field of constructed wetland-microbial fuel cell: A review and bibliometric analysis. Chemosphere 2021, 262, 128366. [Google Scholar] [CrossRef] [PubMed]
  7. Naga Samrat, M.V.V.; Kesava Rao, K.; Ruggeri, B.; Tommasi, T. Denitrification of water in a microbial fuel cell (MFC) using seawater bacteria. J. Clean. Prod. 2018, 178, 449–456. [Google Scholar] [CrossRef]
  8. Wang, X.; Tian, Y.; Liu, H.; Zhao, X.; Wu, Q. Effects of influent COD/TN ratio on nitrogen removal in integrated constructed wetland–microbial fuel cell systems. Bioresour. Technol. 2019, 271, 492–495. [Google Scholar] [CrossRef]
  9. Corbella, C.; Puigagut, J.; Garfí, M. Life cycle assessment of constructed wetland systems for wastewater treatment coupled with microbial fuel cells. Sci. Total Environ. 2017, 584–585, 355–362. [Google Scholar] [CrossRef]
  10. Aelterman, P.; Verstraete, W. Bioanode performance in bioelectrochemical systems: Recent improvements and prospects. Trends Biotechnol. 2009, 27, 168–178. [Google Scholar]
  11. Janicek, A.; Fan, Y.; Liu, H. Design of microbial fuel cells for practical application: A review and analysis of scale-up studies. Biofuels 2014, 5, 79–92. [Google Scholar] [CrossRef]
  12. Sallam, E.R.; Fetouh, H.A. Comparative study for the production of sustainable electricity from marine sediment using recyclable low-cost solid wastes aluminum foil and graphite anodes. ChemistrySelect 2022, 7, e202103972. [Google Scholar] [CrossRef]
  13. Liu, H.; Cheng, S.; Logan, B.E. Production of electricity from acetate or butyrate using a single-chamber microbial fuel cell. Environ. Sci. Technol. 2005, 39, 658–662. [Google Scholar] [CrossRef]
  14. Zhang, E.; Wang, F.; Yu, Q.; Scott, K.; Wang, X.; Diao, G. Durability and regeneration of activated carbon air-cathodes in long-term operated microbial fuel cells. J. Power Sources 2017, 360, 21–27. [Google Scholar] [CrossRef]
  15. Wang, J.L.; Guo, X. Adsorption isotherm models: Classification, physical meaning, application and solving method. Chemosphere 2020, 258, 127279. [Google Scholar] [CrossRef] [PubMed]
  16. Saad, M.J.; Sajab, M.S.; Busu, W.N.W.; Misran, S.; Zakaria, S.; Chin, S.X.; Chia, C.H. Comparative adsorption mechanism of rice straw activated carbon activated with NaOH and KOH. Sains Malays. 2020, 49, 2721–2734. [Google Scholar] [CrossRef]
  17. Zhang, J.; Duan, Y.; Jiang, Z.; Chen, T.; Wang, K.; Wang, K.; Zhang, W.; Hu, J. Investigation of the supercapacitance of ruthenium-based/hemp stem activated carbon. J. Phys. Chem. Solids 2021, 153, 110019. [Google Scholar] [CrossRef]
  18. Sandoval, L.; Zamora-Castro, S.A.; Vidal-Alvarez, M.; Marín-Muñiz, J.L. Role of wetland plants and use of ornamental flowering plants in constructed wetlands for wastewater treatment: A review. Appl. Sci. 2019, 9, 685. [Google Scholar] [CrossRef]
  19. Yaglikci, S.; Gokce, Y.; Yagmur, E.; Aktas, Z. The performance of sulphur doped activated carbon supercapacitors prepared from waste tea. Environ. Technol. 2020, 41, 36–48. [Google Scholar] [CrossRef]
  20. Trazzi, P.A.; Leahy, J.J.; Hayes, M.H.B.; Kwapinski, W. Adsorption and desorption of phosphate on biochars. J. Environ. Chem. Eng. 2016, 4, 37–46. [Google Scholar] [CrossRef]
  21. Konneh, M.; Wandera, S.M.; Murunga, S.I.; Raude, J.M. Adsorption and desorption of nutrients from abattoir wastewater: Modelling and comparison of rice, coconut and coffee husk biochar. Heliyon 2021, 7, e08458. [Google Scholar] [CrossRef]
  22. Nguyen, B.T.; Dinh, G.D.; Dong, H.P.; Le, L.B. Sodium adsorption isotherm and characterization of biochars produced from various agricultural biomass wastes. J. Clean. Prod. 2022, 346, 131250. [Google Scholar] [CrossRef]
  23. Elanthamilan, E.; Jennifer, S.J.; Wang, S.-F.; Merlin, J.P. Effective conversion of cassia fistula dry fruits biomass into porous activated carbon for supercapacitors. Mater. Chem. Phys. 2022, 286, 126188. [Google Scholar] [CrossRef]
  24. Elaiyappillai, E.; Srinivasan, R.; Johnbosco, Y.; Devakumar, P.; Murugesan, K.; Kesavan, K.; Johnson, P.M. Low cost activated carbon derived from cucumis melo fruit peel for electrochemical supercapacitor application. Appl. Surf. Sci. 2019, 486, 527–538. [Google Scholar] [CrossRef]
  25. Hossain, M.N.; Chen, S.; Chen, A. Fabrication and electrochemical study of ruthenium-ruthenium oxide/activated carbon nanocomposites for enhanced energy storage. J. Alloys Compd. 2018, 751, 138–147. [Google Scholar] [CrossRef]
  26. Luo, X.Y.; Chen, Y.; Mo, Y. A review of charge storage in porous carbon-based supercapacitors. New Carbon Mater. 2021, 36, 49–68. [Google Scholar] [CrossRef]
  27. Endo, M.; Takeda, T.; Kim, Y.J.; Koshiba, K.; Ishii, K. High power electric double layer capacitor (EDLC’s); from operating principle to pore size control in advanced activated carbons. Carbon Lett. 2001, 1, 117–128. [Google Scholar]
  28. Gandla, D.; Wu, X.D.; Zhang, F.M.; Wu, C.R.; Tan, D.Q. High-performance and high-voltage supercapacitors based on N-doped mesoporous activated carbon derived from dragon fruit peels. ACS Omega 2021, 6, 7615–7625. [Google Scholar] [CrossRef]
  29. Min, B.; Kim, J.; Oh, S.; Regan, J.M.; Logan, B.E. Electricity generation from swine wastewater using microbial fuel cells. Water Res. 2005, 39, 4961–4968. [Google Scholar] [CrossRef]
  30. Yadav, A.K.; Dash, P.; Mohanty, A.; Abbassi, R.; Mishra, B.K. Performance assessment of innovative constructed wetland-microbial fuel cell for electricity production and dye removal. Ecol. Eng. 2012, 47, 126–131. [Google Scholar] [CrossRef]
  31. Zhao, Y.; Collum, S.; Phelan, M.; Goodbody, T.; Doherty, L.; Hu, Y. Preliminary investigation of constructed wetland incorporating microbial fuel cell: Batch and continuous flow trials. Chem. Eng. J. 2013, 229, 364–370. [Google Scholar] [CrossRef]
  32. Liu, S.; Song, H.; Li, X.; Yang, F. Power generation enhancement by utilizing plant photosynthate in microbial fuel cell coupled constructed wetland system. Int. J. Photoenergy 2013, 2013, 172010. [Google Scholar] [CrossRef]
  33. Fang, Z.; Song, H.-L.; Cang, N.; Li, X.-N. Performance of microbial fuel cell coupled constructed wetland system for decolorization of azo dye and bioelectricity generation. Bioresour. Technol. 2013, 144, 165–171. [Google Scholar] [CrossRef] [PubMed]
  34. Villaseñor, J.; Capilla, P.; Rodrigo, M.A.; Cañizares, P.; Fernández, F.J. Operation of a Horizontal subsurface flow constructed wetland-microbial fuel cell treating wastewater under different organic loading rates. Water Res. 2013, 47, 6731–6738. [Google Scholar] [CrossRef] [PubMed]
  35. Doherty, L.; Zhao, Y.; Zhao, X.; Wang, W. Nutrient and organics removal from swine slurry with simultaneous electricity generation in an alum sludge-based constructed wetland incorporating microbial fuel cell technology. Chem. Eng. J. 2015, 266, 74–81. [Google Scholar] [CrossRef]
  36. Fang, Z.; Song, H.; Cang, N.; Li, X. Electricity production from azo dye wastewater using a microbial fuel cell coupled constructed wetland operating under different operating conditions. Biosens. Bioelectron. 2015, 68, 135–141. [Google Scholar] [CrossRef] [PubMed]
  37. Oon, Y.-L.; Ong, S.-A.; Ho, L.-N.; Wong, Y.-S.; Dahalan, F.A.; Oon, Y.-S.; Lehl, H.K.; Thung, W.-E. Synergistic effect of up-flow constructed wetland and microbial fuel cell for simultaneous wastewater treatment and energy recovery. Bioresour. Technol. 2016, 203, 190–197. [Google Scholar] [CrossRef]
  38. Yakar, A.; Türe, C.; Türker, O.C.; Vymazal, J.; Saz, Ç. Impacts of various filtration media on wastewater treatment and bioelectric production in up-flow constructed wetland combined with microbial fuel cell (UCW-MFC). Ecol. Eng. 2018, 117, 120–132. [Google Scholar] [CrossRef]
  39. Vymazal, J. Removal of nutrients in various types of constructed wetlands. Sci. Total Environ. 2007, 380, 48–65. [Google Scholar] [CrossRef]
  40. Wang, J.; Song, X.; Wang, Y.; Abayneh, B.; Li, Y.; Yan, D.; Bai, J. Nitrate removal and bioenergy production in constructed wetland coupled with microbial fuel cell: Establishment of electrochemically active bacteria community on anode. Bioresour. Technol. 2016, 221, 358–365. [Google Scholar] [CrossRef]
  41. Xu, L.; Zhao, Y.; Wang, X.; Yu, W. Applying multiple bio-cathodes in constructed wetland-microbial fuel cell for promoting energy production and bioelectrical derived nitrification-denitrification process. Chem. Eng. J. 2018, 344, 105–113. [Google Scholar] [CrossRef]
  42. Huang, J.; Li, R.; Ma, Y.X.; Cao, C.; Li, X.; Han, T.W.; Cao, M.F. Effects of macrophytes on micro–And nanoplastic retention and cycling in constructed wetlands. Environ. Pollut. 2023, 326, 121259. [Google Scholar] [CrossRef] [PubMed]
  43. Li, B.L.; Yan, W.K.; Wang, Y.; Wang, H.; Zhou, Z.; Li, Y.; Zhang, W.Q. Effects of key enzyme activities and microbial communities in a flocculent-granular hybrid complete autotrophic nitrogen removal over nitrite reactor under mainstream conditions. Bioresour. Technol. 2019, 280, 136–142. [Google Scholar] [CrossRef] [PubMed]
  44. Zhuang, L.L.; Yang, T.; Zhang, J.; Li, X.Z. The configuration, purification effect and mechanism of intensified constructed wetland for wastewater treatment from the aspect of nitrogen removal: A review. Bioresour. Technol. 2019, 293, 122086. [Google Scholar] [CrossRef] [PubMed]
  45. Li, H.; Zhang, S.; Yang, X.L.; Yang, Y.L.; Xu, H.; Li, X.N.; Song, H.L. Enhanced degradation of bisphenol A and ibuprofen by an up-flow microbial fuel cell-coupled constructed wetland and analysis of bacterial community structure. Chemosphere 2019, 217, 599–608. [Google Scholar] [CrossRef]
  46. Richter, H.; Nevin, K.P.; Jia, H.; Lowy, D.A.; Lovley, D.R.; Tender, L.M. Cyclic voltammetry of biofilms of wild type and mutant Geobacter Sulfurreducens on fuel cell anodes indicates possible roles of OmcB, OmcZ, type IV Pili, and protons in extracellular electron transfer. Energy Environ. Sci. 2009, 2, 506. [Google Scholar] [CrossRef]
  47. Jiang, M.; Zheng, X.; Chen, Y. Enhancement of denitrification performance with reduction of nitrite accumulation and N2O emission by Shewanella oneidensis MR-1 in microbial denitrifying process. Water Res. 2020, 169, 115242. [Google Scholar] [CrossRef] [PubMed]
  48. Magoč, T.; Salzberg, S.L. FLASH: Fast length adjustment of short reads to improve genome assemblies. Bioinformatics 2011, 27, 2957–2963. [Google Scholar] [CrossRef]
  49. Bokulich, N.A.; Subramanian, S.; Faith, J.J.; Gevers, D.; Gordon, J.I.; Knight, R.; Mills, D.A.; Caporaso, J.G. Quality-filtering vastly improves diversity estimates from Illuminaamplicon sequencing. Nat. Methods 2013, 10, 57–59. [Google Scholar] [CrossRef]
  50. Caporaso, J.G.; Kuczynski, J.; Stombaugh, J.; Bittinger, K.; Knight, R. QIIME allows analysis of high-throughput community sequencing data. Nat. Methods 2010, 7, 335–336. [Google Scholar] [CrossRef]
  51. Robert, C.E.; Brian, J.H.; Jose, C.C. UCHIME improves sensitivity and speed of chimera detection. Bioinformatics 2011, 27, 2194–2200. [Google Scholar]
  52. Haas, B.J.; Gevers, D.; Earl, A.M.; Feldgarden, M.; Ward, D.V.; Giannoukos, G.; Ciulla, D.; Tabbaa, D.; Highlander, S.K.; Sodergren, E.; et al. Chimeric 16S rRNA sequence formation and detection in Sanger and 454-pyrosequenced PCR amplicons. Genome Res. 2011, 21, 494–504. [Google Scholar] [CrossRef] [PubMed]
  53. Edgar, R.C. UPARSE: Highly accurate OTU sequences from microbial amplicon reads. Nat. Methods 2013, 10, 996–998. [Google Scholar] [CrossRef] [PubMed]
  54. DeSantis, T.Z.; Hugenholtz, P.; Larsen, N. Greengenes, a chimera-checked 16S rRNA gene database and workbench compatible with ARB. Appl. Environ. Microbiol. 2006, 72, 5069–5072. [Google Scholar] [CrossRef] [PubMed]
  55. Wang, Q.; Garrity, G.; Tiedje, J. Naive Bayesian classifier for rapid assignment of rRNA sequences into the new bacterial taxonomy. Appl. Environ. Microbiol. 2007, 73, 5261–5267. [Google Scholar] [CrossRef]
  56. Edgar, R.C. MUSCLE: Multiple sequence alignment with high accuracy and high throughput. Nucleic Acids Res. 2004, 32, 1792–1797. [Google Scholar] [CrossRef]
Figure 1. Specific location of the CW–MFC systems in the present study (Tianjin, China), and the top 10 most productive countries (represented by red triangle) in the CW–MFC study [6].
Water 16 00278 g001
Figure 2. Schematic of the CW–MFC systems (AC, activated carbon).
Water 16 00278 g002
Figure 3. SEM images (af), a FTIR spectra (g) and nitrogen adsorption/desorption isotherms (h) of the activated carbon (C-AC, coal-based activated carbon; CS-AC, coconut-shell-based activated carbon; WS-AC, walnut-shell-based activated carbon; PS-AC, peach-shell-based activated carbon; JS-AC, jujube-shell-based activated carbon; AS-AC, apricot-shell-based activated carbon).
Water 16 00278 g003
Figure 4. Nitrogen adsorption isotherms (af) and nitrogen adsorption kinetics (gl) of the activated carbon.
Water 16 00278 g004aWater 16 00278 g004b
Figure 5. Cyclic voltammetry (CV) curves of the activated carbon (af).
Water 16 00278 g005
Figure 6. Nyquist plot and fitted equivalent circuit diagram for EIS test (ae), galvanostatic charge/discharge (GCD) curves (f) of the activated carbon (C-AC, coal-based activated carbon; CS-AC, coconut-shell-based activated carbon; WS-AC, walnut-shell-based activated carbon; PS-AC, peach-shell-based activated carbon; JS-AC, jujube-shell-based activated carbon; *, multiplication sign).
Water 16 00278 g006
Figure 7. Output voltage of the CW–MFC systems.
Water 16 00278 g007
Figure 8. Polarization curve and power density curve of the CW–MFC systems (ad).
Water 16 00278 g008
Figure 9. Organics removal of the CW–MFC systems (ae). Error bars are plus/minus one standard deviation.
Water 16 00278 g009
Figure 10. Nitrogen removal of the CW–MFC systems (ae). Error bars are plus/minus one standard deviation.
Water 16 00278 g010
Figure 11. Relative abundance at phylum level (a) and genus level (b) in the CW–MFC systems (AC, activated carbon).
Water 16 00278 g011
Table 1. Specific surface areas, pore structures, and costs of the activated carbon.
ACSpecific Surface Area (m2/g)Pore Volume
(cm3/g)
Proportion of Pore VolumeAverage Pore Size (nm)Cost (US$/ton)
VtotalVmicroVmesoVmicro/VtotalVmeso/Vtotal
C-AC852.30.6510.0950.5560.1460.8542.50530–850
CS-AC833.10.5510.2650.2860.4810.5192.511130–1510
WS-AC632.10.3940.2750.1190.6980.3022.49810–1410
PS-AC482.30.3050.2030.1020.6640.3362.531050–1400
JS-AC789.90.4940.1890.3050.3830.6172.501020–1400
AS-AC42.60.0510.0010.0500.0290.9714.781500–2100
Note: C-AC, coal-based activated carbon; CS-AC, coconut-shell-based activated carbon; WS-AC, walnut-shell-based activated carbon; PS-AC, peach-shell-based activated carbon; JS-AC, jujube-shell-based activated carbon; AS-AC, apricot-shell-based activated carbon; Vtotal, total pore volume; Vmicro, micropore volume; Vmeso, mesopore volume).
Table 2. Parameters of the fitted equivalent circuit diagram for EIS test of the activated carbon.
ACL/nHRs/mΩRct/mΩC/FY0(W)/mMho×s^(1/2)Y0(CPE)/mMho×s^NN
C-AC8915653121.1 × 1058164.680.742
CS-AC7464953067.94873.940.804
WS-AC9434732951.167904.180.778
PS-AC2754154491.166954.760.78
JS-AC03764890.7312.0614.60.627
Note: C-AC, coal-based activated carbon; CS-AC, coconut-shell-based activated carbon; WS-AC, walnut-shell-based activated carbon; PS-AC, peach-shell-based activated carbon; JS-AC, jujube-shell-based activated carbon; L, Inductance; Rs, electrolyte resistance; Rct, charge transfer resistance; C, capacitance; Y0(W), Warburg impedance; Y0(CPE), constant phase element.
Table 3. Performance of CW–MFC systems in several previous studies and in the present study.
No.CW–MFC (Volume)WastewaterElectrodeHRT (Day)Pollutant Removal
(%)
Maximum Power Density (mW/m3)Coulombic Efficiency (%)References
1Up-flow subsurface (5 L)Azo dye Graphite plate4.0COD 75–76.5
Azo dye 81
TN 49.7
13.00.05–0.06[30]
2Up-flow subsurface (3.7 L)swine wastewaterGraphite plate0.9–1.25NH3-N 77.423.00.1–0. 6[31]
3Up-flow subsurface (35.3 L)synthetic wastewater (glucose)Activated carbon stainless steel mesh2.0COD 94.8
TN 90.8
24.840.39–1.29[32]
4Up-flow subsurface (35.3 L)Azo dyeActivated carbon stainless steel mesh3.0Azo dye 91.2
COD 85.7
110.58–1.71[33]
5Up-flow subsurface (270 L)synthetic wastewater (glucose, acetate)Graphite plate3.2COD 90–9541.50.27–0.45[34]
6Up-down flow subsurface (20.2 L)swine wastewaterGraphite particles graphite rods1.0COD 64
NH3-N 75
150.25[35]
7Up-flow subsurface (35.3 L)Azo dyeActivated carbon stainless steel mesh3.0COD 85.7
Azo dye 92.8
3.70.037–1.89[36]
8Up-flow subsurface (19 L)synthetic wastewater (acetate)Activated carbon1.0COD 99
NH3-N 96
12.50.06–1.42[37]
9Up-flow subsurface (117 L)synthetic wastewater (glucose)Graphite plate4.0NH3-N 93.2
TP 96.7
0.70.88–1.64[38]
10Up-flow subsurface (11.3 L)synthetic wastewater (glucose)Activated carbon stainless steel mesh2.0COD 80.2–93.3
NH3-N 79.1–97.9 TN 86.1–97.8
10.80–25.710.6708–0.8896The present study
Table 4. Enzymatic activity in the CW–MFC systems (Mean ± standard deviation).
CW–MFC20-5CW–MFC20-10CW20-5
Dehydrogenase (IU/g)gravel1.3247 ± 0.18751.3259 ± 0.19051.3268 ± 0.1822
activated carbon (MFC anodes) 1.7285 ± 0.21561.7053 ± 0.20621.5667 ± 0.2075
lava1.5389 ± 0.21891.5385 ± 0.18661.5394 ± 0.1959
soil1.5225 ± 0.19861.5230 ± 0.18671.5232 ± 0.1896
plant roots1.8586 ± 0.18591.8588 ± 0.19231.8592 ± 0.2054
MFC cathodes 0.7992 ± 0.08590.8016 ± 0.0912
Catalase (IU/g)gravel0.8756 ± 0.08120.8761 ± 0.08430.8762 ± 0.0896
activated carbon (MFC anodes) 0.9514 ± 0.09260.9356 ± 0.09320.8751 ± 0.0921
lava0.8813 ± 0.08560.8824 ± 0.08610.8826 ± 0.0876
soil0.9125 ± 0.09210.9129 ± 0.09230.9138 ± 0.0954
plant roots1.1782 ± 0.12451.1779 ± 0.12421.1778 ± 0.1226
MFC cathodes 1.1523 ± 0.11781.1547 ± 0.1189
Ammonia monooxygenase (IU/g)gravel2.5624 ± 0.25462.5620 ± 0.25122.5619 ± 0.2716
activated carbon (MFC anodes) 2.9468 ± 0.27132.9256 ± 0.26232.7451 ± 0.2643
lava2.6548 ± 0.24192.6564 ± 0.25372.6576 ± 0.2538
soil3.0759 ± 0.27853.0749 ± 0.27133.0751 ± 0.2841
plant roots3.7426 ± 0.28123.7435 ± 0.27463.7432 ± 0.2795
MFC cathodes 3.5769 ± 0.27943.5772 ± 0.2723
Table 5. Nitrification and denitrification potentials in the CW–MFC systems (Mean ± standard deviation).
CW–MFC20-5CW–MFC20-10CW20-5
Nitrification intensity/
10−2 mg/(kg·h)
gravel5.41 ± 0.07965.43 ± 0.07585.40 ± 0.0726
activated carbon (MFC anodes)6.55 ± 0.08116.38 ± 0.08055.98 ± 0.0795
lava5.33 ± 0.06785.36 ± 0.06985.35 ± 0.0702
soil6.14 ± 0.07246.12 ± 0.07856.15 ± 0.0746
plant roots7.81 ± 0.09237.84 ± 0.09217.82 ± 0.0915
MFC cathodes7.23 ± 0.08757.21 ± 0.0891
Denitrification intensity/
mg/(kg·h)
gravel241.3 ± 2.54240.5 ± 2.78239.8 ± 2.62
activated carbon (MFC anodes)287.4 ± 3.08282.2 ± 2.91269.4 ± 3.01
lava249.8 ± 2.71248.6 ± 2.83250.2 ± 2.85
soil241.7 ± 2.78242.0 ± 2.52242.3 ± 2.67
plant roots155.4 ± 2.23154.8 ± 2.68156.4 ± 2.05
MFC cathodes245.4 ± 2.35245.9 ± 2.12
Table 6. Microbial diversity in the CW–MFC systems (Mean ± standard deviation, IU/g).
Observed
Species
ShannonSimpsonChaolACEGood’s CoveragePD_Whole Tree
CW–MFC20-5
gravel15257.0650.9621649.5791651.3780.993139.759
activated carbon (MFC anodes) 16197.4850.9891742.4211726.3890.995146.423
lava15497.1420.9741682.3851680.7230.993142.878
soil15337.1280.9781701.1691702.3470.996143.891
plant roots16837.5590.9921785.6931811.4690.994148.763
MFC cathodes 13166.6710.9531578.6341587.6340.993134.569
CW–MFC20-10
gravel15297.0720.9611646.8651652.2460.994139.462
activated carbon (MFC anodes) 16217.4780.9881742.2471726.1490.995146.157
lava15427.140.9781680.8971679.4690.996143.057
soil15427.1270.9771700.5791701.8940.996143.431
plant roots16927.5510.9911784.8961810.6790.993148.957
MFC cathodes 13216.6670.9511579.0211585.8970.995134.754
CW20-5
gravel15237.070.9581648.4591651.8940.992138.963
activated carbon (MFC anodes) 15597.1920.9731685.5891660.5490.995141.578
lava15477.1620.9751681.7691681.0210.996143.147
soil15367.1210.9761701.5481701.8690.996144.214
plant roots16857.5620.9921783.8971810.7460.995149.127
Disclaimer/Publisher’s Note: The statements, opinions and data contained in all publications are solely those of the individual author(s) and contributor(s) and not of MDPI and/or the editor(s). MDPI and/or the editor(s) disclaim responsibility for any injury to people or property resulting from any ideas, methods, instructions or products referred to in the content.

