Abstract
Coastal ecosystems are facing critical water quality deterioration, while the most convenient passage to the South China Sea, Beibu Gulf, has been under considerable pressure to its ecological environment due to rapid development and urbanization. In this study, we characterized the spatiotemporal change in the water quality in Beibu Gulf and proposed a machine learning approach to predict the water pollution level in Beibu Gulf on the basis of 5-year (2018–2022) observation data of ten water quality parameters from ten selected sites. Random forest (rf) and linear algorithms were utilized. Results show that a high frequency of exceedance of water quality parameters was observed particularly in summer and autumn, e.g., the exceeding rate of Dissolved Inorganic Nitrogen (DIN) at GX01, GX03, GX06, and GX07 station were 28.2~78.1% (average is 52.0%), 6.0~21.7% (average is 52.0%), 23.0~44.7% (average is 31.9%), and 5.2~33.4% (average is 21.2%), respectively. With regard to the spatial distribution, the pH, Water Salinity (WS), and Dissolved Oxygen (DO) values of stations inside the bay were overall lower than those of corresponding stations at the mouth of the bay and stations outside the bay. The concentrations of Chlorophyll-a concentration (except QZB) and nutrient salts showed a clearly opposite trend compared with the above concerned three parameters. For instance, the average Chl-a value of station GX09 was 22.5% higher than that of GX08 and GX10 between 2018 and 2022. Correlation analysis among water quality factors shows a significant positive correlation (r > 0.85) between Dissolved Inorganic Nitrogen (DIN) and NO3-N, followed by NO2-N and NH4-N, indicating that the main component of DIN is NO3-N. The forecasting results with machine learning also demonstrate the possibility to estimate the water quality parameters, such as chl-a concentration, DIN, and NH4-N in a cost-effective manner with prediction accuracy of approximately 60%, and thereby could provide near-real-time information to monitor the water quality of the Beibu Gulf. Predicting models initiated in this study could be of great interest for local authorities and the tourism and fishing industries.
1. Introduction
The ocean is one of the most extensive ecosystems on the planet, and has great ecological and economic value []. However, the marine environment, specifically many coastal ecosystems worldwide, have been facing the critical issue of water quality degradation in recent decades [] as a result of the rapid development of coastal cities and urbanization. The coastal interface, where the land and ocean realms meet, is the active component in the global cycling of carbon and nutrients supporting a large suite of ecosystem services []. Driven by two-way interactions between aquatic and terrestrial environments along the coast, highly dynamic biogeochemical processes happen constantly []. Studies haves shown that roughly 40% of the world’s population resides in coastal regions, within 100 km of coastlines []; shipping of goods and resources, which depends on coastal ports, is responsible for around 90% of international trade []. Because of its proximity to frequent human activity, coastal waters receive the largest pollution load. Since the beginning of last century, the harmful algal blooms have been the major problem within the marginal sea between the Asian continent and the Pacific Ocean [,,]. Particularly, the annually recurrent red tides of dinoflagellates from early May to the middle of June could affect a water area of up to 10,000 km2 in the East China Sea []. The coastal water quality decline, as is reflected by high levels of nutrients, oxygen deficiency in the subsurface layer, acidity increasing, and widespread persistent organic pollutants [,], has been considered to be a worldwide crisis in the marine environment []. Excess nutritive contaminants, e.g., eutrophication, along with other damaging factors such as water temperature, acid–base, and meteorological conditions [,,], usually stimulate algal blooms, and oxygen content in water bodies is subsequently depleted. The algal explosive growth and accumulation has already shown a variety of adverse effects on coastal ecosystems, including water discoloration, fish kills, acidification, phytoplankton, and microbial community composition changes [,,], that cause severe ecological and economic loss, and even human health problems [,]. Therefore, water quality monitoring and assessments of oceans, especially in coastal waters, are of great significance. Objective and accurate evaluations of water quality, analyses of historical pollutant concentration changing characteristics, and predictions of future water quality are important data support for the rational planning and integrated management of nearshore marine environments [].
Sitting on the north Beibu Gulf, Guangxi Zhuang Autonomous Region (GZAR), is the least developed coastal provincial level unit in China, but has very rich marine resources including oil, minerals, ports, and fisheries, as well as three typical marine ecosystems, mangrove, seagrass, and coral reef []. The Beibu Gulf Economic Zone of GZAR is not only the key area for the south-western China development, but also the demonstration zone of cooperation between China and countries in the Association of Southeast Asian Nations (ASEAN) []. Therefore, the development of the marine economy in that city takes place under significant potential and highly favorable basic conditions. In recent years, the marine economy in GZAR has shown a rapid increasing trend, and its marine GDP was 165.1 billion yuan in 2020 with a percentage of 7.5% of the total provincial GDP []. The marine economy has become an important engine for sustained and rapid economic growth in the region. It may be concluded that the marine economy in GZAR unavoidably generates high environmental pressures. Therefore, to evaluate the water quality of the marine environment and carry out early pollution warnings and forecasting for water pollution status in the coastal sea areas of GZAR are of great importance to ensure the sustainable development of the ecological and economic system. But there are currently few studies that consider this.
Over the past few years, machine learning (ML) algorithms have been used to understand and simulate water quality trends, and have achieved good results [,,], because models incorporating ML algorithms perform better with higher accuracy than conventional mechanistic and regression models []. Theoretically, the ML models focus on the relationship mapping between inputs and outputs of a system mainly rather than complex process mechanisms []. The highly nonlinear relationships can be accurately modeled through learning from a large mass of historical data whether with prior knowledge for the studied system or not. A few ML techniques have been successfully developed for predicting water quality conditions, such as Random Forest (RF), Artificial Neural Networks (ANN), Boosted Regression Trees (BRT), Support Vector Machine (SVM), Genetic Algorithms (GA), Logistic regression, and Model trees (MT) [,,,,,]. Compared with other ML techniques, RF models that resort to the concept of ensemble learning have been applied in water and environmental fields due to the rapid response and vastly superior prediction performance [,]. Alnahit et al. (2022) developed the RF and BRT models for water quality parameters, such as total nitrogen (TN), total phosphorus (TP), and turbidity predictions of 97 watersheds located in the Southeast Atlantic region of the USA []. The results highlighted that while both methods provided reasonable results, the RF algorithm was easier to train and robust to model overfitting. Chen et al. (2020) compared the water quality prediction performance of ten learning models using big data from the major rivers and lakes in China from 2012 to 2018 []. The results showed that decision tree, RF, and deep cascade forest had significantly better performance in the prediction of all six levels of water quality recommended by the Chinese government. Nasir et al. (2022) used a RF technique for classifying water quality, and compared the results with six other machine learning methods []. They found similar results using the models, but the RF and CATboost were outstandingly better, which had the accuracy of 94% and 94.51%, respectively []. Xu et al. (2021) designed a water quality prediction framework to predict TN concentrations in inland water bodies and salinity and temperature in nearshore seawater []. According to the experimental results, RF performs the best among all tested machine learning models. The data prediction error rate of the RF model in predicting the TN concentration was 4.9%, and the accuracy of that in predicting the salinity and temperature was 92.94% and 95.35%, respectively []. Despite that many studies have been focused on the RF methods in different watershed fields, there are so far very few studies on implementing and applying RF methods for effective water quality prediction in marine environments, especially for coastal systems.
To carry out the most reliable evaluation and prediction of water quality characteristics in coastal sea areas of GZAR, in the hope to nearshore marine environment rational planning and protection, this paper deals with the following: (i) analyzing the spatiotemporal change characteristics of water quality parameters in typical coastal waters of GZAR, and conducting correlation analysis; (ii) investigating the impact of land-based input pollution sources (rivers, pollution sources of direct discharge into the sea, etc.) on coastal seawater quality; (iii) establishing coastal sea water quality forecasting and warning models on the basis of machine learning and putting it into application in the hope of providing scientific support for GZAR’s marine environmental protection and management.
2. Materials and Methods
2.1. Study Area
The Beibu Gulf of GZAR is located at the southernmost end of mainland China, facing Southeast Asia and backed by southwest China. It is a semi-enclosed bay with an average depth of 42 m and an area of about 130,000 km2. It is an important newly developing industry and port area, and importantly, it is the most convenient passage to the sea in southwest China []. The Beibu Gulf has some sub-bays, such as Qinzhou Bay (QZB), Lianzhou Bay (LZB), and Tieshangang Bay (TSGB). There are various and abundant marine resources, mainly including port resources, coastal tourism resources, biological resources, oil and gas resources, mineral resources, wind energy, and tidal energy. The total marine functional area covers approximately 7000 km2, with 1628.6 km of coastlines and 643 islands []. The coastline is tortuous, with rich bays and waterways, while the main types of natural coastlines include coral reefs, intertidal silt, and mangrove swamps, which are being damaged at an alarming rate with the increase in development intensity []. For the past two decades, due to its unique location and natural resources, reclamation activities have increased in the Beibu Gulf, which pose significant challenges to its ecological environment function []. For instance, a total of 38.90 km2 of tidal flat was reclaimed between 2004 and 2019 in QZB. The Dissolved Inorganic Phosphorus (DIP) was increased by about 17%, and Dissolved Inorganic Nitrogen (DIN) was increased by above 40%, leading to continuous deterioration of water quality in QZB []. In addition, the aggravating seawater acidification and eutrophication have also been widely reported in coastal areas or bays around the northern Beibu Gulf []. The area covered in this study are the northern and eastern Beibu Gulf, including the QZB, LZB, and TSGB, along with the offshore area extending to the central gulf.
2.2. Data Sources and Analysis
The data set we selected was 10 water quality parameters of 10 water quality observation sites in 3 sub-bays of Beibu Gulf from 2018 to 2022. The 10 parameters we collected were important indicators for describing the coastal seawater environment, including the 5 conventional parameters and 5 nutrient parameters, which were all half-hourly observation data. The conventional parameters included Water Temperature (WT, °C), pH, Water Salinity (WS, ‰), Dissolved Oxygen (DO, mg/L), and Chlorophyll-a concentration (Chl-a, μg/L) (YSI Incorporated, Yellow Spring, OH, USA). The nutrient parameters included nitrate (NO3-N, mg/L), nitrite (NO2-N, mg/L), ammonia (NH4-N, mg/L), Dissolved Inorganic Nitrogen (DIN, mg/L), and Dissolved Inorganic Phosphate (DIP, mg/L) (SYSTEA S.p.A., Anagni, Italy). Additionally, tidal data from the Global Tide Forecast Service Platform of the National Ocean Information Center and “chaoxibiao” website (choaxibiao.net), along with meteorological data published by “Weather+” website (tianqi.com), were both used for modeling in this study. The locations and specific monitoring parameters of the ten automatic observation stations are shown in Figure 1 and Table 1. The average achievable transmission ratio and valid data ratio of nutrient parameters data from monitoring stations were both lower than that of the five conventional parameters, as are shown in Tables S1 and S2. The transmission ratio and valid data ratio of the conventional parameters data were above 95% and above 93%, respectively, while that of the nutrient parameters data were 70~86% and 70~86%, respectively. The difference in transmission ratio and valid data ratio among parameters was mainly related to the different measuring methods and calibration methods. The conventional parameters data were directly collected using sensor probes, and their calibration was generally completed on-site at the monitoring site, while the continuous flow analysis method was used for the acquisition of nutrient parameters data, and the monitoring sensor probe need to be brought back to the laboratory regularly for replenishing the reagents and calibrating the standard measurement curve. It usually takes 2 to 3 days to return to the observation station. The monitoring data were blank during this period. In order to estimate the impact of terrestrial pollution input on the water quality of coastal waters, six estuary monitoring stations were also studied in this paper (Figure 1), including three estuary monitoring stations in QZB—Maoling Bridge (MLB) Station, Qinjiang East (QJE) Station, and Expressway West Bridge (EWB) Station, and three estuary monitoring stations in LZB—Nanyu (NY) Station, Ya Bridge (YB) Station, and Ximenjiang (XMJ) Station. TN and TP concentration were collected from 1 January 2019 to 31 December 2022. SPSS19.0 software was used to analyze the correlation among water quality parameters.
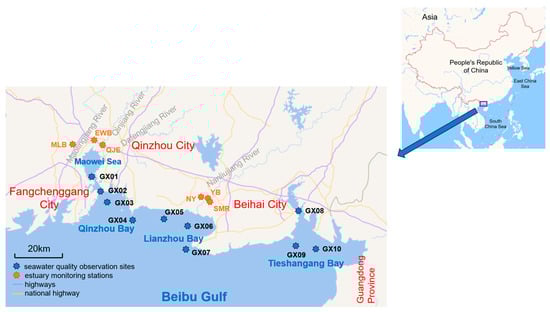
Figure 1.
Schematic diagram of automatic monitoring stations for water quality in coastal waters of GZAR.

Table 1.
List of parameters of automatic water quality monitoring stations in coastal waters of GZAR.
2.3. Prediction Model Establishing
Each machine learning method trains the model through different algorithms. Random forest is an ensemble learning method based on decision trees [], which was the main model principle applied in this study. Each decision tree is constructed on a subset randomly subsampled from the original data set by the bagging method, introducing additional diversity [,]. Bagging is a machine learning ensemble meta-algorithm aimed to improve the stability and accuracy of algorithms []. With the use of bagging, overfitting can be avoided. After an ensemble of decision trees is generated, the random forest approach gives prediction results by using voting or taking arithmetic means of all decision trees []. The ensemble method combines a lot of tree models; RF is therefore considered to provide a better generalization performance and less possibility of overfitting, especially when dealing with big data []. During random forest modeling, it is no need for cross-validation or a separate training and test data set to obtain an unbiased estimate of the test set error []. Although the linear model was not preferred for the model establishment for water quality warning and prediction in this study, it still has certain predictive capabilities for situations not covered in the model training set. It was selected to offset the shortcomings of the RF method, which cannot effectively classify uncovered vectors in the training set, could only output constant values, and show insufficient ability to respond to circumstance changes.
2.3.1. Model Training and Verification
The time resolution of obtained tidal data are hourly, while that of meteorological data are daily. Research on river chlorophyll concentration prediction through the ML technique used by Cho (2018) has shown that a prediction accuracy of nearly 90% could be achieved with daily average data []. Therefore, this study selected hourly average data as a training set for predicting hourly water quality parameters in the next two days, and daily average data over the past seven days, as a training set for predicting daily average water quality parameters in the next two days. The latest data involved in the training set of this study was from 31 July 2023, because it is necessary to be ensured that at least 8 months of data could be obtained at observation stations, especially for stations starting operation at the end of 2022. Additionally, these data cover both cold and hot seasons in a year, ensuring the comprehensiveness of data. Respective schematic diagram of the training set of the hourly and daily resolution model could be illustrated in Figures S1 and S2. In terms of data sets without time series, the entire data set is usually divided into a training set and a validation set according to a certain proportion. However, for data with time series in this study, such a way of division could result in the past and future data both being included in the training set, which is inconsistent with the prediction logic. Therefore, data in August 2023 were selected as the validation set and the data before were used as the training set.
2.3.2. Forecasting Program Input
Invalid data and abnormal data, such as negative or zero values resulting from equipment failure, were generally assigned as null values by the algorithm. But the null value could cause this line and related data to be deleted, and linear interpolation was used to solve this problem. When predicting hourly water quality parameters values, besides the past parameters input, tidal data also need to be added. The tidal data are necessary to cover the values corresponding to the time of existing water quality parameters, as well as the corresponding 24 and 48 h later values. Input data form of hourly water quality parameter forecasting are shown in Table S3. When predicting the daily water quality parameters values, meteorological data need to be added. In addition to the meteorological data and daily average water quality parameters for 7 consecutive days, the meteorological data for the next 2 days also need to be entered, as shown in Table S4.
Prediction models of each site are mainly determined by the model input data type. Table S5 shows the prediction model names and explanations.
2.3.3. Early Warning of Water Quality Status
After completing the prediction of each water quality parameter, the time points at which future coastal water pollution problems might occur could be obtained, and then early warning information could be transmitted to the environmental management department. This study mainly focuses on three types of water quality pollution issues, including algae proliferation, abnormal water quality, and questionable water quality. Their respective judgment criteria are shown in Table S6.
2.4. Model Performance Evaluation
In order to evaluate the modeling performance, Mean Absolute Percentage Error (MAPE) was adopted to quantify the modeling accuracy in this study. To be specific, MAPE can be mathematically calculated with Equations (1) and (2). Among them, Ttrue was the observed true parameter value, Tpredicted was the predicted parameter value from the established model, and MAE refers to the numerical difference between the predicted value and the observed value. MAPE could be obtained by calculating the error ratio between the predicted and actual values. Theoretically, the model with better performance has a lower MAPE value [].
3. Results and Discussion
3.1. Overall Condition of Coastal Water Quality
To examine the overall quality of GZAR’s coastal water, we analyzed the exceeding rates of pH, DO, DIP, and DIN by comparing the annual averages with those in the Class II seawater quality standards (GB 3097-1997) [] during 2018 to 2022 (Figure S3). The exceeding rate of pH between 2018 and 2022 of GX01, GX02, and GX09 were 34.4~67.1% (average is 45.0%), 16.4~36.7% (average is 27.3%), and 17.8~35.3% (average is 28.3%), while those of other stations was 0~8.5% (average is 1.1%). It can be concluded that the pH of GX01, GX02, and GX09 stations showed stronger exceedance than that of other observation sites. The sites where the annual average DO values beyond the Class II standard were GX02, GX03, and GX09, whose exceeding rates were 0.3~17.5% (average is 8.9%), 0.8~10.4% (average is 4.4%), and 13.1~23.4% (average is 20.5%) between 2018 and 2022. It should be noticed that at the GX09 station, the DO value exceeded 25% in both 2020 and 2021 (25.4% and 27.4%, respectively). Significant exceedance of DIP values was also observed, e.g., the exceeding rate at GX01, GX03, GX06, and GX07 station were 28.2~78.1% (average is 52.0%), 6.0~21.7% (average is 52.0%), 23.0~44.7% (average is 31.9%), and 5.2~33.4% (average is 21.2%), respectively. With regard to DIN, the degree of exceedance was slightly smaller than that of DIP, whose exceeding rate at the GX01, GX03, GX06, and GX07 stations were 27.9~41.9% (average is 32.7%), 7.4~24.7% (average is 13.6%), 20.8~49.3% (average is 32.4%), and 2.4~9.5% (average is 5.6%), respectively.
The daily average values of the above four water quality parameters in the three bays are given in Figure 2, Figures S4 and S5. Overall, the exceedance of the above four water quality parameters mainly occurred at stations of GX01~GX03 in QZB and station GX09 in TSGB, and a high frequency of exceedance was observed particularly in summer and autumn, which could be ascribed to the higher temperature in GZAR during this period. As water temperatures increase, the dissolved oxygen level decreases, and water with higher temperature contains more carbon dioxide, increasing levels of which may lead to ‘ocean acidification’. The exceeding nutrients (DIN and DIP) were principally caused by extra inputs of nutrients from eutrophic runoff or water exchange []. Crops grow vigorously in summer and autumn. Chemical fertilizers and pesticides used in agricultural activities enter rivers and groundwater with overland runoff, and eventually flow into the ocean, increasing the nutrient content in water bodies. Naturally, phytoplankton-related biological processes also affect nutrient concentrations in seawater []. The water quality of areas outside the bay was better than that inside the bay, and the number of the days when water quality parameters could meet the Class II standard showed a gradually increasing trend from inside the bay to outside the bay. Especially, the pollution of DIP and DIN inside the bay were far worse than those outside the bay, which could be attributed to the consequence of coastal marine aquaculture [].
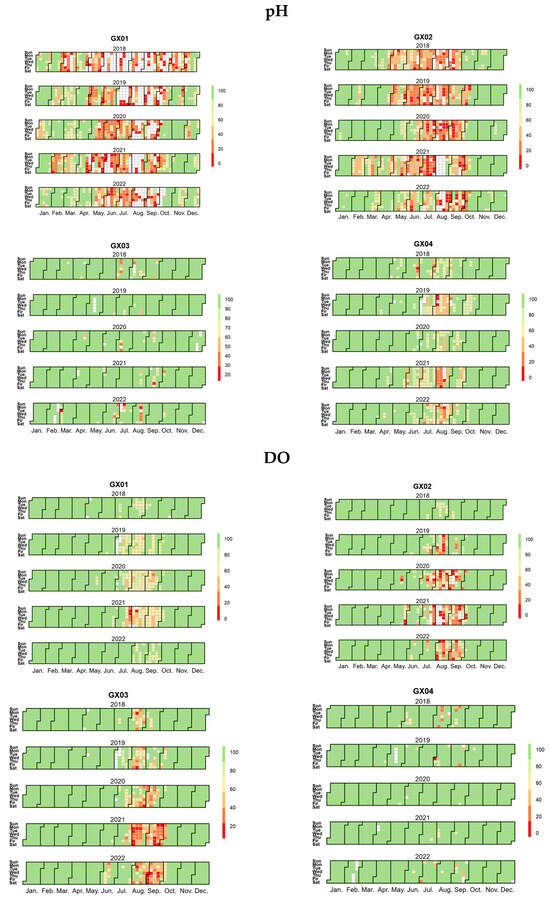
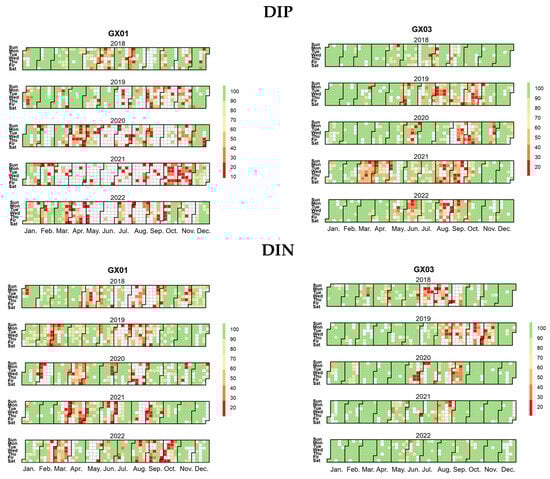
Figure 2.
The annual average exceedance rates of pH, DO, DIP, and DIN of QZB against the Class II seawater quality standards from 2018 to 2022.
3.2. Spatiotemporal Changes in the Water Quality
As can be seen in Figure 3, Figures S6 and S7, the parameters of GZAR’s coastal water show obvious seasonal trends between 2018 and 2022. The value of pH and WS were higher in spring and winter, and decreased in summer and autumn, whereas the concentration of Ch-a, nutrients, DIN, and DIP generally increased and peaked in summer and autumn. In 2022, the average pH and WS values at the ten stations were 8.12 and 28.58‰ in spring and winter, respectively, and 8.05 and 25.62‰ in summer and autumn, respectively. The average values of Ch-a, DIN, and DIP at the ten stations were 3.86 μg/L, 0.15 mg/L, and 0.019 mg/L in spring and winter, respectively, and 4.49 μg/L, 0.19 mg/L and 0.025 mg/L in summer and autumn, respectively. Evidence has shown that Beibu Gulf is impacted by the East Asian monsoon, with the prevailing southwestern monsoons and the dominant precipitation in summer and autumn []. The principal contributor to the seawater of the gulf in the rainy season is runoff from the northern Beibu Gulf (43% in summer and 45% in fall), and during the dry season (winter and spring), it changed to the intrusion of South China Sea water (57%) with high salinity through the coast of western Hainan Island []. Seasonal variability was up to 4–17-fold for nutrient concentrations from the dry to wet seasons in the Maowei Sea (MWS), indicating that the QZB may respond rapidly to both natural and anthropogenic factors [].
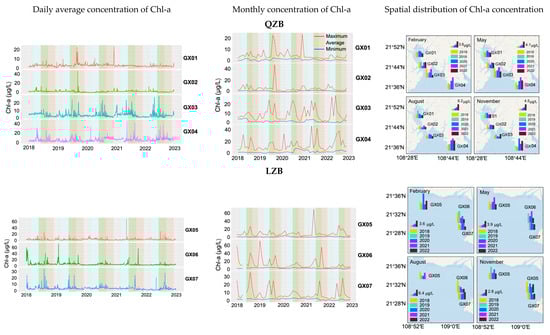
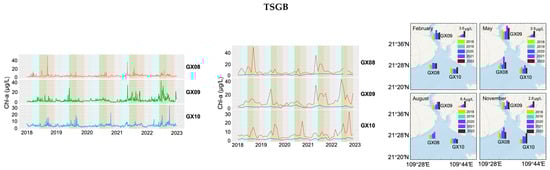
Figure 3.
Temporal and spatial characteristics of Chl-a concentration of QZB, LZB, and TSGB from 2018 to 2022.
Water temperature gradually increased from January, with the highest temperature appearing in summer between May and August, and then decreased constantly, while DO shows the opposite trend. In 2022, the average WS value between May and August (28.9 °C) was 44% higher than that of in other months (20.1 °C), while average DO values between May and August (6.4 mg/L) were 17.7% lower than that of other months (7.8 mg/L). Fluctuations in seawater temperatures (the range can up to 22.9°) were mainly due to seasonal variations. High seawater temperature could weaken the immune system of fishes with low tolerance and increase unfavorable potentials of massive Fishkill []. Generally, low DO concentrations were attributed to weak water mixing or organic matter degradation, particularly during hot and calm summer months []. The maximum value of DO was recorded at station GX05, which is located near to LZB where water is well mixed. DO is an important indicator of the surviving aquatic life and water quality, and the variability of DO has noticeable effects on the behavioral process in fish such as feeding, swimming, and migration [].
Overall, the annual average of Ch-a concentration of GZAR’s coastal water decreased 4.0% from 2018 to 2022 with fluctuation. Among the three studied bays, the annual averaged Ch-a concentrations of LZB showed a fluctuating decreasing trend with 3.69~5.68 μg/L, while those of QZB and TSGB showed a fluctuating increasing trend with 3.93~4.12 μg/L and 3.62~5.33 μg/L, respectively. The annual averages of pH, WS, and DIP of GZAR’s coastal water exhibit a growing trend, which increased from 8.02, 25.8‰, and 0.019 mg/L in 2018 to 8.10, 26.3‰, and 0.022 mg/L in 2022, respectively, with a growth rate of 0.6%, 1.9%, and 12.6%, respectively. On the contrary, the annual average value of DO, WT, and DIN showed a decreasing trend from 7.14 mg/L, 24.8 °C, and 0.24 mg/L in 2018 to 7.07 mg/L, 24.5 °C, and 0.17 mg/L in 2022, respectively, with a reduction rate of 1.0%, 1.2%, and 29.2%. The yearly change trend in the above six parameters at the three bays were consistent in general.
With regard to the spatial distribution, the pH, WS, and DO values of stations inside the bay (GX01 at QZB and GX09 at TSGB) were overall lower than those of corresponding stations at the mouth of the bay (GX02 at QZB) and stations outside the bay (GX03 and GX04 at QZB, GX08 and GX10 at TSGB). In 2018–2022 at TSGB, the average pH, WS, and DO values of stations GX09 with the range of 7.85~7.89, 24.96~28.67‰, and 5.83~6.41 mg/L were overall lower than those of GX08 and GX10 with 8.13~8.2, 29.17~30.95‰, and 6.88~7.06 mg/L. The average pH, WS, and DO values of stations GX09 during the study period were 3.4%, 10.5%, and 13.0% lower than that of stations outside the bay. The concentrations of Chl-a (except QZB) and nutrient salts showed a clearly opposite trend compared with the above concerned three parameters. At TSGB, the average Chl-a value of station GX09 was 22.5% higher than that of GX08 and GX10 between 2018 and 2022, and the averaged NO2-N, NO3-N, NH4-N, DIN, and DIP of GX09 were 121.9%, 75.3%, 417.3%, 144.3%, and 136.5% higher than those of GX08 and GX10 between 2021 and 2022. Generally, the pollutants are easily retained in the water body near the inner part of semi-enclosed bays. Due to a longer water retention time, weaker water exchange, and slight tide flushing, these areas are more likely to occur eutrophication. Instead, the outside open water of semi-enclosed bays is more often affected by oceanic dynamics. Their frequent hydrodynamic exchanges with open seas increase the acid-base buffering capacity and DO values, mix more South China Sea water with high salinity, and block the accumulation of nutrient substances [,]. The Chl-a concentration of GX01 station situated inside the QZB was lower than that at GX03 and GX04 outside the bay, which is speculated to result from the geomorphological characteristics of the narrow long bay. Station GX01 is located at the trumpet-shaped narrow part of QZB, and is affected by the rise and fall of the tide; the seawater flow in this area is relatively fast and the erosion is more severe. Additionally, there is considerable siltation near the GX01 station, which has hindered the algae growth. On the contrary, the thermohaline structure of stations GX03 and GX04 located outside the bay mouth is relatively stable, which is conducive to the growth and reproduction of algae. The Chl-a concentration of GX06 and GX07 station on the east side of LZB (4.49 μg/L) between 2018 and 2022 were higher than that of GX05 station on the west side of LZB (4.48 μg/L). The pH and WS of GX05 and GX07 stations were slightly higher than those of GX06 station, while the concentration levels of nutrient salts showed the opposite trend. The averaged pH and WS of GX05 and GX07 stations were 0.7% and 8.6% higher than that of GX06 station. The averaged NO2-N, NO3-N, NH4-N, DIN, and DIP values of GX05 and GX07 stations were 43.3%, 52.2%, 31.3%, 48.4, and 16% lower than that of the GX06 station.
The correlation analysis among water quality factors in the coastal waters of QZB, LZB, and TSGB were also revealed. The results (Figure 4) show that the most significant positive correlation (r > 0.85) is between concentrations of DIN and NO3-N, followed by NO2-N and NH4-N, indicating that the main component of DIN is NO3-N. The correlations among other parameters were relatively weak. The Chl-a concentration of QZB and LZB were positively corelated with DO (r = 0.2~0.4). As to all the three bays, the DO was negatively corelated with WT (r = −0.6–0.9) and DIP (r = −0.2~−0.6); WT was negatively corelated with WS (r = −0.3~−0.5) and positively corelated with DIP (r = 0.2~0.3) and NO2-N (r = 0.2~0.3); WS was negative corelated with nutrient salts (r = −0.2~−0.5).
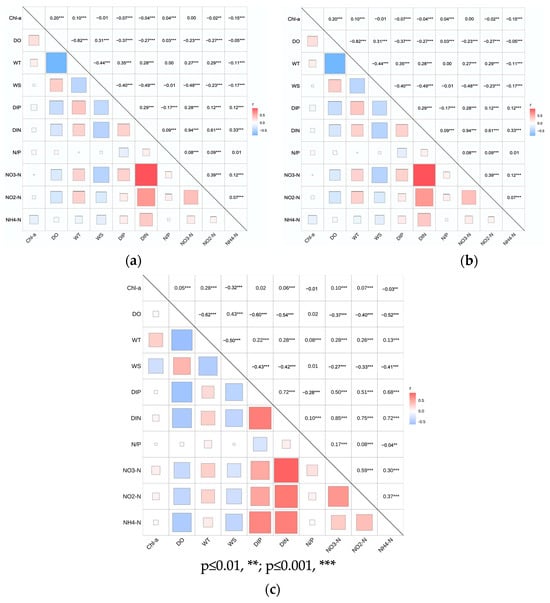
Figure 4.
Correlation analysis results of water quality parameters. (a) QZB. (b) LZB. (c) TSGB.
3.3. Terrestrial Impact on Coastal Water Quality
The temporal variation trends in the daily averaged TN and TP concentrations at estuary and coastal waters monitoring stations of QZB were compared by performing secondary moving average processing to eliminate the influence of outliers (Figure 5). The results showed that the TN and TP concentrations in the estuary of QZB were overall higher than that of GX01 and GX03 stations in the coastal waters. It can be inferred that the nutrients carried by the runoff of the rivers entering the sea could definitely contribute to the TN and TP concentration in the coastal waters of QZB. It was also found that the temporal trend in TN and TP concentrations of GX01 station was basically consistent with that of the QJD and MLB stations, indicating the possible evidence that the TN and TP concentrations of the coastal waters in QZB were affected by the runoff from Maoling River (MLR) and the east branch of the Qinjiang River (QJR). In addition, the correlation analysis among the daily average TN and TP concentrations of estuary and coastal water monitoring stations of QZB was conducted (Tables S7 and S8). The results showed that the TN concentration of the GX01 station has a positive correlation with that of the MLB station (p = 0.2731) and QJE station (p = 0.0962), and a negative correlation with the EWB station (p = −0.2165); the TN concentration of the GX03 station has negative correlations with that of the MLB station (p = −0.2883), QJE station (p = −0.1953), and EWB station (p = −0.2484). It can be inferred that the TN concentration at station GX01 within QZB was generally positively affected by the rivers entering the sea, while the TN concentration at station GX03 outside the bay is negatively correlated with those rivers, which is speculated to be related to tides and water diffusion. The TP concentration in the coastal waters of QZB was overall negatively correlated with that of the rivers entering the sea.
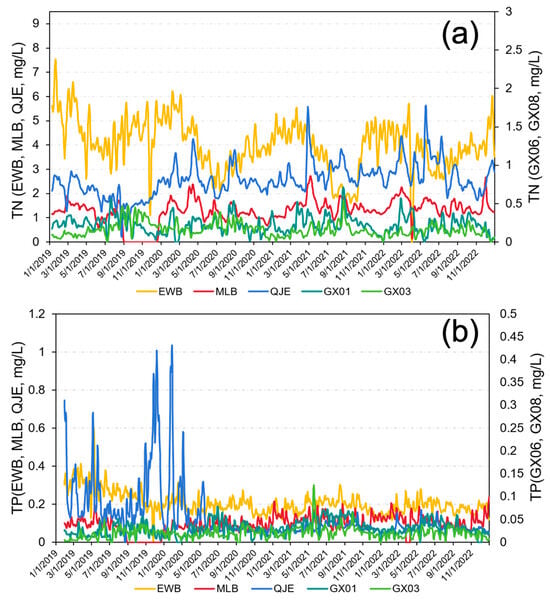
Figure 5.
The temporal variation trends in the quadratic moving averaged daily TN and TP concentration at the estuary and coastal water monitoring stations of QZB. (a) TN, (b) TP.
Two rivers (the Maoling River and Qinjiang River) deliver fresh water into the QZB, surrounded mainly by forestry and agricultural activities. Located close to the broad Qinzhou Bay, Qinzhou has been rapidly urbanized and witnessed relatively small population fluctuations in recent decades []. The sanitary sewer systems were inadequate to cover municipal communities, and urban and rural effluents were drained into the QJR and MLR. The excess nutrients from intensified agriculture and municipal organic pollutants could be decomposed in inorganic nutrients and then input to Maowei Sea (MWS, the inner bay of QZB) through runoff []. In addition, there are many floating rafts on the MWS and sowing aquaculture for oysters and fish breeding in the bottom water body. The previous literature demonstrated that the dissolved inorganic nutrients transported from the MWS to the Qinzhou Harbor (the outside area of QZB) have been most pronounced [,,]. Lu et al. (2022) conducted the periodic samplings in the QJR and MLR sections, and seasonal surveys were independently conducted in MWS and Qinzhou Harbor []. They collected nutrient data from 11 surveys involved in the QJR estuary during 2011–2014, and concluded that most of the nutrient input to the bay were supplied by the adjoining rivers, and all nutrients had higher concentrations in the QJR than in the MWS (p < 0.01 for NO2-N and NO3-N, and p < 0.01 for NH4-N).
As to LZB, by performing secondary moving average processing of the daily average values of TN and TP concentrations at three estuary monitoring stations and the GX06 and GX07 stations at the mouth of LZB, the temporal characteristics of the moving average data at each station were compared (Figure S8). The TN and TP concentrations in the estuary entering the sea were significantly higher than that of the GX06 and GX07 stations in the coastal waters, which indicated that the land-based nutrients carried by the rivers entering the sea could inevitably contribute to the TN and TP concentration in the coastal waters. The temporal trend in the TN concentrations at the GX06 and GX07 stations in the coastal waters was basically consistent, which is also consistent with that at the three estuary stations, especially with obvious upward fluctuations in spring and summer. It is indicated that most of the TN input to the bay were supplied by river runoff. However, the temporal trend in TP concentrations of GX06 and GX07 showed no obvious consistency with that in the estuary entering the LZB, which is speculated to be probably due to the discharge of DIP-containing effluent from the industries around the Nanliu River mouth. (Tables S9 and S10) showed that the GX06 station’s TN concentrations were negatively correlated with the NY (p = −0.0225) and XMJ stations’ (p = −0.0683) TN concentrations, and positively correlated with the YB station’s TN concentrations (p = 0.1226). The daily average concentration of TN concentrations at station GX07 had a negative correlation with that at the NY station (p = −0.0449) and XMJ station (p = −0.1344), and a positive correlation with the YB station (p = 0.0258). Based on above analysis, the input of runoff from the NY station could make a significant negative contribution (p < 0.05) to the TN concentration in the coastal waters of LZB. It is also found that the input of runoff from the estuary could make a mainly positive contribution to the TP concentration in the coastal waters of LZB.
3.4. Accuracy of Water Quality Prediction Model
The model with the lowest MAPE was selected as the optimal model for each parameter of each site, and its error characteristics were given as shown in Table 2 (only GX01, GX02, to GX10; see Table S11) and Figure S9. It can be seen that the prediction accuracy of the optimal model for parameters at all of the studied monitoring stations could reach over 60%. Error rates of all of the ten types of models for WT and pH prediction are lower than 5%. The parameters with larger errors rates related to biological activities, especially for Chl-a and the next, is NH4-N, then NO3-N and NO2-N, and the final is DIP. Error rates of the optimal models for Chl-a prediction at the ten observation stations are 6.8~42.5% (average is 27.1%), while that of other models reach 7.8~96.5% (average is 42.5%). MAPE value of the optimal models for NH4-N, NO3-N, and NO2-N prediction are 12.2~39.3% (average is 25.2%), 11.9~35.2% (average is 23.4%), and 10.5~36.0% (average is 23.1%), while that of other models are 25.3~87.7% (average is 46.4%), 22.1~83.6% (average is 47.8%), and 17.3~72.7% (average is 39.3%). As for DIP prediction, error rates of the optimal models are between 32.7% and 20.9%, whose average is 20.9%, while that of other models are 5.6~47.6%, whose average is 28.3%. Among them, the predicted values of NO3-N and NH4-N have larger MAPE, but the MAE values are not larger, which may be caused by the lower true values.
Table 2.
The optimal prediction model and its error rate.
Among the total of the 164 most accurate models for predicting the water quality parameters at the ten monitoring stations, almost one third are linear models, which mainly appear in the prediction of five conventional parameters. For nutrient parameters, the prediction accuracy of the random forest model was better than that of the linear model. In addition, there are only 11 models including tidal data, which mainly occurs at the occasion of WS and pH prediction, meaning that the contribution of the tidal data might not be decisive for other parameter predictions.
4. Conclusions
In this study, we characterized the spatiotemporal change in the water quality in Beibu Gulf and initiated novel forecasting models to predict the pollution level of water in Beibu Gulf on the basis of 5-year (2018–2022) observation data of ten water quality parameters from ten selected sites. The results showed that the exceedance of water quality parameters, such as pH, DO, DIP, and DIN, mainly occurred at stations of GX01~GX03 in QZB and station GX09 in TSGB, and a high frequency of exceedance was observed particularly in summer and autumn, e.g., the exceeding rate of DIP at GX01, GX03, GX06, and GX07 station were 28.2~78.1% (average is 52.0%), 6.0~21.7% (average is 52.0%), 23.0~44.7% (average is 31.9%), and 5.2~33.4% (average is 21.2%), respectively. Results also demonstrate that the water quality parameters of GZAR’s coastal water show obvious seasonal trends between 2018 and 2022. The average values of Ch-a, DIN, and DIP at the ten stations were 3.86 μg/L, 0.15 mg/L, and 0.019 mg/L in spring and winter, respectively, and 4.49 μg/L, 0.19 mg/L, and 0.025 mg/L in summer and autumn, respectively. With regard to the spatial distribution, the pH, WS, and DO values of stations inside the bay (GX01 at QZB and GX09 at TSGB) were overall lower than those of corresponding stations at the mouth of the bay (GX02 at QZB) and stations outside the bay (GX03 and GX04 at QZB, GX08 and GX10 at TSGB). The average pH, WS, and DO values of station GX09 during the study period were 3.4%, 10.5%, and 13.0% lower than that of stations outside the bay, while the concentrations of Chl-a (except QZB) and nutrient salts showed a clearly opposite trend compared with the above concerned three parameters. For instance, at TSGB, the average Chl-a value of station GX09 was 22.5% higher than that of GX08 and GX10 between 2018 and 2022, and the averaged NO2-N, NO3-N, NH4-N, DIN, and DIP of GX09 were 121.9%, 75.3%, 417.3%, 144.3%, and 136.5% higher than those of GX08 and GX10 between 2021 and 2022. Correlation analysis among water quality factors in the coastal waters of QZB, LZB, and TSGB shows a significant positive correlation (r > 0.85) between concentrations of DIN and NO3-N, followed by NO2-N and NH4-N, indicating that the main component of DIN is NO3-N. A series of prediction models were initiated and trained for each water quality parameter of each automatic seawater quality monitoring station, and the modeling results showed that the result prediction accuracy of an optimal model could reach 60%. Error rates of all ten types of models for WT and pH prediction are lower than 5%. The parameters with larger errors rates related to biological activities, especially for Chl-a, and the next is NH4-N, then NO3-N and NO2-N, and the final is DIP, whose average error rates of the optimal models at the ten observation stations are 27.1%, 25.2%, 23.4%, 23.1%, and 20.9% respectively.
Results in this study may provide scientific support for GZAR’s marine environmental environment planning and protection. Predicting models on the basis of machine learning initiated in this study could be of great interest for local authorities and the tourism and fishing industries.
Supplementary Materials
The following supporting information can be downloaded at: https://www.mdpi.com/article/10.3390/w16162253/s1, Figure S1. Training set structure of hourly resolution prediction model; Figure S2. Training set structure of daily resolution prediction model; Figure S3. Exceedance rate of pH (a), DO (b), DIN (c) and DIP (d) of each monitoring station; Figure S4. The annual average exceedance rates of pH, DO, DIP and DIN of LZB against the Class II seawater quality standards from 2018 to 2022; Figure S5. The annual average exceedance rates of pH, DO, DIP and DIN of TSGB against the Class II seawater quality standards from 2018 to 2022; Figure S6. Temporal and spatial characteristics of pH, WS, WT and DO of QZB, LZB and TSGB from 2018 to 2022; Figure S7. Temporal and spatial characteristics of nutrient parameters of QZB, LZB and TSGB from 2018 to 2022; Figure S8. The temporal variation trends of the quadratic moving averaged daily TN and TP concentration at estuary and coastal waters monitoring stations of LZB. (a) TN, (b) TP; Figure S9. Comparisons of accuracy of water quality prediction models at studied coastal waters monitoring stations. (a) GX01, (b) GX02, (c) GX03, (d) GX04, (e) GX05, (f) GX06, (g) GX07, (h) GX08, (i) GX09, (j) GX10; Table S1. Average transmission rate of monitoring data; Table S2. Average accuracy of monitoring data; Table S3. Input data form of hourly water quality parameter forecasting; Table S4. Input data form of daily water quality parameter forecasting; Table S5. Model name and explanation; Table S6. Criteria of three types of water quality pollution issues by prediction model; Table S7. Correlation coefficient of daily average concentration of TN in estuary and coastal waters of QZB; Table S8. Correlation coefficient of daily average concentration of TP in estuary and coastal waters of QZB; Table S9. Correlation coefficient of daily average concentration of TN in estuary and coastal waters of LZB; Table S10. Correlation coefficient of daily average concentration of TP in estuary and coastal waters of LZB; Table S11. The optimal prediction model and its error rate of GX01 to GX10.
Author Contributions
Conceptualization, H.X. (Hao Xu) and J.C.; Methodology, Y.B., Z.X. and H.X. (Hao Xu); Software, Z.X., X.P., Z.C., H.X. (Hui Xu) and X.C.; Validation, X.P. and X.C.; Formal analysis, X.P., Y.D., Z.W. and X.C.; Investigation, Y.B., Z.X. and H.X. (Hui Xu); Resources, W.L. and Z.W.; Data curation, W.L., Y.D. and Z.C.; Writing—original draft, Y.B.; Writing—review & editing, Y.B., Z.X., W.L., H.X. (Hao Xu), H.X. (Hui Xu) and J.C.; Visualization, Y.D., Z.C. and Z.W.; Supervision, J.C.; Funding acquisition, W.L. All authors have read and agreed to the published version of the manuscript.
Funding
This work was supported by Key Research and Development Program of Guangxi Zhuang Autonomous Region (GUIKE AB22035065 and GUIKE AB22035035). We appreciate greatly the financial and data support. Any opinions, findings, and conclusions or recommendations included in this paper are those of the authors, and do not necessarily reflect the views of the supporters.
Data Availability Statement
Data are contained within the article.
Conflicts of Interest
Author Yucai Bai, Zhijian Wang and Xinglong Chen were employed by the company China Shipping Environment Technology (Shanghai) Co., Ltd. The remaining authors declare that the research was conducted in the absence of any commercial or financial relationships that could be construed as a potential conflict of interest.
Abbreviations
| (GZAR) | Guangxi Zhuang Autonomous Region |
| (ASEAN) | Association of Southeast Asian Nations |
| (ML) | Machine Learning |
| (RF) | Random Forest |
| (ANN) | Artificial Neural Networks |
| (BRT) | Boosted Regression Trees |
| (SVM) | Support Vector Machine |
| (GA) | Genetic Algorithms |
| (LRMT) | Logistic Regression and Model Trees |
| (TN) | Total Nitrogen |
| (TP) | Total Phosphorus |
| (QZB) | Qinzhou Bay |
| (LZB) | Lianzhou Bay |
| (TSGB) | Tieshangang Bay |
| (WT) | Water Temperature |
| (WS) | Water Salinity |
| (DO) | Dissolved Oxygen |
| (Chl-a) | Chlorophyll-a concentration |
| (NO3-N) | Nitrate |
| (NO2-N) | Nitrite |
| (NH4-N) | Ammonia |
| (DIN) | Dissolved Inorganic Nitrogen |
| (DIP) | Dissolved Inorganic Phosphate |
| (MLB) | Maoling Bridge |
| (QJE) | Qinjiang East |
| (EWB) | Expressway West Bridge |
| (NY) | Nanyu |
| (YB) | Ya Bridge |
| (XMJ) | Ximenjiang |
| (MAPE) | Mean Absolute Percentage Error |
| (MLR) | Maoling River |
| (QJR) | Qinjiang River |
| (MWS) | Maowei Sea |
References
- Liu, L.; Liu, R.; Ma, G.; Feng, S.; Mu, Y.; Meng, D.; Wang, S.; Cai, E. Online Monitoring of Seawater Carbon Dioxide Based on an Infrared Rear Beam Splitter. Sensors 2023, 23, 6273. [Google Scholar] [CrossRef] [PubMed]
- Chen, X.; Lao, Y.; Wang, J.; Du, J.; Liang, M.; Yang, B. Submarine Groundwater-Borne Nutrients in a Tropical Bay (Maowei Sea, China) and Their Impacts on the Oyster Aquaculture. Geochem. Geophys. Geosystems 2018, 19, 932–951. [Google Scholar] [CrossRef]
- Ward, N.D.; Megonigal, J.P.; Bond-Lamberty, B.; Bailey, V.L.; Butman, D.; Canuel, E.A.; Diefenderfer, H.; Ganju, N.K.; Goñi, M.A.; Graham, E.B.; et al. Representing the function and sensitivity of coastal interfaces in Earth system models. Nat. Commun. 2020, 11, 2458. [Google Scholar] [CrossRef]
- Schutte, C.A.; Ahmerkamp, S.; Wu, C.S.; Seidel, M.; de Beer, D.; Cook, P.L.M.; Joye, S.B. Chapter 12—Biogeochemical Dynamics of Coastal Tidal Flats. In Coastal Wetlands, 2nd ed.; Perillo, G.M.E., Wolanski, E., Cahoon, D.R., Hopkinson, C.S., Eds.; US EPA: Washington, DC, USA, 2019; pp. 407–440. [Google Scholar] [CrossRef]
- Mohseni, F.; Saba, F.; Mirmazloumi, S.M.; Amani, M.; Mokhtarzade, M.; Jamali, S.; Mahdavi, S. Ocean water quality monitoring using remote sensing techniques: A review. Mar. Environ. Res. 2022, 180, 105701. [Google Scholar] [CrossRef] [PubMed]
- Ding, W.; Zhang, C.; Shang, S. The early assessment of harmful algal bloom risk in the East China Sea. Mar. Pollut. Bull. 2022, 178, 113567. [Google Scholar] [CrossRef]
- Park, Y.; Cho, K.H.; Park, J.; Cha, S.M.; Kim, J.H. Development of early-warning protocol for predicting chlorophyll-a concentration using machine learning models in freshwater and estuarine reservoirs, Korea. Sci. Total. Environ. 2015, 502, 31–41. [Google Scholar] [CrossRef]
- Deng, T.; Chau, K.; Duan, H. Machine learning based marine water quality prediction for coastal hydro-environment management. J. Environ. Manag. 2021, 284, 112051. [Google Scholar] [CrossRef]
- Yu, R.; Lü, S.; Liang, Y. Harmful Algal Blooms in the Coastal Waters of China. In Global Ecology and Oceanography of Harmful Algal Blooms, Ecological Studies; Glibert, P.M., Berdalet, E., Burford, M.A., Pitcher, G.C., Zhou, M., Eds.; Springer: Berlin, Germany, 2018; pp. 309–316. [Google Scholar] [CrossRef]
- Deng, T.; Duan, H.; Keramat, A. Spatiotemporal characterization and forecasting of coastal water quality in the semi-enclosed Tolo Harbour based on machine learning and EKC analysis. Eng. Appl. Comput. Fluid Mech. 2022, 16, 694–712. [Google Scholar] [CrossRef]
- Qiao, Y.; Feng, J.; Cui, S.; Zhu, L. Long-term changes in nutrients, chlorophyll a and their relationships in a semi-enclosed eutrophic ecosystem, Bohai Bay, China. Mar. Pollut. Bull. 2017, 117, 222–228. [Google Scholar] [CrossRef]
- EPA (Environmental Protection Agency of United States). Climate Change and Harmful Algal Blooms. 2016. Available online: https://www.epa.gov/habs/climate-change-and-freshwater-harmful-algal-blooms (accessed on 9 April 2024).
- Nwankwegu, A.S.; Li, Y.; Huang, Y.; Wei, J.; Norgbey, E.; Sarpong, L.; Lai, Q.; Wang, K. Harmful algal blooms under changing climate and constantly increasing anthropogenic actions: The review of management implications. 3 Biotech 2019, 9, 449. [Google Scholar] [CrossRef]
- Zohdi, E.; Abbaspour, M. Harmful algal blooms (red tide): A review of causes, impacts and approaches to monitoring and prediction. Int. J. Environ. Sci. Technol. 2019, 16, 1789–1806. [Google Scholar] [CrossRef]
- Griffith, A.W.; Gobler, C.J. Harmful algal blooms: A climate change co-stressor in marine and freshwater ecosystems. Harmful Algae 2019, 91, 101590. [Google Scholar] [CrossRef] [PubMed]
- Young, N.; Sharpe, R.A.; Barciela, R.; Nichols, G.; Davidson, K.; Berdalet, E.; Fleming, L.E. Marine harmful algal blooms and human health: A systematic scoping review. Harmful Algae 2020, 98, 101901. [Google Scholar] [CrossRef] [PubMed]
- Heil, C.A.; Muni-Morgan, A.L. Florida’s Harmful Algal Bloom (HAB) Problem: Escalating Risks to Human, Environmental and Economic Health with Climate Change. Front. Ecol. Evol. 2021, 9, 646080. [Google Scholar] [CrossRef]
- Yu, Z.; Yang, K.; Luo, Y.; Shang, C. Spatial-temporal process simulation and prediction of chlorophyll-a concentration in Dianchi Lake based on wavelet analysis and long-short term memory network. J. Hydrol. 2020, 582, 124488. [Google Scholar] [CrossRef]
- Han, Y.; Wei, F.; Ye, G.; Yang, S.; Ma, P.; Hu, W. A study on evaluation the marine carrying capacity in Guangxi Province, China. Mar. Policy 2018, 91, 66–74. [Google Scholar] [CrossRef]
- Wang, C.; Lin, A.; Liu, C. Marine ecological security assessment from the perspective of emergency ecological footprint. Front. Mar. Sci. 2023, 9, 1090965. [Google Scholar] [CrossRef]
- Rajaee, T.; Khani, S.; Ravansalar, M. Artificial intelligence-based single and hybrid models for prediction of water quality in rivers: A review. Chemom. Intell. Lab. Syst. 2020, 200, 103978. [Google Scholar] [CrossRef]
- Alizadeh, M.J.; Kavianpour, M.R.; Danesh, M.; Adolf, J.; Shamshirband, S.; Chau, K. Effect of river flow on the quality of estuarine and coastal waters using machine learning models. Eng. Appl. Comput. Fluid Mech. 2018, 12, 810–823. [Google Scholar] [CrossRef]
- Sakizadeh, M. Artificial intelligence for the prediction of water quality index in groundwater systems. Model. Earth Syst. Environ. 2015, 2, 8. [Google Scholar] [CrossRef]
- Xu, J.; Xu, Z.; Kuang, J.; Lin, C.; Xiao, L.; Huang, X.; Zhang, Y. An Alternative to Laboratory Testing: Random Forest-Based Water Quality Prediction Framework for Inland and Nearshore Water Bodies. Water 2021, 13, 3262. [Google Scholar] [CrossRef]
- Bhavsar, P.; Safro, I.; Bouaynaya, N.; Polikar, R.; Dera, D. Chapter 12—Machine Learning in Transportation Data Analytics. Data Analytics for Intelligent Transportation Systems; Elsevier: Amsterdam, The Netherlands, 2017; pp. 283–307. [Google Scholar] [CrossRef]
- Segura, A.M.; Piccini, C.; Nogueira, L.; Alcántara, I.; Calliari, D.; Kruk, C. Increased sampled volume improves Microcystis aeruginosa complex (MAC) colonies detection and prediction using Random Forests. Ecol. Indic. 2017, 79, 347–354. [Google Scholar] [CrossRef]
- Mamun, M.; Kim, J.; Alam, M.A.; An, K.G. Prediction of Algal Chlorophyll-a and Water Clarity in Monsoon-Region Reservoir Using Machine Learning Approaches. Water 2019, 12, 30. [Google Scholar] [CrossRef]
- Alnahit, A.O.; Mishra, A.K.; Khan, A.A. Stream water quality prediction using boosted regression tree and random forest models. Stoch. Environ. Res. Risk Assess. 2022, 36, 2661–2680. [Google Scholar] [CrossRef]
- Tian, W.; Liao, Z.; Zhang, J. An optimization of artificial neural network model for predicting chlorophyll dynamics. Ecol. Model. 2017, 364, 42–52. [Google Scholar] [CrossRef]
- Szomolányi, O.; Clement, A. Use of random forest for assessing the effect of water quality parameters on the biological status of surface waters. Int. J. Geomath. 2023, 14, 20. [Google Scholar] [CrossRef]
- Shin, Y.; Kim, T.; Hong, S.; Lee, S.; Lee, E.; Hong, S.; Lee, C.; Kim, T.; Park, M.S.; Park, J.; et al. Prediction of Chlorophyll-a Concentrations in the Nakdong River Using Machine Learning Methods. Water 2020, 12, 1822. [Google Scholar] [CrossRef]
- Chen, K.; Chen, H.; Zhou, C.; Huang, Y.; Qi, X.; Shen, R.; Liu, F.; Zuo, M.; Zou, X.; Wang, J.; et al. Comparative analysis of surface water quality prediction performance and identification of key water parameters using different machine learning models based on big data. Water Res. 2020, 171, 115454. [Google Scholar] [CrossRef] [PubMed]
- Nasir, N.; Kansal, A.; Alshaltone, O.; Barneih, F.; Sameer, M.; Shanableh, A.; Al-Shamma’a, A. Water quality classification using machine learning algorithms. J. Water Process Eng. 2022, 48, 102920. [Google Scholar] [CrossRef]
- Zhu, Z.; Wei, H.; Guan, Y.; Zhang, L.; Sun, P.; Zhang, Q. Spatial and seasonal characteristics of dissolved heavy metals in the seawater of Beibu Gulf, the Northern South China Sea. Front. Mar. Sci. 2022, 9, 996202. [Google Scholar] [CrossRef]
- Lu, J.; Zhang, Y.; Shi, H.; Lv, X. Spatio-temporal changes and driving forces of reclamation based on remote sensing: A case study of the Guangxi Beibu Gulf. Front. Mar. Sci. 2023, 10, 1112487. [Google Scholar] [CrossRef]
- Sun, X.; Zhang, L.; Lu, S.Y.; Tan, X.; Chen, K.; Zhao, S.; Huang, R. A new model for evaluating sustainable utilization of coastline integrating economic output and ecological impact: A case study of coastal areas in Beibu Gulf, China. J. Clean. Prod. 2020, 271, 122423. [Google Scholar] [CrossRef]
- Lyu, H.; Song, D.; Zhang, S.; Wu, W.; Bao, X. Compound effect of land reclamation and land-based pollutant input on water quality in Qinzhou Bay, China. Sci. Total Environ. 2022, 826, 154183. [Google Scholar] [CrossRef]
- Cai, S.; Lao, Q.; Jin, G.; Chen, C.; Zhou, X.; Zhu, Q.; Lu, X. Sources of nitrate in a heavily nitrogen pollution bay in Beibu Gulf, as identified using stable isotopes. Front. Mar. Sci. 2022, 9, 956474. [Google Scholar] [CrossRef]
- Breiman, L. Random Forests. Mach. Learn. 2001, 45, 5–32. [Google Scholar] [CrossRef]
- Sattari, M.T.; Falsafian, K.; Irvem, A.; Shahab, S.; Qasem, S.N. Potential of kernel and tree-based machine-learning models for estimating missing data of rainfall. Eng. Appl. Comput. Fluid Mech. 2020, 14, 1078–1094. [Google Scholar] [CrossRef]
- Fang, X.; Li, X.; Zhang, Y.; Zhao, Y.; Qian, J.; Hao, C.; Zhou, J.; Wu, Y. Random forest-based understanding and predicting of the impacts of anthropogenic nutrient inputs on the water quality of a tropical lagoon. Environ. Res. Lett. 2021, 16, 055003. [Google Scholar] [CrossRef]
- Zeng, Q.; Liu, Y.; Zhao, H.; Sun, M.; Li, X. Comparison of models for predicting the changes in phytoplankton community composition in the receiving water system of an inter-basin water transfer project. Environ. Pollut. 2017, 223, 676–684. [Google Scholar] [CrossRef]
- Cho, H.; Choi, U.; Park, H. Deep Learning Application to Time Series Prediction of Daily Chlorophyll-a Concentration. WIT Trans. Ecol. Environ. 2018, 215, 157–163. [Google Scholar]
- GB 3097-1997; Sea Water Quality Standard. Ministry of Ecology and Environment of People’s Republic of China: Beijing, China, 1998.
- Guo, C.; Zhang, G.; Sun, J.; Leng, X.; Xu, W.; Wu, C.; Li, X.; Pujari, L. Seasonal responses of nutrient to hydrology and biology in the southern Yellow Sea. Cont. Shelf Res. 2020, 206, 104207. [Google Scholar] [CrossRef]
- Ding, X.; Guo, X.; Gao, H.; Gao, J.; Shi, J.; Yu, X.; Wu, Z. Seasonal variations of nutrient concentrations and their ratios in the central Bohai Sea. Sci. Total Environ. 2021, 799, 149416. [Google Scholar] [CrossRef] [PubMed]
- Wang, C.; Lu, Y.; Sun, B.; Zhang, M.; Wang, C.; Xiu, C.; Johnson, A.C.; Wang, P. Ecological and human health risks of antibiotics in marine species through mass transfer from sea to land in a coastal area: A case study in Qinzhou Bay, the South China sea. Environ. Pollut. 2023, 316, 120502. [Google Scholar] [CrossRef] [PubMed]
- Lu, D.; Zhang, D.; Zhu, W.; Felix, D.S.; Yang, B.; Kang, Z.; Yu, K. Sources and long-term variation characteristics of dissolved nutrients in Maowei Sea, Beibu Gulf, China. J. Hydrol. 2022, 615, 128576. [Google Scholar] [CrossRef]
- Al-Mutairi, N.; Abahussain, A.; El-Battay, A. Spatial and temporal characterizations of water quality in Kuwait Bay. Mar. Pollut. Bull. 2014, 83, 127–131. [Google Scholar] [CrossRef] [PubMed]
- Ferreira, J.G.; Saurel, C.; Lencart e Silva, J.D.; Nunes, J.P.; Vazquez, F. Modelling of interactions between inshore and offshore aquaculture. Aquaculture 2014, 426–427, 154–164. [Google Scholar] [CrossRef]
- Lai, J.; Jiang, F.; Ke, K.; Xu, M.; Lei, F.; Chen, B. Nutrients distribution and trophic status assessment in the northern Beibu Gulf, China. Chin. J. Ocean. Limnol. 2014, 32, 1128–1144. [Google Scholar] [CrossRef]
- Liang, D.; Huang, X.; Yang, B.; Dan, S.; Kang, Z.; Zhou, J.; Lao, Y.; Zhong, Q.; Wu, H. Composition and Distributions of Nitrogen and Phosphorus and Assessment of Eutrophication Status in the Maowei Sea. J. Ocean. Univ. China (Ocean. Coast. Sea Res.) 2021, 20, 361–371. [Google Scholar] [CrossRef]
- Lao, Q.; Liu, G.; Shen, Y.; Su, Q.; Lei, X. Biogeochemical processes and eutrophication status of nutrients in the northern Beibu Gulf, South China. J. Earth Syst. Sci. 2021, 130, 199. [Google Scholar] [CrossRef]
Disclaimer/Publisher’s Note: The statements, opinions and data contained in all publications are solely those of the individual author(s) and contributor(s) and not of MDPI and/or the editor(s). MDPI and/or the editor(s) disclaim responsibility for any injury to people or property resulting from any ideas, methods, instructions or products referred to in the content. |
© 2024 by the authors. Licensee MDPI, Basel, Switzerland. This article is an open access article distributed under the terms and conditions of the Creative Commons Attribution (CC BY) license (https://creativecommons.org/licenses/by/4.0/).